degradation of dye-containing textile effluents by ... · degradation of dye-containing textile...
TRANSCRIPT

Degradation of dye-containing textile effluents by enzymatic catalysis
Raquel Oliveira Cristóvão
Graduated in Chemical Engineering by Faculty of Engineering, University of Porto
Dissertation presented for the degree of Doctor in Chemical and Biological Engineering by University of Porto
Supervisors: Maria Eugénia Rebello de Almeida Macedo, PhD
José Miguel Loureiro, PhD Rui Alfredo da Rocha Boaventura, PhD
Laboratory of Separation and Reaction Engineering Chemical Engineering Department
Faculty of Engineering, University of Porto Portugal
Porto, 2010


iii
Acknowledgments
The execution of this PhD thesis was not possible without the intervention of several
people who greatly contributed during these four years, each in its own way.
First of all, I would like to thank my supervisors, Prof. Maria Eugénia Macedo, Prof. José
Miguel Loureiro and Prof. Rui Boaventura, for making possible the implementation of this work,
for giving me all the necessary conditions for this purpose, for sharing with me their knowledge
and experience, for believing in me and for all the support and friendship given over these
years.
I would like to express my special thanks to Ana Paula Tavares for following closely all
the work with me, for all the support she gave me, for all the problems that we solved together,
for the sharing of the achievements and the lesser good parts of the research. For all that, I am
sure that in addition to a great colleague, I won a good friend. Thanks for everything.
A word of gratitude also goes to the entities that made this work possible: to Fundação
para a Ciência e a Tecnologia (FCT) for my PhD Scholarship (SFRH/BD/28529/2006), to the
financial support through the project CAPES 4.1.3/CAPES/CPLP, giving me the chance to do
research studies at Universidade Federal do Rio de Janeiro (UFRJ) and to Faculdade de
Engenharia da Universidade do Porto (FEUP), particularly to Laboratory of Separation and
Reaction Engineering (LSRE) for providing all that was necessary for the execution of this work.
I also wish to thank Novozymes (Denmark) for laccase from Aspergillus and DyStar
(Porto, Portugal) for reactive dyes and chemical auxiliaries.
My gratitude goes also to several people who help me in different parts of the
experimental work: to Adriano Ribeiro who helped with the initial part of the modeling work, to
Liliana, Ana Isabel and Carmen for their support in the environmental analysis, to José Gamelas
for helping with the voltammetry studies at Universidade de Aveiro and finally to Ana Iraidy and
Cristina Rocha in studies of enzyme immobilization.
In general, I am greateful to everyone from Universidade Federal do Rio de Janeiro, for
their hospitality, for making me feel at home, for sharing with me their knowledge and for
helping me at technical level. Special thanks to Prof. Fernando Pessoa and Priscilla Amaral
who guided me in the supercritical work and who received me very well in a country that I did
not know. A special word of gratitude goes also for Prof. Maria Alice Coelho, who helped me
unconditionally in finding a place for me to stay, which helped me to have the necessary
conditions to perform the work and guided me during my stay at Rio de Janeiro. Thanks also to
the true friends I made there, that never left me alone and never hesitated to help me whenever
I needed.
To all the colleagues and friends that worked at same time with me in the laboratory and
in cabinet, thank you for the good environment created and for the fellowship.

iv
Thanks to all my friends that, being closer or farther away, heard me and gave me
advice over the years, making me keep the confidence and motivation necessary to advance.
Thank you for your friendship.
I would also like to deeply thank my closest family, my mother and my father, for being
exactly as they are that I am so proud of, for so many things, despite the distance between us:
their unconditional support and love, for listening to me at all times, for all the words of love and
comfort they gave me and made me gain courage to overcome all the barriers that appeared.
Last, but, certainly not least, I would like to express my most sincere thanks and
gratitude to Tozé, for his love, his words, for believing in me, for all his patience and for helping
me and accompanying me at all times. For all this, and much more, nothing would be possible
without you. Thank you for always being there.

v
Abstract
The use of biotechnological processes in textile dye effluents treatment has attracted
considerable attention and achieved interesting results in recent years. These effluents are
moderately toxic but conventional treatments are not able to accomplish new environmental
regulations. Legislation about toxic and hazardous substances in industrial wastewaters is
becoming increasingly strict; consequently a large number of researchers are addressing a
variety of issues in this area. New technologies must be developed and adapted to achieve
such low limits of effluent discharge toxicity. Enzymes of the oxidase type, particularly laccases
are now used as an alternative to the conventional effluent treatments.
In this work the degradation potential of enzyme laccase against several reactive textile
dyes, that are difficult to decolourize and often found in real textile wastewaters, was assessed.
For this purpose, a pure laccase (DeniLite II Base) and a commercial formulation (DeniLite II S)
containing the laccase, a mediator and a non-ionic surfactant were employed.
The dye degradation of six reactive dyes typically used in textile industry (reactive black
5, reactive blue 114, reactive yellow 15, reactive yellow 176, reactive red 239 and reactive red
180) was optimized using pure laccase. In this context five traditional laccase mediators,
temperature, pH and mediator concentrations were tested to evaluate the decolourization by
laccase mediator system.
The efficiency of the commercial laccase formulation in dyes degradation was also
evaluated and optimized by the application of a three-level Box-Behnken factorial design with
three factors (pH, temperature and enzyme concentration) combined with response surface
methodology. Mathematical models were developed for each dye, showing the effect of each
factor and their interactions on colour removal.
The results have shown that the efficiency of the laccase mediator system depends on
the type of the dye. To better understand the mechanisms of reactive dyes oxidation with
laccase and the correlation between the redox potential and dye degradation, cyclic
voltammetry was carried out. A linear correlation between the percentage of decolourization and
the respective anodic peak potential was verified. Sequential decolourization of dyes by laccase
mediator system was also studied, showing that this method may be applied for the effective
treatment of effluents from textile dyeing industries, since seven repetitive decolourization
cycles were successfully performed.
The treatability of a mixture of three reactive textile dyes (reactive black 5, reactive
yellow 15 and reactive red 239) and of a simulated real effluent with the three reactive dyes,
salts and auxiliary chemicals by commercial laccase was evaluated. The decolourizations were
efficient, demonstrating also the capability of producing an effluent with parameter values below
the legal discharge limits if carried out with immobilized laccase.

vi
Concerning the kinetics in batch reactor, several models based on Michaelis-Menten
equation were developed to simulate the laccase (commercial formulation) catalyzed
degradation of a single reactive dye or a mixture of dyes in aqueous solution and of a simulated
textile effluent. The close correlation between the experimental data and the simulated values
indicates that the proposed models are able to describe with remarkable accuracy the kinetic
behaviour of the reactions and that they could be used for design and simulation applications.
The treatability of the reactive dyes by immobilized commercial laccase into coconut
fiber (adsorption mechanism) was also studied. The effect of the immobilization conditions on
the properties of laccase and the characterization of the immobilized enzyme were achieved,
showing its suitability for continuous colour removal from textile industrial effluents.
Finally, a new possibility for the degradation of dyes in supercritical carbon dioxide
media catalyzed by commercial laccase as a greener and clean technology was investigated
and optimized by response surface methodology. However, and despite the advantages of
using supercritical carbon dioxide, the results show that this is not the best technique for this
process.
In summary, it was shown that the laccase mediator system was an efficient method for
the decolourization of the more difficult to degrade dyes (reactive type dyes). Compared to the
common and sometimes expensive physical and/or chemical ways for industrial textile effluent
remediation, the biodegradation by the use of commercial laccase appears to be an attractive
alternative for larger scale applications.
Keywords: Reactive textile dyes, laccase, mediators, decolourization, biocatalysis,
optimization, kinetic modelling, textile effluent, enzyme immobilization.

vii
Resumo
Nos últimos anos, o uso de processos biotecnológicos tem atraído considerável
atenção e tem conseguido resultados interessantes no tratamento de corantes de efluentes
têxteis. Estes efluentes são moderadamente tóxicos e os tratamentos convencionais não são
capazes de acompanhar as novas normas ambientais. A legislação relativa à presença de
substâncias tóxicas e perigosas em águas residuais industriais tem-se tornado cada vez mais
rigorosa e, consequentemente, um grande número de investigadores tem-se interessado mais
sobre os vários problemas desta temática. Para atingir esses limites de toxicidades de
descarga dos efluentes é necessário desenvolver ou adaptar novas tecnologias. As enzimas do
tipo oxidase, particularmente as lacases, têm sido usadas como uma alternativa aos
tratamentos convencionais dos efluentes.
Neste trabalho foi avaliado o potencial de degradação da enzima lacase em relação a
vários corantes têxteis reactivos, difíceis de degradar e frequentemente presentes em efluentes
têxteis reais. Para tal, usou-se a enzima lacase pura (DeniLite II Base) e uma formulação
comercial contendo a lacase, um mediador e um tensioactivo não-iónico (DeniLite II S).
Numa primeira etapa, efectuou-se a optimização da degradação de seis corantes
reactivos normalmente usados na indústria têxtil (reactive black 5, reactive blue 114, reactive
yellow 15, reactive yellow 176, reactive red 239 e reactive red 180) com a lacase pura. Para
este efeito foram testados cinco mediadores tradicionais da lacase, a temperatura, o pH e a
concentração do mediador, de forma a avaliar a descoloração pelo sistema lacase mediador.
Foi também avaliada e optimizada a eficiência da formulação comercial da lacase na
degradação destes corantes mas agora com a aplicação de um modelo factorial Box-Behnken
com três níveis e três factores (pH, temperatura e concentração de enzima), combinado com a
metodologia de superfície de resposta. Foram desenvolvidos modelos matemáticos para cada
um dos corantes, de forma a mostrar o efeito de cada factor e das suas interacções na
remoção de cor.
Os resultados demonstraram que a eficiência do sistema lacase mediador depende do
tipo de corante. Assim, utilizou-se a voltametria cíclica para melhor elucidar os mecanismos de
oxidação dos corantes reactivos pela enzima lacase e a correlação existente entre o potencial
redox e a degradação dos corantes. Foi verificada uma correlação linear entre a percentagem
de descoloração dos corantes e o respectivo potencial do pico anódico. Investigou-se também
a descoloração sequencial dos corantes pelo sistema lacase mediador, tendo-se verificado que
este método pode ser aplicado para o tratamento eficaz dos efluentes das indústrias têxteis,
uma vez que foram realizados com sucesso sete ciclos repetitivos de descoloração.
A degradação de uma mistura de três corantes têxteis reactivos (reactive black 5,
reactive yellow 15 e reactive red 239) pela formulação comercial da laccase e de um efluente
real simulado com os mesmos três corantes reactivos, sais e substâncias auxiliares químicas

viii
foi também avaliada. As degradações foram bastante eficientes, demonstrando também a
capacidade de se produzir um efluente com parâmetros abaixo dos valores limite legais de
descarga, caso se efectue o tratamento com a lacase imobilizada.
Quanto à cinética de reacções em reactor fechado, foram desenvolvidos vários
modelos baseados na equação de Michaelis-Menten para simular a degradação dos corantes
reactivos em estudo pela enzima lacase (formulação comercial) quando separados, numa
mistura e num efluente têxtil simulado. A concordância verificada entre os dados experimentais
e os valores simulados indica que os modelos propostos são capazes de descrever com
elevado rigor o comportamento cinético das reacções e que poderiam ser utilizados em
trabalhos de projecto e de simulação.
Foi também avaliado o tratamento dos corantes reactivos pela lacase comercial
imobilizada por adsorção em fibra de coco. Estudou-se o efeito das condições de imobilização
sobre as propriedades da lacase e realizou-se a caracterização da enzima imobilizada,
demonstrando a sua aptidão para a remoção contínua da cor de efluentes industriais têxteis.
Finalmente, foi investigada e optimizada, através da metodologia de superfície de
resposta, uma nova possibilidade para a degradação de corantes catalisada pela lacase
comercial em dióxido de carbono supercrítico, como uma tecnologia limpa e ecológica. No
entanto, apesar do uso de dióxido de carbono supercrítico apresentar muitas vantagens, os
resultados indicam que esta não é a melhor técnica a usar para este processo.
Resumindo, todo este trabalho mostrou que o sistema lacase mediador é um método
eficiente para a descoloração dos corantes mais difíceis de degradar (corantes do tipo
reactivo). Em comparação com os métodos tradicionais e por vezes caros, físicos e químicos
para a remediação de efluentes têxteis industriais, a biodegradação com o uso da enzima
lacase comercial mostrou ser uma alternativa atraente para aplicações em maior escala.
Palavras-Chave: Corantes têxteis reactivos, lacase, mediadores, descoloração, biocatálise,
optimização, modelação cinética, efluentes têxteis, imobilização de enzimas.

ix
Table of Contents
Acknowledgments ......................................................................................................................... iii
Abstract ......................................................................................................................................... v
Resumo ........................................................................................................................................ vii
Table of Contents .......................................................................................................................... ix
List of Figures .............................................................................................................................. xiii
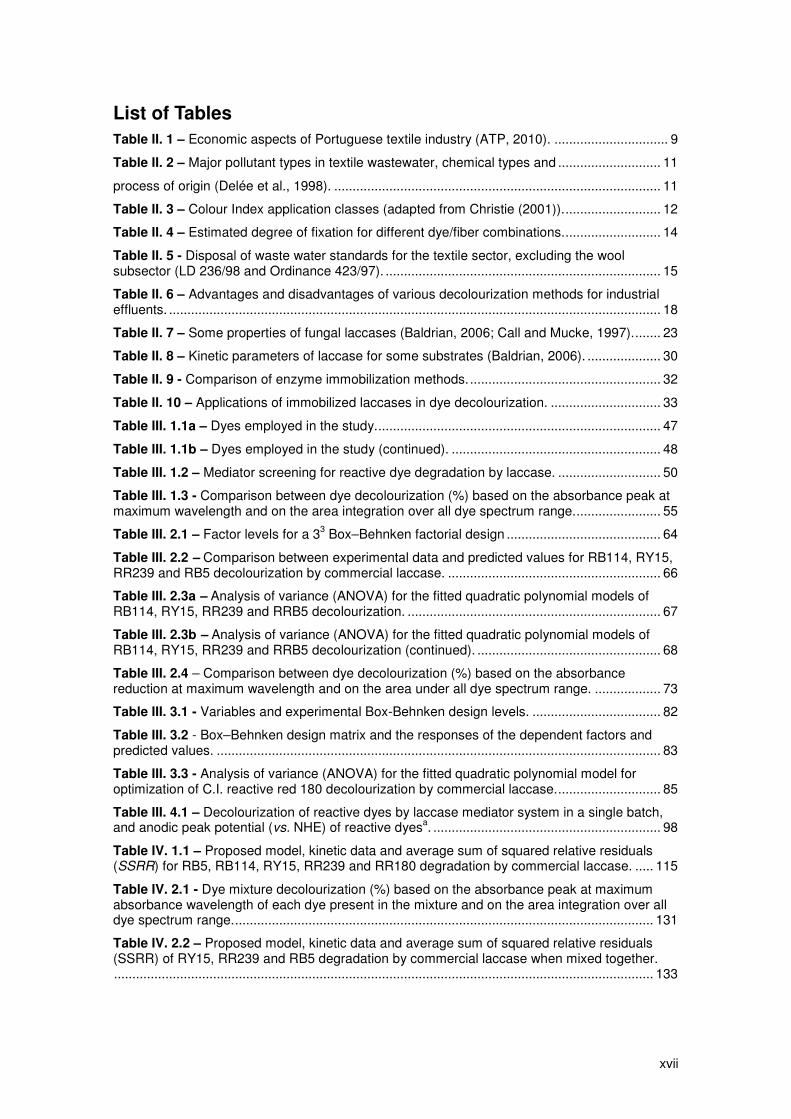
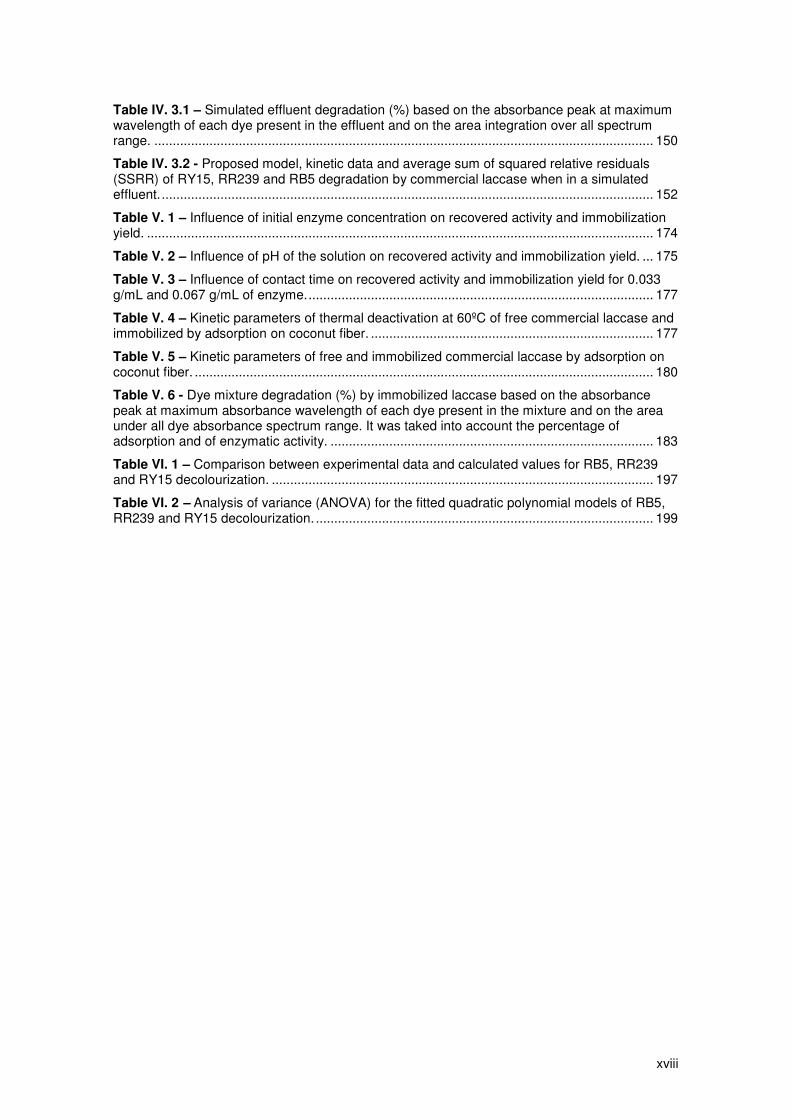
List of Tables .............................................................................................................................. xvii
Part I – Thesis Outline ................................................................................................................... 1
Part II – General Introduction ........................................................................................................ 7
II. 1 Textile industry ................................................................................................................... 9
II. 2 Textile industry effluents .................................................................................................... 9
II. 2.1 General characteristics ................................................................................................ 9
II. 2.2 Dyes .......................................................................................................................... 11
II. 2.3 Standards and legislation .......................................................................................... 14
II. 3 Dye removal techniques .................................................................................................. 16
II. 3.1 Physical methods ...................................................................................................... 16
II. 3.2 Chemical methods ..................................................................................................... 16
II. 3.3 Biological methods .................................................................................................... 17
II. 4 Enzymes in wastewater treatment ................................................................................... 19
II. 4. 1 Lignin peroxidase (LiP, EC 1.11.1.14) ..................................................................... 20
II. 4.2 Manganese peroxidase (MnP, EC 1.11.1.13) ........................................................... 20
II. 4.3 Laccases (EC 1.10.3.2) ............................................................................................. 20
II. 5 References ....................................................................................................................... 33
Part III – Optimization of Decolourization Equilibrium and Cyclic Voltammetry .......................... 39
III. 1 Optimization of reactive textile dyes degradation by laccase-mediator system ............. 45
III. 1.1 Abstract .................................................................................................................... 45
III. 1. 2 Introduction .............................................................................................................. 45
III. 1. 3 Materials and Methods ............................................................................................ 47
III. 1.4 Results and Discussion ............................................................................................ 49
III. 1.5 Conclusions .............................................................................................................. 55
III. 1.6 References ............................................................................................................... 55
III. 2 Application of statistical experimental methodology to optimize reactive dye
decolourization by commercial laccase .................................................................................. 61
III. 2.1 Abstract .................................................................................................................... 61
III. 2.2 Introduction ............................................................................................................... 61
III. 2.3 Materials and Methods ............................................................................................. 62
III. 2.4 Results and discussion ............................................................................................. 64
III. 2.5 Conclusions .............................................................................................................. 75
III. 2.6 References ............................................................................................................... 75
III. 3 Optimization of reactive dye degradation by laccase using box-behnken design .......... 79

x
III. 3.1 Abstract .................................................................................................................... 79
III. 3.2 Introduction ............................................................................................................... 79
III. 3.3 Materials and Methods ............................................................................................. 80
III. 3.4 Results and Discussion ............................................................................................ 82
III. 3.5 Conclusions .............................................................................................................. 88
III. 3.6 References ............................................................................................................... 88
III. 4 Sequential decolourization of reactive textile dyes by laccase mediator system ........... 93
III. 4.1 Abstract .................................................................................................................... 93
III. 4.2 Introduction ............................................................................................................... 93
III. 4.3 Materials and Methods ............................................................................................. 95
III. 4.4 Results and Discussion ............................................................................................ 96
III. 4.5 Conclusions ............................................................................................................ 101
III. 4.6 References ............................................................................................................. 101
Part IV – Kinetic Modelling and Simulation ............................................................................... 103
IV. 1 Kinetic modelling and simulation of laccase catalyzed degradation of reactive textile
dyes ....................................................................................................................................... 109
IV. 1.1 Abstract .................................................................................................................. 109
IV. 1.2 Introduction ............................................................................................................ 109
IV. 1.3 Materials and Methods ........................................................................................... 110
IV. 1.4 Kinetic modelling: optimization and simulation ...................................................... 112
IV. 1.5 Results and discussion ......................................................................................... 114
IV. 1.6 Conclusions........................................................................................................... 120
IV. 1.7 References ............................................................................................................. 120
IV. 2 Modelling the decolourization of a mixture of reactive textile dyes by commercial
laccase .................................................................................................................................. 125
IV. 2.1 Abstract .................................................................................................................. 125
IV. 2.2 Introduction ............................................................................................................ 125
IV. 2.3 Materials and Methods ........................................................................................... 127
IV 2.4 Kinetic modelling: optimization and simulation ....................................................... 128
IV. 2.5 Results and Discussion .......................................................................................... 130
IV. 2.6 Conclusions............................................................................................................ 138
IV. 2.7 References ............................................................................................................. 139
IV. 3 Treatment and kinetic modelling of a simulated dye house effluent by enzymatic
catalysis ................................................................................................................................ 143
IV. 3.1 Abstract .................................................................................................................. 143
IV. 3.2 Introduction ............................................................................................................ 143
IV. 3.3 Materials and Methods ........................................................................................... 144
IV. 3.4 Kinetic modelling: optimization and simulation ...................................................... 146
IV. 3.5 Analytical methods ................................................................................................. 148
IV. 3.6 Results and Discussion .......................................................................................... 149

xi
IV. 3.7 Conclusions............................................................................................................ 157
IV. 3.8 References ............................................................................................................. 158
Part V - Immobilization .............................................................................................................. 161
V Immobilization of commercial laccase onto green coconut fiber by adsorption and its
application for reactive textile dyes degradation ................................................................... 167
V. 1 Abstract ...................................................................................................................... 167
V. 2 Introduction ................................................................................................................ 167
V. 3 Materials and Methods ............................................................................................... 169
V. 4 Results and Discussion .............................................................................................. 173
V. 5 Conclusions ................................................................................................................ 183
V. 6 References ................................................................................................................. 184
Part VI – Supercritical Carbon Dioxide Media ........................................................................... 187
VI Optimization of laccase catalyzed degradation of reactive textile dyes in supercritical
carbon dioxide media by response surface methodology .................................................... 193
VI. 1 Abstract ..................................................................................................................... 193
VI. 2 Introduction ............................................................................................................... 193
VI. 3 Materials and Methods .............................................................................................. 195
VI. 4 Results and Discussion ............................................................................................. 197
VI. 5 Conclusions............................................................................................................... 203
VI. 6 References ................................................................................................................ 204
Part VII – Conclusions and Future Work ................................................................................... 207
VII. 1 Conclusions ................................................................................................................. 209
VII. 2 Future Work ................................................................................................................. 211
Appendices ................................................................................................................................ 213
Appendix A – Dyes Safety Data Sheets ............................................................................... 215
A1 – Remazol Black B ....................................................................................................... 215
A2 – Remazol Yellow GR .................................................................................................. 216
A3 – Remazol Yellow 3RS ................................................................................................ 217
A4 – Remazol Brilliant Red 3BS ........................................................................................ 218
A5 – Remazol Brilliant Red F3B ........................................................................................ 219
A6 – Levafix Brilliant Blue E-BRA ...................................................................................... 220
Appendix B – Enzymes Data Sheets .................................................................................... 221
B1 – DeniLite II Base ......................................................................................................... 221
B2 – DeniLite II S............................................................................................................... 222
Appendix C – Mediators Safety Data sheets ........................................................................ 223
C1 – ABTS ......................................................................................................................... 223
C2 – HBT ........................................................................................................................... 223
C3 – VA ............................................................................................................................. 223
C4 – TEMPO ..................................................................................................................... 224
Appendix D – Textile processing auxiliaries ......................................................................... 225

xii
D1 – Sera Lube M-CF ....................................................................................................... 225
D2 – Sera Quest M-PP ...................................................................................................... 225
D3 – Sera Wet C-AS ......................................................................................................... 226

xiii
List of Figures
Figure II. 1 – Stages of a textile industry. ................................................................................... 10
Figure II. 2 – The most important chromophores. ...................................................................... 12
Figure II. 3 - A typical laccase reaction with a diphenol. ............................................................ 21
Figure II. 4 – Model of the catalytic cluster of the laccase from Trametes versicolor made of four copper atoms (Riva, 2006). ......................................................................................................... 22
Figure II. 5 – Diagram of Trametes versicolor laccase. The arrangement of the structure of the three domains is depicted in different colours coding (D1–D3). Copper ions are drawn as blue spheres. Carbohydrates and disulfide bonds are included as stick models (Piontek et al., 2002). ..................................................................................................................................................... 22
Figure II. 6 – Proposed catalytic cycle of laccase showing the mechanism for reduction and oxidation of the copper sites (Solomon et al., 1996). .................................................................. 23
Figure II. 7 – Oxidation of phenolic-azo dyes by laccases (Chivukula and Renganathan, 1995) . ..................................................................................................................................................... 26
Figure II. 8 - Catalytic cycle of a laccase-mediator oxidation system (Riva, 2006). ................... 27
Figure II. 9 – Examples of laccase mediators: (a) 3-Hydroxyanthranilic acid (HAA); (b): 2,2’-azino-bis-(3-ethylbenzothiazoline-6-sulphonic acid) (ABTS); (c) N-hydroxybenzotriazole (HBT); (d) N-hydroxyphtaimide (HPI); (e) violuric acid (VLA); (f) N-hydroxyacetanilide (NHA); (g) methyl ester of 4-hydroxy-3,5-dimethoxy-benzoic acid (syringic acid); (h) 2,2,6,6-tetramethylpiperidine-1-yloxy (TEMPO) (Riva, 2006). ................................................................................................... 28
Figure II. 10 – Enzymatic kinetics. .............................................................................................. 29
Figure III. 1.1 – Representation of dye degradation by laccase mediator system. .................... 46
Figure III. 1.2 – Initial solutions of each dye (RY176, RY15, RR239, RR180, RB114 and RB5). ..................................................................................................................................................... 48
Figure III. 1.3 – Effect of temperature on the decolourization of the reactive dyes: Blue 114 (♦), Black 5 (××××), Red 239 (■), Red 180 (�), Yellow 15 (�) by laccase mediator system. ................ 51
Figure III. 1.4 – Effect of pH on the decolourization of the reactive dyes: Blue 114 (♦), Black 5 (××××), Red 239 (■), Yellow 15 (�) by laccase mediator system..................................................... 52
Figure III. 1.5 – Visible absorption spectrum of RB5, RY15, RB114 and RR239 decolourization by laccase mediator system at different ABTS concentrations: (a) initial dye solution; (b) 0.001 mM; (c) 0.01 mM; (d) 0.075 mM; (e) 0.15 mM; (f) 0.2mM; (g) 0.3 mM. ...................................... 53
Figure III. 1.6 – Reactive blue 114 solutions after treatment with increasing ABTS concentrations (from left to the right). ......................................................................................... 53
Figure III. 1.7 – Initial and treated solutions of reactive blue 114 with 0.001 mM ABTS. ........... 54
Figure III. 2.1 – Response surface plots for decolourization of RY15 as a function of: (a) pH and temperature at 96 U/L; (b) enzyme concentration and temperature at pH 5.0; (c) pH and enzyme concentration at 35 ºC. .................................................................................................. 69
Figure III. 2.2 – Response surface plots for decolourization of RB114 as function of: (a) pH and temperature at 96 U/L; (b) pH and enzyme concentration at 35 ºC. ........................................... 70
Figure III. 2.3 – Response surface plots for decolourization of RR239 as function of: (a) pH and temperature at 96 U/L enzyme concentration; (b) pH and enzyme concentration at 35 ºC. ...... 71
Figure III. 2.4 – Response surface plots for decolourization of RB5 as a function of: (a) pH and temperature at 96 U/L; (b) enzyme concentration and temperature at pH 5.0; (c) pH and enzyme concentration at 35 ºC. .................................................................................................. 72
Figure III. 2.5 – Response surface plots for decolourization of RB114 based on the area under all dye spectrum range as function of: (a) pH and temperature at 96 U/L enzyme concentration; (b) enzyme concentration and temperature at pH 5.0; (c) pH and enzyme concentration at 35 ºC. ................................................................................................................................................ 74

xiv
Figure III. 3.1 - Representation of dye degradation by laccase mediator system. ..................... 80
Figure III. 3.2 - Chemical structure of C.I. reactive red 180. ...................................................... 81
Figure III. 3.3 - Pareto chart of standardized effects for 33 Box–Behnken factorial design. (1) Temperature; (2) pH; (3) enzyme concentration. ........................................................................ 84
Figure III. 3.4 - Response surface plots of the C.I. reactive red 180 decolourization by commercial laccase: (a) effect of temperature (x1) vs. pH (x2) at 55.4 U/L; (b) effect of enzyme concentration (x3) vs. pH (x2) at 35 ºC; (c) effect of temperature (x1) vs. enzyme concentration (x3) at pH 7.0. .............................................................................................................................. 86
Figure III. 3.5 - Absorption spectra of RR180 before and after decolourization by commercial laccase. Optimum decolourization conditions obtained by RSM. ............................................... 87
Figure III. 4.1 - Sequencing batch decolourization of 50 mg/L solutions of RB114, RY15, RB5 and RR239 by laccase (0.2 U/mL) from Trametes villosa in the presence of mediators (0.2 mM): violuric acid () and 1-hydroxybenzotriazole (---) at pH 5.0 and T=40 ºC. ................................ 97
Figure III. 4.2 - Cyclic voltammograms (v = 50 mV/s) of the reactive dyes (1 g/L) in a 0.2 M acetate buffer solution at pH = 4.5. ............................................................................................. 99
Figure III. 4.3 - Correlation between the oxidation peak potential and decolourization (%) of reactive dyes (50 mg/L) after 10 minutes of reaction with laccase (0.2 U/mL) from Trametes villosa. .......................................................................................................................................... 99
Figure III. 4.4 – Initial and treated solutions of RY15, RR239, RB114 and RB5, showing the decolourizations achieved. ........................................................................................................ 100
Figure IV. 1.1 - Colour formed by the enzyme solution over time. ........................................... 111
Figure IV. 1.2 - Comparison of experimental (× run 1; o run 2) and simulated (continuous line) time courses of RB5 degradation by commercial laccase under different dye initial concentrations: (a) 116.0 mg/L and 115.8 mg/L; (b) 99.5 mg/L and 99.3 mg/L; (c) 88.5 mg/L and 85.8 mg/L; (d) 78.9 mg/L and 76.0 mg/L; (e) 49.9 mg/L and 51.5 mg/L. .................................. 117
Figure IV. 1.3 – Comparison of experimental (× run 1; o run 2) and simulated (continuous line) time courses of RB114 degradation by commercial laccase under different dye initial concentrations: (a) 118.4 mg/L and 117.8 mg/L; (b) 93.2 mg/L and 96.2 mg/L; (c) 74.6 mg/L and 74.1 mg/L; (d) 50.3 mg/L and 50.4 mg/L; (e) 27.6 mg/L and 27.3 mg/L. .................................. 117
Figure IV. 1.4– Comparison of experimental (× run 1; o run 2) and simulated (continuous line) time courses of RY15 degradation by commercial laccase under different dye initial concentrations: (a) 116.8 mg/L and 116.9 mg/L; (b) 95.9 mg/L and 97.4 mg/L; (c) 75.3 mg/L and 76.1 mg/L; (d) 47.7 mg/L and 49.1 mg/L; (e) 25.3 mg/L and 25.6 mg/L. .................................. 118
Figure IV. 1.5 – (1) Comparison of experimental (× run 1; o run 2) and simulated (continuous line) time courses of RR239 degradation by commercial laccase under different dye initial concentrations: (a) 123.0 mg/L and 122.2 mg/L; (b) 73.7 mg/L and 72.8 mg/L; (c) 24.3 mg/L and 24.0 mg/L. (2) Scale amplification of (1). .................................................................................. 118
Figure IV. 1.6 – (1) Comparison of experimental (× run 1; o run 2) and simulated (continuous line) time courses of RR180 degradation by commercial laccase under different dye initial concentrations: (a) 116.3 mg/L and 115.8 mg/L; (b) 69.9 mg/L and 69.8 mg/L; (c) 23.4 mg/L and 23.0 mg/L. (2) Scale amplification of (1). .................................................................................. 119
Figure IV. 2.1 - Absorption spectrum of dye mixture before (a) and after (b) decolourization by commercial laccase at 125 mg/L. .............................................................................................. 131
Figure IV. 2.2 – Comparison of experimental (× run 1; o run 2) and simulated (continuous line) time courses of RY15 degradation in a mixture of three dyes by commercial laccase under different dye initial concentrations: (a) 127.7 mg/L and 126.9 mg/L; (b) 101.1 mg/L and 99.5 mg/L; (c) 75.4 mg/L and 75.9 mg/L; (d) 48.2 mg/L and 49.8 mg/L. .......................................... 133
Figure IV. 2.3 – Comparison of experimental (× run 1; o run 2) and simulated (continuous line) time courses of RR239 degradation in a mixture of three dyes by commercial laccase under different dye initial concentrations: (a) 125.1 mg/L and 126.3 mg/L; (b) 100.5 mg/L and 99.1

xv
mg/L; (c) 78.0 mg/L and 78.20 mg/L; (d) 50.0 mg/L and 50.4 mg/L. (2) Scale amplification of (1). ................................................................................................................................................... 134
Figure IV. 2.4 - Comparison of experimental (× run 1; o run 2) and simulated (continuous line) time courses of RB5 degradation in a mixture of three dyes by commercial laccase under different dye initial concentrations: (a) 130.3 mg/L and 126.2 mg/L; (b) 105.5 mg/L and 101.9 mg/L; (c) 88.9 mg/L and 87.1 mg/L; (d) 75.5 mg/L and 76.8 mg/L; (e) 50.6 mg/L and 50.3 mg/L. ................................................................................................................................................... 134
Figure IV. 2.5 - Absorption spectrum of singles dyes (RY15 (–), RR239 (–), RB5 (–)) and of the dyes mixture (–) before degradation by commercial laccase. ................................................... 136
Figure IV. 2.6 – Simulation of the mixture degradation with commercial laccase at the maximum wavelength of RB5 (�) with the kinetic model of the single dye degradation (continuous line). ................................................................................................................................................... 137
Figure IV. 2.7 – Simulation of the mixture degradation with commercial laccase at the maximum wavelength of RR239 (�) and of RY15 (�) with the kinetic models of the singles dye degradation (continuous lines). ................................................................................................. 138
Figure IV. 3.1 - Comparison of experimental (x, run 1; o run 2) and simulated (continuous line) time courses of RY15 degradation in a simulated effluent by commercial laccase under different initial concentrations: (a) 120.5 mg/L and 124.7 mg/L; (b) 94.7 mg/L and 94.8 mg/L; (c) 86.8 mg/L and 85.4 mg/L; (d) 74.6 mg/L and 75.5 mg/L; (e) 51.4 mg/L and 51.5 mg/L. .................. 152
Figure IV. 3.2 - Comparison of experimental (x, run 1; o run 2) and simulated (continuous line) time courses of RR239 degradation in a simulated effluent by commercial laccase under different initial concentrations: (a) 122.2 mg/L and 124.9 mg/L; (b) 101.3 mg/L and 101.1 mg/L; (c) 88.1 mg/L and 87.8 mg/L; (d) 78.3 mg/L and 77.4 mg/L; (e) 53.0 mg/L and 53.6 mg/L. ..... 153
Figure IV. 3.3 - Comparison of experimental (x, run 1; o run 2) and simulated (continuous line) time courses of RB5 degradation in a simulated effluent by commercial laccase under different initial concentrations: (a) 126.2 mg/L and 128.1 mg/L; (b) 102.2 mg/L and 103.6 mg/L; (c) 89.3 mg/L and 90.0 mg/L; (d) 79.9 mg/L and 80.2 mg/L; (e) 52.5 mg/L and 52.7 mg/L. .................. 153
Figure IV. 3.4 - Comparison of experimental (x, run 1; o run 2) and simulated (continuous line) time courses by a new kinetic model with a static initial period of RB5 degradation in a simulated effluent by commercial laccase under different initial concentrations: (a) 126.2 mg/L and 128.1 mg/L; (b) 102.2 mg/L and 103.6 mg/L; (c) 89.3 mg/L and 90.0 mg/L; (d) 79.9 mg/L and 80.2 mg/L; (e) 52.5 mg/L and 52.7 mg/L ............................................................................ 155
Figure V. 1 – Rotational shaker with syringes. ......................................................................... 170
Figure V. 2 – Initial dyes solutions and the coconut fiber. ........................................................ 172
Figure V. 3 – Influence of initial enzyme concentration on the activity of the immobilized commercial laccase on coconut fiber by adsorption at pH 7.0 and 3h30min. of contact time. . 173
Figure V. 4 – Effect of pH of the solution a) on initial commercial laccase activity and b) on the activity of the immobilized commercial laccase on coconut fiber by adsorption at 0.067 g/mL of enzyme and 3h30min. of contact time. ..................................................................................... 175
Figure V. 5 – Effect of contact time on the activity of the immobilized commercial laccase on coconut fiber by adsorption at pH 7.0 and at ● 0.033 g/mL and ■ 0.067 g/mL of enzyme. ...... 176
Figure V. 6 – Thermal stability of (●) free and (♦) immobilized commercial laccase obtained by adsorption at 60 ºC. ................................................................................................................... 178
Figure V. 7 – Operational stability of commercial laccase immobilized on coconut fiber by adsorption. ................................................................................................................................. 179
Figure V. 8 – Initial reaction rates for different concentrations of ABTS a) with free and b) with immobilized commercial laccase on coconut fiber. The solid line represents the fit of Michaelis-Menten model to experimental data. ......................................................................................... 181
Figure V. 9 – Degradation of RB5, RB114, RR180, RR239, RY176 and RY15 in a batch reactor by commercial laccase immobilized on coconut fiber for three cycles of reaction. ................... 181

xvi
Figure VI. 1 – Pareto chart of standardized effects for 22 Box-Behnken factorial design for (a) RB5, (b) RR239 and (c) RY15 degradation. (1) pressure; (2) temperature. ............................. 198
Figure VI. 2 – Observed vs predicted values in the degradation of (a) RB5, (b) RR239 and (c) RY15 in supercritical carbon dioxide. + observed; − predicted. ................................................ 200
Figure VI. 3 - Response surface plot for decolourization of (a) RB5 (b) RR239 and (c) RY15 in supercritical carbon dioxide as a function of pressure and temperature................................... 202
xvii
List of Tables
Table II. 1 – Economic aspects of Portuguese textile industry (ATP, 2010). ............................... 9
Table II. 2 – Major pollutant types in textile wastewater, chemical types and ............................ 11
process of origin (Delée et al., 1998). ......................................................................................... 11
Table II. 3 – Colour Index application classes (adapted from Christie (2001)). .......................... 12
Table II. 4 – Estimated degree of fixation for different dye/fiber combinations. .......................... 14
Table II. 5 - Disposal of waste water standards for the textile sector, excluding the wool subsector (LD 236/98 and Ordinance 423/97). ........................................................................... 15
Table II. 6 – Advantages and disadvantages of various decolourization methods for industrial effluents. ...................................................................................................................................... 18
Table II. 7 – Some properties of fungal laccases (Baldrian, 2006; Call and Mucke, 1997). ....... 23
Table II. 8 – Kinetic parameters of laccase for some substrates (Baldrian, 2006). .................... 30
Table II. 9 - Comparison of enzyme immobilization methods. .................................................... 32
Table II. 10 – Applications of immobilized laccases in dye decolourization. .............................. 33
Table III. 1.1a – Dyes employed in the study. ............................................................................. 47
Table III. 1.1b – Dyes employed in the study (continued). ......................................................... 48
Table III. 1.2 – Mediator screening for reactive dye degradation by laccase. ............................ 50
Table III. 1.3 - Comparison between dye decolourization (%) based on the absorbance peak at maximum wavelength and on the area integration over all dye spectrum range. ....................... 55
Table III. 2.1 – Factor levels for a 33 Box–Behnken factorial design .......................................... 64
Table III. 2.2 – Comparison between experimental data and predicted values for RB114, RY15, RR239 and RB5 decolourization by commercial laccase. .......................................................... 66
Table III. 2.3a – Analysis of variance (ANOVA) for the fitted quadratic polynomial models of RB114, RY15, RR239 and RRB5 decolourization. ..................................................................... 67
Table III. 2.3b – Analysis of variance (ANOVA) for the fitted quadratic polynomial models of RB114, RY15, RR239 and RRB5 decolourization (continued). .................................................. 68
Table III. 2.4 – Comparison between dye decolourization (%) based on the absorbance reduction at maximum wavelength and on the area under all dye spectrum range. .................. 73
Table III. 3.1 - Variables and experimental Box-Behnken design levels. ................................... 82
Table III. 3.2 - Box–Behnken design matrix and the responses of the dependent factors and predicted values. ......................................................................................................................... 83
Table III. 3.3 - Analysis of variance (ANOVA) for the fitted quadratic polynomial model for optimization of C.I. reactive red 180 decolourization by commercial laccase. ............................ 85
Table III. 4.1 – Decolourization of reactive dyes by laccase mediator system in a single batch, and anodic peak potential (vs. NHE) of reactive dyesa. .............................................................. 98
Table IV. 1.1 – Proposed model, kinetic data and average sum of squared relative residuals (SSRR) for RB5, RB114, RY15, RR239 and RR180 degradation by commercial laccase. ..... 115
Table IV. 2.1 - Dye mixture decolourization (%) based on the absorbance peak at maximum absorbance wavelength of each dye present in the mixture and on the area integration over all dye spectrum range. .................................................................................................................. 131
Table IV. 2.2 – Proposed model, kinetic data and average sum of squared relative residuals (SSRR) of RY15, RR239 and RB5 degradation by commercial laccase when mixed together. ................................................................................................................................................... 133
xviii
Table IV. 3.1 – Simulated effluent degradation (%) based on the absorbance peak at maximum wavelength of each dye present in the effluent and on the area integration over all spectrum range. ........................................................................................................................................ 150
Table IV. 3.2 - Proposed model, kinetic data and average sum of squared relative residuals (SSRR) of RY15, RR239 and RB5 degradation by commercial laccase when in a simulated effluent. ...................................................................................................................................... 152
Table V. 1 – Influence of initial enzyme concentration on recovered activity and immobilization yield. .......................................................................................................................................... 174
Table V. 2 – Influence of pH of the solution on recovered activity and immobilization yield. ... 175
Table V. 3 – Influence of contact time on recovered activity and immobilization yield for 0.033 g/mL and 0.067 g/mL of enzyme. .............................................................................................. 177
Table V. 4 – Kinetic parameters of thermal deactivation at 60ºC of free commercial laccase and immobilized by adsorption on coconut fiber. ............................................................................. 177
Table V. 5 – Kinetic parameters of free and immobilized commercial laccase by adsorption on coconut fiber. ............................................................................................................................. 180
Table V. 6 - Dye mixture degradation (%) by immobilized laccase based on the absorbance peak at maximum absorbance wavelength of each dye present in the mixture and on the area under all dye absorbance spectrum range. It was taked into account the percentage of adsorption and of enzymatic activity. ........................................................................................ 183
Table VI. 1 – Comparison between experimental data and calculated values for RB5, RR239 and RY15 decolourization. ........................................................................................................ 197
Table VI. 2 – Analysis of variance (ANOVA) for the fitted quadratic polynomial models of RB5, RR239 and RY15 decolourization. ............................................................................................ 199

Part I
Thesis Outline


Part I – Thesis Outline
3
I – Thesis Outline
Textile industries release during the process large quantities of intensely coloured and
hazardous effluents, which cause serious environmental pollution. Rivers must preserve their
natural colour and the clarity of water. Even minor releases of coloured effluents (1 mg/L) may
cause irregular colouration of surface waters as well as the pollution of the water with toxic
compounds. Dyes change the absorption and reflection of sunlight on the water giving rise to
problems to photosynthetic aquatic plants and algae. Due to their large-scale production and
extensive application, synthetic dyes can cause considerable nonaesthetic pollution and are
serious health-risk factors. Furthermore, the effluents from textile industries contain a variety of
other compounds, such as dispersing agents, salts, emulsifiers and organometallic compounds
containing heavy metals.
Although the growing impact of environmental protection on industrial development
promotes eco-friendly technologies, reduced consumption of water and lower output of
wastewater, the discharge of effluents with synthetic dyes is very problematic. It is therefore
important to study how to meet the effluent discharge limits in legislation. The impact and
toxicity of dyes in the environment have been extensively studied. However, due to the large
variety of dyes used in industry, not all their properties are known, namely its mutagenicity and
carcinogenicity.
Due to their stability under sunlight and resistance to microbial attack, the majority of
dyes are not degraded by conventional treatments. The research of powerful and practical
treatments to decolourize and degrade dyeing wastewaters to decrease their environmental
impact has attracted an increasing interest. Traditional physico-chemical treatments applied to
the purification of dyeing wastewaters include adsorption with inorganic and organic supports,
coagulation, filtration, ion exchange, among others. These procedures lead to effective
decolourization, but their application is restricted due to some problems such as the formation of
sludge to be disposed or the need to regularly regenerate the adsorbent materials. More
powerful chemical methods such as ozonation and oxidation with hypochlorite ion, as well as
advanced oxidation processes such as Fenton’s reagent and photocatalytic systems involving
TiO2/UV, H2O2/UV and O3, also provide fast decolourization, along with degradation of dyes.
However, these methods are quite expensive and have operational problems. The application of
microorganisms to the biodegradation of synthetic dyes has been an attractive alternative. A
series of aerobic and anaerobic biological methods, including activated sludge, mixed cultures,
fungi, bacteria or algae have been studied for the dyes degradation. However, due to chemical
stability and resistance to microbial attack of several dyes, many of these methods are not
effective.
The decomposition of dyes by enzymes from various microorganisms has been also
studied. The textile wastewater treatment with enzymes from fungi can be simpler and more
efficient than the traditional treatments. The enzymes are highly selective and can effectively

Part I – Thesis Outline
4
treat the wastes. They are less likely to be inhibited by substances which may be toxic to living
organisms and can operate at mild conditions of temperature, pressure and pH.
Enzymes of the oxidase type, particularly ligninolytic enzymes (laccase, lignin
peroxidase and manganese peroxidase), have been used as an attractive technology for the
development of new methodologies of dye degradation from textile industries. Laccase (EC
1.10.3.2, p-benzenediol:oxygen oxidoreductase) is able to catalyze the oxidation of various
aromatic compounds (particularly phenols) with the concomitant reduction of oxygen to water.
According to the literature, it has been the preferred lignin-degrading enzyme for dye
decolourization most likely because the enzyme requires only oxygen as a co-substrate. The
relatively high optimal temperatures of the enzyme makes it ideal for industrial applications and
it should be more easily implemented into industrial processes. Thus, in this study, the enzyme
laccase was chosen for the decolourization of dyes. Specific compounds usually denominated
by mediators are under study to extend the number of dyes decolourized. In general, in order to
increase the potential use of enzymes, their immobilization is necessary for biochemical stability
and reuse. By using these immobilized forms, adequate characteristics including high
resistance to thermal denaturation, significant improvement of the enzymatic activity and its
preservation for long periods are obtained. An understanding of the mechanisms and kinetics of
enzyme systems is also essential for the design of efficient reactor systems to carry out
industrial processes.
Several review papers in the area of colour removal of textile effluents are available.
However, specifically in the case of reactive dyes little research has been conducted,
particularly in the field of mathematical modelling. Studying dye degradation kinetics by laccase
can give more insight on how it is affected by the composition of dye effluents and help to
predict the kinetic behaviour of the enzyme in industrial dye decolourization. The use of this
treatment method in real effluents has also not been fully explored. Studies published
continuously only evaluate the behaviour of synthetic wastewater under conditions different
from those observed in real effluents. Therefore, the exploit of this potential is also an important
goal of this research. Finally, in order to use this process on a continuous mode, in view of its
scale-up and considering the costs involved, it is important to think about the use of the enzyme
in the immobilized form.
Thus, this thesis aims to develop and optimize an enzymatic process to degrade
reactive dyes from textile effluents with free and immobilized laccase to implement in textile
industries. For this purpose, a systematic experimental and modelling working plan was carried
out.
1. The decolourization efficiency of six different synthetic reactive dye effluents in batch
reactions with laccase was evaluated;
2. The parameters that potentially affect the enzymatic batch reaction such as enzyme
concentration, temperature, pH and the addition of mediators were optimized; for this

Part I – Thesis Outline
5
pure laccase (DeniLite II Base) and in a commercial formulation (DeniLite II S)
containing the laccase, a mediator and a non-ionic surfactant were employed;
3. A kinetic model of enzyme-catalyzed dye transformation to assist in understanding of
the enzymatic process was developed;
4. The sequential decolourization of reactive dyes by laccase mediator system was
studied;
5. Cyclic voltammetry was used in order to obtain a correlation between the redox
potential and dye degradation;
6. The degradation in the optimal conditions of a simulated wastewater containing a
mixture of three dyes was evaluated. The kinetic modelling of this enzymatic reaction in
a batch reactor was also carried out;
7. The degradation of a synthetic dye house effluent, containing three reactive dyes, salts
and auxiliary chemicals, simulating a textile wastewater by commercial laccase was
examined in a batch reactor. Kinetic models to simulate the decolourization were
developed;
8. The water quality properties of the textile effluent, such as total organic carbon,
chemical oxygen demand, biochemical oxygen demand and toxicity were examined;
9. The reactive textile dyes degradation by immobilized laccase was optimized and the
immobilized enzyme reuse was evaluated;
10. The laccase catalyzed degradation of the reactive textile dyes in supercritical carbon
dioxide media was also considered and optimized.
The thesis is organised in seven parts. The first part of the thesis (part II) presents the
state of the art on textile industrial effluents, dyes, on current technologies for dye removal
(physical, chemical and biological methods), on the application of enzymes in wastewater
treatment and finally a more detailed review on laccase enzymes, their molecular and structural
properties, their use with mediators, their applications and immobilization.
Part III focuses the optimization of the reactive dyes degradation by enzyme laccase in
batch reactors. For that the factorial design methodology and the response surface
methodology are applied to some of the systems to evaluate the effect of pH, temperature and
enzyme concentration on the extent of the decolourization reaction equilibrium. The best work
conditions for laccase catalysis are established and the voltammetric measurements of the dyes
are used to predict the dye decolourization ability of commercial laccase.
Part IV investigates the kinetic features of the reactions. The kinetic modelling and
simulation of the decolourization of the reactive textile dyes, of a mixture of them and of a
simulated dye house effluent by commercial laccase are performed. The mathematical
modelling work is complemented with experimental work for the different project stages. The
environmental parameters of the simulated real effluent before and after enzyme treatment are
also evaluated.

Part I – Thesis Outline
6
In part V the immobilization of laccase by adsorption into coconut fiber and its
application to dye decolourization are investigated. Parameters such as the immobilization
efficiency, activity retention, operational and thermal stability are studied. The results suggest
that the immobilization technique is important for the control of the catalysis and for the
economy of the process.
In part VI, a new possibility for the degradation of dyes in supercritical carbon dioxide
media catalyzed by commercial laccase is investigated and optimized by response surface
methodology. A comparison with the results in aqueous media is made.
Finally in part VII, the findings of the previous parts are organized in the general
conclusions and suggestions for future work are given.
Part II
General Introduction


Part II – General Introduction
9
II. 1 Textile industry
The Textile and Clothing Manufacturing is one of the industries with the largest
representation in the Portuguese industrial structure and has always taken a prominent role in
terms of employment and weight in the national economy (Vasconcelos, 2006). The Textile
Industry (from preparation to finishing up the fiber) and the Clothing Industry (production)
account for 11 % of total Portuguese exports, 22 % of employment in manufacturing, 8 % of its
business volume and 7 % of its production (Associação Têxtil e Vestuário de Portugal (ATP,
2010)). Table II. 1 shows some of the values associated with the Portuguese textile industry
over the years.
Table II. 1 – Economic aspects of Portuguese textile industry (ATP, 2010).
2003 2004 2005 2006 2007 2008 2009
Production (million €) 7840 7890 6756 6749 6733 6164* 5704 Business volume
(million €) 8103 8145 6993 6931 6980 6349* 5357
Exports (million €) 4572 4319 4118 4113 4295 3985 3448
Imports (million €) 3048 2971 2993 3086 3329 3212 2889
Employment 222602 209768 201265 186837 180335 167712* 163415 * ATP estimates
Portugal has about 7 thousand companies labouring in all sub-sectors of textile and
clothing industries, some of which are vertical units, although they are mostly small and medium
sized companies, well known for their flexibility and quick response, know-how and innovation.
They are located mainly in Northern Portugal (Porto, Braga, Guimarães and Famalicão) but
some, dedicated to wool products, can be found in Covilhã (Eastern Portugal) (ATP, 2010). This
concentration is mainly due to historical reasons: preference for locations where the discharge
of effluents was easier, existence of skilled workers and also abundant low hardness water.
While the textile industry was growing it retained its attachment to the traditional sites.
II. 2 Textile industry effluents
II. 2.1 General characteristics
The textile industry includes a wide range of activities, from preparation of raw material
to pre-treatment, dyeing and finishing of textile material. All these activities consume water and
energy and are highly polluting. Textile industry processes are known to be intensive users of
water. In Figure II. 1 a process diagram of a textile industry is shown, highlighting the steps
where the water consumption and the generation of aqueous effluents occur (Braile and
Cavalcanti, 1993).

Part II – General Introduction
10
Figure II. 1 – Stages of a textile industry.
Due to the wide variety of fibers, dyes, process auxiliaries and final products, these
processes generate waters of great diversity and chemical complexity. This complex
composition is reflected in the colour, in a high ratio between chemical oxygen demand and
biochemical oxygen demand (COD/BOD5), in the presence of suspended matter and, possibly,
heavy metals, and in variable pH values, mostly in the alkaline range (Gonçalves et al., 1996).
However, since the fashions are always varying, the textile effluents composition is never
constant. Environmental problems related to the textile industry are numerous and well
documented. Despite the high volume of waste and its high organic load, the main problem of
textile industry effluents is related to the colour generated by unfixed dyes during textile
processing and directly released to the effluent.

Part II – General Introduction
11
The major pollutant types identified in textile wastewater are summarised in Table II. 2
along with their main origin in the textile manufacturing processes.
Table II. 2 – Major pollutant types in textile wastewater, chemical types and
process of origin (Delée et al., 1998).
Pollutants Major chemical types Main processes of
origin
Organic load
Starches, enzymes, fats, Desizing, Scouring,
greases, waxes, surfactants, Washing,
acetic acid Dyeing
Colour Dyes, scoured wool impurities Dyeing, Scouring
Nutrients (N,P)
Ammonium salts,
Dyeing urea, phosphate-based
buffers and sequestrants
Acids NaOH, mineral/organic Scouring, Desizing,
Alcalis acids, sodium chloride, silicate, Bleaching, Mercerizing,
and salts sulphate, carbonate Dyeing, Neutralization
Sulphur Sulphate, sulphite and hydrosulphite
Dyeing salts, sulphuric acid
Toxic compounds
Heavy metals, reducing agents Desizing,
(sulphide), oxidising agents (chlorite, Bleaching,
peroxide, dichromate, persulphate), Dyeing,
biocides, quaternary ammonium salts Finishing
Refractory Surfactants, dyes, resins, synthetic Scouring, Desizing,
organics sizes (PVA), chlorinated organic Bleaching, Dyeing,
compounds, carrier organic solvents Washing, Finishing
II. 2.2 Dyes
Ever since the beginning of times, people have demonstrated the need to add colour to
all that surrounds them. They use dyes from natural origins, such as soot, manganese oxide,
hematite and ochre for painting their stories in caves, their skins and their clothes. The textile
natural dyes were mainly obtained from plants, insects, fungi and lichens (Ingamells, 1993).
Mauveine, the first synthetic dye, was discovered in 1856 by William Henry Perkin.
Since then, thousands of new synthetic dyes have been produced. Nowadays, the total annual
world textile dye production is estimated at about 7x10⁵ tons, with more than 100,000 dyes
available on the market (Santhi et al., 2010). The largest consumer of these dyes is the textile
industry accounting for around two thirds of its market (Anjaneyulu et al., 2005).

Part II – General Introduction
12
To be coloured compounds, dyes have to absorb radiation in the visible range, i.e., 380
to 780 nm. This property is due to the possession of two different groups, the chromophore,
which is typically an electron withdrawing group and is responsible for the colour of the
compound, and the auxochrome, which is an electron donating substituent that can intensify the
colour of the chromophore and provides solubility and adherence of the dye to the fiber
(Christie, 2001).
Dyes can be divided in 20-30 different groups regarding their chromophores. The most
important are azo (monoazo, diazo, triazo, polyazo), anthraquinone, phthalocyanine and
triarylmethane dyes (Figure II. 2). Azo dyes represent about 70 % on weight basis of total
annual world production (dos Santos et al., 2003). These dyes are followed, in terms of
prevalence, by the anthraquinone dyes (dos Santos et al., 2005).
Figure II. 2 – The most important chromophores.
Dyes can be classified according to their colour, structure or method of application in
the Colour Index (C.I.). This system was developed by the “Society of Dyers and Colourists” and
the “American Association of Textile Chemists and Colourists” in 1925 and consists in assigning
a generic name for each dye, according to its colour and method of application, followed by a
number that specifies the chronological order or its commercial introduction (CII, 2010). Table II.
3 shows the 15 Colour Index different application classes.
Table II. 3 – Colour Index application classes (adapted from Christie (2001)).
Application class
Characteristics Substrates Common structures
Acid dyes Highly water soluble; form ionic interactions between the -NH3+ groups of fibers and the
negative charge of the dyes
Wool, polyamide, silk, nylon, leather
Azo, anthraquinone, triarylmethane
Reactive dyes Form covalent bonds with -OH, -NH or -SH groups
Cotton, wool, silk, nylon
Azo, metal complex azo,
anthraquinone, phthalocyanine
Direct dyes Their flat shape and length enables them to
maximize van-der-Waals, dipole and hydrogen bonds
Cellulose fibers, cotton, viscose, paper, leather,
nylon
Sulphonated azo dyes

Part II – General Introduction
13
Basic dyes Strong ionic interaction between dye
cationic groups and the negative charges in the copolymer
Synthetic fibers, paper, inks
Azo, diarylmethane, triarylmethane, anthraquinone
Mordant dyes Metal salts that act as “fixing agent” to improve the colour fastness
Wool, leather, silk, modified cellulose fibers
Azo, oxazine, triarylmethane
Disperse dyes Non-ionic structure, with polar functionality,
that improves water solubility, van-der-Waals and dipole forces and the colour.
Polyester, polyamide, acetate, acrylic, plastics
Azo, nitro, anthraquinone, metal complex
azo
Pigment dyes Insoluble, non-ionic compounds or salts that retain their crystalline or particulate
structure throughout their application
Paints, inks, plastics, textiles
Azo, metal complex
phthalocyanine
Vat dyes
Insoluble coloured dyes which on reduction dive soluble colourless forms /leuco form with affinity for the fiber; can be oxidized
back, with H2O2, to insoluble form
Cellulose fibers, cotton, viscose, wool
Anthraquinone, indigoid
Ingrain dyes Insoluble products of a reaction between a
coupling component and a diazotized aromatic amine that occurs in the fiber
Cotton, viscose, cellulose acetate,
polyester Tetra-azaporphin
Sulphur dyes Dyeing with sulphur dyes involves reduction and oxidation processes
Cellulose fibers, cotton, viscose
Complex polymeric aromatics
Solvent dyes Non ionic dyes that dissolve the substrate to which they bind
Plastics, varnish, ink, waxes, fats
Diazo, triarylmethane, anthraquinone, phthalocyanine
Other dye classes
Food dyes: not used as textile dyes, non-toxic; Natural dyes: use in textile
processing operations is very limited; Fluorescent brighteners: mask the
yellowish tint of natural fibers; Metal complex dyes: strong complexes of one
metal ion
Food, cotton, wool, silk, polyester, polyamide, soaps and detergents,
paints, plastics
Azo
Colour is the first contaminant to be recognized in wastewater. The presence of very
small amounts of dyes in water (less than 1 ppm for some dyes) is highly visible and affects not
only the aesthetic aspect and water transparency, but also the absorption and reflection of
sunlight, interfering with aquatic life in lakes, rivers and other waterbodies. In addition to their
visual effect and their adverse impact in terms of chemical oxygen demand, many synthetic
dyes are toxic, mutagenic and carcinogenic (Golka et al., 2004; Pointing, 2001).
All dyes used in the textile industry are synthesized to be chemically and photolytically
stable, i. e., to resist to the light, water, various chemicals, including oxidizing agents, and
microbial attack. Given that, during processing, a certain percentage of dyes used are taken
with water from the process and since they are difficult to bleach because of complex structure,
synthetic origin, and recalcitrant nature, their removal from industrial effluents before being
discharged into water systems is compulsory (Suteu et al., 2005).

Part II – General Introduction
14
The dye fixation on the fibers during the dyeing process is not total, leading to the dye
release. The degree of fixation depends on dye/fiber combinations and on the special
characterictics of the dyeing process. Consequently, according to Easton (1995) the fixation
rates of various dyes and their losses to the effluent can only be given as examples (Table II. 4).
Table II. 4 – Estimated degree of fixation for different dye/fiber combinations.
Dye class Fiber Degree of fixation (%) Loss to effluent (%)
Acid Polyamide 80-95 5-20
Basic Acrylic 95-100 0-5
Direct Cellulose 70-95 5-30
Disperse Polyester 90-100 0-10
Metal-complex Wool 90-98 2-10
Reactive Cellulose 50-90 10-50
Sulphur Cellulose 60-90 10-40
Vat Cellulose 80-95 5-20
The treatment of textile effluents is particularly important in the case of intensely
coloured wastewaters containing reactive dyes, since these dyes are those with a lower degree
of fixation to the fiber, they are less receptive to conventional treatments of effluents, such as
adsorption and aerobic biodegradation and, finally, belong to the most used class, as they are
used for dyeing cotton which is also the substrate that requires more water in its processing
(O'Neill et al., 1999). In this process, the dyeing occurs at alkaline pH (10-11) and high
temperatures (50-70 ºC), and the effluents are highly coloured, concentrated in salts and with a
high COD/BOD5 ratio (Allegre et al., 2006).
Concern about the environment has been led to an increasingly stringent legislation
relating to the discharge of textile effluents and, therefore, to the search of more effective
treatment methods for the removal of dyes from wastewaters in order to meet the established
limits.
II. 2.3 Standards and legislation
In the case of the Portuguese legislation, Law Decree No. 236/98 of August 1st defines
the emission limit values (ELVs) in the discharge of wastewater. In the specific case of industrial
textile units, excluding the sub-sector of wool, and regarding pH, BOD5, COD and colour, the
constant values of Ordinance No. 423/97 of June 25th are applied. Those emission standards
can be found in Table II. 5.
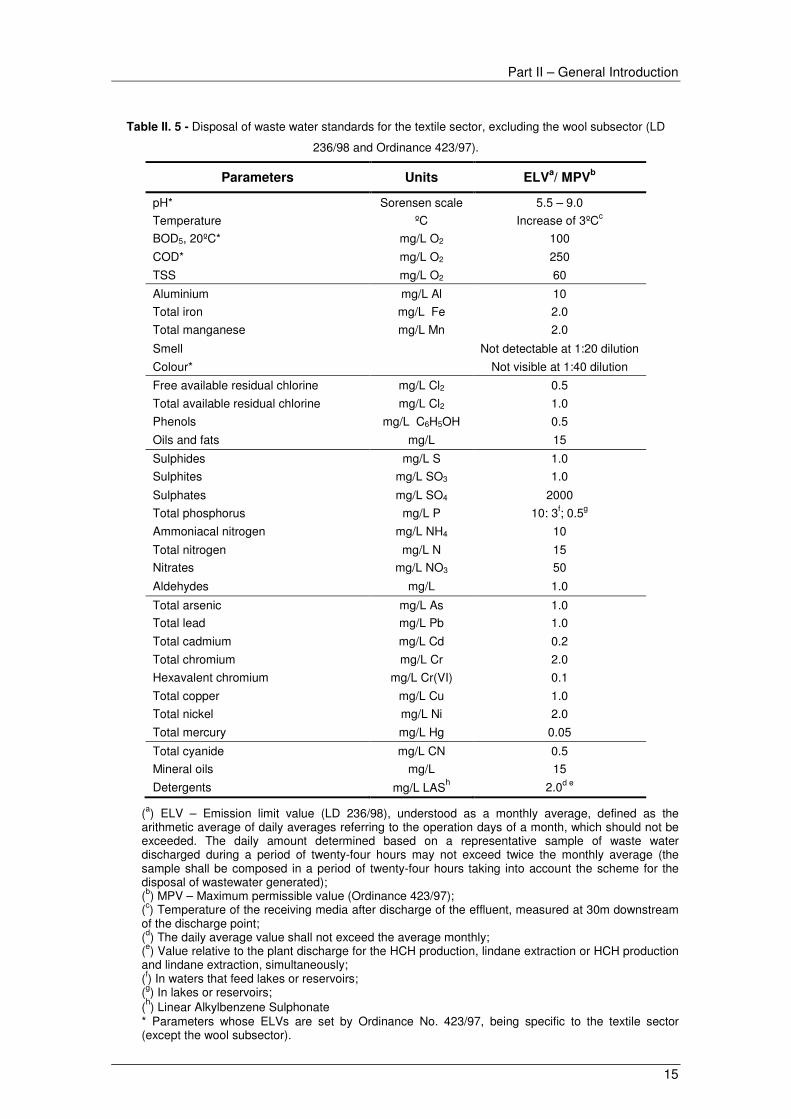
Part II – General Introduction
15
Table II. 5 - Disposal of waste water standards for the textile sector, excluding the wool subsector (LD
236/98 and Ordinance 423/97).
Parameters Units ELVa/ MPV
b
pH* Sorensen scale 5.5 – 9.0
Temperature ºC Increase of 3ºCc
BOD5, 20ºC* mg/L O2 100
COD* mg/L O2 250
TSS mg/L O2 60
Aluminium mg/L Al 10
Total iron mg/L Fe 2.0
Total manganese mg/L Mn 2.0
Smell Not detectable at 1:20 dilution
Colour* Not visible at 1:40 dilution
Free available residual chlorine mg/L Cl2 0.5
Total available residual chlorine mg/L Cl2 1.0
Phenols mg/L C6H5OH 0.5
Oils and fats mg/L 15
Sulphides mg/L S 1.0
Sulphites mg/L SO3 1.0
Sulphates mg/L SO4 2000
Total phosphorus mg/L P 10: 3f; 0.5g
Ammoniacal nitrogen mg/L NH4 10
Total nitrogen mg/L N 15
Nitrates mg/L NO3 50
Aldehydes mg/L 1.0
Total arsenic mg/L As 1.0
Total lead mg/L Pb 1.0
Total cadmium mg/L Cd 0.2
Total chromium mg/L Cr 2.0
Hexavalent chromium mg/L Cr(VI) 0.1
Total copper mg/L Cu 1.0
Total nickel mg/L Ni 2.0
Total mercury mg/L Hg 0.05
Total cyanide mg/L CN 0.5
Mineral oils mg/L 15
Detergents mg/L LASh 2.0d e
(a) ELV – Emission limit value (LD 236/98), understood as a monthly average, defined as the arithmetic average of daily averages referring to the operation days of a month, which should not be exceeded. The daily amount determined based on a representative sample of waste water discharged during a period of twenty-four hours may not exceed twice the monthly average (the sample shall be composed in a period of twenty-four hours taking into account the scheme for the disposal of wastewater generated); (b) MPV – Maximum permissible value (Ordinance 423/97); (c) Temperature of the receiving media after discharge of the effluent, measured at 30m downstream of the discharge point; (d) The daily average value shall not exceed the average monthly; (e) Value relative to the plant discharge for the HCH production, lindane extraction or HCH production and lindane extraction, simultaneously; (f) In waters that feed lakes or reservoirs; (g) In lakes or reservoirs; (h) Linear Alkylbenzene Sulphonate * Parameters whose ELVs are set by Ordinance No. 423/97, being specific to the textile sector (except the wool subsector).

Part II – General Introduction
16
II. 3 Dye removal techniques
Currently there are several methods that can be used in the removal of dyes from textile
industrial effluents. However, due to the variety of existent dyes and to the effluents complexity,
not all methods have the same efficiency and the combination of various methods may be
required, since each method has its limitations. Existing methods can be divided into three
categories: physical, chemical and biological.
II. 3.1 Physical methods
Within the physical methods, adsorption and ion exchange have been the most studied,
being effective methods for dyes removal, producing a high quality water, depending on the dye
in question (Choy et al., 1999). However, the most commonly used adsorbents such as
activated carbon, involve high costs, turning adsorption a less attractive process. Thus, low-cost
adsorbents have been developed and have demonstrated good efficiency in dyes removal
(Crini, 2006; Gupta and Suhas, 2009). Nevertheless, as a result of this treatment method the
pollutants are transferred to another phase, leading to the formation of solid waste that needs to
be further treated by another process.
Coagulation/flocculation method is also widely used in colour removal from textile
effluents. Since large amounts of inorganic coagulants, such as iron and aluminium salts, are
required to obtain good removals, causing the formation of large amounts of toxic sludge,
organic coagulants leading to relatively low production of sludge have been developed
(Zouboulis et al., 2004). However, this method has always high costs associated due to the
reagents involved.
The separation processes by membranes as nanofiltration and reverse osmosis have
been shown to be quite efficient methods for the removal of dyes from effluents. The
ultrafiltration and microfiltration are useful to separate the dyes from larger molecules present in
the effluents, since membranes have larger pores. However these processes have the
disadvantage of high costs of installation, maintenance and the replacement of membranes.
The fact that the membranes can be attacked by compounds present in effluents and the need
for further processing the concentrate retained also decrease the attractiveness of the process
(Vandevivere et al., 1998).
II. 3.2 Chemical methods
Partial or complete oxidation (mineralization) of dyes present in textile industry effluents
can also be achieved through advanced oxidation processes (AOPs) involving compounds with
a very strong oxidation potential, such as ozonation, Fenton's reagent, UV/H2O2 and UV/TiO2.
These reactions usually involve the production of OH radicals that can oxidize a wide range of

Part II – General Introduction
17
compounds, being effective in the decolourization of a wide range of dyes (Aplin and Waite,
2000). However, these processes also have some drawbacks: ozonation involves high costs
associated with the ozone generation, Fenton oxidation leads to the formation of large amounts
of sludge, UV/H2O2 besides being an expensive process, sometimes is not very effective, finally
UV/TiO2, despite being a cheaper and a more effective method, its efficiency depends on the
penetration ability of UV radiation in the highly coloured effluents (Gogate and Pandit, 2004;
Vandevivere et al., 1998).
Coloured effluents can also be chemically oxidized with chlorine or hypochlorite.
However, since toxic molecules such as aromatic amines are released during the process, the
usage of this method has been decreasing over time (Slokar and Le Marechal, 1998).
Electrolysis is also an effective method to dye decolourization and in the reduction of
BOD, COD, total organic carbon (TOC) and total suspended solids (TSS) (Alinsafi et al., 2005).
However it has some disadvantages associated with the high costs involved in the electrodes
replacement and with the high energy consumption during the process (Cerón-Riviera et al.,
2004).
II. 3.3 Biological methods
The use of biological methods to remove colour from textile effluents is usually a
cheaper alternative, since it presents no major processing costs. However this method presents
some disadvantages, since several dyes are designed to resist to microbial attack. Biological
methods involve the use of bacteria, fungi and algae.
Bacterial degradation has been mainly applied in the removal of azo dyes. However,
this biological method has been found ineffective in removing colour from several dyes. The azo
dyes generally resist to aerobic degradation. However its degradation was observed in
anaerobic conditions, but aromatic amines are formed as final product, which despite having no
colour, can be toxic, mutagenic or carcinogenic (Isik and Sponza, 2007).
Under these anaerobic conditions it is not possible to degrade the aromatic amines
formed, which in turn are only degraded in aerobic environment. Thus, to achieve a complete
degradation of azo dyes a method that combines anaerobic treatment of the dyes with the
mineralization of aromatic amines under aerobic conditions should be applied (Carvalho et al.,
2008; Lin et al., 2010).
Fungi can degrade textile dye effluents through its own action or by enzymes digestion
produced by them. Ligninolytic fungi are the most common in the treatment processes for textile
dyes, although some non-ligninolytic are also effective (Ambrósio and Campos-Takaki, 2004;
Wafaa et al., 2003). The decolourization of dyes by white rot fungi Phanerochaete
chrysosporium was first discovered by Glenn and Gold (1983). The more studied white rot fungi
in the degradation process are Phanerochaete chrysosporium, Trametes versicolor,
Bjerkandera adusta and Pleurotus ostreatus (Chander and Arora, 2007; Wesenberg et al.,

Part II – General Introduction
18
2003). The degradation achieved varies with each used species. Recently, new species for the
degradation of dyes have been studied (Asgher et al., 2009; Mendonça et al., 2008).
Some algae are known to be used in effective decolourization of dyes from textile
wastewaters (El-Sheekh et al., 2009; Omar, 2008). The azo bond reduction is the mechanism of
degradation followed by algae. Aromatic amines thus formed can be then totally mineralized
(Wang et al., 2007).
Table II. 6 summarizes the advantages and the disadvantages of the various treatment
methodologies for colour removal of industrial effluents (Allegre et al., 2006; Anjaneyulu et al.,
2005; Husain, 2006; Robinson et al., 2001).
Table II. 6 – Advantages and disadvantages of various decolourization methods for industrial effluents.
Treatment methodology
Advantages Disadvantages
Membrane filtration
Removes all dye types. Recovery and reuse of chemicals and water. Wider application for complex wastes.
Concentrated sludge production. Dissolved solids are not separated in this process. High running cost.
Coagulation/Flocculation Good removal efficiencies. Elimination of insoluble dyes.
Cost of coagulants and chemicals for pH adjustment. Dewatering and sludge handling problems.
Adsorption on activated carbon
Good removal efficiency. Suspended solids and organic substances well reduced.
Regeneration process with high cost. Excessive solid waste generation.
Ion-exchange Regeneration with low loss of resins. Specific application. Not effective for all dyes. Cost effective.
Electrochemical oxidation
No additional chemicals required and end products are non-hazardous. Capacity of adaptation to different volumes and pollution loads.
Process with high cost. Iron hydroxide sludges.
Advanced oxidation processes
Complete mineralization ensured. Growing number of commercial applications. Effective pretreatment methodology in integrated systems and enhances biodegradability.
Expensive process.
Ozonation Effective for azo dye removal. No alteration in volume.
Not suitable for dispersed dyes. Releases aromatic amines. Short half-life (20 min.).
Fenton’s reagent Capable of decolourizing wide variety of wastes. Effective for both soluble and insoluble colourants.
Problem with sludge disposal that makes the process relatively expensive.

Part II – General Introduction
19
Photocatalysis
Process carried out at ambient conditions. Inputs are atoxic and inexpensive. Complete mineralization with shorter retention times.
Effective for small amount of colourants. Expensive process.
NaOCl Initiates and accelerates azo-bond cleavage. Low temperature requirement.
Process with high cost. Release of aromatic amines.
Aerobic biodegradation Colour removal is facilitated along with COD removal.
Longer retention times. Less resistant to recalcitrant compounds.
Anaerobic biodegradation
Resistant to wide variety of complex colourants. Bio gas produced is used for electricity and steam generation.
Longer acclimatization phase.
Bacterial, fungal and algal biodegradation
Good removal efficiency for low volumes and concentrations. Very effective for specific colourant removal.
Culture maintenance is expensive. Cannot cope up with large volumes of coloured effluents.
II. 4 Enzymes in wastewater treatment
Enzymes have a number of features that make them more viable in relation to
conventional catalysts: they are biodegradable catalysts, allow the operation at low and high
substrate concentrations, allow the operation over a wide range of pH, temperature and salinity,
have no delays associated with the acclimatization of biomass, have a reduced sludge
formation, are simple and easy to control (Nicell et al., 1993).
However, enzymes also have some disadvantages such as high costs associated and
instability when taken from the natural wild. According to Karam and Nicell (1997), recent
biotechnological advances have allowed the production of cheaper and more available enzymes
through improved purification and isolation processes. All these advantages added to their high
specificities and catalytic activities with the possibility of designing enzymes with the exactly
desired properties through genetic engineering and computational design, suggest the potential
application of this process in the treatment of effluents (Call and Mucke, 1997).
The ligninolytic enzymes, like lignin peroxidase, manganese peroxidase and laccase
are produced by white-rot-fungi (secreted into the extracellular environment of the fungi),
normally when levels of nutrients such as carbon, nitrogen or sulfur become limiting (Barr and
Aust, 1994). They are able to oxidize a large number of different compounds, and therefore they
have been intensively studied in textile wastewater treatment.

Part II – General Introduction
20
A numbering system was developed by the Enzyme Commission where the enzymes
are classified according to their class and with the kind of reactions that they catalyze. The
prefix E.C. is generally employed with the numerical scheme (Blanch and Clark, 1997).
II. 4. 1 Lignin peroxidase (LiP, EC 1.11.1.14)
LiP is a glycoprotein heme produced mainly by Phanerochaete chrysosporium fungus
that catalyzes the oxidation of phenolic, non phenolic and polycyclic aromatic hydrocarbons
compounds as well as a variety of recalcitrant aromatic compounds. This enzyme requires
hydrogen peroxide as cofactor and the reaction occurs through a mechanism of an electron
oxidation followed by a series of non-enzymatic reactions (Garg and Modi, 1999). LiP’s have
many forms, with a molecular weight between 38-47 kDa and an isoelectric point of 3.2-4.7
(Leonowicz et al., 2001).
Some studies show that LiP is capable to decolourize mainly azo dyes, nevertheless,
the decolourization of other types of dyes was also verified (Ollikka et al., 1993; Verma and
Madamwar, 2002).
II. 4.2 Manganese peroxidase (MnP, EC 1.11.1.13)
MnP is also principally produced by Phanerochaete chrysosporium fungus together with
LiP. It is also a glycoprotein heme with a molecular weight between 40-46 kDa and an
isoelectric point of 2.9-7.0 (Leonowicz et al., 2001).
This enzyme requires free manganese ion for its activity. Initially it catalyzes the
oxidation of Mn2+ to Mn3+ oxidizing, subsequently, several phenolic compounds.
As the MnP enzyme varies from species to species, the ability to dye decolourization also
changes with the kind of MnP used and with the reaction conditions (Li et al., 2009).
II. 4.3 Laccases (EC 1.10.3.2)
Laccases are either mono or multimeric copper-containing oxidoreductases that do not
require coenzymes to catalyse the one-electron oxidation of a vast amount of phenolic
substrates, through a reaction mechanism catalyzed by radicals. The final electron acceptor is
the oxygen that is reduced to water (Baldrian, 2006).
Laccase was discovered by Yoshida in 1883 in plants (Rhus vernicifera), and
characterized by Bertrand in 1985 after its isolation and purification (Mayer and Staples, 2002).
Fungal laccases were discovered during the XIX century (Call and Mucke, 1997). Laccase can
be produced by many plants (Hoopes and Dean, 2004) and fungi (Couto and Toca-Herrera,
2007), as well as by bacteria (Sharma et al., 2007). Most laccases have been isolated from
white-rot fungi (Fonseca et al., 2010; Zhao et al., 2008).

Part II – General Introduction
21
A typical laccase reaction is shown in Figure II. 3, where a diphenol undergoes a one
electron oxidation to form an oxygen-centred free radical. This active species can be converted
to a quinone in a second enzyme-catalysed step or by spontaneous disproportionation. Quinone
as well as the free radical products undergo non-enzymatic coupling reaction leading to
polymerization (Thurston, 1994).
Figure II. 3 - A typical laccase reaction with a diphenol.
II. 4.3.1 Molecular and structural properties
Laccase (benzenodiol:oxygen oxidoreductase) is a polyphenol oxidase, which belongs
to the oxidoredutases enzymes class, also known by blue copper oxidase. In structural terms
this glycoprotein normally contains four copper atoms per monomer, distributed in three
different binding sites, copper T1, T2 and T3, each one with an important role in the laccase
catalytic mechanism. Copper T1 is involved in the capture and transfer of the electron to the
trinuclear copper center T2/T3, which is involved in bonding with oxygen (Call and Mucke, 1997).
Laccases usually comprise 520-550 amino acids, with a molecular weight ranging from 43 to
383 Dka depending on the fungal species (Baldrian, 2006). These enzymes are known to have
a high stability due to the covalently linked carbohydrate moiety (10-45 %) (Claus, 2004).
The four copper atoms can be distinguished using UV/visible and electroparamagnetic
resonance spectroscopy (EPR). One of the copper atoms belongs to the paramagnetic site T1,
is EPR detectable and presents a strong absorption at 610 nm, which gives rise to the typical
blue colour of the copper oxidases. This is the place where substrate oxidation starts. Another
atom belongs to the copper paramagnetic site T2, does not confer colour but is EPR detectable.
The other pair of copper atoms is strongly coupled by a hydroxyl bridge and belongs to the
diamagnetic site T3. This pair gives a weak absorbance in the near UV at 330 nm but is not
detected by EPR. The T1 copper is usually coordinated to two nitrogens from two histidines and
to a sulphur from cysteine. It is the bond of copper T1 to sulphur that is responsible for the
characteristic blue colour of typical laccase enzymes. The reduction of molecular oxygen and
the release of water occur in the trinuclear cluster formed by T2 and T3 coppers. T2 copper is
coordinated by two histidines and T3 copper by six histidines (Figure II. 4) (Claus, 2004).

Part II – General Introduction
22
Figure II. 4 – Model of the catalytic cluster of the laccase from Trametes versicolor made of four copper
atoms (Riva, 2006).
Figure II. 5 shows the three-dimensional structure of laccase produced by T. versicolor.
Figure II. 5 – Diagram of Trametes versicolor laccase. The arrangement of the structure of the three
domains is depicted in different colours coding (D1–D3). Copper ions are drawn as blue spheres.
Carbohydrates and disulfide bonds are included as stick models (Piontek et al., 2002).
The redox potential was determined for several laccases using different mediators, and
ranges from 430 mV to 800 mV. It is important to remark that the redox potential of fungal
laccases is independent of their origin species (Baldrian, 2006; Shleev et al., 2005).
Table II. 7 summarizes some important properties of fungal laccases.

Part II – General Introduction
23
Table II. 7 – Some properties of fungal laccases (Baldrian, 2006; Call and Mucke, 1997).
Property Fungal Laccases
pH-Optimum 2.0 – 7.5
Temperature-Optimum (ºC) 25 – 80
Molecular weight (kDa) 43 – 390
Copper content (atoms per molecule) 2 – 16
Redox potential (mV) 430 – 800
Isoelectric points 2.6 – 7.6
Beyond the interest in investigating laccase structure, catalytic mechanism and
electrochemical properties, recently there has also been a great interest in developing new
laccases through molecular evolution techniques (Giovanna et al., 2008; Rodgers et al., 2009).
II. 4.3.2 Catalytic cycle
Despite of not knowing the exact catalytic mechanism of laccase, several mechanisms
have been proposed which are consistent with the available properties (Figure II. 6).
Figure II. 6 – Proposed catalytic cycle of laccase showing the mechanism for reduction and oxidation of
the copper sites (Solomon et al., 1996).

Part II – General Introduction
24
According to Durán et al. (2002) in the catalytic cycle of laccase, starting from the
“native intermediate”, the substrate reduces the T1 site, which in turn transfers the electron to
the trinuclear cluster, where molecular oxygen is reduced to water. Two possible mechanisms
for the reduction of the trinuclear cluster are possible. The T1 and T2 sites together reduce the
T3 pair (A in Figure II. 6) or each copper in the trinuclear cluster is sequentially reduced by
electron transfer from T1 site (B in Figure II. 6), in which case the T3 no longer acts as a two-
electron acceptor. Slow decay of the “native intermediate” leads to the resting fully oxidized
form. In this form, the T1 site can still be reduced by substrate, but electron transfer to the
trinuclear site is too slow to be catalytically relevant. The bridging to T2 center is linked to the
stability of the intermediate peroxide, showing its importance to the reduction of oxygen (Cole et
al., 1990).
II. 4.3.3 Laccase applications
The practical applications of laccase have led to an increase in research of enzyme
producing sources, particularly white-rot fungi. According to Mayer and Staples (2002) all
laccase applications may be associated with its ability to produce free radicals from a suitable
substrate.
During the last few years work on lacasse applications has been extended. Reported
applications include:
- Bioremediation, where toxic compounds and persistent environmental pollutants, in
particular phenols, are removed from water and soil, contributing to its
decontamination (Gianfreda et al., 2006);
- Design of fungicidal and bactericidal laccase preparations (Mougin et al., 2000);
- Green biodegradation of xenobiotics including pulp bleaching, providing milder and
cleaner strategies for delignification (Widsten and Kandelbauer, 2008);
- Organic synthesis, such as polymerization (Ceylan et al., 2008), generation of
colour from non-coloured substances (Pilz et al., 2003) or fuel ethanol improved
production from renewable raw materials (Larsson et al., 2001);
- Enhancing or modification of beverage appearance, like wine (Minussi et al., 2007)
or fruit juice stabilization (Alper and Acar, 2004) and improvement of beer storage
life (Mathiasen, 1996) by polyphenols removal;
- Treatment of food, mainly as a baking aid (Selinheimo et al., 2006);
- Textile finishing, to improve the whiteness in conventional bleaching of cotton
(Tzanov et al., 2003) or to bleach indigo dyes denim fabrics to lighter shades
(Pazarlioglu et al., 2005);
- Development of biofuel cells (Barrière et al., 2006) and of biosensors, to detect
various phenolic compounds, oxygen or azides (Haghighi et al., 2003) and to
electrochemical measurements (Cordi et al., 2007) and also for
electroimumunoassays (Kuznetsov et al., 2001);

Part II – General Introduction
25
- Medical applications, such as synthesis of complex therapeutic compounds (Nicotra
et al., 2004), inhibition of HIV-1 reverse transcriptase (Wang and Ng, 2004),
aceruloplasminemia fighting (Harris et al., 2004) and in distinction of morphine from
codeine simultaneously in drug samples (Bauer et al., 1999);
- Desulfurization of harmful compounds emitted by fossil fuels (Villaseñor et al.,
2004);
- Desinfection procedures with iodine formation through oxidation of iodide (Xu,
1996); painting and waving of hair, as less irritating processes (Jumino et al., 1994);
cosmetic and dermatological preparations with proteins for skin lightening (Golz-
Berner et al., 2004), in the leather area to improve dyeing efficiency and leather
characteristics (Sorensen et al., 1993);
Moreover, interesting prospective directions for the application of the laccase in dye
degradation have also been found.
Laccase enzymes are known to be able of successfully degrade various types of dyes
such as azo, diazo and anthraquinone structures, among others, suggesting its application in
the treatment of textile industrial effluents. However, due to the dye structures complexity and to
the unawareness of enzymatic transformation mechanism, the capacity to describe laccase
decolourization pathways still remains incomplete (Wesenberg et al., 2003).
Kirby et al. (2000) have demonstrated that laccase from Phlebia tremellosa was capable
of decolourizing eight synthetic textile dyes (200 mg/L) more than 96 %. However, Nyanhongo
et al. (2002) showed that dyes are not equally susceptible to enzymatic degradation. The
decolourization rate depends both on the source of the enzyme preparation and on the structure
of the dye. The optimum pH and temperature of decolourization vary with the dye to treat.
Palmieri et al. (2005), have demonstrated that the extent of dye decolourization also depended
on enzyme concentration.
Decolourization of Remazol Brilliant Blue Royal and Drimaren Blue CL-BR was
investigated using laccase from three white rot fungi named as Pleurotus ostreatus, Coriolus
versicolor and Funalia troggi. Maximum and minimum decolourizations were obtained by
laccases from Funalia troggi and Pleurotus ostreatus, respectively (Erkurt et al., 2007).
Purified laccase from a white rot fungus strain SQ01 was capable of decolourizing a
variety of synthetic dyes, including azo, triphenylmethane and anthraquinone dyes, but only few
were completely removed, while others were not completely degraded even with increased
decolourization time (Yang et al., 2009).
Kalme et al. (2009) reported that a laccase from Pseudomonas desmolyticum NCIM
2112 showed an optimum pH character that is substrate depending. Its decolourization of Direct
Blue 6, Green HE4B and Red HE7B dyes also revealed a structural requirement of the dye to
be degraded.

Part II – General Introduction
26
Some studies proposed several mechanisms for laccase catalyzed oxidation of azo
dyes by generation of phenoxy radicals through one electron oxidations. These mechanisms
avoid the formation of aromatic amines, leading to the detoxification of azo dyes (Figure II. 7).
Figure II. 7 – Oxidation of phenolic-azo dyes by laccases (Chivukula and Renganathan, 1995) .
II. 4.3.4 Laccase mediators
Due to the lower redox potential, laccase can only oxidize phenolic compounds.
However, the laccase application in the presence of small natural compounds of low molecular
weight with high redox potential (> 900 mV), called mediators, makes possible the oxidation of
non-phenolic compounds or other compounds with redox potentials higher than those of
laccase (Bourbonnais and Paice, 1990).

Part II – General Introduction
27
Laccases from different sources have different redox potentials. The difference between
the enzyme and substrate redox potentials defines the need of a redox mediator (Soares et al.,
2001). The mediator is a compound with low molecular weight which acts as an electron carrier.
Once it is oxidized by the enzyme, it diffuses away from the catalytic system and in turn oxidizes
any substrate that, because of its high redox potential could not be directly oxidized by the
enzyme or that is not able to enter in the enzyme active site due to its larger size (Figure II. 8).
Figure II. 8 - Catalytic cycle of a laccase-mediator oxidation system (Riva, 2006).
The activity of a laccase-mediator system depends on enzyme redox potential and on
the stability and reactivity of the oxidized mediator. According to Bourbonnais et al. (1997)
laccases from different organisms react variably with different mediators and different
substrates. An ideal redox mediator must be a good laccase substrate; its oxidized and reduced
forms must be stable but should not inhibit the enzymatic reaction (Johannes and Majcherczyk,
2000).
The first mediator to be used in laccase-mediator system was the azine 2,2’-azino-bis-
(3-ethylbenzothiazoline-6-sulfonic acid) (ABTS), which was reported by Bourbonnais and Paice
(1990). More than one hundred other compounds such as triazole 1-hydroxybenzotriazole
(HBT), violuric acid (VA) and 2,2,6,6-tetramethylpiperidine-1-yloxy (TEMPO) have been tested
since then for their laccase mediator ability. Various phenolic compounds (Murugesan et al.,
2009) or anthraquinones dyes (Wong and Yu, 1999) were also evaluated with the aim of
identifying cheaper, more efficient and ecofriendly mediators for the decolourization of
recalcitrant dyes and for other industrial and environmental applications.
Figure II. 9 shows some possible laccase mediators.

Part II – General Introduction
28
Figure II. 9 – Examples of laccase mediators: (a) 3-Hydroxyanthranilic acid (HAA); (b): 2,2’-azino-bis-(3-
ethylbenzothiazoline-6-sulphonic acid) (ABTS); (c) N-hydroxybenzotriazole (HBT); (d) N-hydroxyphtaimide
(HPI); (e) violuric acid (VLA); (f) N-hydroxyacetanilide (NHA); (g) methyl ester of 4-hydroxy-3,5-dimethoxy-
benzoic acid (syringic acid); (h) 2,2,6,6-tetramethylpiperidine-1-yloxy (TEMPO) (Riva, 2006).
The substrate oxidation mechanism by the mediator depends on the chemical structure
of the mediator. In the case of ABTS several studies suggest a mechanism of electron transfer
to the substrate. For mediators such as HBT and violuric acid (VA), if weak C-H bonds are
present in the substrate, a mechanism of transfer of hydrogen atom is suggested (Cantarella et
al., 2003; Galli and Gentili, 2004). The mediator TEMPO follows a different mechanism, the
ionic oxidation (d'Acunzo et al., 2002).
The action mechanism of laccase-mediator system in dyes degradation has been
extensively studied and it has been observed that the dye decolourization capability of a
laccase depends on its species and strain and on the structure of the dye. Although Peralta-
Zamora et al. (2003) reported that T. versicolor laccase (strain CCT-4521) decolourized
Reactive blue 19 only in presence of HBT, laccase from T. versicolor (ATCC 20869)
decolourized the anthraquinone dye without a redox mediator (Champagne and Ramsay, 2005).
An anthraquinone dye SN4R was effectively decolourized by a crude laccase from Pleurotus
ostreatus strain 32. However, the decolourization rate was increased by 90% with ABTS
addition as a mediator of laccase and the decolourization time was shortened to about twice as
fast as that without mediator (Hou et al., 2004).
Laccase from Funalia troggi was evaluated in the decolourization of several dyes from
different classes (azo, anthraquinone, Cr-complexed class) commonly used in textile
applications. The more recalcitrant dyes degradation was only achieved through the combined
action of the laccase and the mediator. Correlations among the decolourization degree of the
various dyes and their electronic and structural diversities were rationalized and discussed
(Ciullini et al., 2008). The decolourization and detoxification of a textile industry effluent by
laccase from Trametes troggi in the presence and the absence of laccase mediators was
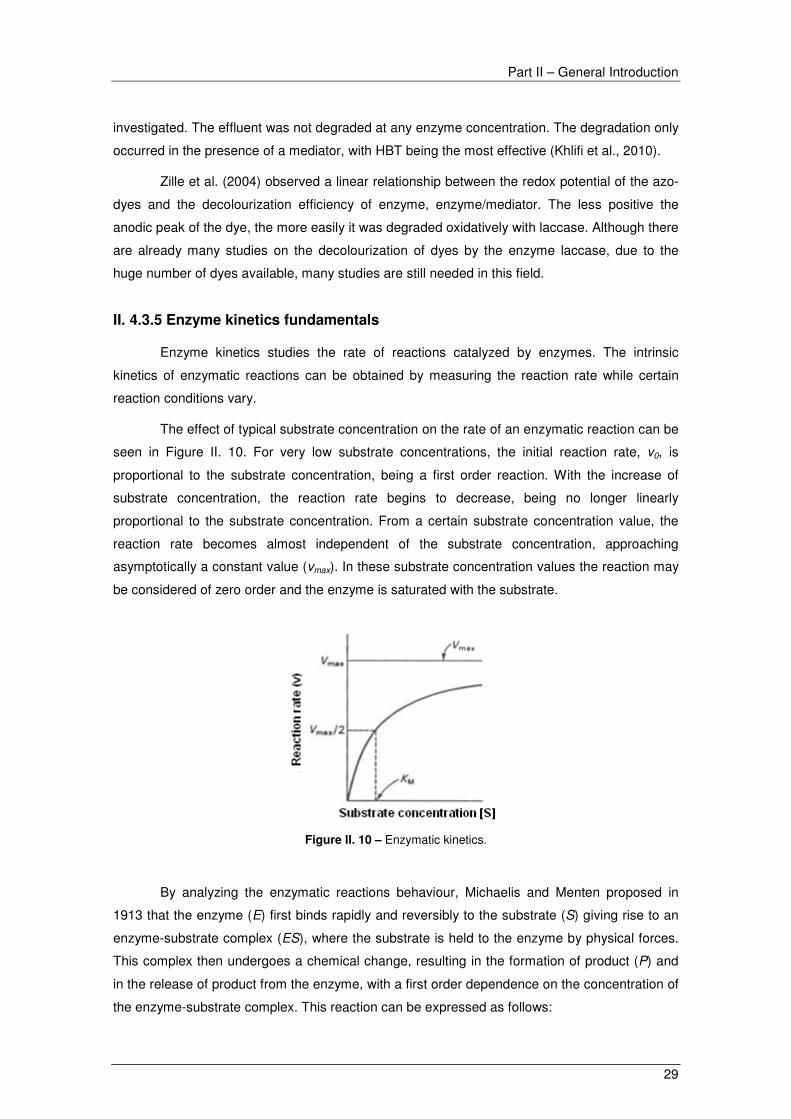
Part II – General Introduction
29
investigated. The effluent was not degraded at any enzyme concentration. The degradation only
occurred in the presence of a mediator, with HBT being the most effective (Khlifi et al., 2010).
Zille et al. (2004) observed a linear relationship between the redox potential of the azo-
dyes and the decolourization efficiency of enzyme, enzyme/mediator. The less positive the
anodic peak of the dye, the more easily it was degraded oxidatively with laccase. Although there
are already many studies on the decolourization of dyes by the enzyme laccase, due to the
huge number of dyes available, many studies are still needed in this field.
II. 4.3.5 Enzyme kinetics fundamentals
Enzyme kinetics studies the rate of reactions catalyzed by enzymes. The intrinsic
kinetics of enzymatic reactions can be obtained by measuring the reaction rate while certain
reaction conditions vary.
The effect of typical substrate concentration on the rate of an enzymatic reaction can be
seen in Figure II. 10. For very low substrate concentrations, the initial reaction rate, v0, is
proportional to the substrate concentration, being a first order reaction. With the increase of
substrate concentration, the reaction rate begins to decrease, being no longer linearly
proportional to the substrate concentration. From a certain substrate concentration value, the
reaction rate becomes almost independent of the substrate concentration, approaching
asymptotically a constant value (vmax). In these substrate concentration values the reaction may
be considered of zero order and the enzyme is saturated with the substrate.
Figure II. 10 – Enzymatic kinetics.
By analyzing the enzymatic reactions behaviour, Michaelis and Menten proposed in
1913 that the enzyme (E) first binds rapidly and reversibly to the substrate (S) giving rise to an
enzyme-substrate complex (ES), where the substrate is held to the enzyme by physical forces.
This complex then undergoes a chemical change, resulting in the formation of product (P) and
in the release of product from the enzyme, with a first order dependence on the concentration of
the enzyme-substrate complex. This reaction can be expressed as follows:

Part II – General Introduction
30
PEESSE 2S kK +→ →←+
where KS is the dissociation constant of the enzyme-substrate complex and k2 is the first order
rate constant for release of product from the complex.
From the proposed model, Michaelis and Menten developed an equation that allows to
demonstrate how the reaction rate (v) varies with substrate concentration [S]:
[ ][ ]SK
Svv
M
max
+= (II. 1)
where vmax is the maximum reaction rate and KM is the Michaelis-Menten constant. For the
simple reaction mechanism shown above, KM is equal to KS, the dissociation constant of ES,
and corresponds to the substrate concentration for which the reaction rate is half the maximum
rate, being a measure of the affinity of the enzyme for a particular substrate. The lesser the
value of KM the larger is the affinity of the enzyme to the substrate, i.e., an enzyme that has a
low value of KM for a substrate, reaches its maximum catalytic efficiency at a low concentration
of substrate (Blanch and Clark, 1997).
Laccase oxidizes a very wide range of substrates. However, the catalytic constants
have been reported mostly for a small group of substrates: ABTS and the phenolic compounds
2,6-dimethoxyphenol (DMP), guaiacol and syringaldazine (Table II. 8 ). These constants have
been measured for a large number of laccases, and significant variations can be observed
among them.
Table II. 8 – Kinetic parameters of laccase for some substrates (Baldrian, 2006).
Catalytic constant n* Median Min Max
KM (µM) ABTS 2,6-Dimethoxyphenol Guaiacol Syringaldazine
36 30 23 21
39 405 420 36
4 26 4 3
770
14720 30000 4307
kcat (s-1)
ABTS 2,6-Dimethoxyphenol Guaiacol Syringaldazine
12 12 10 4
24050 3680 295
21500
198 100 90
16800
350000 360000 10800 28000
*n: number of observations
Despite the large variation observed for different substrates, usually each enzyme has a
characteristic catalytic performance kcat (vmax/[E0], where [E0] is the total amount of enzyme in
the system). In general, laccases present high affinity for ABTS and syringaldazine with high

Part II – General Introduction
31
catalytic constant, whereas the oxidation of guaiacol and DMP is considerably slower and the
respective KM constants higher (Baldrian, 2006).
In 1994, Yaropolov et al. discussed the kinetic data of laccases from different sources.
The values of KM, Michaelis-Menten constant, are similar in case of co-substrate be the oxygen
(about 10-5), but the vmax value varies with the laccase source (50-300 M.s-1) and with substrate.
The kinetic constants differ in their pH dependence. KM is pH independent for both substrate
and co-substrate, while the kcat is pH dependent (Call and Mucke, 1997).
II. 4.3.5 Immobilization
Enzymes exhibit a number of features that make their use advantageous as compared
to conventional catalysts. However, they have also a number of drawbacks when used as an
efficient treatment method of wastewaters, such as their high cost of isolation and purification,
their instability towards thermal and pH denaturation, their non-reusability and inactivation by
inhibitors. The use of immobilized enzymes can increase their operational stability and durability
and can provide easy separation of the product from reaction media and easy recovery of the
enzyme. Furthermore, enzyme immobilization would allow the reuse of the enzyme and thus
decrease the cost of industrial applications and allow the control of the process (Cao, 2005;
Duran et al., 2002). As result of structural changes induced by immobilization and of the new
environment, the immobilized enzyme typically has a lower activity and a higher Michaelis-
Menten constant.
Several techniques may be applied to immobilize enzymes on solid supports. They are
mainly based on chemical and physical mechanisms (Duran et al., 2002). Therefore, it is hardly
surprising that there is no general universally applicable method of enzyme immobilization. The
main task is to select a suitable carrier, conditions (pH, temperature and nature of medium) and
enzyme itself (source, nature and purity) to design an immobilized biocatalyst. The selected
method should meet both the catalytic needs (expressed in productivity, space-time, yield,
stability and selectivity) and the non-catalytic needs (e.g. separation, control, down-streaming
process) that are required by a given application (Bornscheuer, 2003; Dyal et al., 2003).
According to Duran et al. (2002) both chemical and physical methods offer advantages
and disadvantages that depend on several factors. In general, chemical immobilization methods
tend to reduce the activity of the enzyme, since the covalent bonds, formed as a result of
immobilization, may perturb the enzyme native structure. By contrast, such covalent linkages
provide strong and stable enzyme attachment and may, in some cases, reduce enzyme
deactivation rates and usefully alter enzyme specificity. However, entrapment and adsorption
immobilization methods typically perturb the enzyme less and consequently offer retention of
the enzyme properties resembling those in solution. A proper choice between chemical and
physical methods depends on several factors. Usually, a long-time applicable immobilized
enzyme with a lower initial activity is preferable to that with a high level of initial activity but with

Part II – General Introduction
32
a short-time activity retention. Table II. 9 makes a comparison between the main methods of
enzymes immobilization.
Table II. 9 - Comparison of enzyme immobilization methods.
Characteristics Adsorption Covalent binding
Entrapment Membrane
confinement
Preparation simple difficult difficult simple
Cost low high moderate high
Binding force variable strong weak strong
Enzyme leakage yes no yes no
Applicability wide selective wide very wide
Running Problems
high low high high
Matrix effects yes yes yes no
Large diffusional barriers
no no yes yes
The support also plays an important role on enzyme immobilization, influencing
immobilization efficiency and enzyme stability. It is necessary to take into account their
geometric properties, its stability, its chemical and physical nature, and finally, their costs.
In order to achieve an economically viable application at industrial level, effective but
cheap supports and immobilization techniques are needed. Some cheaper supports from agro-
industrial residues, like functionalized rice hust for invertase immobilization (D'Souza and
Godbole, 2002), rice straw for lipase immobilization (Castro et al., 2001) and spent grains from
breweries for trypsin immobilization (Rocha et al., 2005) were already reported.
Laccase immobilization was extensively studied with a wide range of different methods,
supports and substrates. Table II. 10 reports some immobilized laccases on various supports
applied in dye decolourization. The laccase source, the immobilization method, the dyes and
the decolourization efficiency are specified.

Part II – General Introduction
33
Table II. 10 – Applications of immobilized laccases in dye decolourization.
Laccase source
Immobilization method
Dyes Decolourization efficiency
References
Coriolopsis galica
Covalent on activated agarose
Reactive blue 198 – Dye effluent 70 % (Reyes et al., 1999)
Trametes versicolor
Covalent on silica
Reactive blue 19 (anthraquinone), Remazol black B (azo), Reactive orange 122 (azo), Reactive red 251
45 % (0.5 h), 9 %, 55 % (0.5 h), 25 % (0.5 h)
(Peralta-Zamora et al., 2003)
Trametes modesta
Covalent on Al2O3
Lanaset Blue R (anthraquinone), Acid blue 74 (indigoid), Crystal violet (triphenyl-methane dye), Phenyl azo dye
100 % (10-12h) 99 % 98 % 99 %
(Kandelbauer et al., 2004)
Pleurotus ostreatus
Eupergit C (epoxy activated acrylic carrier)
Reactive blue 19 56 % (Russo et al., 2008)
Rhus vernicifora
Poly (GMA/EDGMA) Reactive red 120 91 % (10h) (Arica et al.,
2009)
II. 5 References
Alinsafi, A., Khemis, M., Pons, M.N., Leclerc, J.P., Yaacoubi, A., Benhammou, A., Nejmeddine, A., 2005. Electro-coagulation of reactive textile dyes and textile wastewater. Chemical Engineering and Processing, 44, 461-470.
Allegre, C., Moulin, P., Maisseu, M., Charbit, F., 2006. Treatment and reuse of reactive dyeing effluents. Journal of Membrane Science, 269, 15-34.
Alper, N., Acar, J., 2004. Removal of phenolic compounds in pomegranate juices using ultrafiltration and laccase-ultrafiltration combinations. Nahrung, 48, 184-187.
Ambrósio, S.T., Campos-Takaki, G.M., 2004. Decolorization of reactive azo dyes by Cunninghamella elegans UCP 542 under co-metabolic conditions. Bioresource Technology, 91, 69-75.
Anjaneyulu, Y., Chary, N.S., Raj, D.S.S., 2005. Decolourization of industrial effluents - available methods and emerging technologies - a review. Reviews in environmental science and bio/technology, 4, 245-273.
Aplin, R., Waite, T.D., 2000. Comparison of three advanced oxidation processes for degradation of textile dyes. Water Science and Technology, 42, 345-354.
Arica, M.Y., Altintas, B., Bayramoglu, G., 2009. Immobilization of laccase onto spacer-arm attached non-porous poly(GMA/EGDMA) beads: Application for textile dye degradation. Bioresource Technology, 100, 665-669.
Asgher, M., Azim, N., Bhatti, H.N., 2009. Decolorization of practical textile industry effluents by white rot fungus Coriolus versicolor IBL-04. Biochemical Engineering Journal, 47, 61-65.
ATP, 2010. Associação Têxtil e Vestuário de Portugal. http://www.atp.pt/gca/index.php?id=18, 24 March.
Baldrian, P., 2006. Fungal laccases - occurrence and properties. Fems Microbiology Reviews, 30, 215-242.
Barr, D.P., Aust, S.D., 1994. Mechanisms white rot fungi use to degrade pollutants. Environmental Science & Technology, 28, 78-87.
Barrière, F., Kavanagh, P., Leech, D., 2006. A laccase-glucose oxidase biofuel cell prototype operating in a physiological buffer. Electrochimica Acta, 51, 5187-5192.

Part II – General Introduction
34
Bauer, C.G., Kühn, A., Gajovic, N., Skorobogatko, O., Holt, P.-J., Bruce, N.C., Makower, A., Lowe, C.R., Scheller, F.W., 1999. New enzyme sensors for morphine and codeine based on morphine dehydrogenase and laccase. Fresenius' Journal of Analytical Chemistry, 364, 179-183.
Blanch, H.W., Clark, D.S., 1997. Biochemical Engineering. Marcel Dekker Inc., New York.
Bornscheuer, U., 2003. Immobilizing enzymes: how to create more suitable biocatalysts Angewandte Chemie International Edition English, 43, 3336-3337.
Bourbonnais, R., Paice, M.G., 1990. Oxidation of non-phenolic substrates: An expanded role for laccase in lignin biodegradation. Febs Letters, 267, 99-102.
Bourbonnais, R., Paice, M.G., Freiermuth, B., Bodie, E., Borneman, S., 1997. Reactivities of Various Mediators and Laccases with Kraft Pulp and Lignin Model Compounds. Applied and Environmental Microbiology, 63, 4627-4632.
Braile, P.M., Cavalcanti, J.E.W.A., 1993. Manual de tratamento de águas residuárias industriais. CETESB, São Paulo – Brasil.
Call, H.P., Mucke, I., 1997. History, overview and applications of mediated lignolytic systems, especially laccase-mediator-systems (Lignozym(R)-process). Journal of Biotechnology, 53, 163-202.
Cantarella, G., Galli, C., Gentili, P., 2003. Free radical versus electron-transfer routes of oxidation of hydrocarbons by laccase/mediator systems: Catalytic or stoichiometric procedures. Journal of Molecular Catalysis B: Enzymatic, 22, 135-144.
Cao, L., 2005. Immobilised enzymes: science or art? Current Opinion in Chemical Biology, 9, 217-226.
Carvalho, M.C., Pereira, C., Gonçalves, I.C., Pinheiro, H.M., Santos, A.R., Lopes, A., Ferra, M.I., 2008. Assessment of the biodegradability of a monosulfonated azo dye and aromatic amines. International Biodeterioration & Biodegradation, 62, 96-103.
Castro, H., F., Lima, R., Roberto, I., C., 2001. Rice Straw as a Support for Immobilization of Microbial Lipase. Biotechnology Progress, 17, 1061-1064.
Cerón-Riviera, M., Davila-Jimenez, M.M., Elizalde-Gonzalez, M.P., 2004. Degradation of the textile dyes Basic yellow 28 and Reactive black 5 using diamond and metal alloys electrodes. Chemosphere, 55, 1-10.
Ceylan, H., Kubilay, S., Aktas, N., Sahiner, N., 2008. An approach for prediction of optimum reaction conditions for laccase catalyzed bio-transformation of I-naphthol by response surface methodology (RSM). Bioresource Technology, 99, 2025-2031.
Champagne, P.-P., Ramsay, J., 2005. Contribution of manganese peroxidase and laccase to dye decoloration by Trametes versicolor. Applied Microbiology and Biotechnology, 69, 276-285.
Chander, M., Arora, D.S., 2007. Evaluation of some white-rot fungi for their potential to decolourise industrial dyes. Dyes and Pigments, 72, 192-198.
Chivukula, M., Renganathan, V., 1995. Phenolic Azo-Dye Oxidation by Laccase from Pyricularia-Oryzae. Applied and Environmental Microbiology, 61, 4374-4377.
Choy, K. K, H., McKay, G, Porter, J, F., 1999. Sorption of acid dyes from effluents using activated carbon. Resources, Conservation and Recycling, 27, 57-71.
Christie, R.M., 2001. Colour Chemistry. Royal Society of Chemistry, Cambridge, UK.
CII, 2010. Colour Index International. http://www.colour-index.org/, 12 March.
Ciullini, I., Tilli, S., Scozzafava, A., Briganti, F., 2008. Fungal laccase, cellobiose dehydrogenase, and chemical mediators: Combined actions for the decolorization of different classes of textile dyes. Bioresource Technology, 99, 7003-7010.
Claus, H., 2004. Laccases: structure, reactions, distribution. Micron, 35, 93-96.
Cole, J.L., Tan, G.O., Yang, E.K., Hodgson, K.O., Solomon, E.I., 1990. Reactivity of the laccase trinuclear copper active site with dioxygen: an x-ray absorption edge study. Journal of the American Chemical Society, 112, 2243-2249.
Cordi, L., Minussi, R.C., Freire, R.S., Durán, N., 2007. Fungal laccase: Copper induction, semi-purification, immobilization, phenolic effluent treatment and electrochemical measurement. African Journal of Biotechnology, 6, 1255-1259.
Couto, S.R., Toca-Herrera, J.L., 2007. Laccase production at reactor scale by filamentous fungi. Biotechnology Advances, 25, 558-569.
Crini, G., 2006. Non-conventional low-cost adsorbents for dye removal: A review. Bioresource Technology, 97, 1061-1085.

Part II – General Introduction
35
d'Acunzo, F., Baiocco, P., Fabbrini, M., Galli, C., Gentili, P., 2002. A Mechanistic Survey of the Oxidation of Alcohols and Ethers with the Enzyme Laccase and Its Mediation by TEMPO. European Journal of Organic Chemistry, 2002, 4195-4201.
D'Souza, S.F., Godbole, S.S., 2002. Immobilization of invertase on rice husk using polyethylenimine. Journal of Biochemical and Biophysical Methods, 52, 59-62.
Delée, W., O'Neill, C., Hawkes, F.R., Pinheiro, H.M., 1998. Anaerobic Treatment of textile effluents: a review. Journal of Chemical Technology & Biotechnology, 73, 323-335.
dos Santos, A.B., Bisschops, I.A.E., Cervantes, F.J., van Lier, J.B., 2005. The transformation and toxicity of anthraquinone dyes during thermophilic (55 °C) and mesophilic (30 °C) anaerobic treatments. Journal of Biotechnology, 115, 345-353.
dos Santos, A.B., Cervantes, F.J., Yaya-Beas, R.E., van Lier, J.B., 2003. Effect of redox mediator, AQDS, on the decolourisation of a reactive azo dye containing triazine group in a thermophilic anaerobic EGSB reactor. Enzyme and Microbial Technology, 33, 942-951.
Duran, N., Rosa, M.A., D'Annibale, A., Gianfreda, L., 2002. Applications of laccases and tyrosinases (phenoloxidases) immobilized on different supports: a review. Enzyme and Microbial Technology, 31, 907-931.
Dyal, A., Loos, K., Noto, M., Chang, S., Spagnoli, C., Shafi, K., Ulman, A., Cowman, M., Gross, R., 2003. Activity of Candida rugosa lipase immobilized on gamma-Fe2O3 magnetic nanoparticles. Journal of the American Chemical Society, 125, 1684-1685.
Easton, J., 1995. The dye maker’s view. In: Cooper P, editor. Colour in dyehouse effluent. Bradford, UK, Society of dyers and colourists, 11.
El-Sheekh, M.M., Gharieb, M.M., Abou-El-Souod, G.W., 2009. Biodegradation of dyes by some green algae and cyanobacteria. International Biodeterioration & Biodegradation, 63, 699-704.
Erkurt, E.A., Ünyayar, A., Kumbur, H., 2007. Decolorization of synthetic dyes by white rot fungi, involving laccase enzyme in the process. Process Biochemistry, 42, 1429-1435.
Fonseca, M.I., Shimizu, E., Zapata, P.D., Villalba, L.L., 2010. Copper inducing effect on laccase production of white rot fungi native from Misiones (Argentina). Enzyme and Microbial Technology, 46, 534-539.
Galli, C., Gentili, P., 2004. Chemical messengers: mediated oxidations with the enzyme laccase. Journal of Physical Organic Chemistry, 17, 973-977.
Garg, S.K., Modi, D.R., 1999. Decolorization of Pulp-Paper Mill Effluents by White-Rot Fungi. Critical Reviews in Biotechnology, 19, 85-112.
Gianfreda, L., Iamarino, G., Scelza, R., Rao, M., 2006. Oxidative catalysts for the transformation of phenolic pollutants: a brief review. Biocatalysis and Biotransformation, 24, 177-187.
Giovanna, F., Flavia, A., Franca, F., Paola, G., Giovanni, S., 2008. Development of new laccases by directed evolution: Functional and computational analyses. Proteins: Structure, Function, and Bioinformatics, 72, 25-34.
Glenn, J.K., Gold, M.H., 1983. Decolorization of severa! polymerie dyes by the lignin-degrading basidiomyeete Phanerochaete chrysosporium. Applied and Environmental Microbiology, 45, 1741-1747.
Gogate, P.R., Pandit, A.B., 2004. A review of imperative technologies for wastewater treatment II: hybrid methods. Advances in Environmental Research, 8, 553-597.
Golka, K., Kopps, S., Myslak, Z.W., 2004. Carcinogenicity of azo colorants: influence of solubility and bioavailability. Toxicology Letters, 151, 203-210.
Golz-Berner, K., Walzel, B., Zastrow, L., Doucet, O., 2004. Cosmetic and dermatological preparation containing copperbinding proteins for skin lightening. International Patent Application WO2004017931.
Gonçalves, I.M., Ferra, M.I., Amorim, M.T.P., 1996. Processos de remoção biológica de corantes nos efluentes de indústria têxtil. Tecnologias do Ambiente, 11, 35-38.
Gupta, V.K., Suhas, 2009. Application of low-cost adsorbents for dye removal - A review. Journal of Environmental Management, 90, 2313-2342.
Haghighi, B., Gorton, L., Ruzgas, T., Jönsson, L.J., 2003. Characterization of graphite electrodes modified with laccase from Trametes versicolor and their use for bioelectrochemical monitoring of phenolic compounds in flow injection analysis. Analytica Chimica Acta, 487, 3-14.
Harris, Z.L., Davis-Kaplan, S.R., Gitlin, J.D., Kaplan, J., 2004. A fungal multicopper oxidase restores iron homeostasis in aceruloplasminemia. Blood, 103, 4672-4673.
Part II – General Introduction
36
Hoopes, J.T., Dean, J.F.D., 2004. Ferroxidase activity in a laccase-like multicopper oxidase from Liriodendron tulipifera. Plant Physiology and Biochemistry, 42, 27-33.
Hou, H., Zhou, J., Wang, J., Du, C., Yan, B., 2004. Enhancement of laccase production by Pleurotus ostreatus and its use for the decolorization of anthraquinone dye. Process Biochemistry, 39, 1415-1419.
Husain, Q., 2006. Potential Applications of the Oxidoreductive Enzymes in the Decolorization and Detoxification of Textile and Other Synthetic Dyes from Polluted Water: A Review. Critical Reviews in Biotechnology, 26, 201-221.
Ingamells, W., 1993. Colour for textiles A user's handbook. Society of Dyers and Colourists, West Yorkshire.
Isik, M., Sponza, D.T., 2007. Fate and toxicity of azo dye metabolites under batch long-term anaerobic incubations. Enzyme and Microbial Technology, 40, 934-939.
Johannes, C., Majcherczyk, A., 2000. Natural mediators in the oxidation of polycyclic aromatic hydrocarbons by laccase mediator systems. Applied and Environmental Microbiology, 66, 524-528.
Jumino, A., Martin, R., Dubief, C., Rosenbaum, G., Audouysset, M.P., 1994. Utilisation de laccases d'origine vegetable comme agents oxydants en cosmetique, compositions cosmétiques, les contenant, procedure de traitement cosmétique les mettant en oeuvre et procede d'obtention de ces enzymes.
Kalme, S., Jadhav, S., Jadhav, M., Govindwar, S., 2009. Textile dye degrading laccase from Pseudomonas desmolyticum NCIM 2112. Enzyme and Microbial Technology, 44, 65-71.
Kandelbauer, A., Maute, O., Kessler, R.W., Erlacher, A., Gubitz, G.M., 2004. Study of dye decolorization in an immobilized laccase enzyme-reactor using online spectroscopy. Biotechnology and Bioengineering, 87, 552-563.
Karam, J., Nicell, J., A. , 1997. Potential Applications of Enzymes in Waste Treatment. Journal of Chemical Technology & Biotechnology, 69, 141-153.
Khlifi, R., Belbahri, L., Woodward, S., Ellouz, M., Dhouib, A., Sayadi, S., Mechichi, T., 2010. Decolourization and detoxification of textile industry wastewater by the laccase-mediator system. Journal of Hazardous Materials, 175, 802-808.
Kirby, N., Marchant, R., McMullan, G., 2000. Decolourisation of synthetic textile dyes by Phlebia tremellosa. FEMS Microbiology Letters, 188, 93-96.
Kuznetsov, B.A., Shumakovich, G.P., Koroleva, O.V., Yaropolov, A.I., 2001. On applicability of laccase as label in the mediated and mediatorless electroimmunoassay: effect of distance on the direct electron transfer between laccase and electrode. Biosensors and Bioelectronics, 16, 73-84.
Larsson, S., Cassland, P., Jonsson, L.J., 2001. Development of a Saccharomyces cerevisiae Strain with Enhanced Resistance to Phenolic Fermentation Inhibitors in Lignocellulose Hydrolysates by Heterologous Expression of Laccase. Applied and Environmental Microbiology, 67, 1163-1170.
Leonowicz, A., Cho, N., Luterek, J., Wilkolazka, A., Wojtas-Wasilewska, M., Matuszewska, A., Hofrichter, M., Wesenberg, D., Rogalski, J., 2001. Fungal laccase: properties and activity on lignin. Journal of Basic Microbiology, 41, 185-227.
Li, X., Jia, R., Li, P., Ang, S., 2009. Response surface analysis for enzymatic decolorization of Congo red by manganese peroxidase. Journal of Molecular Catalysis B: Enzymatic, 56, 1-6.
Lin, J., Zhang, X., Li, Z., Lei, L., 2010. Biodegradation of Reactive blue 13 in a two-stage anaerobic/aerobic fluidized beds system with a Pseudomonas sp. isolate. Bioresource Technology, 101, 34-40.
Mathiasen, T.E.D., 1996. Laccase and Beer Storage, Patent EP0741780. Novonordisk AS. (DK).
Mayer, A.M., Staples, R.C., 2002. Laccase: new functions for an old enzyme. Phytochemistry, 60, 551-565.
Mendonça, R.T., Jara, J.F., González, V., Elissetche, J.P., Freer, J., 2008. Evaluation of the white-rot fungi ganoderma austral and ceriporiopsis subvermispora in biotechnological applications. Journal of Industrial Microbiology and Biotechnology, 35, 1323-1330.
Minussi, R.C., Rossi, M., Bologna, L., Rotilio, D., Pastore, G.M., Durán, N., 2007. Phenols removal in musts: Strategy for wine stabilization by laccase. Journal of Molecular Catalysis B: Enzymatic, 45, 102-107.
Mougin, C., Boyer, F.D., Caminade, E., Rama, R., 2000. Cleavage of the diketonitrile derivative of the herbicide isoxa.utole by extracellular fungal oxidases. Journal of Agricultural and Food Chemistry, 48, 4529-4534.

Part II – General Introduction
37
Murugesan, K., Yang, I.-H., Kim, Y.-M., Jeon, J.-R., Chang, Y.-S., 2009. Enhanced transformation of malachite green by laccase of Ganoderma lucidum in the presence of natural phenolic compounds. Applied Microbiology and Biotechnology, 82, 341-350.
Nicell, J.A., Bewtra, J.K., Biswas, N., St. Pierre, C., Taylor, K.E., 1993. Enzyme catalysed polimerization and precipitation of aromatic compounds from aqueous solution. Canadian Journal of Civil Engineering, 20, 725-735.
Nicotra, S., Cramarossa, M.R., Mucci, A., Pagnoni, U.M., Riva, S., Forti, L., 2004. Biotransformation of resveratrol: synthesis of trans-dehydrodimers catalyzed by laccases from Myceliophtora thermophyla and from Trametes pubescens. Tetrahedron, 60, 595-600.
Nyanhongo, G.S., Gomes, J., Gübitz, G.M., Zvauya, R., Read, J., Steiner, W., 2002. Decolorization of textile dyes by laccases from a newly isolated strain of Trametes modesta. Water Research, 36, 1449-1456.
O'Neill, C., Hawkes, F.R., Hawkes, D.L., Lourenco, N.D., Pinheiro, H.M., Delee, W., 1999. Colour in textile effluents - sources, measurement, discharge consents and simulation: a review. Journal of Chemical Technology and Biotechnology, 74, 1009-1018.
Ollikka, P., Alhonmaki, K., Leppanen, V.-M., Glumoff, T., Raijola, T., Suominen, I., 1993. Decolorization of Azo, Triphenyl Methane, Heterocyclic, and Polymeric Dyes by Lignin Peroxidase Isoenzymes from Phanerochaete chrysosporium. Applied and Environmental Microbiology, 59, 4010-4016.
Omar, H.H., 2008. Algal Decolorization and Degradation of Monoazo and Diazo Dyes. Pakistan Journal of Biological Sciences, 11, 1310-1316.
Palmieri, G., Giardina, P., Sannia, G., 2005. Laccase-mediated Remazol Brilliant Blue R decolorization in a fixed-bed bioreactor. Biotechnology Progress, 21, 1436-1441.
Pazarlioglu, N.K., Sariisik, M., Telefoncu, A., 2005. Laccase: production by Trametes versicolor and application to denim washing. Process Biochemistry, 40, 1673-1678.
Peralta-Zamora, P., Pereira, C.M., Tiburtius, E.R.L., Moraes, S.G., Rosa, M.A., Minussi, R.C., Durán, N., 2003. Decolorization of reactive dyes by immobilized laccase. Applied Catalysis B: Environmental, 42, 131-144.
Pilz, Pilz, R., Hammer, Hammer, E., Schauer, Schauer, F., Kragl, Kragl, U., 2003. Laccase-catalysed synthesis of coupling products of phenolic substrates in different reactors. Applied Microbiology and Biotechnology, 60, 708-712.
Piontek, K., Antorini, M., Choinowski, T., 2002. Crystal structure of a laccase from the fungus Trametes versicolor at 1.90-angstrom resolution containing a full complement of coppers. Journal of Biological Chemistry, 277, 37663-37669.
Pointing, S., 2001. Feasibility of bioremediation by white-rot fungi. Applied Microbiology and Biotechnology, 57, 20-33.
Reyes, P., Pickard, M.A., Vazquez-Duhalt, R., 1999. Hydroxybenzotriazole increases the range of textile dyes decolorized by immobilized laccase. Biotechnology Letters, 21, 875-880.
Riva, S., 2006. Laccases: blue enzymes for green chemistry. Trends in Biotechnology, 24, 219-226.
Robinson, T., McMullan, G., Marchant, R., Nigam, P., 2001. Remediation of dyes in textile effluent: a critical review on current treatment technologies with a proposed alternative. Bioresource Technology, 77, 247-255.
Rocha, C., Ducso, L., Gonçalves, M.P., Teixeira, J.A., 2005. Spent-grains and zeolites as potencial carriers for trypsin immobilization. In: Mercosur Congress on Process Systems Engineering. CD-ROM de Anais do 4º Mercosur Congress on Process Systems Engineering. Costa Verde. 5p.
Rodgers, C.J., Blanford, C.F., Giddens, S.R., Skamnioti, P., Armstrong, F.A., Gurr, S.J., 2009. Designer laccases: a vogue for high-potential fungal enzymes? TRENDS in Biotechnology, 28, 63-72.
Russo, M.E., Giardina, P., Marzocchella, A., Salatino, P., Sannia, G., 2008. Assessment of anthraquinone-dye conversion by free and immobilized crude laccase mixtures. Enzyme and Microbial Technology, 42, 521-530.
Santhi, T., Manonmani, S., Smitha, T., 2010. Kinetics and isotherm studies on cationic dyes adsorption onto Annona Squmosa seed activated carbon. International Journal of Engineering Science and Technology, 2, 287-295.
Selinheimo, E., Kruus, K., Buchert, J., Hopia, A., Autio, K., 2006. Effects of laccase, xylanase and their combination on the rheological properties of wheat doughs. Journal of Cereal Science, 43, 152-159.

Part II – General Introduction
38
Sharma, P., Goel, R., Capalash, N., 2007. Bacterial laccases. World Journal of Microbiology and Biotechnology, 23, 823-832.
Shleev, S., Tkac, J., Christenson, A., Ruzgas, T., Yaropolov, A.I., Whittaker, J.W., Gorton, L., 2005. Direct electron transfer between copper-containing proteins and electrodes. Biosensors and Bioelectronics, 20, 2517-2554.
Slokar, Y.M., Le Marechal, A., 1998. Methods of decoloration of textile wastewaters. Dyes and Pigments, 37, 335-356.
Soares, G.M.B., de Amorim, M.T.P., Costa-Ferreira, M., 2001. Use of laccase together with redox mediators to decolourize Remazol Brilliant Blue R. Journal of Biotechnology, 89, 123-129.
Solomon, E.I., Sundaram, U.M., Machonkin, T.E., 1996. Multicopper Oxidases and Oxygenases. Chemical Reviews, 96, 2563-2606.
Sorensen, K., Ingvorsen, K., Mellgaard, A., 1993. Novo Nordisk Biotech. Patent WO4259318.
Suteu, Daniela, Bilba, Doina, 2005. Equilibrium and kinetic study of reactive dye Brilliant Red HE-3B adsorption by activated charcoal. Acta Chimica Slovenica, 52, 73-79.
Thurston, C.F., 1994. The structure and function of fungal laccases. Microbiology, 140, 19-26.
Tzanov, T., Andreaus, J., Guebitz, G., Cavaco-Paulo, A., 2003. Protein interactions in enzymatic processes in textiles. Electronic Journal of Biotechnology, 6, 313-321.
Vandevivere, P.C., Bianchi, R., Verstraete, W., 1998. Treatment and reuse of wastewater from the textile wet-processing industry: Review of emerging technologies. Journal of Chemical Technology and Biotechnology, 72, 289-302.
Vasconcelos, E., 2006. Análise da Indústria Têxtil e do Vestuário. Braga, Portugal, 26 October.
Verma, P., Madamwar, D., 2002. Decolorization of synthetic textile dyes by lignin peroxidase ofPhanerochaete chrysosporium. Folia Microbiologica, 47, 283-286.
Villaseñor, F., Loera, O., Campero, A., Viniegra-González, G., 2004. Oxidation of dibenzothiophene by laccase or hydrogen peroxide and deep desulfurization of diesel fuel by the later. Fuel Processing Technology, 86, 49-59.
Wafaa, M.A.E.-R., Hassan, M., Khalafallah, M., 2003. Microflora involved in textile dye waste removal. Journal of Basic Microbiology, 43, 167-174.
Wang, H.X., Ng, T.B., 2004. A novel laccase with fair thermostability from the edible wild mushroom (Albatrella dispansus). Biochemical and Biophysical Research Communications, 315, 450-454.
Wang, L., Zhang, C., Wu, F., Deng, N., 2007. Photodegradation of aniline in aqueous suspensions of microalgae. Journal of Photochemistry and Photobiology B: Biology, 87, 49-57.
Wesenberg, D., Kyriakides, I., Agathos, S.N., 2003. White-rot fungi and their enzymes for the treatment of industrial dye effluents. Biotechnology Advances, 22, 161-187.
Widsten, P., Kandelbauer, A., 2008. Laccase applications in the forest products industry: A review. Enzyme and Microbial Technology, 42, 293-307.
Wong, Y., Yu, J., 1999. Laccase-catalyzed decolorization of synthetic dyes. Water Research, 33, 3512-3520.
Xu, F., 1996. Oxidation of Phenols, Anilines, and Benzenethiols by Fungal Laccases: Correlation between Activity and Redox Potentials as Well as Halide Inhibition Biochemistry, 35, 7608-7614.
Yang, X.Q., Zhao, X.X., Liu, C.Y., Zheng, Y., Qian, S.J., 2009. Decolorization of azo, triphenylmethane and anthraquinone dyes by a newly isolated Trametes sp. SQ01 and its laccase. Process Biochemistry, 44, 1185-1189.
Zhao, M., Zhang, B., Lu, L., Zhao, L., Liang, S., 2008. Purification and characterization of laccase from the white rot fungus Cerrena unicolor and its use in dye decolorization. Journal of Biotechnology, 136, S327-S327.
Zille, A., Ramalho, P., Tzanov, T., Millward, R., Aires, V., Cardoso, M.H., Ramalho, M.T., Gübitz, G., M. , Cavaco-Paulo, A., 2004. Predicting Dye Biodegradation from Redox Potentials. Biotechnology Progress, 20, 1588-1592.
Zouboulis, A.I., Xiao-Li, C., Katsoyiannis, I.A., 2004. The application of bioflocculant for the removal of humic acids from stabilized landfill leachates. Journal of Environmental Management, 70, 35-41.

Part III
Optimization of Decolourization Equilibrium and Cyclic Voltammetry


This part focuses the optimization of the reactive dyes degradation equilibrium by pure
laccase (DeniLite II Base) and by a commercial laccase formulation (DeniLite II S) in batch
reactors. The best working conditions are established and voltammetric studies are performed
in order to help predict the ability of the laccase to degrade the reactive dyes.
In part III. 1 the decolourization of six reactive textile dyes (reactive blue 114, reactive
black 5, reactive yellow 15, reactive yellow 176, reactive red 180 and reactive red 239) by pure
laccase (DeniLite II Base) is optimized, studying the effect of adding five typical laccase
mediators and of the variation of its concentration, temperature and pH.
In parts III. 2 and III. 3 the degradation of the same reactive dyes by a commercial
laccase formulation, including the enzyme, a buffer and an enzyme mediator is optimized using
a three-level Box-Behnken full factorial design with three factors (pH, temperature and enzyme
concentration) combined with response surface methodology.
Finally, in part III. 4 cyclic voltammetry is applied to better understand the degradations
previously achieved and to try to predict the decolourization capacity of laccase by enzymes
and reactive dyes redox potentials. The ability of laccase for sequential decolourization of the
different dyes is also evaluated, in order to establish a reactor system that allows
decolourization over an extended period without addition of new enzyme.


Part III. 1 Optimization of reactive textile dyes
degradation by laccase-mediator system*
III. 1.1 Abstract
III. 1.2 Introduction
III. 1.3 Materials and Methods
III. 1.4 Results and Discussion
III. 1.5 Conclusions
III. 1.6 References
*based on: Tavares, A.P.M., Cristóvão, R.O., Loureiro, J.M., Boaventura, R.A.R., Macedo, E.A., 2008.
Optimisation of reactive textile dyes degradation by laccase-mediator system. Journal of Chemical
Technology and Biotechnology, 83, 1609-1615.


Part III – Optimization of Decolourization Equilibrium and Cyclic Voltammetry
45
III. 1 Optimization of reactive textile dyes degradation by
laccase-mediator system
III. 1.1 Abstract
In the textile industry, large quantities of intensely coloured and toxic effluents are
released, causing serious environmental pollution. Several biotechnological approaches have
been suggested to eliminate this pollution source in an eco-efficient manner. Laccase can be
used to decolourize dyes and its substrate range can be extended by inclusion of a mediator.
A screening using several laccase mediators (2,2-azinobis(3 ethylbenzothiazoline-6-
sulfonate) (ABTS), 1-hydroxybenzotriazole (HBT), N hydroxyacetanilide (NHA),
polioxometalates, violuric acid (VA) and (2,2,6,6- tetramethylpiperidin-1-yloxy) (TEMPO)) was
performed on the degradation of six reactive textile dyes. ABTS was the most effective mediator
leading to higher decolourization. The efficiency of ABTS depends on the type of dye, pH,
temperature and dye concentration. The optimum temperature and pH values were 35 ºC and
5.0, respectively, for maximum decolourization (above 70 %) of reactive black 5, reactive blue
114 and reactive yellow 15. For reactive red 239 the optimum conditions were found to be a
temperature of 40 ºC and pH of 4.5 (above 56 % decolourization). ABTS has no effect at low
concentrations, except for reactive blue 114, where it resulted in the best decolourization (93
%). A comparison of decolourization based on the percentage absorbance reduction at the
maximum absorbance wavelength of each dye and throughout the visible spectrum was made.
These results suggest that the laccase mediator system could be used to treat textile
dying wastewaters.
III. 1. 2 Introduction
In textile industry, colour is applied to finished products through dyeing, resulting in the
generation of different wastewaters. During the process textile industries release large
quantities (about 10 % of the global wastewater) of intensely coloured and toxic effluents
(O’Neill et al., 1999), which cause serious environmental pollution. The rivers water quality
depends on the colour and transparency of water. The dyes change the absorption and
reflection of sunlight on the water, negatively affecting the photosynthesis. Additionally, there
are other quality indicators such as the presence of colourless contaminants and biological
oxygen demand (BOD) that are also important to evaluate the water quality. A number of
biotechnological approaches have been suggested with potential interest to eliminate this
pollution source in an eco-efficient manner (Wesenberg et al., 2003). It is known that white-rot
fungus or lignolytic enzymes (e.g. Mn peroxidase, Lignin peroxidase and Laccase) could be
used to decolourize dyes (Amaral et al., 2004; Lan et al., 2006; Mielgo et al., 2003; Osma et al.,

Part III – Optimization of Decolourization Equilibrium and Cyclic Voltammetry
46
2007) as well as in pulp and paper industry (Arias et al., 2003; Font et al, 2003). Laccase is
principally produced by white-rot fungus including T. versicolor (Tavares et al., 2005).
Laccase (p-diphenol oxidase, EC 1.10.3.2) is a multi-copper oxidase, belonging to a
family of enzymes, called the large blue copper proteins. The range of substrates which laccase
can attack are any phenolic substrates such as p-diphenol (Thurston, 1994). Laccase alone has
a limited effect on textile dye degradation due to its specificity for phenolic compounds, however
the range of laccase substrates can be extended to nonphenolic compounds by inclusion of a
specific compound, called mediator, such as 2,2-azinobis(3-ethylbenzothiazoline-6-sulfonate)
(ABTS) (Wong and Yu, 1999), 1-hydroxybenzotriazole (HBT) (Murugesan et al., 2007), and N-
hydroxyacetanilide (NHA) (Chakar and Ragauskas, 2004), polioxometalates (Gamelas et al.,
2005; Tavares et al., 2004), violuric acid (VA) (Soares et al., 2002) and (2,2,6,6-
tetramethylpiperidin-1-yloxy) (TEMPO) (Fabbrini et al., 2002). Within the past several years,
laccase-mediator system (LMS) has received must interest from the textile industry (Soares et
al., 2001) and from the pulp and paper industries (Gutierrez et al., 2006) for application in
environmentally friendly bleaching processes.
The role of mediators in enzymatic catalytic oxidation by laccase is described by redox
cycles as shown in Figure III. 1.1.
Figure III. 1.1 – Representation of dye degradation by laccase mediator system.
The mediator is a compound with low molecular weight, which acts as an electron
carrier. Once it is oxidised by the enzyme, it diffuses away from the catalytic system and in turn
oxidises any substrate that, due to its size, could not be directly oxidised by the enzyme (Call
and Mucke, 1997).
The aim of this work is to optimize the dye degradation of six reactive dyes typically
used in Portuguese textile industries, namely C.I. Reactive Black 5 (RB5), C.I. Reactive Blue
114 (RB114), C.I. Reactive Yellow 15 (RY15), C.I. Reactive Yellow 176 (RY176), C.I. Reactive
Red 180 (RR180) and C.I. Reactive Red 239 (RR239). For this purpose five traditional laccase
mediators, temperature, pH and mediator concentrations were tested in order to evaluate the
decolourization by LMS.

Part III – Optimization of Decolourization Equilibrium and Cyclic Voltammetry
47
III. 1. 3 Materials and Methods
III. 1.3.1 Chemicals and enzyme
Textile Dyes: reactive black 5 (Remazol Black B), reactive yellow 176 (Remazol Yellow
3RS), reactive yellow 15 (Remazol Yellow GR), reactive red 239 (Remazol Brilliant Red 3BS),
reactive red 180 (Remazol Brilliant Red F3B) and reactive blue 114 (Levafix Brilliant Blue E-
BRA) were kindly provided by DyStar (Portugal). Information on dyes is given in Table III. 1.1.
The chemical structures of reactive yellow 176 and reactive blue 114 are not provided by
DyStar and are not found in the literature.
Enzyme: Commercial laccase (Denilite II Base; 800 U/g) from genetically modified
Aspergillus was kindly provided by Novozymes (Denmark).
Enzyme Mediators: 2,2-azinobis(3-ethylbenzothiazoline-6-sulfonic acid) (ABTS); violuric
acid (VA); N-hydroxyacetanilide (NHA); 1-hydroxybenzotriazole (HBT) and 2,2,6,6-
tetramethylpiperidin-1-yloxy (TEMPO) were supplied by Sigma-Aldrich (Spain).
Table III. 1.1a – Dyes employed in the study.
Dyes
Colour index Reactive Black 5 Reactive Yellow 15 Reactive Yellow 176
Abbreviation RB5 RY15 RY176
Trade name Remazol Black B Remazol Yellow GR Remazol Yellow 3RS
Chemical structure
na
λλλλmax (nm) 579 416 421
Purity (%) 70-80 na* na
Reference (Peralta-Zamora et al.,
2003) † (Voncina and Le-Marechal,
2003) -
*na: not available; †Reference only for dye structures

Part III – Optimization of Decolourization Equilibrium and Cyclic Voltammetry
48
Table III. 1.1b – Dyes employed in the study (continued).
Dyes
Colour index Reactive Red 180 Reactive Red 239 Reactive Blue 114
Abbreviation RR180 RR239 RB114
Trade name Remazol Brilliant Red F3B Remazol Brilliant Red 3BS Levafix Brilliant Blue E-BRA
Chemical structure
na
λλλλmax (nm) 540 542 593
Purity (%) na* na 65-75
Reference (Hamlin et al., 1999) † (Liu and Chiou, 2005) -
*na: not available; †Reference only for dye structures
III. 1.3.2 Dye decolourization experiments
III. 1.3.2.1 Mediator screening
The reaction mixture for mediator screening consisted of an aqueous solution of each
dye (50 mg/L), laccase (0.2 U/mL), redox mediator ABTS; HBT; TEMPO; NHA and VA (0.1 mM)
and 50 mM phosphate buffer (pH 5.0) in a final volume of 25 mL, as shown in Figure III. 1.2.
The reactions were incubated at 25 ºC with stirring during one day (necessary time to attain the
equilibrium). Control without mediator and control without laccase were carried out in parallel.
1.25 mL of dye from stock solution (1 g/L) was added to a specific volume of mediator (stock
solution 1 mM) and buffer in order to obtain the desired concentration to a final reaction volume
of 25 mL.
Figure III. 1.2 – Initial solutions of each dye (RY176, RY15, RR239, RR180, RB114 and RB5).

Part III – Optimization of Decolourization Equilibrium and Cyclic Voltammetry
49
III. 1.3.2.2 Effect of temperature and pH
To study the effect of temperature and pH on decolourization of the six textile dyes, 50
mg/L of each dye, 0.1 mM of ABTS as mediator and 0.2 U/mL of commercial laccase were
incubated in 25 mL Erlenmeyer flasks under stirring for 24 h. The effect of temperature was
studied in phosphate buffer (50 mM) pH 5.0. The dye solution was incubated at 20, 30, 35, 40
and 50 ºC under orbital stirring at 320 rpm. An IKA stirrer (KS 130 basic) was used in all
experiments. The dye concentration was chosen according to the values supplied by DyStar
(Portugal), which is a typical dye concentration found in textile industry wastewater.
The effect of pH was studied at 40 ºC by the incubation of dye solution in the following
buffers: 50 mM of citrate/phosphate for pH 3.0, 4.0 and 4.5; 50 mM of phosphate for pH 5.0,
5.5, 6.0 and 7.0. Assays were done twice.
III. 1.3.2.3 Effect of initial mediator concentration
To determine the effect of ABTS concentration on the decolourization of the six textile
dyes, concentrations from 0.001 to 0.5 mM were tested. The reaction mixture consisted of 50
mg/l of each dye and 0.2 U/mL of commercial laccase. It was incubated in 25 mL Erlenmeyer
flasks at 40ºC with phosphate buffer (50 mM/pH 5.0) with orbital stirring at 320 rpm for 24 h.
Assays were done in triplicate.
III. 1.3.2.4 Determination of dye degradation
Dye decolourization by LMS was determined by monitoring the decrease in the
absorbance peak at the maximum wavelength for each dye: reactive black 5 (579 nm), reactive
yellow 176 (421 nm), reactive yellow 15 (416 nm), reactive red 239 (542 nm), reactive red 180
(540 nm) and reactive blue 114 (593 nm) or calculating (by integration of absorbance between
350 to 750 nm) the total area under the plot. UV-visible spectrophotometer (Thermo, model
UV1) was used in all experiments. Decolourization is reported as: % decolourization = (Ai −
Af)/Ai × 100, where Ai is the initial absorbance or total area from the initial spectrum and Af is the
final absorbance of the dye or total area from the final spectrum.
III. 1.4 Results and Discussion
III. 1.4.1 Mediator screening
LMS has been already described in several works (Riva, 2006) for delignification
processes, but few research studies on its use for reactive textile dyes degradation are
available. In order to evaluate the best mediator for the decolourization of six reactive textile
dyes, 5 compounds (HBT, ABTS, NHA, VA and TEMPO) were screened as redox mediators of

Part III – Optimization of Decolourization Equilibrium and Cyclic Voltammetry
50
laccase. In these assays, a decrease in the intensity of absorption at the maximum wavelength
(λmax) of each dye was shown.
According to the results in Table III. 1.2, the experiments with laccase and without
mediator did not decolourize any dye during the incubation time, demonstrating that these
reactive dyes were not primary substrates of laccase. However when redox mediator was
introduced, the catalytic mechanism of decolourization started, the extent depending on the dye
and on the mediator. In addition, experiments without laccase and with mediator did not
decolourize the dyes. These results indicated that oxidation of reactive dyes occurs only when
laccase and mediator are both present and the different results for the same mediator show that
the decolourization probably depends on the structure of the dye (Almansa et al., 2004).
RR180, RY176 and RR239 presented much more resistance to decolourization leading to only
a small degradation i.e., a decolourization lower than 5 % for all mediators employed.
Significant dye degradation was observed for RY15, RB5 and RB114 when ABTS was used,
producing decolourization of 21, 42 and 70 % respectively.
Table III. 1.2 – Mediator screening for reactive dye degradation by laccase.
Reactive Dye
Dye degradation (%)
No mediator HBT ABTS TEMPO NHA VA
RB114 NDa 0.3 70 ND 1.5 5.0
RR180 ND 0.6 ND 1.7 ND 2.3
RR239 ND 0.3 4.7 1.8 0.3 4.0
RB5 ND 0.2 42 1.5 ND 2.5
RY15 ND 2.7 21 2.0 0.8 0.2
RY176 ND 1.8 ND 1.6 ND ND a ND, not detected.
Laccase cannot decolourize these reactive dyes directly; a mediator is necessary.
Reasons may be that the redox potential of the six reactive dyes is higher than that of laccase
or the dyes cannot access the active site of the enzyme because of their steric structure. Thus a
mediator is necessary to transfer electrons from the dye to the enzyme, as explained below.
The redox mediators used in this work were previously established as appropriate
mediators of laccase (Camarero et al., 2005; Couto et al., 2005). However, in this study the
results show that ABTS was a more effective mediator than the others for the oxidative
degradation of the reactive textile dyes. The mechanism of dye oxidation by LMS is shown in
Figure III. 1.1. First laccase oxidises ABTS to a cationic radical, ABTS.+ then to the dication
ABTS2+ (Bourbonnais and Paice, 1990). The oxidised ABTS degrades the substrate. The
reduced laccase returns to the original status by transferring the electrons to oxygen and
producing water. Bourbonnais et al. (1998) showed that the dication (ABTS2+) is responsible for
the oxidation of the non phenolic substrates. In this catalytic system the small molecules of the

Part III – Optimization of Decolourization Equilibrium and Cyclic Voltammetry
51
mediator act as electron carriers between the laccase and the dye. Thus, ABTS was selected
as a redox mediator to optimize the conditions of textile dyes degradation by laccase.
III. 1.4.2 Effect of temperature on textile dye degradation
To determine the optimum temperature for dye decolourization a temperature range of
25–50 ºC was examined for a LMS with ABTS as redox mediator. In these experiments pH and
ABTS concentration were fixed at 5.0 and 0.1 mM, respectively. In these conditions no
degradation was observed for RY176. As seen in Figure III. 1.3 the optimum temperature for
RB5, RY15 and RB115 decolourization was 35 ºC attaining a maximum decolourization of 70,
74 and 76 %, respectively. However, the optimum temperature for RR239 was 40 ºC with 56 %
of maximum decolourization. Within the optimal values of temperature, the lowest temperature
was selected as the optimum temperature since this leads to lower energy costs. No
improvement in dye degradation was observed at temperatures above 40 ºC, except for RR180
where a low degradation of 9.7 % was detected at 50 ºC. At lower temperature (20 ºC) no
decolourization was observed, except for RB5 (36 %).
Figure III. 1.3 – Effect of temperature on the decolourization of the reactive dyes: Blue 114 (♦), Black 5
(××××), Red 239 (■), Red 180 (�), Yellow 15 (�) by laccase mediator system.
The results show that the decolourization of reactive dyes by LMS is very sensitive to
the temperature depending on the kind of dye. According to technical literature from DeniLite,
the best temperature for the decolourization of indigo in denim process of bleaching is 60-70 ºC.
Zhang et al. (2006) show that the optimum temperature for decolourization of Acid Green 27,
Acid Violet 7 and Indigo Carmine with laccase and ABTS was 70 ºC. In all the assays carried
out in this study the optimum temperature was 35-40 ºC. Temperatures above 50 ºC were not
studied since results shown that the increase from 40 ºC to 50 ºC promoted a marginal increase
in dye decolourization and also due the high energetic costs to textile industry. All further
decolourization studies were carried out at the optimum temperature of 40 ºC.

Part III – Optimization of Decolourization Equilibrium and Cyclic Voltammetry
52
III. 1.4.3 Effect of pH on textile dye degradation
The effect of pH was studied at pH values 3.0, 4.0, 5.0, 6.0 and 7.0. The temperature
was fixed at 40 ºC and the ABTS concentration was fixed in 0.1 mM. Figure III. 1.4 shows the
variations in textile decolourization at different pH values. RR180 and RY176 were not
decolourized under these conditions. The results indicate that a pH increase from 3.0 to 5.0
enhanced the decolourization of RB5, RB114 and RY15. As can be observed, the
decolourization attained a maximum at pH 5.0 for RB5 (71 %), RB114 (84 %) and RY15 (77 %).
Dye decolourization was almost constant over the pH range 5.5 to 7.0. Optimum pH for RR239
was shown to be 4.5 (colour reduction 58 %) with a rapid decrease in decolourization for pH
above 5.0.
Figure III. 1.4 – Effect of pH on the decolourization of the reactive dyes: Blue 114 (♦), Black 5 (××××), Red 239
(■), Yellow 15 (�) by laccase mediator system.
At pH 3.0 (2 pH units below the optimum) no decolourization was observed. At 2 units
above the optimum pH (pH 7.0), RR239 dye showed no decolourization, dyes RY15 and RB114
showed a slight reduction in the decolourization and RB5 dye did not show any reduction in
decolourization. These results suggest that acidic pH values may influence the stability of the
enzyme causing denaturation. According to Tavares et al. (2006) laccase lost stability at pH of
3.0, while for pH 5.0 no loss of enzyme activity was observed.
Based on these results, pH 4.5 and 5.0 were used for subsequent decolourization
assays for RR239 and for RB5, RB114 and RY15, respectively.
III. 1.4.4 Effect of mediator concentration on textile dye degradation
The influence of mediator concentrations (0.001-0.5 mM) on the decolourization of RB5,
RR239, RB114 and RY15 was monitored over the visible spectrum (350-700 nm). For RR180

Part III – Optimization of Decolourization Equilibrium and Cyclic Voltammetry
53
and RY176 no degradation was observed. The absorption spectra in Figure III. 1.5 clearly show
that the decolourization of all dyes was very dependent on ABTS concentration.
Figure III. 1.5 – Visible absorption spectrum of RB5, RY15, RB114 and RR239 decolourization by laccase
mediator system at different ABTS concentrations: (a) initial dye solution; (b) 0.001 mM; (c) 0.01 mM; (d)
0.075 mM; (e) 0.15 mM; (f) 0.2mM; (g) 0.3 mM.
The decrease in the peak of maximum absorbance corresponds to degradation of the
respective dye. It was observed that all spectra (except for RY15) show a new peak that
emerged near 420 nm when high ABTS concentrations were employed (above 0.2 mM). This
peak corresponds to the stable dark green cationic radical formed by the oxidation of the ABTS
by laccase, ABTS•+. In these situations a lower or loss of dye degradation was observed, while
for the other ABTS concentrations, the dark green colour of solution disappears during the
reaction, as it is possible to observe from Figure III. 1.6 which presents as example the reactive
blue 114 degradation.
Figure III. 1.6 – Reactive blue 114 solutions after treatment with increasing ABTS concentrations (from left
to the right).

Part III – Optimization of Decolourization Equilibrium and Cyclic Voltammetry
54
The best absorbance spectrum was obtained for RB114 in the presence of ABTS 0.001
mM where a very low absorbance was detected (Figure III. 1.5 (RB114 - b)) throughout the
spectrum, which means a decolourization of 87 % relative to peak weight or 73 % relative to
area, while for the other dyes this concentration did not promote any decolourization (Table III.
1.3). For RY15 a change in the spectrum was observed. An increase in the intensity of the peak
at 570 nm appears at the end of reaction. This peak corresponds to light grey colour formed
during the reaction, probably due to coupling between the reaction products or polymerization
(Zille et al., 2005).
Most research studies related to dye degradation present results as the percentage of
absorbance reduction at the maximum wavelength of the dye. In this work, a comparison
between dye decolourization by absorbance reduction at the maximum absorbance wavelength
and total colour removal based on the overall spectrum is presented. The results are shown in
Table III. 1.3. The decolourization based on the whole spectrum range (area under the curve)
was less efficient when compared with the decolourization calculated as the absorbance
reduction at the maximum wavelength (peak). Efficiency results from the application of the first
method (peak) are between 9 and 14% higher than those obtained by the second method
(area). These results are expected since the decolourization of RB5, RB114 and RY15 was
never completed and solutions of pale purple (RB5, RB114) and light grey (RY15) were
obtained.
At high ABTS concentration (0.5 mM) decolourization did not occur for all dyes tested
(Table III. 1.3), except for RB5 (assuming dye degradation at their maximum wavelength).
These results indicate that this concentration probably inhibits enzyme activity.
The optimum ABTS concentration for reactive dye decolourization by LMS was 0.1 mM
(Table III. 1.3) with colour reductions of 73, 59 and 76 % for RB5, RR239 and RY15,
respectively. A very interesting result was obtained for RB114: no residual pale purple colour
was observed with 0.001 mM ABTS (Figure III. 1.7) and decolourization was much faster; the
decolourization was completed in approximately 30 min..
Figure III. 1.7 – Initial and treated solutions of reactive blue 114 with 0.001 mM ABTS.

Part III – Optimization of Decolourization Equilibrium and Cyclic Voltammetry
55
Table III. 1.3 - Comparison between dye decolourization (%) based on the absorbance peak at maximum
wavelength and on the area integration over all dye spectrum range.
ABTS (mM)
RB5 RR239 RY15 RB114
Peak Area Peak Area Peak Area Peak Area
0.001 NDa ND ND ND ND ND 87± 1.5b 73 ± 3.7
0.01 32 ± 2.9 22 ± 8.5 14 ± 6.2 8.0 ± 1.9 7.0 ± 2.2 8.2 ± 3.1 93 ± 1.2 66 ± 1.9
0.05 72 ± 6.5 56 ± 11.9 53 ± 1.2 47 ± 0.2 51 ± 0.8 52 ± 1.4 88 ± 2.0 46 ± 3.6
0.1 73 ± 2.8 63 ± 5.7 59 ± 1.8 50 ± 2.1 76 ± 1.3 65 ± 2.1 80 ± 1.8 45 ± 0.2
0.15 72 ± 2.1 61 ± 4.0 59 ± 0.7 42 ± 2.0 78 ± 0.8 56 ± 1.5 70 ± 2.2 38 ± 2.4
0.2 67 ± 3.5 54 ± 5.3 46 ± 6.6 17 ± 10.6 75 ± 0.2 42 ± 1.3 62 ± 4.7 30 ± 4.7
0.3 61 ± 3.9 40 ± 7.4 20 ± 8.6 ND 60 ± 4.4 22 ± 7.6 5.2 ± 4.1 ND
0.5 35 ± 4.1 ND ND ND ND ND ND ND
a ND, not detected. b Standard deviation
These results are very promising and reveal the potential of LMS for reactive dye
decolourization since it has been reported that reactive dyes are only 10 % (on average)
removed by conventional treatments, such as adsorption, and also are not easily biodegradable
(Pierce, 1994).
III. 1.5 Conclusions
Among the different mediators tested, ABTS was the most effective, especially in the
decolourization of reactive black 5, reactive red 239, reactive blue 114 and reactive yellow 15.
The optimization of temperature, pH and mediator concentration show the great potential of
commercial laccase (DeniLite II Base) in mediator treatment under the conditions used. These
results suggest that LMS could be used for treating textile dyeing wastewaters, particularly as a
polishing process for water recycling.
III. 1.6 References Almansa, E., Kandelbauer, A., Pereira, L., Cavaco-Paulo, A., Guebitz, G.M., 2004. Influence of structure on dye degradation with laccase mediator systems. Biocatalysis and Biotransformation, 22, 315-324.
Amaral, P.F.F., Fernandes, D.L.A., Tavares, A.P.M., Xavier, A.B.M.R., Cammarota, M.C., Coutinho, J.A.P., Coelho, M.A.Z., 2004. Decolorization of dyes from textile wastewater by Trametes versicolor. Environmental Technology, 25, 1313-1320.

Part III – Optimization of Decolourization Equilibrium and Cyclic Voltammetry
56
Arias, M.E., Arenas, M., Rodríguez, J., Soliveri, J., Ball, A.S., Hernández, M., 2003. Kraft pulp biobleaching and mediated oxidation of a nonphenolic substrate by laccase from Streptomyces cyaneus CECT 3335. Applied Environmental Microbiology, 69, 1953-1958.
Bourbonnais, R., Paice, M.G., 1990. Oxidation of non-phenolic substrates. An expanded role for laccase in lignin biodegradation. FEBS Letters, 267, 99-102.
Bourbonnais, R., Leech, D., Paice, M.G., 1998. Electrochemical analysis of the interactions of laccase mediators with lignin model compounds. Biochimica et Biophysica Acta, 1379, 381-390.
Call, H.P., Mucke, I., 1997. History, overview and applications of mediated lignolytic systems, especially laccase-mediator-systems (Lignozym®-process). Journal of Biotechnology, 53, 163–202.
Camarero, S., Ibarra, D., Martínez, M.J., Martínez, A.T., 2000. Lignin-derived compounds as efficient laccase mediators for decolorization of different types of recalcitrant dyes. Applied and Environmental Microbiology, 71, 1775-1784.
Chakar, F.S., Ragauskas, A.J., 2004. Biobleaching chemistry of laccase-mediator systems on high-lignin-content kraft pulps. Canadian Journal of Chemistry, 82, 344-352.
Couto, S.R., Sanromán, M., Gübitz, G.M., 2005. Influence of redox mediators and metal ions on synthetic acid dye decolourization by crude laccase from Trametes hirsuta. Chemosphere, 58, 417-422.
Fabbrini, M., Galli, C., Gentili, P., 2002. Comparing the catalytic efficiency of some mediators of laccase. Journal of Molecular Catalysis B – Enzymes, 16, 231-240.
Font, X., Caminal, G., Gabarrell, X., Romero, S., 2003. Black liquor detoxification by laccase of Trametes versicolor pellets. Journal of Chemical Technology and Biotechnology, 78, 548-554.
Gamelas, J.A.F., Tavares, A.P.M., Evtuguin, D.V., Xavier, A.M.B., 2005. Oxygen bleaching of kraft pulp with polyoxometalates and laccase applying a novel multi-stage process. Journal of Molecular Catalysis B: Enzymes, 33, 57-64.
Gutierrez, A., Del Rio, J.C., Rencoret, J., Ibarra, D., Martinez, A.T., 2006. Main lipophilic extractives in different paper pulp types can be removed using the laccase-mediator system. Applied Microbiology and Biotechnology, 72, 845-851.
Hamlin, J.D., Phillips, D.A.S., Whiting, A., 1999. UV/Visible spectroscopic studies of the effects of common salt and urea upon reactive dye solutions. Dyes and Pigments, 41, 137-142.
Lan, J., Huang, X., Hu, M., Li, Y., Qu, Y., Gao, P., Wu, D., 2006. High efficient degradation of dyes with lignin peroxidase coupled with glucose oxidase. Journal of Biotechnology, 123, 483-490.
Liu, H.L., Chiou, Y.R., 2005. Optimal decolorization efficiency of Reactive Red 239 by UV/TiO2 photocatalytic process coupled with response surface methodology. Chemical Engineering Journal, 112, 173-179.
Mielgo, I., López, C., Moreira, M.T., Feijoo, G., Lema, J.M., 2003. Oxidative degradation of azo dyes by manganese peroxidase under optimized conditions. Biotechnology Progress, 19, 325-331.
Murugesan, K., Dhamija, A., Nam, I.H., Kim, Y.M., Chang, Y.S., 2007. Decolourization of reactive black 5 by laccase: Optimization by response surface methodology. Dyes and Pigments, 75, 176-184.
O’Neill, C., Hawkes, F.R., Hawkes, D.L., Lourenço, N.D., Pinheiro, H.M., Delée, W.J., 1999. Colour in textile effluents – sources, measurement, discharge consents and simulation: a review. Journal of Chemical Technology andl Biotechnology, 74, 1009-1018.
Osma, J.F., Herrera, J.L.T., Couto, S.R., 2007. Banana skin: A novel waste for laccase production by Trametes pubescens under solid-state conditions. Application to synthetic dye decolouration. Dyes and Pigments, 75, 32-37.
Peralta-Zamora, P., Pereira, C.M., Tiburtius, E.R.L., Moraes, S.G., Rosa, M.A., Minussi, R.C., et al., 2003. Decolorization of reactive dyes by immobilized laccase. Applied Catalysis B: Environmental, 42, 131-144.
Pierce, J., 1994. Colour in textile effluents-the origins of the problem. Journal of Society of Dyers and Colourists, 110, 131-133.
Riva, S., 2006. Laccases: blue enzymes for green chemistry. Trends of Biotechnology, 24, 219-226.
Soares, G.M.B., De Amorim, M.T.P., Costa-Ferreira, M., 2001. Use of laccase together with redox mediators to decolourize Remazol Brilliant Blue R. Journal of Biotechnology, 89, 123-129.
Soares, G.M.B., De Amorim, M.T.P., Hrdina, R., Costa-Ferreira, M., 2002. Studies on the biotransformation of novel disazo dyes by laccase. Process Biochemistry, 37, 581-587.
Part III – Optimization of Decolourization Equilibrium and Cyclic Voltammetry
57
Tavares, A.P.M., Gamelas, J.A.F., Gaspar, A., Evtuguin, D.V., Xavier, A.M.R.B., 2004. A novel approach for the oxidative catalysis employing polyoxometalate-laccase system: application to the oxygen bleaching of kraft pulp. Catalysis Communications, 5, 485-489.
Tavares, A.P.M., Coelho, M.A.Z., Coutinho, J.A.P., Xavier A.M.R.B., 2005. Laccase improvement in submerged cultivation: induced production and kinetic modelling. Journal of Chemical Technology and Biotechnology, 80, 669-676.
Tavares, A.P.M., Coelho, M.A.Z., Agapito, M.S.M., Coutinho, J.A.P., Xavier, A.M.R.B., 2006. Optimization and modeling of laccase production by Trametes versicolor in a bioreactor using statistical experimental design. Applied Biochemistry and Biotechnology, 134, 233-248.
Thurston, C.F., 1994. The structure and function of fungal laccases. Microbiology, 140, 19-26.
Voncina, D.B., Le-Marechal, A.M., 2003. Reactive dye decolorization using combined ultrasound/H2O2. Dyes and Pigments, 59, 173-179.
Wesenberg, D., Kyriakides, I., Agathos, S.N., 2003. White-rot fungi and their enzymes for the treatment of industrial dye effluents. Biotechnology Advances, 22, 161–187.
Wong, Y., Yu, J., 1999. Laccase-catalyzed decolorization of synthetic dyes. Water Research, 16, 3512-3520.
Zhang, M., Wu, F., Wei, Z., Xiao, Y., Gonga, W., 2006. Characterization and decolorization ability of a laccase from Panus rudis. Enzyme Microbiology and Technology, 39, 92-97.
Zille, A., Górnacka, B., Rehorek, A., Cavaco-Paulo, A., 2005. Degradation of azo dyes by Trametes villosa laccase over long periods of oxidative conditions. Applied and Environmental Microbiology, 71, 6711–6718.


Part III. 2 Application of statistical
experimental methodology to optimize reactive
dye decolourization by commercial laccase*
III. 2.1 Abstract
III. 2.2 Introduction
III. 2.3 Materials and Methods
III. 2.4 Results and Discussion
III. 2.5 Conclusions
III. 2.6 References
*based on: Tavares, A.P.M., Cristovao, R.O., Loureiro, J.M., Boaventura, R.A.R., Macedo, E.A., 2009. Application of statistical experimental methodology to optimize reactive dye decolourization by commercial laccase. Journal of Hazardous Materials, 162, 1255-1260.


Part III – Optimization of Decolourization Equilibrium and Cyclic Voltammetry
61
III. 2 Application of statistical experimental methodology to
optimize reactive dye decolourization by commercial laccase
III. 2.1 Abstract
Three-level Box–Behnken factorial design with three factors (pH, temperature and
enzyme concentration) combined with response surface methodology (RSM) was applied to
optimize the dye degradation of reactive red 239 (RR239), reactive yellow 15 (RY15), reactive
blue 114 (RB114) and reactive black 5 (RB5) dyes by commercial laccase. Mathematical
models were developed for each dye showing the effect of each factor and their interactions on
colour removal. The model predicted for RY15 that a decolourization above 90 % (after 24
hours) could be obtained when the enzyme concentration, temperature and pH were set at
109.8 U/L, 39.2 ºC and 6.6, respectively; whilst for RB114, RR239 and RB5 the temperature
and enzyme concentration did not affect the decolourization (>90 %) in the considered range
and optimum pH value was found at 5.5-7.0, 7.0-7.5 and 7.0-7.5, respectively. These predicted
values were also experimentally validated. Average final values of responses were in good
agreement with calculated values, thus confirming the reliability of the models of RY15, RB114,
RR239 and RB5 decolourization.
III. 2.2 Introduction
Reactive dyes are extensively used in textile industries to colour the cellulosic fibres.
These compounds are chemically classified as azo, anthraquinone, formazan, phthalocyanine,
oxazine and basic (Husain, 2006; Wesenberg et al., 2003). The dyes are first adsorbed on
cellulose and then react with the fibres. However, 10-50 % (corresponding to a degree of
fixation between 50-90 %) of the initial dye load will be present in the dye bath effluent giving a
highly coloured effluent causing serious types of problems in the environment (Al-Degs et al.,
2000).
A number of references related to the applicability of chemical and physical methods
such as precipitation, adsorption, filtration, oxidative process, etc. (Slokar and Le Marechal,
1998; Vandevivere et al., 1998) for removing reactive dyes is available. Recent studies have
shown that fungi or their enzymes are able to decolourize and detoxify industrial dyes (Amaral
et al., 2004; Cristóvão et al., 2008; Romero et al., 2006). However, enzymatic treatments are
not still commonly used in the textile industries.
Enzyme methods applied in dye degradation have low energy costs, are easy to control
and have low impact on ecosystems. Laccase has been studied in the oxidation of textile dyes.
Laccase (benzendiol:oxygen oxidoreductase, EC 1.10.3.2) belongs to the group of oxidative
enzymes that catalyse the oxidation of phenolic compounds, polyphenols, and aromatic amines

Part III – Optimization of Decolourization Equilibrium and Cyclic Voltammetry
62
(Thurston, 1994). Studies have shown that the range of substrate specificity of laccases can be
extended to non-phenolic substrates by addition of redox mediators (Tavares et al., 2008) such
as 2,2-azinobis(3-ethylbenzothiazoline-6-sulfonate) (ABTS) (Wong and Yu, 1999), 1-
hydroxybenzotriazole (HBT) (Murugesan et al., 2007), polioxometalates (Gamelas et al., 2005;
Tavares et al., 2004) and violuric acid (Soares et al., 2002).
The application of experimental design and response surface methodology (RSM) in
textile effluent treatment process can result in improved decolourization, reduced process
variability, time and overall costs. Additionally the factors that influence the experiments are
identified, optimized and possible synergic or antagonistic interactions that may exist between
factors can be evaluated (Box et al., 1978). However, only a few recent studies aiming the
optimization of textile dye decolourization by enzymatic catalysis are available (Murugesan et
al., 2007). The accuracy of the models generated is evaluated by the coefficient of
determination R2. Response surface methodology is a multivariate technique that
mathematically fits the experimental domain studied in the theoretical design through a
response function. RSM has been extensively studied on biotechnology namely optimization of
medium composition (Tavares et al., 2005; Weuster-Botz, 2000), fermentations (Medeiros et al.,
2000; Tavares et al., 2006) and food process (Yann et al., 2005), etc. However, a few reports
are presented for dye degradation optimization by enzymatic catalysis with RSM. The most
common and efficient design used in response surface modelling is Box–Behnken design. It has
three levels per factor, but avoids the corners of the space, and fills in the combinations of
centre and extreme levels in which the optimal conditions for an experiment are found (Box and
Behnken, 1960; Hanrahan and Lu, 2006).
In this study a three-level Box–Behnken full factorial design was employed with RSM to
maximize the decolourization of four reactive textile dyes, reactive blue 114 (B114), reactive
yellow 15 (RY15), reactive red 239 (RR239) and reactive black 5 (RB5) by enzymatic catalysis
with a commercial laccase.
III. 2.3 Materials and Methods
III. 2.3.1 Chemicals and enzyme
Textile Dyes: Reactive yellow 15 (Remazol Yellow GR), reactive red 239 (Remazol
Brilliant Red 3BS), reactive blue 114 (Levafix Brilliant Blue E-BRA) and reactive black 5
(Remazol Black B) were kindly provided by DyStar (Porto, Portugal).
Enzyme: Commercial laccase formulation (DeniLite II S; 120 U/g and DeniLite II Base;
800 U/g) from genetically modified Aspergillus was kindly provided by Novozymes. These
formulations are used for indigo dye decolourization in denim finishing operations and include a
buffer (both) and an enzyme mediator (DeniLite II S).

Part III – Optimization of Decolourization Equilibrium and Cyclic Voltammetry
63
III. 2.3.2 Factorial design
A 33 Box–Behnken full factorial design, including three replicates at central point, was
carried out in order to study the factors (pH, temperature, enzyme concentration) that influence
the decolourization by commercial laccase (Tables III. 2.1 and III. 2.2). The temperature and pH
factors were chosen because it is well known that they are the factors affecting more the
reaction. The enzyme concentration factor was chosen because the reactions of dyes
degradation are unknown and because of the unknown composition of the commercial laccase
formulation (DeniLite II S) that, besides the enzyme, includes a buffer, an enzyme mediator and
surfactants.
This design permits to establish both linear and quadratic models, determining their
accuracies by comparing lacks of fit of model predictions to experimental points with
experimental error estimated from replicates at the central point. The accuracy and general
ability of the polynomial model was evaluated by the coefficient of determination R2. Tables III.
2.1 and III. 2.2 give the factors, their values, and the experimental design, respectively. The
experimental Box–Behnken design, analysis of variance (ANOVA) and 3D response surface
were carried out using the software Statistical v.5.1 (Statsoft Inc.). Equation (III. 2.1) describes
the regression model of the present system, which includes the interaction terms:
Ŷŷ = β0 + β1x1+β2x2 + β3x3 + β12x1x2 + β13x1x3 + β23x2x3
+ β11x21 + β22x
22 + β33x
23 (III. 2.1)
where Ŷŷ is the predicted response, i.e. the colour removal; x1, x2 and x3 are the coded levels of
the independent factors temperature, pH and enzyme concentration. The regression coefficients
are: β0 the intercept term; β1, β2 and β3 the coefficients for linear effects; β12, β13, β23 the
coefficients for interaction effects and β11, β22, β33 the coefficients for quadratic effects. The
model evaluates the effect of each independent factor on the response.
III. 2.3.3 Dye decolourization experiments
To study the decolourization of the four textile dyes, solutions with concentration of 50
mg/L of each dye were incubated in 25 mL Erlenmeyer flasks under stirring during one day. Dye
degradation conditions are presented in Table III. 2.1 according to the experimental design
(Table III. 2.2): laccase concentrations (192, 96 and 48 U/L), temperature (25, 35 and 45 ºC)
and pH (3.0, 5.0 and 7.0). The pH values of dye solutions were established by preparation of
the buffers: 50 mM of citrate/di-sodium hydrogen phosphate for pH 3.0; 50 mM of di-sodium
hydrogen phosphate for pH 5.0 and pH 7.0.

Part III – Optimization of Decolourization Equilibrium and Cyclic Voltammetry
64
Table III. 2.1 – Factor levels for a 33 Box–Behnken factorial design
Coded factor
Factor Coded level
+1 0 -1
x1 Temperature (ºC) 45 35 25
x2 pH 7.0 5.0 3.0
x3 Enzyme (U/L) 192 96 48
III. 2.3.4 Determination of dye degradation
Dye decolourization by laccase was determined by monitoring the decrease in the
absorbance peak at the maximum wavelength (peak) for each dye: reactive yellow 15 (416 nm),
reactive red 239 (542 nm), reactive black 5 (579 nm) and reactive blue 114 (593 nm) or
calculating (by integration of absorbance between 350 to 750 nm) the total area (area) under
the plot. The first approach considers that absorbance reduction at maximum wavelength is
totally due to dye oxidation, not taking into account the dye fraction eventually converted to
other compounds. The second one takes into account the conversion of the dye molecules to
other compounds absorbing at different wavelengths and then the ratio of the area under the
visible spectrum is always equal or lower than the ratio of the absorbances at the peak. UV-
visible spectrophotometer (Thermo, model UV1) was used in all experiments. Decolourization is
reported as: % decolourization = (Ai − Af)/Ai × 100, where Ai is the initial absorbance or total
area from the initial spectrum and Af is the final absorbance or total area from the final
spectrum.
III. 2.4 Results and discussion In this study a commercial laccase formulation containing a specific mediator (DeniLite
II S) and pure laccase (DeniLite II Base) was used for degradation of RB114, RB5, RR239 and
RY15. Preliminary results had shown that pure laccase did not decolourize the four reactive
dyes studied (data not shown), indicating that the presence of mediator is required. Similarly to
this study, reports from literature show that laccase alone does not decolourize some types of
textile dyes (Kandelbauer et al., 2004; Rodríguez et al., 1999). Thus the further experiments for
the experimental design were carried out with DeniLite II S.
III. 2.4.1 Experimental design
In order to optimize the dye degradation, Box–Behnken full factorial design with three
factors (enzyme concentration, pH and temperature) was chosen. The levels of the factors and
the results from the 29 experiments for each dye are presented in Tables III. 2.1 and III. 2.2,
respectively.

Part III – Optimization of Decolourization Equilibrium and Cyclic Voltammetry
65
Using the experimental data, the second order polynomial model was fitted to
decolourization results (peak) of RR239, RY15, RB114 and RB5 and obtained in terms of coded
factors:
Ŷŷ (RY15) = 58.66 + 4.53x1 + 40.98x2 – 0.491x3 + 1.59x21 + 12.932x
22 + 2.59x
23 – 1.48x1x2 +
1.509x1x3 – 2.29x2x3 (III. 2.2)
Ŷŷ (RB114) = 58.76 + 1.02x1 + 45.82x2 – 2.62x3 – 0.312x21 + 19.35x
22 – 0.131x
23 + 0.381x1x2 +
0.402x1x3 – 1.71x2x3 (III. 2.3)
Ŷŷ (RR239) = 31.7 – 0.218x1 + 47.35x2 – 0.442x3 – 0.095x21 – 23.45x
22 – 0.048 x
23 – 0.317x1x2 +
0.308 x1x3 – 0.300x2x3 (III. 2.4)
Ŷŷ (RB5) = 74.62 + 3.24x1 + 13.96x2 + 0.232x3 + 1.161x21 + 0.119x
22 + 1.75x
23 – 5.49x1x2 -
4.21x1x3 – 4.18x2x3 (III. 2.5)
The dye decolourization results predicted by the models presented above, at each
experimental point, are presented in Table III. 2.2.

Part III – Optimization of Decolourization Equilibrium and Cyclic Voltammetry
66
Table III. 2.2 – Comparison between experimental data and predicted values for RB114, RY15, RR239
and RB5 decolourization by commercial laccase.
Runs
Factors Dye degradation (%)
x1 (ºC) x2 x3 (U/L) RB114 RY15 RR239 RB5
Actual Value
Predicted Value
Actual Value
Predicted Value
Actual Value
Predicted Value
Actual Value
Predicted Value
1 25 3.0 48 ND* 1.0 3.7 ND ND 0.4 11.5 41.3
2 25 3.0 96 ND ND 5.8 5.2 ND ND 66.1 50.5
3 25 3.0 192 0.4 ND ND 0.4 ND ND 63.1 58.5
4 25 5.0 48 87.3 86.9 63.7 70.4 2.0 1.5 78.6 65.2
5 25 5.0 96 85.8 84.6 76.0 74.2 ND 0.9 74.9 71.6
6 25 5.0 192 75.8 80.8 62.3 66.4 ND ND 69.4 74.0
7 25 7.0 48 94.4 95.3 88.7 89.3 95.8 96.4 90.6 88.6
8 25 7.0 96 92.4 91.9 94.3 91.6 97.3 95.6 89.1 92.2
9 25 7.0 192 88.4 85.8 83.6 80.7 93.5 94.3 87.8 89.1
10 35 3.0 48 ND 0.6 5.2 8.0 ND ND 65.3 56.6
11 35 3.0 96 ND ND 10.7 14.4 ND ND 65.1 63.0
12 35 3.0 192 0.8 ND 15.9 11.6 ND ND 64.3 65.4
13 35 5.0 48 89.5 86.9 79.3 77.2 1.8 0.8 81.0 74.9
14 35 5.0 96 84.7 84.9 83.5 82.0 ND 0.4 76.0 78.6
15 35 5.0 192 79.0 81.6 71.9 76.2 ND ND 70.2 75.4
16 35 7.0 48 95.2 95.7 95.1 94.6 94.7 95.3 91.0 92.8
17 35 7.0 96 91.7 92.5 94.0 97.9 95.1 94.7 89.6 93.7
18 35 7.0 192 87.9 87.0 88.5 89.0 93.7 93.9 86.0 84.9
19 45 3.0 48 ND 1.5 ND 8.8 ND ND 69.8 67.2
20 45 3.0 96 ND 0.9 12.2 16.2 ND ND 69.3 70.8
21 45 3.0 192 ND 0.5 16.3 15.4 ND 0.3 66.4 67.6
22 45 5.0 48 90.5 88.1 78.7 76.5 1.2 0.4 81.8 80.1
23 45 5.0 96 88.4 86.4 83.3 82.3 ND 0.3 74.8 80.9
24 45 5.0 192 83.9 83.7 78.2 78.5 ND 0.2 69.3 72.1
25 45 7.0 48 96.3 97.3 92.6 92.4 94.0 94.7 89.6 92.5
26 45 7.0 96 93.2 94.4 94.0 96.7 94.4 94.3 90.2 90.5
27 45 7.0 192 89.9 89.5 91.2 89.8 94.4 93.8 86.7 76.2
28 35 5.0 96 81.3 84.9 85.1 82.0 ND 0.4 76.7 78.6
29 35 5.0 96 87.4 84.9 85.5 82.0 ND 0.4 77.3 78.6
*ND, not detected
The statistical significance of the polynomial model for the experimental responses
(Table III. 2.2) was evaluated by analysis of variance (ANOVA). According to the ANOVA results
(Table III. 2.3a and Table III. 2.3b), the models present high correlation coefficients (R2):
0.99363, 0.99983 and 0.99804 for the degradation of RY15, RR239 and RB114, respectively,
and a lower value for the RB5 dye: 0.73924. These results indicate that the accuracy of the
polynomial models was good.
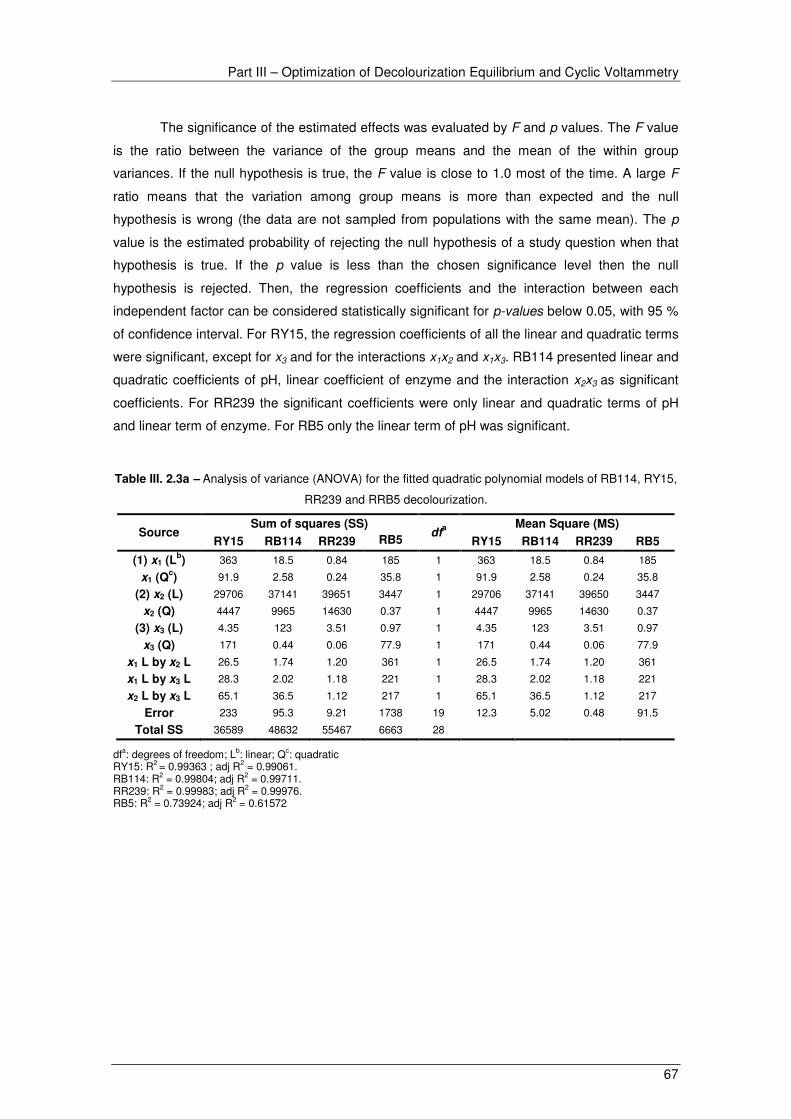
Part III – Optimization of Decolourization Equilibrium and Cyclic Voltammetry
67
The significance of the estimated effects was evaluated by F and p values. The F value
is the ratio between the variance of the group means and the mean of the within group
variances. If the null hypothesis is true, the F value is close to 1.0 most of the time. A large F
ratio means that the variation among group means is more than expected and the null
hypothesis is wrong (the data are not sampled from populations with the same mean). The p
value is the estimated probability of rejecting the null hypothesis of a study question when that
hypothesis is true. If the p value is less than the chosen significance level then the null
hypothesis is rejected. Then, the regression coefficients and the interaction between each
independent factor can be considered statistically significant for p-values below 0.05, with 95 %
of confidence interval. For RY15, the regression coefficients of all the linear and quadratic terms
were significant, except for x3 and for the interactions x1x2 and x1x3. RB114 presented linear and
quadratic coefficients of pH, linear coefficient of enzyme and the interaction x2x3 as significant
coefficients. For RR239 the significant coefficients were only linear and quadratic terms of pH
and linear term of enzyme. For RB5 only the linear term of pH was significant.
Table III. 2.3a – Analysis of variance (ANOVA) for the fitted quadratic polynomial models of RB114, RY15,
RR239 and RRB5 decolourization.
Source Sum of squares (SS)
dfa
Mean Square (MS)
RY15 RB114 RR239 RB5 RY15 RB114 RR239 RB5
(1) x1 (Lb) 363 18.5 0.84 185 1 363 18.5 0.84 185
x1 (Qc) 91.9 2.58 0.24 35.8 1 91.9 2.58 0.24 35.8
(2) x2 (L) 29706 37141 39651 3447 1 29706 37141 39650 3447
x2 (Q) 4447 9965 14630 0.37 1 4447 9965 14630 0.37
(3) x3 (L) 4.35 123 3.51 0.97 1 4.35 123 3.51 0.97
x3 (Q) 171 0.44 0.06 77.9 1 171 0.44 0.06 77.9
x1 L by x2 L 26.5 1.74 1.20 361 1 26.5 1.74 1.20 361
x1 L by x3 L 28.3 2.02 1.18 221 1 28.3 2.02 1.18 221
x2 L by x3 L 65.1 36.5 1.12 217 1 65.1 36.5 1.12 217
Error 233 95.3 9.21 1738 19 12.3 5.02 0.48 91.5
Total SS 36589 48632 55467 6663 28
dfa: degrees of freedom; Lb: linear; Qc: quadratic RY15: R2 = 0.99363 ; adj R2 = 0.99061. RB114: R2 = 0.99804; adj R2 = 0.99711. RR239: R2 = 0.99983; adj R2 = 0.99976. RB5: R2 = 0.73924; adj R2 = 0.61572

Part III – Optimization of Decolourization Equilibrium and Cyclic Voltammetry
68
Table III. 2.3b – Analysis of variance (ANOVA) for the fitted quadratic polynomial models of RB114, RY15,
RR239 and RRB5 decolourization (continued).
Source F-value p-value
RY15 RB114 RR239 RB5 RY15 RB114 RR239 RB5
(1) x1 (Lb) 29.6 3.69 1.73 2.03 0.0000 0.0697 0.2037 0.1708
x1 (Qc) 7.49 0.51 0.50 0.39 0.0131 0.4818 0.4886 0.5387
(2) x2 (L) 2421 7405 81842 37.7 0.0000 0.0000 0.0000 0.0000
x2 (Q) 362 1986 30197 0.00 0.0000 0.0000 0.0000 0.9496
(3) x3 (L) 0.35 24.6 7.25 0.01 0.5588 0.0001 0.0144 0.9191
x3 (Q) 13.9 0.09 0.12 0.85 0.0014 0.7707 0.7307 0.3675
x1 L by x2 L 2.16 0.35 2.48 3.95 0.1584 0.5628 0.1316 0.0614
x1 L by x3 L 2.31 0.40 2.44 2.41 0.1452 0.5337 0.1347 0.1370
x2 L by x3 L 5.31 7.27 2.31 2.38 0.0327 0.0143 0.1446 0.1396
Error Total SS
III. 2.4.1.1 Response Surface Methodology
Using RSM, the effects of the independent factors (pH, temperature and enzyme
concentration) and their interaction on the dyes decolourization are represented, the response
can be predicted and the optimum values of decolourization can be determined. The response
surface plots (Figures III. 2.1 – III. 2.4) show the decolourization of RY15, RR239, RB114 and
RB5 as function of two factors, whilst the third was kept at a constant level.
Figure III. 2.1 represents the response surface for RY15 decolourization. Surface plots
show the increase on dye degradation with increasing on pH values. Plots III. 2.1a and III. 2.1c
clearly show that the decolourization by commercial laccase was sensitive even to small
alterations of the pH. As it can be seen from plots III. 2.1a and III. 2.1c, the temperature slightly
influenced the decolourization. On the other hand the enzyme concentration did not affect the
decolourization in the treated range.
The response surface plots of RB114, RR239 and RB5 degradation are presented in
Figures III. 2.2 - III. 2.4, respectively. From the results it can be observed that pH was the only
influential factor.
The results presented above showed that pH was the more relevant factor for the
decolourization of the four dyes. At acidic conditions (pH<4.0) a little or no decolourization was
observed for all dyes. Similar results were observed in other studies (Eggert et al., 1996;
Nyanhongo et al., 2002) with dyes or similar substrates. These results suggest that acidic pH
values may influence the stability of the enzyme causing denaturation. According to Tavares et
al. (2006) laccase loses stability at pH of 3.0 whilst for pH of 5.0 no loss of enzyme activity is
observed.
Literature studies show that laccase-catalyzed dye oxidation is affected by the
temperature (Kim and Nicell, 2006; Nyanhongo et al., 2002). From the results presented in
Figures III. 2.1 - III. 2.4 it can be concluded that the temperature did not seem to play an

Part III – Optimization of Decolourization Equilibrium and Cyclic Voltammetry
69
important role on decolourization of RY15, RR239, RB114 and RB5 in the range 25-45 ºC.
Temperatures above 45 ºC were not studied since previous results (data not presented) have
shown that the increase from 40 ºC to 50 ºC did not promote an increase on dye
decolourization. As temperature, the laccase concentration did not influence the dye
degradation for the four dyes.
Figure III. 2.1 – Response surface plots for decolourization of RY15 as a function of: (a) pH and
temperature at 96 U/L; (b) enzyme concentration and temperature at pH 5.0; (c) pH and enzyme
concentration at 35 ºC.
(a)
(b)
(c)

Part III – Optimization of Decolourization Equilibrium and Cyclic Voltammetry
70
Figure III. 2.2 – Response surface plots for decolourization of RB114 as function of: (a) pH and
temperature at 96 U/L; (b) pH and enzyme concentration at 35 ºC.
(a)
(b)

Part III – Optimization of Decolourization Equilibrium and Cyclic Voltammetry
71
Figure III. 2.3 – Response surface plots for decolourization of RR239 as function of: (a) pH and
temperature at 96 U/L enzyme concentration; (b) pH and enzyme concentration at 35 ºC.
(a)
(b)

Part III – Optimization of Decolourization Equilibrium and Cyclic Voltammetry
72
Figure III. 2.4 – Response surface plots for decolourization of RB5 as a function of: (a) pH and
temperature at 96 U/L; (b) enzyme concentration and temperature at pH 5.0; (c) pH and enzyme
concentration at 35 ºC.
(a)
(b)
(c)

Part III – Optimization of Decolourization Equilibrium and Cyclic Voltammetry
73
III. 2.4.2 Model validation
The adequacy of the proposed model (Equation III. 2.1) for dye decolourization by
commercial laccase was evaluated using the optimum conditions for each dye. For this purpose
new experiments were conducted in triplicate to verify the optimum conditions. According to the
models the optimum conditions for the RY15 dye degradation were: temperature 39.2 ºC,
enzyme concentration 109.8 U/L and pH 6.6, predicting above 90 % decolourization. For
RR239, RB114 and RB5 it was not possible to calculate the optimum of temperature and
enzyme concentration as these factors did not affect the response (Figures III. 2.2 - III. 2.4). In
these cases, according to the response surface, it is possible to determine an optimal region for
dye decolourization: pH of 5.5-7.0 for RB114 and pH of 7.0-7.5 for RR239 and RB5. At these
conditions, the highest RB114, RR239 and RB5 decolourization (≥ 90 %) was obtained. Under
the optimal conditions, a decolourization of 96 %, 90 %, 93 % and 90 % was experimentally
achieved for RR239, RB114, RY15 and RB5, respectively, which is in good agreement with the
decolourization predicted by the model. For the entire range of the tested factors, the
experimental results are very close to the predicted values obtained from the models.
III. 2.4.3 Decolourization at the optimum conditions
For a better performance in dye wastewater treatment, no absorbance in the visible
spectrum must be detected after decolourization. Thus, the decolourization at the optimum
conditions was followed by measuring the absorbance reduction over all the visible spectrum.
The results presented in Table III. 2.4 show a lower decolourization based on the entire visible
spectrum when compared with the absorbance reduction at the maximum wavelength,
particularly for RB114 which presents a difference of 65 % in the decolourization. This result
can be explained by the new peak of absorbance that emerged between 400 and 420 nm
during the degradation of RB114, corresponding to a light orange colour formed probably due to
the coloured intermediates. Sugano et al. (2006) showed the generation of light red-brown
reaction products during the decolourization of Reactive black 5 by versatile peroxidise, which
was also observed in this study. RR239 and RY15 did not show any colour change and no
additional peaks of absorbance were observed in the entire visible spectrum (data not shown).
Table III. 2.4 – Comparison between dye decolourization (%) based on the absorbance reduction at
maximum wavelength and on the area under all dye spectrum range.
Dye Decolourization (%)
Peak Area
RR239 96 70
RB114 90 25
RY15 93 84
RB5 90 76
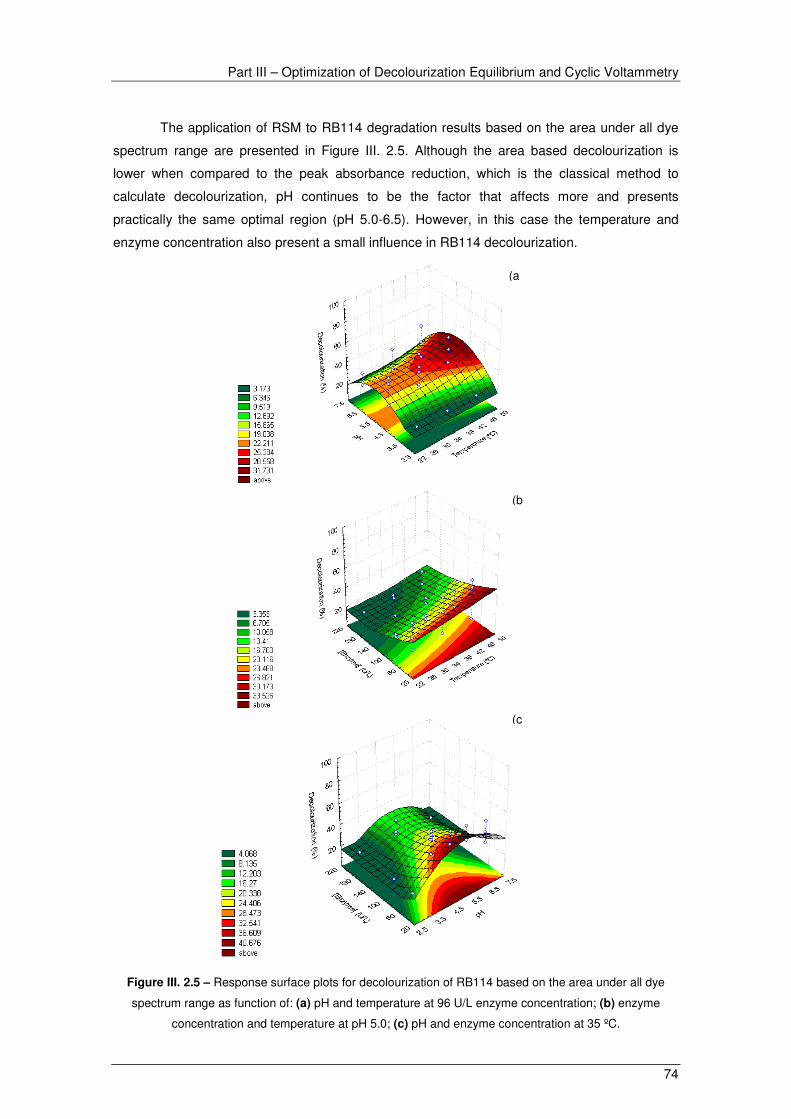
Part III – Optimization of Decolourization Equilibrium and Cyclic Voltammetry
74
The application of RSM to RB114 degradation results based on the area under all dye
spectrum range are presented in Figure III. 2.5. Although the area based decolourization is
lower when compared to the peak absorbance reduction, which is the classical method to
calculate decolourization, pH continues to be the factor that affects more and presents
practically the same optimal region (pH 5.0-6.5). However, in this case the temperature and
enzyme concentration also present a small influence in RB114 decolourization.
Figure III. 2.5 – Response surface plots for decolourization of RB114 based on the area under all dye
spectrum range as function of: (a) pH and temperature at 96 U/L enzyme concentration; (b) enzyme
concentration and temperature at pH 5.0; (c) pH and enzyme concentration at 35 ºC.
(a
(b
(c

Part III – Optimization of Decolourization Equilibrium and Cyclic Voltammetry
75
III. 2.5 Conclusions
Box–Behnken statistical experimental design and response surface methodology are
important tools to optimize the conditions for textile dye wastewater treatment as well as to
reduce the number of experiments and provide useful information about the effect of the factors
and the possible interactions. The decolourization of RY15, RR239, RB114 and RB5 by
enzymatic catalysis using commercial laccase was optimized leading to dye degradation above
90 %. pH proved to be the principal factor that affects the decolourization of the four reactive
dyes whilst temperature and enzyme concentration presented a low or none effect on dye
degradation. The decolourization based on all the visible spectrum showed to be lower when
compared with the degradation at the maximum wavelength for all dyes studied. In the case of
RB114 this difference is high (65 %) due to the formation of another peak, corresponding to a
formed light orange colour during the degradation.
III. 2.6 References Al-Degs, Y., Khraisheh, M.A.M., Allen, S.J., Ahmad, M.N., 2000. Effect of carbon surface chemistry on the removal of reactive dyes from textile effluent. Water Research, 34, 927-935.
Amaral, P.F.F., Fernandes, D.L.A., Tavares, A.P.M., Xavier, A.B.M.R, Cammarota, M.C., Coutinho, J.A.P., Coelho, M.A.Z, 2004. Decolorization of dyes from textile wastewater by Trametes versicolor. Environmental Technology, 25, 1313-1320.
Box, G.E.P., Behnken, D.W., 1960. Some new three level designs for the study of quantitative variables. Technometrics, 2, 455-475.
Box, G.E.P., Hunter, W.G., Hunter, J.S., 1978. Statistics for Experiments: An Introduction to Design, Data Analysis, and Model Building. John Wiley & Sons, Inc, United States of America.
Cristóvão, R.O., Tavares, A.P.M., Ribeiro, A.S., Loureiro, J.M., Boaventura, R.A.R., Macedo, E.A., 2008. Kinetic modelling and simulation of laccase catalyzed degradation of reactive textile dyes. Bioresource Technology, 99, 4768–4774.
Eggert, C., Temp, U., Eriksson, K.L., 1996. The Ligninolytic System of the white rot fungus Pycnoporus cinnabarinus: purification and characterization of the laccase. Applied and Environmental Microbiology, 62, 1151-1158.
Gamelas, J.A.F., Tavares, A.P.M., Evtuguin, D.V., Xavier, A.M.B., 2005. Oxygen bleaching of kraft pulp with polyoxometalates and laccase applying a novel multi-stage process. Journal of Molecular Catalysis B: Enzymes, 33, 57-64.
Hanrahan, G., Lu, K., 2006. Application of factorial and response surface methodology in modern experimental design and optimization. Critical Reviews in Analytical Chemistry, 36, 141-151.
Husain, Q., 2006. Potential Applications of the oxidoreductive enzymes in the decolorization and detoxification of textile and other synthetic dyes from polluted water: A review. Critical Reviews and Biotechnology, 26, 201-221.
Kandelbauer, A., Maute, O., Kessler, R.W., Erlacher, A., Gubitz, G.M., 2004. Study of dye decolorization in an immobilized laccase enzyme-reactor using online spectroscopy. Biotechnology and Bioengineering, 87, 552-563.
Kim, Y., Nicell, J.A., 2006. Impact of reaction conditions on the laccase-catalyzed conversion of bisphenol A. Bioresource Technology, 97, 1431-1442.
Medeiros, A.B.P., Pandey, A., Freitas, R.J.S., Christen, P., Soccol, C.R., 2000. Optimization of the production of aroma compounds by Kluyveromyces marxianus in solid-state fermentation using factorial design and response surface methodology. Biochemical Engineering Journal, 6, 33–39.

Part III – Optimization of Decolourization Equilibrium and Cyclic Voltammetry
76
Murugesan, K., Dhamija, A., Nam, I.H., Kim, Y.M., Chang, Y.S., 2007. Decolourization of reactive black 5 by laccase: Optimization by response surface methodology. Dyes and Pigments, 75, 176-184.
Nyanhongo, G.S., Gomesa, J., Gubitz, G.M., Zvauya, R., Readd, J., Steiner, W., 2002. Decolorization of textile dyes by laccases froma newly isolated strain of Trametes modesta. Water Research, 36, 1449-1456.
Rodríguez, E., Pickard, M.A., Vazquez-Duhalt, R., 1999. Industrial dye decolorization by laccases from ligninolytic fungi. Current Microbiology, 38, 27-32.
Romero, S., Blánquez, P., Caminal, G., Font, X., Sarrà, M., Gabarrell, X., Vicent, T., 2006. Different approaches to improving the textile dye degradation capacity of Trametes versicolor. Biochemical Engineering Journal, 31, 42-47.
Slokar, Y.M., Le Marechal, A.M., 1998. Methods of decoloration of textile wastewaters. Dyes and Pigments, 37, 335-356.
Soares, G.M.B, De Amorim, M.T.P., Hrdina, R., Costa-Ferreira, M., 2002. Studies on the biotransformation of novel disazo dyes by laccase. Process Biochemisty, 37, 581-587.
Sugano, Y., Matsushima, Y., Shoda, M.m 2006. Complete decolorization of the anthraquinone dye Reactive blue 5 by the concerted action of two peroxidises from Thanatephorus cucumeris Dec1. Applied Microbiology and Biotechnology, 73, 862-871.
Tavares, A.P.M., Gamelas, J.A.F, Gaspar, A., Evtuguin, D.V., Xavier, A.M.R.B., 2004. A novel approach for the oxidative catalysis employing polyoxometalate-laccase system: application to the oxygen bleaching of kraft pulp. Catalysis Communications, 5, 485-489.
Tavares, A.P.M., Coelho, M.A.Z., Agapito, M.S.M., Coutinho, J.A.P., Xavier, A.M.R.B., 2005. Selection and optimization of culture medium for exopolysaccharide production by Coriolus (Trametes) versicolor. World Journal of Microbiology and Biotechnology, 21, 1499-1507.
Tavares, A.P.M., Coelho, M.A.Z., Agapito, M.S.M., Coutinho, J.A.P., Xavier, A.M.R.B., 2006. Optimization and modeling of laccase production by Trametes versicolor in a bioreactor using statistical experimental design. Applied Biochemistry and Biotechnology, 134, 233-248.
Tavares, A.P.M., Cristóvão, R.O., Loureiro, J.M., Boaventura, R.A.R., Macedo, E.A., 2008. Optimisation of reactive textile dyes degradation by laccase–mediator system. Journal of Chemical Technology and Biotechnology, 12, 1609-1615.
Thurston, C.F., 1994. The structure and function of fungal laccases. Microbiology, 140, 19-26.
Vandevivere, P.C., Bianchi, R., Verstraete, W., 1998. Treatment and reuse of wastewater from the textile wet-processing industry: review of emerging technologies. Journal of Chemical Technology and Biotechnoology, 72, 289-302.
Wesenberg, D., Kyriakides, I., Agathos, S. N., 2003. White-rot fungi and their enzymes for the treatment of industrial dye effluents. Biotechnology Advances, 22, 161-187.
Weuster-Botz, D., 2000. Experimental design for fermentation media development: statistical design or global random search? Journal of Bioscience and Bioengineering, 90, 473-483.
Wong, Y., Yu J., 1999. Laccase-catalyzed decolorization of synthetic dyes. Water Research, 16, 3512-3520.
Yann, D., Didier, H., Daniel, B., 2005. Utilisation of the experimental design methodology to reduce browning defects in hard cheeses technology. Journal of Food Engineering, 68, 481-490.

Part III. 3 Optimization of reactive dye
degradation by laccase using box-behnken
design*
III. 3.1 Abstract
III. 3.2 Introduction
III. 3.3 Materials and Methods
III. 3.4 Results and Discussion
III. 3.5 Conclusions
III. 3.6 References
*based on: Cristóvão, R.O., Tavares, A.P.M., Loureiro, J.M., Boaventura, R.A.R., Macedo, E.A., 2008. Optimisation of Reactive Dye Degradation by Laccase Using Box-Behnken Design. Environmental Technology, 29, 1357-1364


Part III – Optimization of Decolourization Equilibrium and Cyclic Voltammetry
79
III. 3 Optimization of reactive dye degradation by laccase using
box-behnken design
III. 3.1 Abstract
A three-level Box–Behnken factorial design with three factors and the response surface
methodology were used to optimize the colour removal of the reactive textile dye, Colour Index
(C.I.) reactive red 180, by commercial laccase. A mathematical model was developed to study
the effect of temperature, pH, enzyme concentration and their interactions on the
decolourization. Enzyme concentration and pH as well as their interaction were the principal
factors that affected the decolourization. The dye degradation was independent of temperature.
The model estimated that the highest decolourization (> 92 %) was obtained for 27 ºC, pH 7.5
and 85 U/L. This predicted value was experimentally validated, obtaining dye colour removal
(540 nm) of 93 ± 1.5 %.
III. 3.2 Introduction
Reactive dyes are the principal class of dyes employed in textile industries because
they are used to dye cotton; half of the world’s fibre consumption comprises cotton and dyeing 1
kg of cotton requires approximately 40 g reactive dye (Allègre et al., 2006). However, around 30
% of the applied reactive dyes are discarded and the conventional wastewater treatments are
not efficient to completely remove the residual colour (Correia et al., 1994). Reactive dyes
present in effluents from dyeing processes can be detected in water by the human eye down to
concentrations of 0.005 mg/L (Vandevivere et al., 1998). Many conventional treatments
including adsorption, chemical precipitation, ozonation and flocculation have been reported for
decolourization of effluents; however, in many cases they are inefficient and have a high cost.
Conversely, biological processes such as biodegradation are an efficient alternative (Amaral et
al., 2004; Casas et al., 2007; Kapdan et al., 2002). However, few studies involving enzymatic
degradation of reactive dyes with commercial laccase are available (Soares et al., 2002a). The
reactive dye RR180 is widely used for textile dyeing processes and it is resistant to
biodegradation (Reyes et al., 1999; Rodríguez et al., 1999) and conventional treatments of
degradation.
Laccase is a copper-containing oxidoreductase (EC 1.10.3.2, p-diphenol:dioxygen
oxidoreductase), which catalyzes the oxidation of phenolic compounds with reduction of oxygen
to water (Thurston, 1994). However, the substrate range can be extended to non-phenolic
compounds by the addition of a mediator (Bourbonnais and Paice, 1990; Gamelas et al., 2005;
Tavares et al., 2004). Catalytic degradation of dyes with the laccase-mediator system (LMS) is

Part III – Optimization of Decolourization Equilibrium and Cyclic Voltammetry
80
an environmentally friendly technology which constitutes a promising alternative to conventional
decolourization. The mechanism of catalysis by LMS is presented in a simplified view in Figure
III. 3.1. The mediator is a diffusible electron carrier between the dye and the enzyme
(Bourbonnais et al., 1998).
Figure III. 3.1 - Representation of dye degradation by laccase mediator system.
The experimental design and Response Surface Methodology (RSM) are useful
statistical techniques that can be used in decolourization processes to identify and optimize the
relevant factors that influence colour removal, and also and it can be used to evaluate the
relative significance of several of these factors and their interactions. It is an experimental
strategy to obtain the optimum conditions for a multivariable system. Although this methodology
has been widely applied in other sciences, e.g. in enzyme production, and in culture medium
optimization, a few reports are available on the optimization of reactive dyes (Hanrahan and Lu,
2006; Myers and Montgomery, 2002). A class of three level complete factorial designs for the
estimation of the parameters in a second-order model was developed by Box and Behnken
(Box and Behnken, 1960).
In this study the RSM using the full Box-Behnken design of experiments was applied to
optimize the decolourization conditions of C.I. reactive red 180 (RR180) by commercial laccase.
A synthetic effluent containing the reactive dye was used to obtain a constant composition in
order to understand more easily the effects of the treatment.
III. 3.3 Materials and Methods
III. 3.3.1 Chemicals and Enzyme
Textile dyes: C.I. Reactive red 180 (Remazol Brilliant Red F3B), a monoazo dye, was
kindly provided by DyStar (Porto, Portugal) and was used for degradation experiments without
any further purification. The chemical structure is presented in Figure III. 3.2. A wide variety of
dyes, namely acid, reactive, disperse, vat, metal complex, mordant, direct, basic and sulphur
are available. Among these, the most used in the textile industry are the reactive dyes. In this
work, a reactive red dye, which is widely used on cotton and wool dyeing was chosen, as this
type of dye is less degradable when compared with other dyes.

Part III – Optimization of Decolourization Equilibrium and Cyclic Voltammetry
81
Figure III. 3.2 - Chemical structure of C.I. reactive red 180.
Enzyme: A commercial laccase formulation (DeniLite II S; 120 U/g) from genetically
modified Aspergillus was kindly provided by Novozymes. This formulation is used for indigo dye
decolourization in denim finishing operations and includes a buffer and an enzyme mediator.
Due to the wide application of laccase in the treatment of textile effluents and the degradation of
phenolic compounds, this enzyme was used for the oxidation of the reactive red 180.
III. 3.3.2 Box–Behnken Design of Experiments
A 33 Box–Behnken full factorial design was used to identify the factors having significant
effects on RR180 decolourization by laccase. The normal practice is to test within the feasible
range, so that the variation in the process does not mask the factor effect. Factors were
selected and the ranges were further assigned based on our previous experience with
enzymatic catalysis (Cristóvão et al., 2008; Tavares et al., 2008). Three factors, i.e.,
temperature, enzyme concentration and pH were chosen. The low level (−1), high level (+1) and
the middle point (0) of each factor are listed in Table III. 3.1. The experimental Box–Behnken
design, analysis of variance (ANOVA) and 3D response surface were carried out using the
software Statistica v.5.1 (Statsoft Inc.). Equation (III. 3.1) describes the regression model of the
present system, which includes the interaction terms:
Y= β0 + β1x1+β2x2 + β3x3 + β12x1x2 + β13x1x3 + β23x2x3
+ β11x21 + β22x
22 + β33x
23 (III. 3.1)
where Y is the predicted response, i.e. the colour removal; x1, x2 and x3 are the coded levels of
the independent factors temperature, pH and enzyme concentration. The regression coefficients
are: β0 - the intercept term; β1, β2 and β3 - the linear coefficients; β12, β13, β23 - the interaction
coefficients and β11, β22, β33 - the quadratic coefficients. The model evaluates the effect of each
independent factor on the response.

Part III – Optimization of Decolourization Equilibrium and Cyclic Voltammetry
82
Table III. 3.1 - Variables and experimental Box-Behnken design levels.
Factors Parameters Coded level
+1 0 -1
x1 Temperature (ºC) 45 35 25
x2 pH 8.0 7.0 6.0 x3 Enzyme concentration (U/L) 96 48 24
III. 3.3.3 Dye Decolourization Experiments
To study the decolourization of the reactive textile dye, 50 mg/L of C.I. RR180 was
incubated in a 25 mL Erlenmeyer flask under stirring for one day. Dye degradation conditions
are presented in Table III. 3.1 according to the experimental design (Table III. 3.2): laccase
concentrations of 24, 48 and 96 U/L, temperature of 25, 35 and 45 ºC and pH of 6.0, 7.0 and
8.0. The pH values of the dye solutions were adjusted with 50 mM phosphate buffer.
III. 3.3.4 Determination of Dye Degradation
Dye decolourization was determined by monitoring the decrease in the absorbance
peak at the maximum absorbance wavelength for the C.I. reactive red 180 at 540 nm (peak) or
by calculating the total area under the plot (integration of absorbance between 350 to 700 nm)
(area). A UV-visible spectrophotometer (Thermo, model UV1) was used in all experiments. The
percentage decolourization is calculated by (Ai − Af)/Ai × 100, where Ai is the initial absorbance
or total area under the initial spectrum and Af is the final absorbance or total area under the final
spectrum.
III. 3.4 Results and Discussion
The most important factors which affect the efficiency of enzymatic dye degradation, are
temperature and pH of the solution and enzyme concentration. In order to study the combined
effect of these factors, experiments were performed for different combinations using factorial
design methodology. The effect of temperature, enzyme concentration and pH on the
decolourization of RR180 by commercial laccase is shown in Table III. 3.1. From the present
results, the quadratic model, including linear interactions, fitted adequately to the experimental
data giving a coefficient of determination, R2, of 0.9306. Equation (III. 3.2), which indicates the
effect of factors on RR180 decolourization, is shown below, in terms of coded factors:
Y = 68.702 + 0.650x1 + 10.563x2 + 16.133x3 + 0.527x12 + 9.680x2
2 + 6.709x32 – 3.357 x1x2 –
0.787x1x3 + 9.033x2x3 (III. 3.2)
The predicted decolourization of RR180 from the model at each experimental point is
presented in Table III. 3.2 together with the experimental observed values. Additionally, a

Part III – Optimization of Decolourization Equilibrium and Cyclic Voltammetry
83
comparison between dye decolourization by absorbance reduction at the maximum wavelength
and the total decolourization based on the overall spectrum is also presented.
Table III. 3.2 - Box–Behnken design matrix and the responses of the dependent factors and predicted
values.
Run
Factors
Dye degradation (%)
x1 (ºC) x2 x3 (U/L)
Peak Peak
Predicted Value
Area Area
Predicted Value
1 25 6.0 24 47.4 35.0 36.4 27.6
2 25 6.0 48 44.5 53.6 34.0 40.2
3 25 6.0 96 48.7 50.7 26.1 28.1
4 25 7.0 24 48.4 59.2 39.9 46.9
5 25 7.0 48 88.9 83.9 68.4 66.0
6 25 7.0 96 94.2 93.0 71.5 66.6
7 25 8.0 24 40.9 44.7 31.2 34.7
8 25 8.0 48 85.7 75.5 65.1 60.2
9 25 8.0 96 93.7 96.7 71.2 73.5
10 35 6.0 24 42.7 40.8 34.2 32.2
11 35 6.0 48 53.0 59.0 41.0 45.3
12 35 6.0 96 60.3 55.0 33.7 34.1
13 35 7.0 24 57.9 61.7 45.6 48.4
14 35 7.0 48 86.7 85.9 67.7 67.9
15 35 7.0 96 94.3 94.0 70.8 69.5
16 35 8.0 24 44.9 43.9 37.8 33.1
17 35 8.0 48 70.8 74.1 56.8 59.0
18 35 8.0 96 93.4 94.2 71.3 73.3
19 45 6.0 24 43.4 44.6 32.4 32.1
20 45 6.0 48 59.0 62.2 43.1 45.7
21 45 6.0 96 59.0 57.2 39.9 35.5
22 45 7.0 24 70.6 62.1 47.1 45.3
23 45 7.0 48 81.7 85.7 64.0 65.3
24 45 7.0 96 91.1 92.8 64.6 67.8
25 45 8.0 24 36.7 40.9 22.7 26.9
26 45 8.0 48 75.7 70.6 58.8 53.3
27 45 8.0 96 88.5 89.7 67.8 68.5
28 35 7.0 48 83.7 85.9 66.7 67.9
29 35 7.0 48 92.5 85.9 73.3 67.9
A decrease in RR180 total decolourization (area) was observed when compared with
decolourization at maximum wavelength (peak). The decolourization of RR180 causes a
reduction in absorbance at the peak but the dye is not fully decolourization when considering
the entire visible spectrum.

Part III – Optimization of Decolourization Equilibrium and Cyclic Voltammetry
84
The model was found to be adequate for prediction within the range of factors chosen.
The optimum operating conditions for RR180 decolourization can be predicted from the second
order polynomial function. The Pareto chart displays the statistically relevant effect of each
factor on the response and it is a practical mode to view the results. These are sorted from the
largest to the smallest, and the effects to the right of the divisor line are significant. From Figure
III. 3.3, the enzyme concentration (x3) and pH (x2) and their interaction x3×x2 are shown to have
an effect on RR180 decolourization whilst the temperature (x1) did not affect the decolourization.
Figure III. 3.3 - Pareto chart of standardized effects for 33 Box–Behnken factorial design. (1) Temperature;
(2) pH; (3) enzyme concentration.
This significant interaction between the factors allowed an optimum point (max.) for
RR180 decolourization to be found on the Response Surface (Figure III. 3.4b), due to the
curvature obtained. Figure III. 3.4 shows a decrease in dye degradation with the decrease in
pH. This result can be explained by the conformational changes in the enzyme’s three-
dimensional structure promoted by low pH values, affecting the active site, and, then, the
biocatalytic reactions mechanism (Figure III. 3.1). A study on laccase activity and stability
showed that a loss of 50 % of the activity was observed for pH = 3.0 during the first day of
incubation, attaining 80 % after 3 days, whereas for pH = 4.5 a loss of only 11 % was observed
after 3 days (Tavares et al., 2006).
The significance of the estimated effects was tested by analysis of variance (ANOVA),
by determination of F and p values. The F value is the ratio between the variance of the group
means and the mean of the within group variances. If the null hypothesis is true, the F value is

Part III – Optimization of Decolourization Equilibrium and Cyclic Voltammetry
85
close to 1.0 most of the time. A large F ratio means that the variation among group means is
more than expected and the null hypothesis is wrong (the data are not sampled from
populations with the same mean). The p value is the estimated probability of rejecting the null
hypothesis of a study question when that hypothesis is true. If the p value is less than the
chosen significance level then the null hypothesis is rejected.
The ANOVA (Table III. 3.3) test indicates that the model adequately describes the
decolourization of RR180 by commercial laccase. The significance of each coefficient was
determined through the p value test considering 95 % confidence, in which low p values (p <
0.05) indicate a high significance of the corresponding coefficient. The effect of pH and enzyme
concentration and their interaction on RR180 decolourization is significant whilst the
temperature did not influence the decolourization.
Table III. 3.3 - Analysis of variance (ANOVA) for the fitted quadratic polynomial model for optimization of
C.I. reactive red 180 decolourization by commercial laccase.
Source Sum of squares (SS) dfa
Mean square (MS) F-value p-value
(1) x1 (Lb) 7.5 1 7.5 0.18 0.6797
x1 (Qc) 7.4 1 7.4 0.17 0.6815
(2) x2 (L) 1973.3 1 1973.3 46.5 0.0000
x2 (Q) 2491.8 1 2491.8 58.7 0.0000
(3) x3 (L) 4685.2 1 4685.2 110.4 0.0000
x3 (Q) 1149.0 1 1149.0 27.1 0.0001
1L by 2L 135.3 1 135.3 3.2 0.0902
1L by 3L 7.7 1 7.7 0.2 0.6749
2L by 3L 1015.4 1 1015.4 24.0 0.0001
Error 806.5 19 42.4
Total SS 11618.0 28
dfa: degree of freedom; Lb: linear; Qc: quadratic R2 = 0.9306; adj R2 = 0.8977
The response surface plots, generated from the Box–Behnken design, are shown in
Figure III. 3.4 a-c. The plots represent the decolourization of RR180 with changes in two
independent factors (temperature, pH or enzyme concentration) while a third factor was kept
constant. Figure III. 3.4a shows the response surface of interactions between pH and
temperature at 55 U/L. Decolourization increases with pH up to 7.5, and then decreases. The
decolourization was practically independent of temperature changes as observed in Figures III.
3.4a and III. 3.4c. Figure III. 3.4b represents the effect of changes in enzyme concentration and
pH at 35 ºC. It clearly shows that the optimum conditions for obtaining the maximum
decolourization are within the experimental ranges tested. The decolourization increased with

Part III – Optimization of Decolourization Equilibrium and Cyclic Voltammetry
86
increasing pH and enzyme concentration up to approximately 7.5 and 85 U/L, respectively.
Then the decolourization decreased slowly. Maximum decolourization was observed at those
conditions and dye degradation above 92 % was predicted by the response surface.
Figure III. 3.4 - Response surface plots of the C.I. reactive red 180 decolourization by commercial laccase:
(a) effect of temperature (x1) vs. pH (x2) at 55.4 U/L; (b) effect of enzyme concentration (x3) vs. pH (x2) at
35 ºC; (c) effect of temperature (x1) vs. enzyme concentration (x3) at pH 7.0.
(a)
(b)
(c)

Part III – Optimization of Decolourization Equilibrium and Cyclic Voltammetry
87
The adequacy of the regression model for RR180 decolourization by laccase was
checked by using the calculated optimum conditions: 27.4 ºC, 85.4 U/L and pH 7.5 in triplicate
experiments. Under these conditions, 93 ± 1.5 % of RR180 decolourization was obtained which
is in good agreement with the predicted value (above 92 %). The absorbance spectrum of
RR180 before and after decolourization by commercial laccase at the optimum conditions
determined by the experimental design is shown in Figure III. 3.5. The decrease in the
absorbance values indicates that the decolourization of RR180 was almost complete.
0
0.2
0.4
0.6
0.8
1
1.2
350 400 450 500 550 600 650 700
Wavelength (nm)
Ab
sorb
an
ce.
Control
C.I. RR180 +laccase
Figure III. 3.5 - Absorption spectra of RR180 before and after decolourization by commercial laccase.
Optimum decolourization conditions obtained by RSM.
DeniLite II S is a commercial laccase with great potential to decolourize textile dyes;
however, only a few studies regarding the use of this commercial laccase on the treatment of
effluents containing dyes and especially with reactive dyes (RR180) are available. It is a
formulation containing laccase, a mediator and a non-ionic surfactant used in the finishing
process for indigo stained clothes (Soares et al., 2002b). In this study DeniLite II S was used for
decolourization of RR180 and the obtained results prove that pH and enzyme concentration
play an important role in decolourization. Recent reports have shown that a mediator is
necessary for the decolourization of dyes by laccase (Camarero et al., 2005; Murugesan et al.,
2007). In order to confirm these finds, some experiments were carried out with pure commercial
laccase (DeniLite II Base) and no degradation of RR180 was detected (data not shown), which
is in agreement with the results of other researchers reporting on RR180 decolourization by
laccase and others dyes (Rodríguez et al., 1999). A mediator is necessary for dye degradation
by laccase in order to complete the mechanism of electron transfer from the substrate to the
enzyme (Figure III. 3.1). The mediator acts as an electron carrier, an intermediate substrate for
the laccase (Riva, 2006). The overall catalytic cycle is the reduction of the oxygen molecule to a
water molecule with the concomitant oxidation of the substrate. The higher capacity of laccase
for oxidising the substrate in the presence of a mediator could be related to the redox potentials.
For example, the mechanism of oxidation of lignin by laccase and a mediator was investigated,

Part III – Optimization of Decolourization Equilibrium and Cyclic Voltammetry
88
and the results showed that the potential redox of laccase alone is not high enough to oxidise
non-phenolic compounds (Bourbonnais et al., 1997; 1998).
III. 3.5 Conclusions
Commercial laccase (DeniLite II S) was tested for decolourization of RR180. A 33 Box–
Behnken full factorial design was found to be an efficient tool for optimization of RR180
decolourization. Enzyme concentration and pH were the factors that influenced the
decolourization whilst the temperature changes did not affect the dye degradation. Validation
experiments were carried out in order to check the suitability of the model. The results showed
that the predicted decolourization is in agreement with the experimental value. It is clear that
dye degradation by commercial laccase proved to be an alternative treatment for
decolourization of RR180 (> 92 %).
III. 3.6 References Allègre, C., Moulin, P., Maisseu, M., Charbit, F., 2006. Treatment and reuse of reactive dyeing effluents. Journal of Membrane Science, 269, 15–34.
Amaral, P.F.F., Fernandes, D.L.A., Tavares, A.P.M., Xavier, A.M.R.B., Cammarota, M.C., Coutinho, J.A.P., Coelho, M.A.Z., 2004. Dye decolorization performed by Trametes versicolor from textile wastewater. Environmental Technology, 25, 1313-1320.
Bourbonnais, R., Paice, M.G., 1990. Oxidation of non-phenolic substrates. An expanded role for laccase in lignin biodegradation. FEBS Letters, 267, 99-102.
Bourbonnais, R., Paice, M.G., Freiermuth, B., Bodie, E., Borneman, S., 1997. Reactivities of various mediators and laccases with kraft pulp and lignin model compounds. Applied and Environmental Microbiology, 63, 4627–4632.
Bourbonnais, R., Leech, D., Paice, M.G., 1998. Electrochemical analysis of the interactions of laccase mediators with lignin model compounds. Biochimica et Biophysica Acta, 1379, 381–390.
Box, G.E.P., Behnken, D.W., 1960. Some new three level designs for the study of quantitative variables. Technometrics, 2, 455-475.
Camarero, S., Ibarra, D., Martínez, M.J., Martínez, A.T., 2005. Lignin-derived compounds as efficient laccase mediators for decolorization of different types of recalcitrant dyes. Applied and Environmental Microbiology, 71, 1775-1784.
Casas, N., Blánquez, P., Gabarrell, X., Vicent, T., Caminal, G., Sarrà, M., 2007. Degradation of Orange G by Laccase: Fungal Versus Enzymatic Process. Environmental Technology, 28, 1103-1110.
Correia, V.M., Stephenson, T., Judd, S., 1994. Characterisation of textile wastewaters–a review. Environmental Technology, 15, 917–929.
Cristóvão, R.O., Tavares, A.P.M., Ribeiro, A.S., Loureiro, J.M., Boaventura, R.A.R., Macedo, E.A., 2008. Kinetic modelling and simulation of laccase catalyzed degradation of reactive textile dyes. Bioresource Technology, 99, 4768-4774.
Gamelas, J.A.F., Tavares, A.P.M., Evtuguin, D.V., Xavier, A.M.R.B., 2005. Oxygen bleaching of kraft pulp with polyoxometalates and laccase applying a novel multi-stage process. Journal of Molecular Catalysis B: Enzymes, 33, 57-64.
Hanrahan, G., Lu, K., 2006. Application of factorial and response surface methodology in modern experimental design and optimization. Critical Reviews in Analytical Chemistry, 36, 141-151.
Kapdan, K.I., Kargi, F., McMullan, G., Marchant, R., 2002. Biological decolorization of textile dye stuff by Coriolus versicolor in a packed column reactor. Environmental Technology, 21, 231-236.
Part III – Optimization of Decolourization Equilibrium and Cyclic Voltammetry
89
Murugesan, K., Dhamija, A., Nam, I.H., Kim, Y.M., Chan, Y.S., 2007. Decolourization of reactive black 5 by laccase: Optimization by response surface methodology. Dyes and Pigments, 75, 176-184.
Myers, R.H., Montgomery, D.C., 2002. Response surface methodology, 2nd ed. John Wiley & Sons Inc., U.S.A.
Reyes, P., Pickard, M.A., Vazquez-Duhalt, R., 1999. Hydroxybenzotriazole increases the range of textile dyes decolorized by immobilized laccase. Biotechnology Letters, 21, 875–880.
Riva, S., 2006. Laccases: blue enzymes for green chemistry. Trends in Biotechnology, 24, 219-226.
Rodríguez, E., Pickard, M.A., Vazquez-Duhalt, R., 1999. Industrial dye decolorization by laccases from ligninolytic fungi. Current Microbiology., 38, 27–32.
Soares, G.M.B., Amorim, M.T.P., Hrdina, R., Costa-Ferreira, M., 2002a. Studies on the biotransformation of novel disazo dyes by laccase. Process Biochemistry, 37, 581-587.
Soares, G.M.B., Amorim, M.T.P., Oliveira-Campos, A.M., Hrdina, R., Costa-Ferreira, M., 2002b. Specificity of phenolic disazo dyes in relation to transformation by laccase. Enzyme and Microbial Technology, 30, 607-612.
Tavares, A.P.M., Gamelas, J.A.F., Gaspar, A., Evtuguin, D.V., Xavier, A.M.R.B., 2004. A novel approach for the oxidative catalysis employing polyoxometalate-laccase system: application to the oxygen bleaching of kraft pulp. Catalysis Communications, 5, 485-489.
Tavares, A.P.M., Coelho, M.A.Z., Agapito, M.S.M., Coutinho, J.A.P., Xavier, A.M.R.B., 2006. Optimization and modeling of laccase production by Trametes versicolor in a bioreactor using statistical experimental design. Applied Biochemistry and Biotechnology, 134, 233-248.
Tavares, A.P.M., Cristóvão, R.O., Loureiro, J.M., Boaventura, R.A.R., Macedo E.A., 2008. Optimization of reactive textile dyes degradation by laccase-mediator system. Journal of Chemical Technology and Biotechnology, 83, 1609-1615.
Thurston C.F., 1994. The structure and function of fungal laccases. Microbiology, 140, 19-26.
Vandevivere, P.C., Bianchi, R., Verstraete, W., 1998. Treatment and reuse of wastewater from the textile wet-processing industry: Review of emerging technologies. Journal of Chemical Technology and Biotechnology, 72, 289-302.


Part III. 4 Sequential decolourization of
reactive textile dyes by laccase mediator
system*
III. 4.1 Abstract
III. 4.2 Introduction
III. 4.3 Materials and Methods
III. 4.4 Results and Discussion
III. 4.5 Conclusions
III. 4.6 References
*based on: Tavares, A.P.M., Cristovao, R.O., Gamelas, J.A.F., Loureiro, J.M., Boaventura, R.A.R., Macedo, E.A., 2009. Sequential decolourization of reactive textile dyes by laccase mediator system. Journal of Chemical Technology and Biotechnology, 84, 442-446.

Part III – Optimization of Decolourization Equilibrium and Cyclic Voltammetry
93
III. 4 Sequential decolourization of reactive textile dyes by
laccase mediator system
III. 4.1 Abstract
The use of enzymes has attracted much interest for the decolourization of dyes from
wastewater as an alternative to conventional treatments, which have limitations. Laccase can
be used to decolourize dyes and its substrate range can be extended by inclusion of mediators.
Sequential decolourization of reactive dyes was carried out by laccase mediator system
using as mediators violuric acid and 1-hydroxybenzotriazole. Violuric acid resulted in a high
level of decolourization on the first and second cycles for reactive blue 114 (≥95 %), reactive
yellow 15 and reactive red 239 (≥80 %), while for reactive black 5 a slightly lower value was
observed (70 %) on the second cycle. The degree of reactive blue decolourization remained at
90% after the third cycle and at about 60 % after seven cycles; with the other dyes
decolourization decreased to 50-70 % on the third cycle and further up to the final cycle (lower
than 20 %). When using 1-hydroxybenzotriazole as mediator a slight decrease in
decolourization efficiency was obtained. Correlation between dye oxidation peak potential and
dye degradation after 10 min. reaction was obtained for both mediators.
These results show that sequencing batch decolourization by laccase mediator system
is a useful methodology for treating textile dying wastewaters with a high potential for
application at industrial level.
III. 4.2 Introduction
Synthetic dyes are widely used in such industries as textile, leather, cosmetics, food
and paper printing (Forgacs et al., 2004). Reactive dyes are coloured molecules used to dye
cellulose fibres. Normally, from 10 to 50 % of the initial dye load will be present in the dyebath
effluent, giving rise to a highly coloured effluent. Colour removal from these wastewaters has
been a major environmental concern, not only for aesthetic reasons but also and mainly
because of the toxicity of many reactive dyes to aquatic life and mutagenicity to humans (Houk,
1992). Regulations have become stricter, requiring the dyes industry to reduce environmental
problems related to the effluent.
A wide range of physicochemical methods have been developed for the degradation of
dye-containing wastewaters (Vandevivere et al., 1998). These methods include coagulation and
flocculation, adsorption, ozonation and oxidation. However, due to the chemical nature,
molecular size and structure of the reactive dyes these classical processes can cause a
problem in the environment and better treatments can be obtained using bioprocesses.

Part III – Optimization of Decolourization Equilibrium and Cyclic Voltammetry
94
Recently, enzymatic treatments have attracted much interest in the decolourization/degradation
of textile dyes in wastewater (Amaral et al., 2004; Cristóvão et al., 2008; Tavares et al., 2009) as
an alternative strategy to conventional chemical and physical treatments, which present serious
limitations. Enzymatic treatments are very useful due to the action of enzymes on pollutants
even when they are present in very dilute concentrations and are recalcitrant to the various
microbes participating in the degradation of dyes (Husain, 2006). The potential of the enzymes
(peroxidases, manganese peroxidase, lignin peroxidase, laccases, microperoxidase,
horseradish peroxidase, and turnip peroxidase) has been exploited in the decolourization and
degradation of dyes (Husain and Husain, 2008). Some recalcitrant dyes were not
degraded/decolourized in the presence of such enzymes. The addition of certain redox
mediators enhanced the range of substrates and efficiency of degradation of those compounds.
Several redox mediators have been reported in the literature (Camarero et al., 2005; Gamelas
et al., 2005; Tavares et al., 2008), but very few of them are frequently used (e.g., 1-
hydroxybenzotriazole, veratryl alcohol, violuric acid, 2-methoxyphenothiazone and 2,2-
azinobis(3-ethylbenzothiazoline-6-sulfonic acid)).
Sequencing batch degradation is an interesting and efficient strategy for the treatment
of effluents containing textile dyes. Few studies have investigated the degradation of dyes in a
sequencing mode by enzymatic catalysis. Most studies of sequential decolourization of dyes are
restricted to degradation with white-rot fungi (Borchert and Libra, 2001; Libra et al., 2003),
bacteria and also by chemical oxidation (Horwitz et al., 1998; Krull et al., 1998).
Many studies of enzymatic catalysis with laccase have been published and assumptions
regarding these mechanisms were proposed. However, few studies have been carried out on
the use of cyclic voltammetry (Fernández-Sanchez et al., 2002; Zille et al., 2004) in order to
better understand the correlation between the redox potential and dye degradation.
This study reports on the ability of commercial laccase for the decolourization of
different reactive dyes (reactive black 5, reactive yellow 15, reactive red 239 and reactive blue
114). Sequential batch cycles of degradation were adopted in order to establish a reactor
system that allows decolourization of reactive dyes over an extended period without addition of
new enzyme. Effects of different enzyme mediators such as violuric acid and 1-
hydroxybenzotriazole on the decolourization were studied. To better understand the
mechanisms of reactive dyes oxidation with laccase and also to verify if redox potential is a
good tool to predict the decolourization capacity, cyclic voltammetry was carried out.

Part III – Optimization of Decolourization Equilibrium and Cyclic Voltammetry
95
III. 4.3 Materials and Methods
III. 4.3.1 Chemicals, enzyme and mediators
Textile dyes: reactive black 5 (Remazol Black B), reactive yellow 15 (Remazol Yellow
GR), reactive red 239 (Remazol Brilliant Red 3BS) and reactive blue 114 (Levafix Brilliant Blue
E-BRA) were kindly provided by DyStar (Porto, Portugal).
Enzymes: Denilite II Base laccase from genetically modified Aspergillus and laccase
from Trametes villosa were kindly provided by NovoNordisk (Denmark).
Enzyme mediators: Violuric acid (VA) and 1-hydroxybenzotriazole (HBT) were supplied
by Sigma-Aldrich (Spain).
III. 4.3.2 Sequential dye decolourization
Sequential batch decolourization was carried out to evaluate the longevity of the
laccase mediator systems (LMS). For this purpose, seven sequential cycles of decolourization
were evaluated. No more cycles were carried out due to the lower decolourization at the end of
the last cycle. The first cycle was run in an aqueous solution (25.0 mL) of dye simulating textile
effluent (50 mg/L), laccase (0.2 U/mL), redox mediator VA or HBT (0.2 mmol/L) and 40 mmol/ L
phosphate buffer (pH 5.0). At the end of each cycle (intervals of 40 min.) an additional aliquot of
concentrated dye solution (2 g/L) was added in order to obtain 50 mg/L of dye again. The
reactions were incubated at 40 ºC under orbital stirring. Control without mediator and control
without laccase were carried out in parallel. The absorbance of the dye solution was monitored
at intervals of 10 min..
III. 4.3.3 Determination of dye degradation
Dye decolourization by LMS was determined by monitoring the decrease in the
absorbance at the wavelength of maximum absorption for each dye: reactive black 5 (λmax = 579
nm), reactive yellow 15 (λmax = 416 nm), reactive red 239 (λmax = 542 nm), and reactive blue 114
(λmax = 593 nm). A UV-visible spectrophotometer (Thermo, model UV1) was used in all
experiments. Decolourization is reported as: decolourization = (Ai − Af )/Ai × 100, where Ai is
the initial absorbance and Af is the final absorbance of the dye solution.
III. 4.3.4 Cyclic voltammetry
Voltammetric measurements of the reactive dyes were carried out using a BAS 100BW
(Indiana, USA) electrochemical analyzer (v = 50 mV/s). A conventional three-electrode cell was
supplied by BAS Inc. The working electrode was a glassy carbon disc electrode (BAS). The
reference and auxiliary electrodes were saturated Ag/AgCl and Pt wire, respectively. The
measurements were made at room temperature (25 ºC). Solutions were purged with nitrogen for
5 min. before the measurements and blanketed with nitrogen gas during the voltammetric
Part III – Optimization of Decolourization Equilibrium and Cyclic Voltammetry
96
scans. The experiments were performed in 0.2 mol/L acetate buffer at pH 4.5 with a dye
concentration of 1 g/L. The redox potentials recorded versus Ag/AgCl were corrected by +197
mV to normal hydrogen electrode (NHE).
III. 4.4 Results and Discussion
III. 4.4.1 Sequencing batch decolourization by commercial laccase
Dyes decolourization by two commercial laccases from different fungus was first
evaluated. No decolourization was obtained when laccase from Aspergillus (DeniLite II Base)
was employed. For laccase from T. villosa strong degradation was observed. The different
behaviour of laccases can be due to the redox potential values of each enzyme. Some studies
comparing the potential of fungal laccases have found that the difference in their redox potential
is dependent on the source of laccase (Xu et al., 1996). Laccase from Aspergillus oryzae
presents a low redox potential (550 mV vs. NHE) (Schneider et al., 1999) when compared with
the T. villosa laccase which presents a potential of 790 mV versus NHE (Li et al., 1999). So, the
higher redox potential is probably correlated with the observed higher enzyme activity.
Figure III. 4.1 shows the degradation of the reactive dyes in the presence of VA and
HBT as mediators. Commercial laccase from T. villosa was capable of decolourizing the
reactive dyes in repeated sequences over an extended period of 280 min. (7 cycles) for both
mediators, VA and HBT. Additional aliquots of concentrated dye, to obtain a final concentration
of 50 mg/L, were added to the LMS at intervals of 40 min..
The first and second cycles were accompanied by a high decolourization degree when
VA was used as mediator (Figure III. 4.1) for RB114 (≥95 %), RY15 and RR239 (≥80 %), and
for RB5 a slightly lower value was observed (70 %) at the second cycle. However,
decolourization efficiency decreased to 50–70 % in the third cycle (except for RB114) and
declined further in the next three cycles, to 10–30 % and then in the last cycle it was below
20%. For RB114, very high decolourization was observed at the third cycle (90 %), and in the
following three cycles a slight decrease of decolourization was obtained, attaining near 60 %
decolourization in the last cycle. Comparing the decolourization of the four dyes it was noted
that for RB114 and RY15, rapid decolourization was obtained up to the third cycle, while for
RB5 this behaviour was observed up to the second cycle and for RR239 the time required for
decolourization was always higher (Figure III. 4.1). Thus, excluding RR239, in the first cycles
most of the degradation took place within 10 min.. This is also evident considering the dyes
decolourization rate values at 10 min. of reaction, for the first cycle of degradation (Table III.
4.1), which show, as pointed out above, faster degradation of the RB114, RY15 and RB5 dyes
in comparison with RR239. The reaction rate is an intensive quantity, defined at each point of
the enzymatic reaction. Therefore the rate varies if the concentration changes from point to

Part III – Optimization of Decolourization Equilibrium and Cyclic Voltammetry
97
point. Probably due to the strong affinity of the substrate to the enzyme, the degradation was
rapid in the first minutes of reaction.
A slight decrease in decolourization efficiency was obtained for sequential
decolourization with HBT as mediator (Figure III. 4.1 and Table III. 4.1). This was more evident
in the case of RR239 degradation, in which the decolourization degree obtained after each
cycle using HBT was typically 2–3 lower than that obtained using AV.
Figure III. 4.1 - Sequencing batch decolourization of 50 mg/L solutions of RB114, RY15, RB5 and RR239
by laccase (0.2 U/mL) from Trametes villosa in the presence of mediators (0.2 mM): violuric acid () and
1-hydroxybenzotriazole (---) at pH 5.0 and T=40 ºC.
0
20
40
60
80
100
Deco
lou
rizati
on
(%
))
0
20
40
60
80
100
0 50 100 150 200 250 300
t (minutes)
Deco
lou
rizati
on
(%
))
RR239
0
20
40
60
80
100
0 50 100 150 200 250 300
t (minutes)
Deco
lou
rizati
on
(%
))
RB5
0
20
40
60
80
100
Deco
lou
rizati
on
(%
))
RB114 RY15

Part III – Optimization of Decolourization Equilibrium and Cyclic Voltammetry
98
Table III. 4.1 – Decolourization of reactive dyes by laccase mediator system in a single batch, and anodic
peak potential (vs. NHE) of reactive dyesa.
Decolourization (%)
b
Anodic
peak
(mV)
Dye 1 day 10 min.
Rate (mg/L.min)
c
Laccased
lac + VA
lac + HBT
lac + VA
lac + HBT
lac + VA
lac + HBT
RB114 99.8±0.1 99.2±0.3 99.6±0.2 92.3±0.7 81.1±1.6 4.6 4.1 889
RY15 NDe 90.2±1.1 94.5±1.2 85.2±2.3 76.7±1.8 4.3 3.8 1242
RB5 NDe 90.6±1.7 82.5±2.1 76.1±0.6 64.4 ±1.7 3.8 3.2 1272
RR239 NDe 98.1±0.5 83.2±1.9 26.5±4.3 19.7±1.4 1.3 1.0 1400
a Experimental conditions: dye (50 mg/L); mediator (0.2 mM); laccase (0.2 U/mL); pH = 5.0 and T = 40ºC.
b Decolourization calculated as (Ai − Af)/Ai × 100, where Ai is the initial absorbance and Af is the final absorbance of the dye solution. c Defined as the initial slope (up to 10 min.) of the dye decolourization (mg/L) vs. time (min.). d No mediator was added e No products of dye degradation were detected.
III. 4.4.2 Cyclic voltammetry of reactive dyes
In order to establish a correlation between the dyes redox behaviour and sequential
decolourization by LMS, cyclic voltammetry of the reactive dyes was employed. Figure III. 4.2
shows the cyclic voltammograms of the reactive dyes in the positive range (0–1400 mV) at a
scan rate of 50 mV/s. The oxidation peak potential (Epa) resulted in the following order: RB114
(Epa = 889 mV versus NHE) < RY15 (Epa = 1242 mV versus NHE) < RB5 (Epa = 1272 mV versus
NHE) < RR239 (Epa = 1400 mV versus NHE). In general, no noticeable reduction peaks were
observed, showing that for the dyes studied oxidation reactions were electrochemically
irreversible. For RB5 and RR239 the oxidation peak in each case was less well-defined
probably due to the adsorption of the dye at the electrode surface.

Part III – Optimization of Decolourization Equilibrium and Cyclic Voltammetry
99
RB5
-1.40E-05
-1.20E-05
-1.00E-05
-8.00E-06
-6.00E-06
-4.00E-06
-2.00E-06
0.00E+00
2.00E-06
0 200 400 600 800 1000 1200 1400 1600
Potential (mV) vs. Ag/AgCl
Cu
rren
t (A
)
RY15
-1.20E-05
-1.00E-05
-8.00E-06
-6.00E-06
-4.00E-06
-2.00E-06
0.00E+00
2.00E-06
4.00E-06
0 200 400 600 800 1000 1200 1400 1600
Potential (mV) vs. Ag/AgCl
Cu
rre
nt
(A)
RB114
-1.40E-05
-1.20E-05
-1.00E-05
-8.00E-06
-6.00E-06
-4.00E-06
-2.00E-06
0.00E+00
2.00E-06
0 200 400 600 800 1000 1200 1400 1600
Potential (mV) vs. Ag/AgCl
Cu
rre
nt
(A)
RR239
-1.00E-05
-8.00E-06
-6.00E-06
-4.00E-06
-2.00E-06
0.00E+00
2.00E-06
0 200 400 600 800 1000 1200 1400 1600
Potential (mV) vs. Ag/AgCl
Cu
rren
t (A
)
Figure III. 4.2 - Cyclic voltammograms (v = 50 mV/s) of the reactive dyes (1 g/L) in a 0.2 M acetate buffer
solution at pH = 4.5.
The decolourization after 10 min. of reaction versus the redox potential is displayed in
Figure III. 4.3. The oxidation efficiency remained very high for the dyes with redox potentials
below 1250 mV versus NHE and decreased proportionally for redox potentials exceeding this
value. Previous work with azo dyes has shown that a linear correlation between the percentage
decolourization and the respective anodic peak potential is found (Zille et al., 2004). However,
this linearity was maintained for a specific period, just during the initial period of decolourization,
and then the linearity disappeared (Zille et al., 2004). Thus, the results presented here show
that the efficiency of decolourization by laccase increases with decreasing dye oxidation
potential.
0
20
40
60
80
100
800 1000 1200 1400 1600
Potential (mV) vs NHE
Deco
lou
rizati
on
(%))
HBT VA
Figure III. 4.3 - Correlation between the oxidation peak potential and decolourization (%) of reactive dyes
(50 mg/L) after 10 minutes of reaction with laccase (0.2 U/mL) from Trametes villosa.

Part III – Optimization of Decolourization Equilibrium and Cyclic Voltammetry
100
To help understand the suggested mechanism, new investigations of decolourization by
LMS were carried out under the same conditions. The decolourization of the reactive dyes was
tested in a single batch for 1 day of incubation with and without mediator to attain the maximum
dye removal. The results presented in Table III. 4.1 show that RB114 was the only dye
decolourized by laccase without mediator due to the lower redox potential (889 mV versus
NHE) presenting high decolourization. The oxidation rate of the dyes decreased to zero after
significantly exceeding the redox potential of the laccase. However, in some cases laccase is
able to oxidize certain compounds with E0 values higher than its own (500–800 mV versus
NHE) (Husain and Husain, 2008). Then, the presence of a mediator was required for
decolourization of the other dyes RY15, RB5 and RR239, whose potentials are very high
(>1200 mV versus NHE), once the use of redox mediators provide high redox potentials (>900
mV) to attack the recalcitrant structure and those are able to migrate into the aromatic structure
of the dyes (Husain and Husain, 2008). Figure III. 4.4 shows the decolourizations achieved for
each dye.
Figure III. 4.4 – Initial and treated solutions of RY15, RR239, RB114 and RB5, showing the
decolourizations achieved.
Comparing the two mediators, VA seems to be a more effective mediator for
decolourization (Figure III. 4.3 and Table III. 4.1) of the reactive dyes studied. VA is a more
favourable mediator than HBT, probably due to the longer lifetime of the VA under the
conditions studied. E1/2 = 900 mV (versus NHE) for VA and Epa = 1100 mV for HBT have been
reported at pH 5.0 (Feng et al., 2000). In addition, the cyclic voltammetry of HBT exhibited
irreversible oxidation once only a very small cathodic peak was detected. The better stability,
electrochemical reversibility and lower potential of VA can explain the better performance of VA
when compared with HBT. The oxidation of HBT generates an unstable intermediate radical
that decays into inactive catalytic products (Feng et al., 2000).
The choice of an adequate mediator plays a key role for the general applicability and
effectiveness of LMS. Many possible mediator compounds have already been described in the
literature for the degradation of various compounds. In this work, two mediators were tested as

Part III – Optimization of Decolourization Equilibrium and Cyclic Voltammetry
101
described above. The colour removal from the reactive dyes was dependent on their redox
potentials and could also depend on the mediator (VA and HBT) potential. The oxidation of
polycyclic aromatic hydrocarbons by laccase and mediators with different redox potential
demonstrated that the oxidation efficiency increased proportionally with the redox potentials of
the phenolic mediators up to a maximum value of 900 mV and decreased thereafter with redox
potentials exceeding this value. This was attributed to the fact that the reaction does not end for
mediators with potentials much higher than laccase (Johannes and Majcherczyk, 2000).
III. 4.5 Conclusions
The results presented here demonstrate that laccase from T. villosa can be used over a
long period (>250 min.) of sequential dye degradations. Seven repetitive decolourization cycles
performed using LMS demonstrated the feasibility of biological catalysts and their reuse in
reactive dyes degradation. Thus, LMS may possibly be applied for the effective treatment of
effluents from the textile industry.
III. 4.6 References Amaral, P.F.F., Fernandes, D.L.A., Tavares, A.P.M., Xavier, A.M.R.B., Cammarota, M.C., Coutinho, J.A.P., Coelho, M.A.S., 2004. Dye decolorization performed by Trametes versicolor from textile wastewater. Environmental Technology, 25, 1313-1320.
Borchert, A., Libra, J.A., 2001. Decolorization of reactive dyes by the white rot fungus Trametes versicolor in sequencing batch reactors. Biotechnology and Bioengineering, 75, 313-321.
Camarero, S., Ibarra, D., Martínez, M.J., Martínez, A.T., 2005. Lignin-derived compounds as efficient laccase mediators for decolorization of different types of recalcitrant dyes. Applied and Environmental Microbiology, 71, 1775–1784.
Cristóvão, R.O., Tavares, A.P.M., Ribeiro, A., Loureiro, J.M., Boaventura, R.A.R., Macedo, E.A., 2008. Kinetic modelling and simulation of laccase catalyzed degradation of reactive textile dyes. Bioresource Technology, 99, 4768–4774.
Feng, X., Kulys, J.J., Duke, K., Li, K., Krikstopaitis, K., Deussen, H.J.W., Abbate, E., Alinyte, V., Schneider, P., 2000. Redox chemistry in laccase-catalyzed oxidation of n-hydroxy compounds. Applied and Environmental Microbiology, 66, 2052–2056.
Fernández-Sanchez, C., Tzanov, T., Gübitz, G.M., Cavaco-Paulo, A., 2002. Voltammetric monitoring of laccase-catalysed mediated reactions. Bioelectrochemistry, 58, 149– 156.
Forgacs, E., Cserhátia, T., Oros, G., 2004. Removal of synthetic dyes from wastewaters: a review. Environmental International, 30, 953– 971.
Gamelas, J.A.F., Tavares, A.P.M., Evtuguin, D.V., Xavier, A.M.B., 2005. Oxygen bleaching of kraft pulp with polyoxometalates and laccase applying multi-stage process: comparative study. Journal of Molecular Catalysis B: Enzymes, 33, 57-64.
Horwitz, C.P., Fooksman, D.R., Vuocolo, L.D., Gordon-Wylie, S.W., Cox, N.J., Collins, T.J., 1998. Ligand design approach for securing robust oxidation catalysts. Journal of American Chemical Society, 120, 4867-4868.
Houk, V.S., 1992. The genotoxicity of industrial wastes and effluents—a review. Mutation Research, 277, 91–138.

Part III – Optimization of Decolourization Equilibrium and Cyclic Voltammetry
102
Husain, Q., 2006. Potential applications of the oxidoreductive enzymes in the decolorization and detoxification of textile and other synthetic dyes from polluted water: A Review. Critical Reviews in Biotechnology, 26, 201–221.
Husain, M., Husain, Q., 2008. Applications of redox mediators in the treatment of organic pollutants by using oxidoreductive enzymes: A Review. Critical Reviews in Environmental Science and Technology, 38, 1–42.
Johannes, C., Majcherczyk, A., 2000. Natural mediators in the oxidation of polycyclic aromatic hydrocarbons by laccase mediator systems. Applied and Environmental Microbiology, 66, 524–528.
Krull, R., Hemmi, M., Otto, P., Hempel, D.C., 1998. Combined biological and chemical treatment of highly concentrated residual dyehouse liquors. Water Science and Technology, 38, 339-346.
Li, K., Xu, F., Eriksson, K.E.L., 1999. Comparison of fungal laccases and redox mediators in oxidation of a nonphenolic lignin model compound. Applied and Environmental Microbiology, 65, 2654–2660.
Libra, J.A., Borchert, M., Banit, S., 2003. Competition strategies for the decolorization of a textile-reactive dye with the white-rot fungi Trametes versicolor under non-sterile conditions. Biotechnology and Bioengineering, 82, 736-744.
Schneider, P., Caspersen, M.B., Mondorf, K., Halkier, T., Skov, LK., Østergaard, P.R., Brown, K.M., Brown, S.H., Xu, F., 1999. Characterization of a Coprinus cinereus laccase. Enzyme and Microbial Technology, 25, 502–508.
Tavares, A.P.M., Cristóvão, R.O., Loureiro, J.M., Boaventura, R.A.R., Macedo, E.A., 2008. Optimization of reactive textile dyes degradation by laccase-mediator system. Journal of Chemical Technology and Biotechnology, 83, 1609-1615.
Tavares, A.P.M., Cristóvão, R.O., Loureiro, J.M., Boaventura, R.A.R., Macedo, E.A., 2009. Application of statistical experimental methodology to optimize reactive dye decolourisation by commercial laccase. Journal of Hazardous Materials, 162, 1255-1260.
Vandevivere, P.C., Bianchi, R., Verstraete, W., 1998. Treatment and reuse of wastewater from the textile wet-processing industry: review of emerging technologies. Journal of Chemical Technology and Biotechnology, 72, 289-302.
Xu, F., Shin, W., Brown, S.H., Wahleithner, J.A., Sundaram, U.M., Solomon, E.I., 1996. A study of a series of recombinant fungal laccases and bilirubin oxidase that exhibit significant differences in redox potential, substrate specificity, and stability. Biochimica et Biophysica Acta, 1292, 303-311.
Zille, A., Ramalho, P., Tzanov, T., Millward, R., Aires, V., Cardoso, M.H., Ramalho, M.T., Gubitz, G.M., Cavaco-Paulo, A., 2004. Predicting dye biodegradation from redox potentials. Biotechnology Progress, 20, 1588-1592.

Part IV
Kinetic Modelling and Simulation


Part IV deals with the kinetic modelling and simulation of the decolourization reactions.
Part IV. 1 is dedicated to the development of mathematical models to simulate the
decolourization kinetics of each of the reactive dyes studied in the previous part by commercial
laccase (DeniLite II S).
In part IV. 2 the degradation of a mixture of three reactive textile dyes (Reactive Black 5,
Reactive Yellow 15 and Reactive Red 239), simulating a real textile effluent, by commercial
laccase, is investigated in a batch reactor and mathematical models are developed to simulate
the kinetics of the reaction.
Part IV. 3 presents the treatment of a synthetic dye house effluent, simulating a textile
wastewater containing various reactive dyestuffs (Reactive Yellow 15, Reactive Red 239 and
Reactive Black 5), salts and auxiliary chemicals by commercial laccase and the mathematical
models developed concerning the kinetics of the reaction. The water quality parameters of the
simulated effluent are also evaluated.

Part IV. 1 Kinetic modelling and simulation
of laccase catalyzed degradation of reactive
textile dyes*
IV. 1.1 Abstract
IV. 1.2 Introduction
IV. 1.3 Materials and Methods
IV. 1.4 Kinetic Modelling: Optimization and Simulation
IV. 1.5 Results and Discussion
IV. 1.6 Conclusions
IV. 1.7 References
*based on: Cristóvão, R.O., Tavares, A.P.M., Ribeiro, A.S., Loureiro, J.M., Boaventura, R.A.R., Macedo, E.A., 2008. Kinetic modelling and simulation of laccase catalyzed degradation of reactive textile dyes. Bioresource Technology, 99, 4768-4774.


Part IV – Kinetic Modelling and Simulation
109
IV. 1 Kinetic modelling and simulation of laccase catalyzed
degradation of reactive textile dyes
IV. 1.1 Abstract
A kinetic model based on Michaelis–Menten equation was developed to simulate the
dye decolourization of Reactive Black 5 (RB5), Reactive Blue 114 (RB114), Reactive Yellow 15
(RY15), Reactive Red 239 (RR239) and Reactive Red 180 (RR180) dyes by commercial
laccase. The unusual kinetic behaviour of some of these reactions suggests that the kinetic
model must consider the activation of the laccase-mediator system. Several reactions at
different concentrations of each dye were performed in batch reactors and time courses were
obtained. A LSODE code to solve the differential equation obtained from the batch reactor was
combined with an optimization Fortran program to obtain the theoretical time courses. The time
courses obtained from the developed program were compared with the experimentally obtained
ones to estimate the kinetic constants that minimized the difference between them. The close
correlation between the predicted and the experimental results seems to support the reliability
of the established models.
IV. 1.2 Introduction
Considering both volumes discharged and effluent composition, the wastewater
generated by the textile industry is rated as the most polluting among all industrial sectors
(Vandevivere et al., 1998). The presence of very low concentrations of dyes in effluent is highly
visible and undesirable (Nigam et al., 2000). There are more than 100,000 commercially
available dyes with over 7 x 10⁵ ton of dyestuff produced annually (Robinson et al., 2001). The
dyes do not bind completely to the fabric and depending on the class of the dye its loss in
wastewaters could vary from 2 % for basic dyes to as high as 50 % for reactive dyes (Pandey et
al., 2007), causing serious environmental problems. The presence of colour in water will affect
the transmission of light and photosynthesis and reduce aquatic diversity.
Many dyes are difficult to decolourize due to their complex structure and synthetic
origin. A variety of physical, chemical and biological methods are presently available for the
treatment of textile wastewater (Anjaneyulu et al., 2005; Forgacs et al., 2004; Slokar and
Marechal, 1998). There is a growing recognition that enzymes can be used in many remediation
processes to target specific pollutants for treatment (Durán and Esposito, 2000). Different
studies show that extracellular ligninolytic enzymes of white-rot fungi can degrade a wide variety
of recalcitrant compounds, such as dyes (Chivukula and Renganathan, 1995; Harazono et al.,
2003; Lan et al., 2006; Nyanhongo et al., 2002). Laccase (p-diphenol oxidase, EC 1.10.3.2)
catalyzes the oxidation of phenolic compounds and aromatic amines and accepts a broad range
Part IV – Kinetic Modelling and Simulation
110
of substrates (Claus, 2004; Thurston, 1994). The number of substrates can be extended by
addition of a redox mediator (Bourbonnais and Paice, 1990; Soares et al., 2001). The mediator
is a compound with low molecular weight which acts as a kind of electron carrier. Once it is
oxidised by the enzyme, it diffuses away from the catalytic system and in turn oxidizes any
substrate that, due to its size, could not be directly oxidized by the enzyme (Call and Mucke,
1997).
The kinetics of a reaction system can be studied by a mathematical modelling
technique. The most important matter is to find an accurate model equation that has the
capability to estimate the value of the reaction rate close to the experimentally observed one.
The model of a certain reaction system should consider all the important parameters. Once
formulated, it can be solved and the predicted behaviour can be compared with experimental
data. Any significant differences between the system performance and the behaviour predicted
by the model imply that there may be some other important effects not considered. The kinetic
constants are estimated by fitting the model equation to the experimental data. The model can
then be used for such purposes as predicting the system performance under different operating
conditions, reactor design, scale-up, optimization and control of the system (Bas et al., 2007;
Houng and Liau, 2006).
Studies on dye degradation by laccase have been published (Abadulla et al., 2000;
Campos et al., 2001; Kandelbauer et al., 2004; Wong and Yu, 1999). However, not so many
papers have actually dealt with the kinetics of the reaction. Some works reported the values of
kinetic constants of enzymatic dye degradation obtained from initial reaction rates (Almansa et
al., 2004; Moldes and Sanroman, 2006), but to our knowledge there has been no study that
determined the kinetic constants of enzymatic dye decolourization from the entire time course
data.
The aim of this work is to establish a mathematical model and to determine the kinetic
constants that can adequately describe the kinetic behaviour of five reactive textile dyes
(Reactive Black 5 (RB5), Reactive Blue 114 (RB114), Reactive Yellow 15 (RY15), Reactive Red
239 (RR239) and Reactive Red 180 (RR180)) decolourization by a commercial laccase.
Success of the model was determined by comparing the time courses obtained experimentally
with those obtained from the model.
IV. 1.3 Materials and Methods
IV. 1.3.1 Chemicals and enzyme
Textile dyes: Reactive Black 5 (Remazol Black B), Reactive Blue 114 (Levafix Brilliant
Blue E-BRA), Reactive Yellow 15 (Remazol Yellow GR), Reactive Red 239 (Remazol Brilliant

Part IV – Kinetic Modelling and Simulation
111
Red 3BS) and Reactive Red 180 (Remazol Brilliant Red F3B) were kindly provided by DyStar
(Portugal) and were used for degradation experiments without any further purification.
Enzyme: Commercial laccase formulation (DeniLite II S; 120 U/g) from genetically
modified Aspergillus was kindly provided by Novozymes. This formulation is used for indigo dye
decolourization in denim finishing operations and includes a buffer and an enzyme mediator.
IV. 1.3.2 Dye decolourization kinetics
Preliminary studies of optimization of laccase-catalyzed decolourization of reactive dyes
by response surface methodology enabled us to establish the optimal conditions of pH,
temperature and enzyme mass used in reactor for each degradation. However, the commercial
laccase formulation is a heterogeneous mixture. Reactions with the optimal enzyme mass
showed that it was not possible to get reproducible results with this amount of enzyme. The
amount of enzyme used was not representative of the composition of the mixture. Assays were
carried out where the enzyme mass was increased five times, obtaining, by this way,
reproducible results. However, unexpectedly, the reactions with more enzyme loads exhibited
an apparent lesser degradation. In order to understand this phenomenon, a batch without dye,
i.e., with only the enzyme and a buffer was carried out under stirring. It was observed that, after
a short period of time, some turbidity appeared that increased with time (Figure IV. 1.1). This
fact was not observed when a small amount of enzyme was used. Thus, this turbidity (apparent
colour) masks the effective degradation and contributes for the observed lesser degradation. To
cope with this problem, the enzyme and buffer solution absorbances were measured along time
at the maximum absorbance wavelength of each dye and their values were subtracted from the
corresponding absorbance value of the dye degradation reaction.
Figure IV. 1.1 - Colour formed by the enzyme solution over time.
So, to study the kinetic behaviour of the five reactive textile dyes, five different
concentrations of each dye (from 25 mg/L to 125 mg/L) and 432 U/L of commercial laccase
were incubated in 50 mL Erlenmeyer flasks at 35 ºC with phosphate buffer (50 mM/ pH 7.0)
under stirring. For each assay duplicate runs were made.

Part IV – Kinetic Modelling and Simulation
112
After taking a zero sample, decolourization was started by the addition of laccase.
Samples were withdrawn at certain time intervals that increased as the reaction proceeded. The
samples were subsequently analyzed by UV–vis spectrophotometry.
IV. 1.3.3 Determination of dye concentration
Dye concentration was determined through a calibration curve by reading the
absorbance of the samples at the maximum absorbance wavelength for each dye: Reactive
Black 5 (579 nm), Reactive Blue 114 (593 nm), Reactive Yellow 15 (416 nm), Reactive Red 239
(542 nm) and Reactive Red 180 (540 nm). UV–vis spectrophotometer (Thermo, model UV1)
was used in all experiments. By measuring the amount of the substrate remaining overtime it is
possible to obtain the concentration versus time plot which is known as progress curve of the
enzymatic reaction or time course.
IV. 1.4 Kinetic modelling: optimization and simulation
IV. 1.4.1 Kinetics of enzymatic reactions
In 1913, Michaelis and Menten proposed a reaction mechanism for enzymatic reactions.
As a starting point, it is assumed that the enzyme and substrate combine to form a complex,
which then dissociates into product and free enzyme as follows:
PEESSE 2MS kK +→ →←+
where E, S, ES and P are enzyme, substrate, enzyme-substrate complex and product,
respectively. KMS and k2 represent Michaelis-Menten constant and catalytic rate constant,
respectively. The dependence of the reaction rate (v) on the substrate concentration is
represented by the Michaelis-Menten equation and can be derived as:
[ ] [ ][ ]SK
SvESkv
MS
max2
+== (IV. 1.1)
where vmax is the maximum reaction rate and [ES] and [S] are concentrations of the enzyme-
substrate complex and the substrate, respectively.
Preliminary studies showed that the degradation of some reactive dyes by commercial
laccase is not complete. So, to describe the kinetics of these enzymatic decolourizations the
irreversible (Equation (IV. 1.1)) and the reversible (Equation (IV. 1.2)) forms of Michaelis-
Menten equation were employed (Murzin and Salmi, 2005).

Part IV – Kinetic Modelling and Simulation
113
[ ] [ ]
[ ] [ ]SK
P1K
K
PSv
v
MP
MS
eq
max
+
+
−
= (IV. 1.2)
where Keq is the equilibrium constant and KMP is the Michaelis-Menten constant for product. [P]
is the product concentration.
IV. 1.4.2 Batch reactor balance
The differential equation obtained from the mass balance to a batch reactor is given by
Equation (IV. 1.3).
[ ]
L
EV
1.W.v
dt
Sd=− (IV. 1.3)
where WE is the enzyme mass, VL is the volume of the reactor and t is the time.
IV. 1.4.3 Activation of the laccase-mediator system
In general enzymatic reactions, the reaction rate increases with the increase of
substrate concentration. When the substrate concentration increases up to a certain high value,
the reaction rate reaches a plateau and keeps constant even if more substrate is used. On
preliminary studies of dye degradation reactions it was possible to observe for some reactive
dyes an unusual kinetic behaviour: there is a short period of time in the beginning of the
reaction that does not follow the Michaelis-Menten equation. At this point an increase in the
concentration of substrate causes only a very small increase in the rate – the slope is less than
predicted. Preliminary results have also shown that pure laccase did not decolourize the five
reactive textile dyes under study, indicating that the presence of a mediator to oxidise the dyes
was required. The oxidation was not carried out by the enzyme directly, but rather by the
oxidised form of the mediator. So, the time period described seems to correspond to an
induction time where an activation effect of the laccase-mediator system occurs. This situation
is similar to a perfectly agitated solution where the enzyme and the mediator are present, but
initially they cannot oxidise the substrate. They need a period of time to be activated, that is
represented by an exponential term. So, in order to predict this period for some of the dyes a
new term, taking into account this induction time, was added to the equations previously
presented.

Part IV – Kinetic Modelling and Simulation
114
[ ][ ]
)e1(SK
Svv kt
MS
max −−+
= (IV. 1.4)
[ ] [ ]
[ ] [ ]( )kt
MP
MS
eq
max
e1
SK
P1K
K
PSv
v −−
+
+
−
= (IV. 1.5)
where k is the rate constant of the activation period of the laccase-mediator system.
IV. 1.4.4 Estimation of the reaction kinetics and kinetic constants
To predict dye concentrations versus time profile in the batch reactor, the system of
equations obtained from the batch reactor balance (Equation (IV. 1.3)) and from the proposed
kinetics for the enzymatic reactions (Equation (IV. 1.1), (IV. 1.2), (IV. 1.4) or (IV. 1.5)) was
solved using a Fortran program with integration by LSODE solver (Livermore Solver for
Ordinary Differential Equations) based on Adams Backward Differentiation Formula methods.
The initial concentrations of dye and variables were fed to the program. This program was
combined with an optimization algorithm to estimate the kinetic constants of the proposed
model by minimizing the difference between the predicted time courses and the ones obtained
experimentally. The function to minimize between both time courses was the sum of squared
relative residuals and was calculated as in Equation (IV. 1.6).
∑−
=n
1
2
exp
expcalc
C
CCF (IV. 1.6)
where Ccalc is the concentration calculated using the model equation, Cexp is the experimental
concentration and n is the total number of experimental or calculated points. The function was
minimized through an optimization loop based on an adaptative random search algorithm that
varies the values of the kinetic constants until a global minimum within the optimization criteria
is achieved (Salcedo et al., 1990; Salcedo, 1992). This procedure was repeated for each dye
studied.
IV. 1.5 Results and discussion
IV. 1.5.1 Kinetic modelling and estimation of kinetic constants
A kinetic model to simulate the decolourization of each of the five reactive textile dyes in
a batch reactor by a commercial laccase formulation containing a specific mediator was

Part IV – Kinetic Modelling and Simulation
115
proposed. Some studies related to dye degradation present kinetic constants values based on
initial reaction rates (Kandelbauer et al., 2004; Soares et al., 2002). In this work, the kinetic
constants of the proposed models were estimated by comparing the experimental time courses
with the predicted ones for each dye.
Experimental time courses were obtained in duplicate at five different initial dye
concentrations for each dye. For RB5, RB114 and RY15, it was observed that initially the dye
concentration almost do not decrease, probably corresponding to the activation time of the
laccase-mediator system. So, the kinetic model for these dyes must present an exponential
term to predict this induction time. For RB5 and RB114 the dye concentration decreases with
the increase of time until reaching a plateau where no more dye is degraded, while the
experiments with RY15, RR239 and RR180 presented complete degradation.
A program using the LSODE code to solve the differential equation obtained from the
batch reactor balance (Equation (IV. 1.3)) considering the proposed kinetics for the enzymatic
reaction (Equation (IV. 1.1) for RR239 and RR180, Equation (IV. 1.4) for RY15 and Equation
(IV. 1.5) for RB5 and RB114) was combined with an optimization program (Salcedo et al., 1990;
Salcedo, 1992) to obtain the theoretical time courses. The algorithm developed adjusts
automatically the kinetic constants so that the output response (predicted by the model) and the
input values (experimental data) were as close as possible according to the objective function
(Equation (IV. 1.6)). Estimation was made and the results were compared with the
corresponding experimental value. This process was repeated while the relative errors between
the estimated and the experimental values decreased.
The obtained kinetic constants for each dye considering the selected kinetic model are
shown in Table IV. 1.1, which were used to draw the continuous lines in Figures IV. 1.2 – IV.
1.6.
Table IV. 1.1 – Proposed model, kinetic data and average sum of squared relative residuals (SSRR) for
RB5, RB114, RY15, RR239 and RR180 degradation by commercial laccase.
RB5 RB114 RY15 RR239 RR180
Kinetic equation (IV. 1.5) (IV. 1.5) (IV. 1.4) (IV. 1.1) (IV. 1.1)
vmax (mg/g.min) 20.000 18.677 37.500 1.190 3.460
KMS (mg/L) 3.1384 21.283 99.000 165.000 650.000
KMP (mg/L) 300.0 450.0 --- --- ---
Keq 15.000 2.278 --- --- ---
k (min-1
) 0.192 0.067 0.081 --- ---
SSRR/n 8.836x10⁻² 4.948x10⁻³ 918.548 6.233 6.823

Part IV – Kinetic Modelling and Simulation
116
In a system without a mediator, the Michaelis–Menten constant KMS is the equilibrium
constant of the enzyme–substrate complex decomposition, so, by analogy, in a system with a
mediator the KMS constant is probably the equilibrium constant of the enzyme-
mediator/substrate complex decomposition. So, it is a measure of the enzyme-mediator system
affinity to the substrate. The lesser the value of KMS, the larger is the affinity of the enzyme-
mediator system to the substrate. Comparing the KMS values of each dye, the laccase-mediator
system affinities for the dyes decrease according to the following order: RB5 > RB114 > RY15 >
RR239 > RR180. This result is easy to confirm in Figures IV. 1.2 – IV. 1.6 by the time that each
dye takes to reach the equilibrium. A larger dyes degradation time corresponds to a more
difficult decolourization (less affinity of laccase-mediator system for the dye), probably due to
the structure of the dye or to the difference of redox potential between the dye and the laccase-
mediator system (Almansa et al., 2004; Kandelbauer et al., 2004; Zille et al., 2004). The velocity
of dyes degradation can also be evaluated by the value of vmax – the theoretical maximal
velocity, which is proportional to the kinetic constant k2. According to the values of vmax
presented in Table IV. 1.1 for each dye studied, the degradation of dyes RB5, RB114 and RY15
by commercial laccase is faster than the degradation of RR239 and RR180, that present lower
values of vmax.
The activation of the laccase-mediator system is another important aspect to be
considered. The present study enables one to evaluate the activation rate of the laccase
mediator system on RB5, RB114 and RY15 dyes degradation by inspection of the k values
obtained in the kinetic model (Table IV. 1.1). According to the results, the activation of the
laccase-mediator system is faster in the degradation of RB5 and decreases in the following
order: RB5 > RY15 > RB114. To our knowledge, this is the first report on the activation of the
laccase-mediator system on dyes degradation by enzyme laccase.
In order to evaluate the adequacy of the proposed model for the kinetics of dye
decolourization by commercial laccase, the time courses calculated by the kinetic models were
compared with the experimental ones. These comparisons for RB5, RB114, RY15, RR239 and
RR180 degradation are presented in Figures IV. 1.2 – IV. 1.6, respectively. For RR239 and
RR180 only three different concentrations are presented to avoid overloading the graphs.

Part IV – Kinetic Modelling and Simulation
117
Figure IV. 1.2 - Comparison of experimental (× run 1; o run 2) and simulated (continuous line) time
courses of RB5 degradation by commercial laccase under different dye initial concentrations: (a) 116.0
mg/L and 115.8 mg/L; (b) 99.5 mg/L and 99.3 mg/L; (c) 88.5 mg/L and 85.8 mg/L; (d) 78.9 mg/L and 76.0
mg/L; (e) 49.9 mg/L and 51.5 mg/L.
Figure IV. 1.3 – Comparison of experimental (× run 1; o run 2) and simulated (continuous line) time
courses of RB114 degradation by commercial laccase under different dye initial concentrations: (a) 118.4
mg/L and 117.8 mg/L; (b) 93.2 mg/L and 96.2 mg/L; (c) 74.6 mg/L and 74.1 mg/L; (d) 50.3 mg/L and 50.4
mg/L; (e) 27.6 mg/L and 27.3 mg/L.
0
20
40
60
80
100
120
140
0 2 4 6 8 10 12
time (minutes)
Co
nc
en
tra
tio
n (
mg
/L)
(a)
(b)
(c)
(d)
(e)
0
20
40
60
80
100
120
140
0 10 20 30 40 50
time (minutes)
Co
ncen
trati
on
(m
g/L
)
(a)
(b)
(c)
(d)
(e)

Part IV – Kinetic Modelling and Simulation
118
Figure IV. 1.4– Comparison of experimental (× run 1; o run 2) and simulated (continuous line) time
courses of RY15 degradation by commercial laccase under different dye initial concentrations: (a) 116.8
mg/L and 116.9 mg/L; (b) 95.9 mg/L and 97.4 mg/L; (c) 75.3 mg/L and 76.1 mg/L; (d) 47.7 mg/L and 49.1
mg/L; (e) 25.3 mg/L and 25.6 mg/L.
Figure IV. 1.5 – (1) Comparison of experimental (× run 1; o run 2) and simulated (continuous line) time
courses of RR239 degradation by commercial laccase under different dye initial concentrations: (a) 123.0
mg/L and 122.2 mg/L; (b) 73.7 mg/L and 72.8 mg/L; (c) 24.3 mg/L and 24.0 mg/L. (2) Scale amplification
of (1).
0
20
40
60
80
100
120
140
0 5 10 15 20 25
time (minutes)
Co
ncen
trati
on
(m
g/L
)
(a)
(b)
(c)
(d)
(e)
0
20
40
60
80
100
120
140
0 100 200 300 400 500
time (minutes)
Co
nc
en
tra
tio
n (
mg
/L)
020406080
100120140
0 20 40 60 80
(1)
(2)
(a)
(b)
(c)

Part IV – Kinetic Modelling and Simulation
119
Figure IV. 1.6 – (1) Comparison of experimental (× run 1; o run 2) and simulated (continuous line) time
courses of RR180 degradation by commercial laccase under different dye initial concentrations: (a) 116.3
mg/L and 115.8 mg/L; (b) 69.9 mg/L and 69.8 mg/L; (c) 23.4 mg/L and 23.0 mg/L. (2) Scale amplification
of (1).
The comparisons show that the model proposed, including an induction period and
reversible reaction (Equation (IV. 1.5)), describes with remarkable accuracy the RB114
degradation (Figure IV. 1.3) and less well the RB5 degradation (Figure IV. 1.2). The degradation
of the remaining dyes seems to be irreversible since the experimentally measured
concentrations, after subtracting the turbidity communicated by the enzyme support, tends to
zero. In these cases, whether with (RY15, Figure IV. 1.4) or without (RR239, Figure IV. 1.5 and
RR180, Figure IV. 1.6) an induction period, the proposed models, although exhibiting a correct
qualitative behaviour, present some systematic quantitative deviations, more evident for the
yellow dye RY15. The results in Table IV. 1.1 show that Equation (IV. 1.4) seems not to be
applicable to RY15; this is probably due to the fact that both this dye and the enzyme plus buffer
solution show their maximum absorbances at close wavelength values. Note that the
absorbance of the enzyme plus buffer solution was subtracted during the treatment of the
results, probably masking the dye absorbance results for this case. It should be noted that if the
turbidity (apparent colour) due to the enzyme support were not subtracted, the last models
would do a better job. Since this apparent colour is not very reproducible, some work has to be
done yet in order to try to understand what is really happening. Nonetheless, the proposed
mathematical models with the parameters values displayed in Table IV. 1.1, can be considered
to represent within reasonable accuracy the observed dyes degradations and the overall
behaviour of these systems. In principle, the models can be used whenever the commercial
laccase is used in the degradation of reactive dyes. But the fact that the behaviour of the
0
20
40
60
80
100
120
140
0 100 200 300 400 500 600
time (minutes)
Co
nc
en
tra
tio
n (
mg
/L)
020406080
100120140
0 20 40 60 80
(1)
(2)
(a)
(b)
(c)

Part IV – Kinetic Modelling and Simulation
120
commercial laccase changes with the colour of the dye indicates that they should be used with
care.
IV. 1.6 Conclusions
Mathematical models based on Michaelis–Menten equation were proposed for reactive
dyes degradation by commercial laccase in a batch reactor.
In this study, kinetic constants were determined by minimizing the difference between
the time courses predicted by the model and experimental ones. The similarity between the
experimental data and the predicted values for all dyes studied indicates that the proposed
models could simulate successfully the kinetic behaviour of reactive dyes degradation by
commercial laccase.
The models allow to examine the effects of the considered process parameters on
decolourization of reactive dyes by commercial laccase and can be used to predict the time
courses of the substrate consumption and the product formation under different substrate
concentrations. The knowledge of the kinetic models of these reactions also provides an
emergent tool that can be applied to the simulation and design of enzymatic bioreactors.
IV. 1.7 References Abadulla, E., Tzanov, T., Costa, S., Robra, K.H., Cavaco-Paulo, A., Gubitz, G.M., 2000. Decolorization and Detoxification of Textile Dyes with a Laccase from Trametes hirsuta. Applied and Environmental Microbiology, 66, 3357-3362.
Almansa, E., Kandelbauer, A., Pereira, L., Cavaco-Paulo, A., Gubitz, G.M., 2004. Influence of Structure on Dye Degradation with Laccase Mediator Systems. Biocatalysis and Biotransformation, 22, 315-324.
Anjaneyulu, Y., Chary, N.S., Raj, D.S.S., 2005. Decolourization of industrial effluents - available methods and emerging technologies - a review. Reviews in Environmental Science and Biotechnology, 4, 245-273.
Bas, D., Dudak, F.C., Boyaci, I.H., 2007. Modeling and optimization IV: Investigation of reaction kinetics and kinetic constants using a program in which artificial neural network (ANN) was integrated. Journal of Food Engineering, 79, 1152-1158.
Bourbonnais, R., Paice, M.G., 1990. Oxidation of non-phenolic substrates. An expanded role for laccase in lignin biodegradation. Febs Letters, 267, 99-102.
Call, H.P., Mucke, I., 1997. History, overview and applications of mediated lignolytic systems, especially laccase-mediator-systems. Journal of Biotechnology, 53, 163-202.
Campos, R., Kandelbauer, A., Robra, K.H., Cavaco-Paulo, A., Gubitz, G.M., 2001. Indigo degradation with purified laccases from Trametes hirsuta and Sclerotium rolfsii. Journal of Biotechnology, 89, 131-139.
Chivukula, M., Renganathan, V., 1995. Phenolic Azo Dye Oxidation by Laccase from Pyricularia oryzae. Applied and Environmental Microbiology, 61, 4374-4377.
Claus, H., 2004. Laccases: structure, reactions, distribution. Micron, 35, 93-96.
Durán, N., Esposito, E., 2000. Potential applications of oxidative enzymes and phenoloxidase-like compounds in wastewater and soil treatment: a review. Applied Catalalysis B-Environment, 28, 83-99.
Forgacs, E., Cserháti, T., Oros, G., 2004. Removal of synthetic dyes from wastewaters: a review. Environment International, 30, 953-971.

Part IV – Kinetic Modelling and Simulation
121
Harazono, K., Watanabe, Y., Nakamura, K., 2003. Decolorization of Azo Dye by the White-Rot Basidiomycete Phanerochaete sordida and by Its Manganese Peroxidase. Journal of Bioscience and Bioengineering, 95, 455-459.
Houng, J.Y., Liau, J.S., 2006. Mathematical modeling of asymmetric reduction of ethyl 4-chloro acetoacetate by bakers' yeast. Enzyme and Microbial Technology, 38, 879-886.
Kandelbauer, A., Erlacher, A., Cavaco-Paulo, A., Gubitz, G.M., 2004. Laccase-catalyzed Decolorization of the Synthetic Azo-dye Diamond Black PV 200 and of some Structurally Related Derivatives. Biocatalysis and Biotransformation, 22, 331-339.
Lan, J., Huang, X., Hu, M., Li, Y., Qu, Y., Gao, P., Wu, D., 2006. High efficient degradation of dyes with lignin peroxidase coupled with glucose oxidase. Journal of Biotechnolology, 123, 483-490.
Moldes, D., Sanromán, M.Á., 2006. Amelioration of the ability to decolorize dyes by laccase: relationship between redox mediators and laccase isoenzymes in Trametes versicolor. World Journal of Microbiology and Biotechnology, 22, 1197-1204.
Murzin, D., Salmi, T., 2005. Catalytic Kinetics. Elsevier.
Nigam, P., Armour, G., Banat, I.M., Singh, D., Marchant, R., 2000. Physical removal of textile dyes and solid state fermentation of dye-adsorbed agricultural residues. Bioresource Technology, 72, 219-226.
Nyanhongo, G.S., Gomes, J., Gubitz, G.M., Zvauya, R., Read, J., Steiner, W., 2002. Decolorization of textile dyes bu laccases from a newly isolated strain of Trametes modesta. Water Research, 36, 1449-1456.
Pandey, A., Singh, P., Iyengar, L., 2007. Bacterial decolorization and degradation of azo dyes. International Biodeterioration and Biodegradation, 59, 73-84.
Robinson, T., McMullan, G., Marchant, R., Nigam, P., 2001. Remediation of dyes in textile effluent: a critical review on current treatment technologies with a proposed alternative. Bioresource Technology, 77, 247-255.
Salcedo, R., Gonçalves, M.J., Azevedo, S.F., 1990. An improved random-search algorithm for non-linear optimization. Computers and Chemical Engineering, 14, 1111-1126.
Salcedo, R., 1992. Solving Nonconvex Nonlinear Programming and Mixed-Integer Nonlinear Programming Problems with Adaptive Random Search. Industrial and Engineering Chemistry Research, 31, 262-273.
Slokar, Y.M., Marechal, A.M.L., 1998. Methods of Decoloration of Textile Wastewaters. Dyes and Pigments, 37, 335-356.
Soares, G.M.B., Amorim, M.T.P., Costa-Ferreira, M., 2001. Use of laccase together with redox mediators to decolourize Remazol Brilliant Blue R. Journal of Biotechnology, 89, 123-129
Soares, G.M.B., Amorim, M.T.P., Hrdina, R., Costa-Ferreira, M., 2002. Studies on the biotransformation of novel disazo dyes by laccase. Process Biochemistry, 37, 581-587.
Thurston, C.F., 1994. The structure and function of fungal laccases. Microbiology, 140, 19-26.
Vandevivere, P.C., Bianchi, R., Verstraete, W., 1998. Treatment and Reuse of Wastewater from the Textile Wet-Processing Industry: Review of Emerging Technologies. Journal of Chemical Technology and Biotechnology, 72, 289-302.
Wong, Y., Yu, J., 1999. Laccase-catalyzed decolorization of synthetic dyes. Water Research, 33, 3512-3520.
Zille, A., Ramalho, P., Tzanov, T., Millward, R., Aires, V., Cardoso, M. H., Ramalho, M. T., Gubitz, G. M., and Cavaco-Paulo, A. (2004). Predicting Dye Biodegradation from Redox Potentials. Biotechnology Progress, 20, 1588-1592.


Part IV. 2 Modelling the decolourization of a
mixture of reactive textile dyes by commercial
laccase*
IV. 2.1 Abstract
IV. 2.2 Introduction
IV. 2.3 Materials and Methods
IV. 2.4 Kinetic Modelling: Optimization and Simulation
IV. 2.5 Results and Discussion
IV. 2.6 Conclusions
IV. 2.7 References
*based on: Cristóvão, R.O., Tavares, A.P.M., Ferreira, L.A., Loureiro, J.M., Boaventura, R.A.R., Macedo, E.A., 2009. Modeling the discoloration of a mixture of reactive textile dyes by commercial laccase. Bioresource Technology, 100, 1094-1099.


Part IV – Kinetic Modelling and Simulation
125
IV. 2 Modelling the decolourization of a mixture of reactive
textile dyes by commercial laccase
IV. 2.1 Abstract
Degradation of a mixture of three reactive textile dyes (Reactive Black 5, Reactive
Yellow 15 and Reactive Red 239), simulating a real textile effluent, by commercial laccase, was
investigated in a batch reactor. The decolourization was appraised as a percentage of the
absorbance reduction at the wavelength of maximum absorbance for each dye and as total
colour removal based in all visible spectrum. A significantly high decolourization was achieved
in both cases, indicating the applicability of this method for textile wastewater treatment.
Mathematical models were developed to simulate the kinetics of laccase catalyzed degradation
of reactive dyes in mixtures. Like in single dye degradation, some of the reactions present an
unusual kinetic behaviour, corresponding to the activation of the laccase-mediator system. The
kinetic constants of the models were estimated by minimizing the difference between the
predicted and the experimental time courses. Although not perfect, the ability of the models in
representing the experimental results suggests that they could be used in design and simulation
applications.
IV. 2.2 Introduction
Textile dyeing plants, particularly those involving finishing processes are among the
major sources of water pollution. These industries consume large volumes of water and
chemicals. There are more than 100,000 commercially available dyes with over 7 x 10⁵ tons of
dyestuff produced annually worldwide and used extensively in textile, dyeing and printing
industries (Robinson et al., 2001; Spadaro et al., 1994; Zollinger, 1987). Wastewater streams
from the textile dyeing operations contain unused dyes (about 8–20 % of the total pollution load
due to incomplete exhaustion of the dye) and auxiliary chemicals (Mukherjee et al., 1999).
Often, dyes are recalcitrant organic molecules that impart strong colour to the wastewater, also
contributing to the organic load and toxicity of the wastewater. Apart from the aesthetic problem,
the greatest environmental concern with dyes is the absorption and reflection of sunlight
entering the water, which interferes with the growth of algae, limiting it to levels insufficient to
biologically degrade impurities in the water. It is evident, therefore, that removal of such
coloured agents from aqueous effluents is of significant environmental, technical and
commercial importance (Forgacs et al., 2004; Pearce et al., 2003; Pinheiro et al., 2004;
Vandevivere et al.,1998).
The treatment of such dye-containing effluents is mostly based on physical and
chemical procedures, e.g. adsorption, flotation, fenton oxidation, reduction (Na2S2O4), ion

Part IV – Kinetic Modelling and Simulation
126
exchange, chlorination/ozonation and incineration. These methods are rather costly and
sometimes produce hazardous byproducts (Shaul et al., 1991). The idea of using
oxidoreductive enzymes for wastewater treatment was developed in the early 1980s, since
enzyme-based methods have minimal impact on ecosystems and low energy requirements.
Moreover, enzymes can operate in a wide pH range, at moderate temperature or ionic strength
and, to some extent, they are active in the presence of organic solvents (Torres et al., 2003).
Laccases (EC 1.10.3.2) are blue multi-copper-containing enzymes that catalyze the
oxidation of a variety of organic substances coupled to the reduction of molecular oxygen
(Alcalde et al., 2006; Reinhammar, 1984; Solomon et al., 1996). Because of their broad
specificity for the reducing substrates, laccases from white-rot fungi are receiving increasing
attention as potential industrial enzymes in various applications, such as pulp delignification,
wood fiber modification, dye or stain bleaching, chemical or medicinal synthesis and
contaminated water or soil remediation (Couto and Herrera, 2006). Further, the presence of
small molecular weight redox mediators enhances the range and the rates of compounds to be
oxidized (including recalcitrant dyes) by the so-called laccase-mediator systems (LMS) (Reyes
et al., 1999).
An understanding of the kinetics of enzyme systems is essential for the design of
efficient reactors to carry out industrial processes, as well as for optimization and control
purposes. The most important objective of a kinetic study is to find a model equation that has
the capability to estimate the experimental reaction rate as closely as possible to the
experimental reaction rate. Thus, in a kinetic study, the first step is to find suitable model(s) to
simulate the experimental data properly. One or more model equations are selected and kinetic
parameters are estimated by fitting the model equation(s) to the experimental data (Bas et al.,
2007).
Various studies on dye degradation by laccase have been published. Most of these
works were single-solute studies which used commercially available dyes as model pollutants
(Abadulla et al., 2000; Campos et al., 2001; Kandelbauer et al., 2004; Tavares et al., 2008;
Wong and Yu, 1999). However, most often, industrial situations involve the discharge of
effluents that contain mixtures of several dyes. Limited data are available on laccase mixed dye
degradation but it is important to evaluate the feasibility of this method to treat real textile
effluents. Investigations using simulated dye wastewaters are helpful to understand the colour
removal process in the actual textile wastewater treatments. In a preliminary work, we studied
the effects of several operating parameters, namely pH, temperature and enzyme mass on the
single dye degradation process (Tavares et al., 2009). This enabled us to establish the optimal
conditions to be used in reactors for degradation of a commercial dye, used as a model
pollutant, by commercial laccase. We also studied the kinetics of the degradation reactions,
which has been the subject of very few research works, so far. Some works reported the values
of kinetic constants of enzymatic dye degradation obtained from initial reaction rates (Almansa
et al., 2004; Moldes and Sanromán, 2006) and, apart from our previous work (Cristóvão et al.,

Part IV – Kinetic Modelling and Simulation
127
2008), as far as we are aware, there was no other study that determined the kinetic constants of
enzymatic dye decolourization from the entire time course data.
In this paper, we extend our work to study the applicability of the laccase degradation
method for the treatment of mixed dyes, simulating an effluent, and to study the kinetics of this
reaction. This constitutes a strategic approach for environmental protection, in the framework of
pollution abatement in textile industries by enzymatic wastewater treatment.
So, this work aims to establish a mathematical model and to determine the kinetic
constants that can adequately describe the kinetic behaviour of the decolourization of a mixture
of reactive textile dyes (Reactive Black 5 (RB5), Reactive Yellow 15 (RY15) and Reactive Red
239 (RR239)) by a commercial laccase. The success of the model was appraised by comparing
the time courses obtained experimentally with those predicted by the model.
IV. 2.3 Materials and Methods
IV. 2.3.1 Chemicals and enzyme
Textile dyes: Reactive Black 5 (Remazol Black B), Reactive Yellow 15 (Remazol Yellow
GR) and Reactive Red 239 (Remazol Brilliant Red 3BS) were kindly provided by DyStar
(Portugal) and were used for degradation experiments without any further purification.
Enzyme: Commercial laccase formulation (DeniLite II S; 120 U/g) from genetically
modified Aspergillus was kindly provided by Novozymes (Denmark). This formulation is used for
indigo dye decolourization in denim finishing operations and includes a buffer and an enzyme-
mediator.
IV. 2.3.2 Dye decolourization kinetics
Real effluents often include more than one component. Once laccase catalyzed
degradation has been tested on solutions of single reactive textile dyes, an attempt was made
to determine the efficiency of decolourization of a mixture of dyes and to study the kinetics of
this reaction. All the three dyes were mixed together in equal proportions to simulate a textile
effluent. The conditions used in this work were exactly the same used to study the degradation
kinetics of single dyes by commercial laccase (Cristóvão et al., 2008). To compare the kinetic
constants of the single dye degradation reactions with the ones of the dye mixture degradation
and to compare the dyes behaviours in both situations, the decolourization kinetics of the dye
mixture reactions were studied under the maximum absorbance wavelength of each dye
present in the mixture.
So, to study the kinetic behaviour of the dye mixture (with approximately equal amounts
of each dye), five different concentrations of the mixture (from 50 mg/L to 125 mg/L) and 432
U/L of commercial laccase were incubated in 50 mL Erlenmeyer flasks at 35 ºC with phosphate

Part IV – Kinetic Modelling and Simulation
128
buffer (50 mM/pH 7.0) under stirring. For each assay duplicate runs were made. After taking a
zero sample, decolourization was started by the addition of laccase. Samples were withdrawn at
certain time intervals and subsequently analyzed by UV–visible spectrophotometry.
IV 2.3.3 Determination of dye degradation
Usually, the degradation of a single dye is presented as the percentage of absorbance
reduction at the maximum absorbance wavelength. When studying a mixture of three different
dyes, the spectrum of the solution presents three peaks. So, it seems appropriate to study also
the total colour removal based on the overall visible spectrum.
Thus, the dye mixture decolourization by commercial laccase was determined by
monitoring the decrease in the absorbance peak at the maximum absorbance wavelength of
each dye, Reactive Black 5 (598 nm), Reactive Yellow 15 (416 nm) and Reactive Red 239 (542
nm), as well as by calculating the total area under the plot, by integration of the absorbance
between 350 and 800 nm (Thermo model UV1, UV–visible spectrophotometer). Percent
decolourization was calculated as (Ai - Af)/Ai x 100, where Ai is the initial absorbance at a given
wavelength or the total area under the initial spectrum and Af is the final absorbance of the dye
or the total area under the final spectrum.
IV. 2.3.4 Determination of dyes concentrations
Dyes concentrations were calculated from calibration curves by reading the absorbance
of the samples at the maximum absorbance wavelength for each dye present in the mixture:
Reactive Yellow 15 (416 nm), Reactive Red 239 (542 nm) and Reactive Black 5 (598 nm). A
UV–visible spectrophotometer (Thermo model UV1) was used in all the experiments. By
measuring the amount of the substrate remaining overtime it is possible to obtain the
concentration vs. time plot which is known as progress curve of the enzymatic reaction or time
course.
IV 2.4 Kinetic modelling: optimization and simulation IV. 2.4.1 Kinetic models
To date, most kinetic studies of laccase catalyzed reactions involved the application of
the Michaelis-Menten kinetic model (Gianfreda et al., 1998; Hofer and Schlosser, 1999; Ryan et
al., 2003; Xu, 2001). This widely used model was developed based on assumed steps in which
the free enzyme combines with the substrate to form an enzyme-substrate complex, which
further dissociates into product and free enzyme as follows:
PEESSE 2MS kK +→ →←+
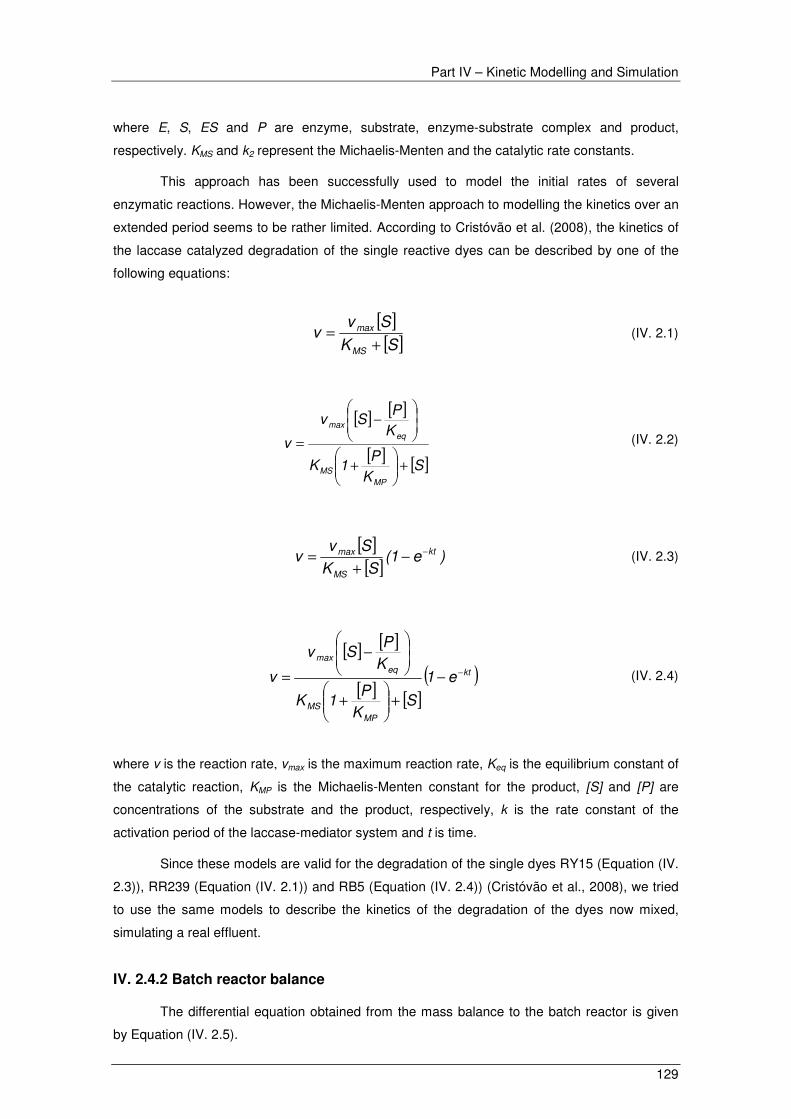
Part IV – Kinetic Modelling and Simulation
129
where E, S, ES and P are enzyme, substrate, enzyme-substrate complex and product,
respectively. KMS and k2 represent the Michaelis-Menten and the catalytic rate constants.
This approach has been successfully used to model the initial rates of several
enzymatic reactions. However, the Michaelis-Menten approach to modelling the kinetics over an
extended period seems to be rather limited. According to Cristóvão et al. (2008), the kinetics of
the laccase catalyzed degradation of the single reactive dyes can be described by one of the
following equations:
[ ][ ]SK
Svv
MS
max
+= (IV. 2.1)
[ ] [ ]
[ ] [ ]SK
P1K
K
PSv
v
MP
MS
eq
max
+
+
−
= (IV. 2.2)
[ ][ ]
)e1(SK
Svv kt
MS
max −−+
= (IV. 2.3)
[ ] [ ]
[ ] [ ]( )kt
MP
MS
eq
max
e1
SK
P1K
K
PSv
v −−
+
+
−
= (IV. 2.4)
where v is the reaction rate, vmax is the maximum reaction rate, Keq is the equilibrium constant of
the catalytic reaction, KMP is the Michaelis-Menten constant for the product, [S] and [P] are
concentrations of the substrate and the product, respectively, k is the rate constant of the
activation period of the laccase-mediator system and t is time.
Since these models are valid for the degradation of the single dyes RY15 (Equation (IV.
2.3)), RR239 (Equation (IV. 2.1)) and RB5 (Equation (IV. 2.4)) (Cristóvão et al., 2008), we tried
to use the same models to describe the kinetics of the degradation of the dyes now mixed,
simulating a real effluent.
IV. 2.4.2 Batch reactor balance
The differential equation obtained from the mass balance to the batch reactor is given
by Equation (IV. 2.5).

Part IV – Kinetic Modelling and Simulation
130
[ ]
L
EV
1.W.v
dt
Sd=− (IV. 2.5)
where WE is the enzyme mass and VL is the volume of the reactor.
IV. 2.4.3 Estimation of the reaction kinetics and kinetic constants
As in a previous work (Cristóvão et al., 2008), the system of equations obtained from
the batch reactor balance (Equation (IV. 2.5)) and from the proposed kinetics for the enzymatic
reactions (Equations (IV. 2.1) - (IV. 2.4)) was solved using a Fortran program with integration by
the LSODE code (Livermore Solver for Ordinary Differential Equations) based on Adams
backward differentiation formulæ methods, to predict the profile of the dye concentrations
versus time in the batch reactor. The initial concentrations of the dyes and first guesses of the
parameters values were fed to the program. This program was combined with an optimization
algorithm to estimate the kinetic constants of the proposed model by minimizing the difference
between the predicted time courses and the ones obtained experimentally. The function to
minimize between both time courses was the sum of squared relative residuals and was
calculated as in Equation (IV. 2.6).
∑−
=n
1
2
exp
expcalc
C
CCF (IV. 2.6)
where Ccalc is the concentration calculated using the model equation, Cexp is the experimental
concentration and n is the total number of experimental and calculated points. The function was
minimized through an optimization loop based on an adaptive random search algorithm that
varies the values of the kinetic constants until a global minimum within the optimization criterion
is achieved (Salcedo et al., 1990; Salcedo, 1992). This procedure was repeated for each dye
present in the mixture.
IV. 2.5 Results and Discussion
IV 2.5.1 Degradation of dye mixture
Laccase-mediator systems (LMS) were already described in some works for
degradation processes of single reactive textile dyes (Mechichi et al., 2006; Murugesan et al.,
2007; Peralta-Zamora et al., 2003). As real industrial effluents often contain several dyes, in this
work three reactive textile dyes were mixed in order to evaluate the applicability of these
processes to a real situation and submitted to commercial laccase catalyzed degradation. The

Part IV – Kinetic Modelling and Simulation
131
degradation of simulated effluents was already tested by other methods, such as ozonation
(Sarayu et al., 2007), flocculation (Kang et al., 2007) and photodegradation (Zainal et al., 2006).
The decolourization of the dye mixture was evaluated by the percentage of absorbance
reduction at the maximum absorbance wavelength of each dye present in the mixture as well as
by the total colour removal based on all the visible spectrum. These results are presented in
Table IV. 2.1 and show that significantly high amounts of colour were removed in both cases, at
the maximum absorbance wavelength of each dye (above 76 % at 416 nm, above 71 % at 542
nm and above 89 % at 598 nm) and based on all the visible spectrum range, i.e., on the area
under the curve (above 84 %). Figure IV. 2.1 represents the UV-visible absorbance spectrum of
the mixed dyes before and after treatment and confirms the obtained results. Peaks in UV–
visible region significantly decreased in the treated mixture. These results validate the
applicability of the laccase catalyzed degradation method for the treatment of mixed dyes.
Table IV. 2.1 - Dye mixture decolourization (%) based on the absorbance peak at maximum absorbance
wavelength of each dye present in the mixture and on the area integration over all dye spectrum range.
[mixture] (mg/L)
% Decolourization
RY15
416 nm
RR239
542 nm
RB5
598 nm Area
125 76.92 ± 0.10 78.44 ± 0.59 89.60 ± 0.43 85.01 ± 1.41
100 78.54 ± 0.48 77.42 ± 1.15 90.91 ± 0.26 84.10 ± 2.82
85 82.59 ± 0.62 76.26 ± 1.06 90.51 ± 0.05 87.49 ± 0.05
75 81.89 ± 0.19 71.90 ± 1.12 91.73 ± 0.23 88.33 ± 0.99
50 77.89 ± 0.78 68.23 ± 1.17 90.51 ± 0.36 90.55 ± 1.83
*standard deviation
Figure IV. 2.1 - Absorption spectrum of dye mixture before (a) and after (b) decolourization by commercial
laccase at 125 mg/L.
(a)
(b)
0
0.2
0.4
0.6
0.8
1
1.2
1.4
1.6
1.8
350 450 550 650 750
Wavelength (nm)
Ab
so
rba
nc
e

Part IV – Kinetic Modelling and Simulation
132
The decolourization of dyes in the mixture is a relatively fast process, although to a
lesser extent than when each dye is alone in solution (data not shown). This is probably due to
some reasons: to the competition between several compounds for the active sites of the
enzyme; to the enzyme deactivation; to the products of the polymerization that can provide
unacceptable colour levels in effluents. According to Zille et al. (2005), the enzyme laccase can
polymerize the reaction products obtained during the batch degradation processes with azo
dyes. As the dye mixture degradation can have more reaction products than the single dyes
one, probably this may affect the extent of the degradation.
IV. 2.5.2 Kinetic modelling and estimation of kinetic constants
In a previous work (Cristóvão et al., 2008) a kinetic model to simulate the
decolourization of five individual reactive textile dyes in a batch reactor by a commercial laccase
formulation was proposed. It was the first study on the determination of kinetic parameters of
these reactions from the entire time course data. To our knowledge there is no study about the
kinetics of degradation of a mixture of dyes.
Thus, as far as we are aware, since in this work the kinetics of degradation of a mixture
of dyes by commercial laccase is investigated, this is the first study of the kinetics of these
reactions and the first in which the kinetic constants of the enzymatic mixed dye decolourization
are determined from the entire time course data.
In order to enable the comparison with the results of the individual dyes degradation,
the kinetics of the dyes mixture degradation was studied at the maximum absorbance
wavelength of each dye present in the mixture (416 nm, 542 nm and 598 nm). The proposed
models to simulate the degradation of each dye in the mixture were the same proposed before
to simulate the single dyes degradation.
At the wavelengths corresponding to the peaks of RB5 and of RY15, it was observed
that the concentration almost do not decrease in the beginning, as seen in the individual
degradations (Cristóvão et al., 2008). This period probably corresponds to an activation time of
the laccase-mediator system. So, the kinetic model for the degradation of these dyes
incorporates an exponential term to take into account this induction time. All the three dyes
degradations were not complete, i.e., the dyes concentrations decrease along time until
reaching a plateau where no more dye is degraded. In contrast, the degradation of the
individual RR239 dye was complete, so, this dye exhibits a different behaviour when present in
a mixture.
A program using the LSODE code to solve the differential equation of the batch reactor
balance (Equation (IV. 2.5)) considering the proposed kinetics of enzymatic degradation of each
dye present in the mixture (Equation (IV. 2.4) for RY15 and RB5 and Equation (IV. 2.2) for
RR239) was combined with an optimization program (Salcedo et al., 1990; Salcedo, 1992) to
obtain the theoretical time courses. As in the single dyes degradation case, the kinetic

Part IV – Kinetic Modelling and Simulation
133
constants were estimated by minimizing the difference between the predicted time courses and
the experimentally obtained ones. The algorithm developed adjusts automatically the kinetic
constants so that the output response (predicted by the model) and the input values
(experimental data) are as close as possible according to the objective function (Equation (IV.
2.6)). This process was repeated while the relative errors between the estimated and the
experimental values decreased.
The obtained kinetic constants for each dye kinetic model are shown in Table IV. 2.2
and were used to draw the continuous lines in Figures IV. 2.2 – IV. 2.4, that represent the
behaviour of each dye degradation when present in a mixture.
Table IV. 2.2 – Proposed model, kinetic data and average sum of squared relative residuals (SSRR) of
RY15, RR239 and RB5 degradation by commercial laccase when mixed together.
RY15
(416 nm) RR239
(542 nm) RB5
(598 nm)
Kinetic equation (IV. 2.4) (IV. 2.2) (IV. 2.4)
vmax (mg/g.min) 5.534 4.450 152.370
KMS (mg/L) 8.636 743.18 0.795
KMP (mg/L) 67.200 22.9 100.000
Keq 4.700 3.200 28.000
k (min-1
) 0.497 - 0.049
SSRR/n 2.760 x 10⁻² 1.900 x 10⁻³ 0.183
0
20
40
60
80
100
120
140
0 5 10 15 20
Time( minutes)
Co
ncen
trati
on
(m
g/L
)
Figure IV. 2.2 – Comparison of experimental (× run 1; o run 2) and simulated (continuous line) time
courses of RY15 degradation in a mixture of three dyes by commercial laccase under different dye initial
concentrations: (a) 127.7 mg/L and 126.9 mg/L; (b) 101.1 mg/L and 99.5 mg/L; (c) 75.4 mg/L and 75.9
mg/L; (d) 48.2 mg/L and 49.8 mg/L.
(a)
(b)
(c)
(d)

Part IV – Kinetic Modelling and Simulation
134
Figure IV. 2.3 – Comparison of experimental (× run 1; o run 2) and simulated (continuous line) time
courses of RR239 degradation in a mixture of three dyes by commercial laccase under different dye initial
concentrations: (a) 125.1 mg/L and 126.3 mg/L; (b) 100.5 mg/L and 99.1 mg/L; (c) 78.0 mg/L and 78.20
mg/L; (d) 50.0 mg/L and 50.4 mg/L. (2) Scale amplification of (1).
0
20
40
60
80
100
120
140
0 1 2 3 4 5 6
Time (minutes)
Co
ncen
trati
on
(m
g/L
)
Figure IV. 2.4 - Comparison of experimental (× run 1; o run 2) and simulated (continuous line) time
courses of RB5 degradation in a mixture of three dyes by commercial laccase under different dye initial
concentrations: (a) 130.3 mg/L and 126.2 mg/L; (b) 105.5 mg/L and 101.9 mg/L; (c) 88.9 mg/L and 87.1
mg/L; (d) 75.5 mg/L and 76.8 mg/L; (e) 50.6 mg/L and 50.3 mg/L.
0
20
40
60
80
100
120
140
0 50 100 150 200 250
Time (minutes)
Co
nc
en
tra
tio
n (
mg
/L)
0
20
40
60
80
100
120
140
0 10 20 30 40
(1)
(2)
(a)
(b)
(c)
(d)
(a)
(b)
(c)
(d)
(e)
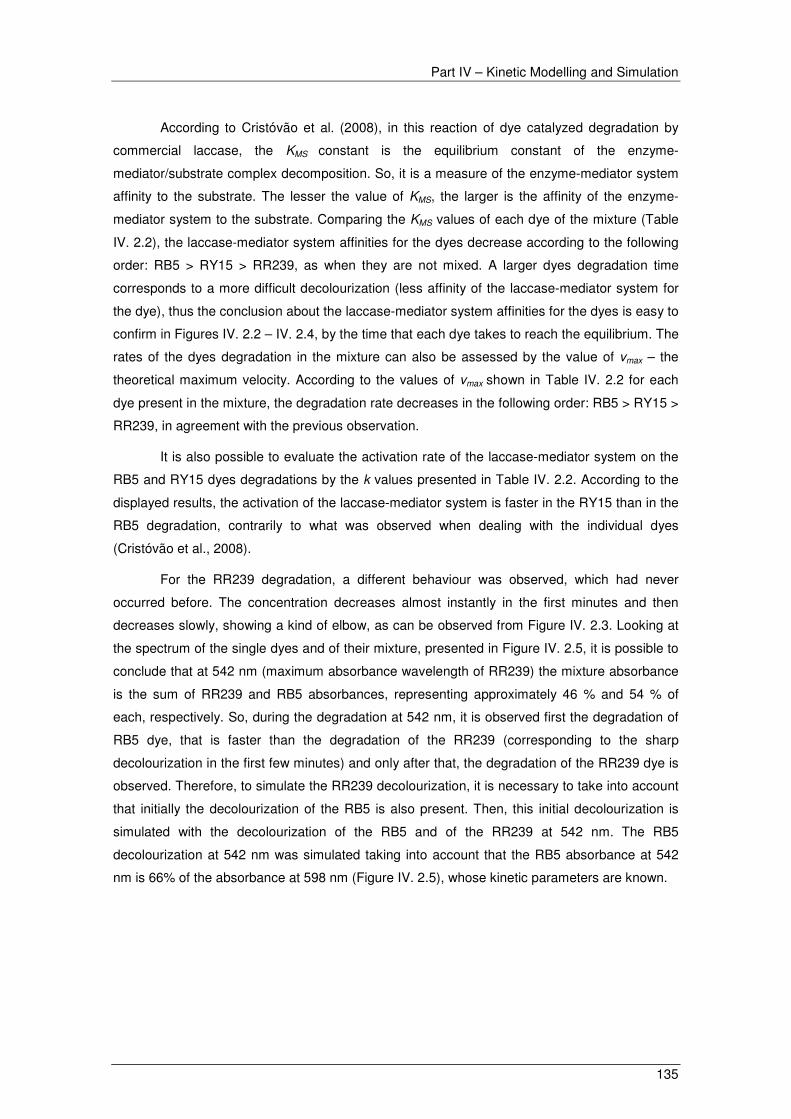
Part IV – Kinetic Modelling and Simulation
135
According to Cristóvão et al. (2008), in this reaction of dye catalyzed degradation by
commercial laccase, the KMS constant is the equilibrium constant of the enzyme-
mediator/substrate complex decomposition. So, it is a measure of the enzyme-mediator system
affinity to the substrate. The lesser the value of KMS, the larger is the affinity of the enzyme-
mediator system to the substrate. Comparing the KMS values of each dye of the mixture (Table
IV. 2.2), the laccase-mediator system affinities for the dyes decrease according to the following
order: RB5 > RY15 > RR239, as when they are not mixed. A larger dyes degradation time
corresponds to a more difficult decolourization (less affinity of the laccase-mediator system for
the dye), thus the conclusion about the laccase-mediator system affinities for the dyes is easy to
confirm in Figures IV. 2.2 – IV. 2.4, by the time that each dye takes to reach the equilibrium. The
rates of the dyes degradation in the mixture can also be assessed by the value of vmax – the
theoretical maximum velocity. According to the values of vmax shown in Table IV. 2.2 for each
dye present in the mixture, the degradation rate decreases in the following order: RB5 > RY15 >
RR239, in agreement with the previous observation.
It is also possible to evaluate the activation rate of the laccase-mediator system on the
RB5 and RY15 dyes degradations by the k values presented in Table IV. 2.2. According to the
displayed results, the activation of the laccase-mediator system is faster in the RY15 than in the
RB5 degradation, contrarily to what was observed when dealing with the individual dyes
(Cristóvão et al., 2008).
For the RR239 degradation, a different behaviour was observed, which had never
occurred before. The concentration decreases almost instantly in the first minutes and then
decreases slowly, showing a kind of elbow, as can be observed from Figure IV. 2.3. Looking at
the spectrum of the single dyes and of their mixture, presented in Figure IV. 2.5, it is possible to
conclude that at 542 nm (maximum absorbance wavelength of RR239) the mixture absorbance
is the sum of RR239 and RB5 absorbances, representing approximately 46 % and 54 % of
each, respectively. So, during the degradation at 542 nm, it is observed first the degradation of
RB5 dye, that is faster than the degradation of the RR239 (corresponding to the sharp
decolourization in the first few minutes) and only after that, the degradation of the RR239 dye is
observed. Therefore, to simulate the RR239 decolourization, it is necessary to take into account
that initially the decolourization of the RB5 is also present. Then, this initial decolourization is
simulated with the decolourization of the RB5 and of the RR239 at 542 nm. The RB5
decolourization at 542 nm was simulated taking into account that the RB5 absorbance at 542
nm is 66% of the absorbance at 598 nm (Figure IV. 2.5), whose kinetic parameters are known.

Part IV – Kinetic Modelling and Simulation
136
Figure IV. 2.5 - Absorption spectrum of singles dyes (RY15 (–), RR239 (–), RB5 (–)) and of the dyes
mixture (–) before degradation by commercial laccase.
In order to evaluate the adequacy of the proposed models for the kinetics of dye
decolourization by commercial laccase when present in a dyes mixture, the time courses
calculated by the kinetic models were compared with the experimental ones. These
comparisons for RY15, RR239 and RB5 degradations are displayed in Figures IV. 2.2 – IV. 2.4,
respectively. In order to avoid the overloading of the respective graphs, only four different
concentrations are presented for the RY15 and RR239 cases.
The proposed models seem to exhibit some systematic quantitative deviations, probably
due to the subtraction of the turbidity induced by the enzyme support, since apparent colour is
not very reproducible (Cristóvão et al., 2008). Nonetheless, the close correspondence of the
experimental data with the simulated values under different substrate concentrations seems to
demonstrate that the proposed mathematical models are able to describe with remarkable
accuracy the RY15, RR239 and RB5 laccase catalyzed degradations when they are mixed.
In this context, it is possible to conclude that the models can also be applied when the
commercial laccase is used for the degradation of mixtures of reactive dyes, although the
values of the kinetic constants are different of those obtained when dealing with the single dyes
degradation systems.
Comparing the kinetic constants values of the single dyes decolourization models
(Cristóvão et al., 2008) with the ones of the decolourization of the same dyes when present in a
mixture (this work), it is clear that they are very different and that probably it is not possible to
simulate the degradation of the single dyes with the kinetic parameters obtained for the
degradation of the dyes in a mixture and vice versa. When mixed, the RB5 and RR239 dyes
present a higher degradation rate (vmax), while the RY15 dye presents a lower velocity of
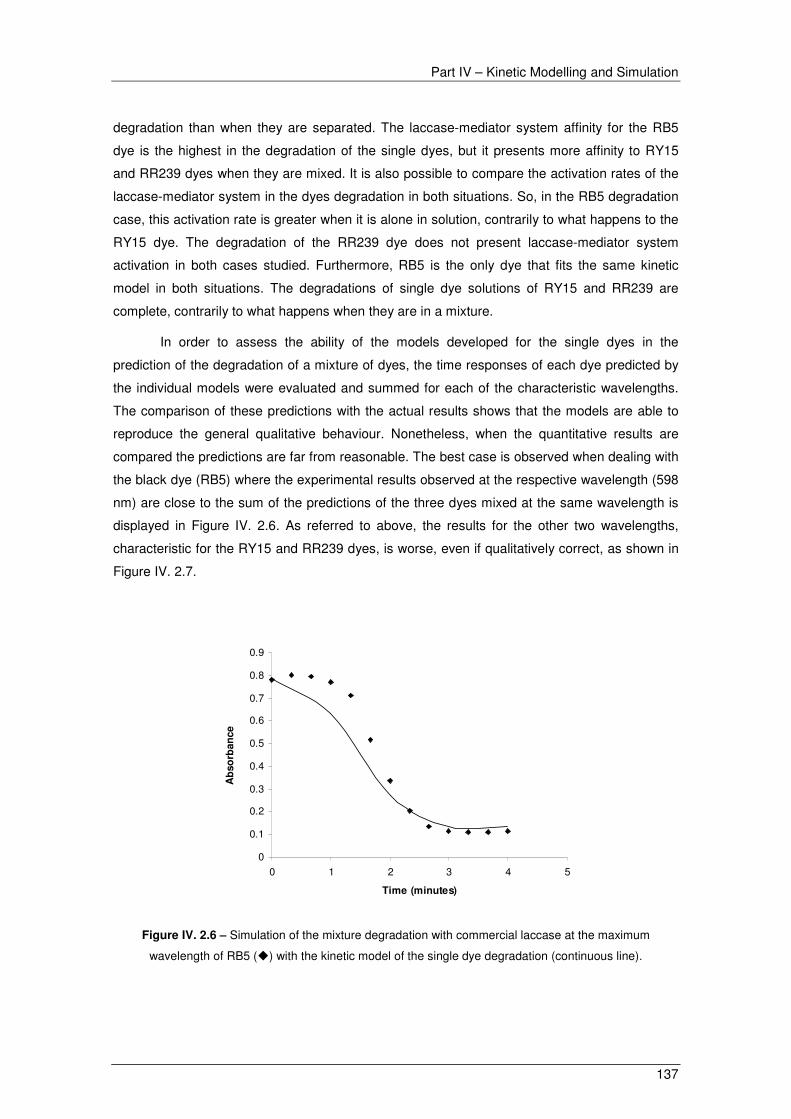
Part IV – Kinetic Modelling and Simulation
137
degradation than when they are separated. The laccase-mediator system affinity for the RB5
dye is the highest in the degradation of the single dyes, but it presents more affinity to RY15
and RR239 dyes when they are mixed. It is also possible to compare the activation rates of the
laccase-mediator system in the dyes degradation in both situations. So, in the RB5 degradation
case, this activation rate is greater when it is alone in solution, contrarily to what happens to the
RY15 dye. The degradation of the RR239 dye does not present laccase-mediator system
activation in both cases studied. Furthermore, RB5 is the only dye that fits the same kinetic
model in both situations. The degradations of single dye solutions of RY15 and RR239 are
complete, contrarily to what happens when they are in a mixture.
In order to assess the ability of the models developed for the single dyes in the
prediction of the degradation of a mixture of dyes, the time responses of each dye predicted by
the individual models were evaluated and summed for each of the characteristic wavelengths.
The comparison of these predictions with the actual results shows that the models are able to
reproduce the general qualitative behaviour. Nonetheless, when the quantitative results are
compared the predictions are far from reasonable. The best case is observed when dealing with
the black dye (RB5) where the experimental results observed at the respective wavelength (598
nm) are close to the sum of the predictions of the three dyes mixed at the same wavelength is
displayed in Figure IV. 2.6. As referred to above, the results for the other two wavelengths,
characteristic for the RY15 and RR239 dyes, is worse, even if qualitatively correct, as shown in
Figure IV. 2.7.
0
0.1
0.2
0.3
0.4
0.5
0.6
0.7
0.8
0.9
0 1 2 3 4 5
Time (minutes)
Ab
so
rban
ce
Figure IV. 2.6 – Simulation of the mixture degradation with commercial laccase at the maximum
wavelength of RB5 (�) with the kinetic model of the single dye degradation (continuous line).

Part IV – Kinetic Modelling and Simulation
138
Figure IV. 2.7 – Simulation of the mixture degradation with commercial laccase at the maximum
wavelength of RR239 (�) and of RY15 (�) with the kinetic models of the singles dye degradation
(continuous lines).
IV. 2.6 Conclusions
The degradation of a mixture of reactive dyes, simulating a real textile effluent,
catalyzed by commercial laccase, was tested. The good results of decolourization as measured
by the percentage of absorbance reduction at the maximum absorbance wavelength of each
dye present in the mixture (above 76 % at 416 nm, above 71 % at 542 nm and above 89 % at
598 nm) and by the total colour removal based in all the visible spectrum (above 84 %),
indicates the possibility of implementing this technique for the treatment of textile dying
wastewaters.
A kinetic model to simulate the decolourization by commercial laccase of each of the
three reactive textile dyes mixed in a batch reactor was proposed. The kinetic parameters
estimation was performed by minimization of the sum of the squared relative residuals between
the experimental and the predicted time courses. The good agreement between the
experimental and simulated results validates the applicability of the proposed models in
predicting the kinetic behaviour of mixed reactive dyes degradation by commercial laccase.
These kinetic models provide a useful tool for the design and optimization of textile effluents
treatment, using this process.
Comparing the kinetic models and the kinetic constants values, it is possible to
conclude that a single reactive dye degradation catalyzed by commercial laccase and the same
dye degradation but mixed with other reactive dyes present different behaviours.
0
0.2
0.4
0.6
0.8
1
1.2
0 50 100 150 200
Time (minutes)
Ab
so
rban
ce
0
0.2
0.4
0.6
0.8
1
1.2
0 2 4 6 8 10 12 14
Time (minutes)
Ab
so
rban
ce
RR239 RY15542 nm 416 nm

Part IV – Kinetic Modelling and Simulation
139
IV. 2.7 References Abadulla, E., Tzanov, T., Costa, S., Robra, K.H., Cavaco-Paulo, A., Gubitz, G.M., 2000. Decolorization and Detoxification of Textile Dyes with a Laccase from Trametes hirsuta. Applied and Environmental Microbiology, 66, 3357-3362.
Alcalde, M., Ferrer, M., Plou, F.J., Ballesteros, A., 2006. Environmental biocatalysis: from remediation with enzymes to novel green processes. Trends in Biotechnology, 24, 281–287.
Almansa, E., Kandelbauer, A., Pereira, L., Cavaco-Paulo, A., Gubitz, G.M., 2004. Influence of Structure on Dye Degradation with Laccase Mediator Systems. Biocatalysis and Biotransformation, 22, 315-324.
Bas, D., Dudak, F.C., Boyaci, I.H., 2007. Modeling and optimization III: Reaction rate estimation using artificial neural network (ANN) without a kinetic model. Journal of Food Engineering, 79, 622-628.
Campos, R., Kandelbauer, A., Robra, K.H., Cavaco-Paulo, A., Gubitz, G.M., 2001. Indigo degradation with purified laccases from Trametes hirsuta and Sclerotium rolfsii. Journal of Biotechnology, 89, 131-139.
Couto, S.R., Herrera, J.L.T., 2006. Lacasses in the textile industry. Biotechnology and Molecular Biology Reviews, 1, 115–20.
Cristóvão, R.O., Tavares, A.P.M., Loureiro, J.M., Boaventura, R.A.R., Macedo, E.A., 2008. Kinetic modelling and simulation of laccase catalyzed degradation of reactive textile dyes. Bioresource Technology, 99, 4768–4774.
Forgacs, E., Cserháti, T., Oros, G., 2004. Removal of synthetic dyes from wastewaters: a review. Environment International, 30, 953-971.
Gianfreda, L., Sannino, F., Filazzola, M.T., Leonowicz, A., 1998. Catalytic behavior and detoxifying ability of a laccase from the fungal strain Cerrena unicolor. Journal of Molecular Catalysis B-Enzymatic, 4(1–2), 13–23.
Hofer, C., Schlosser, D., 1999. Novel enzymatic oxidation of Mn2þ to Mn3þ catalyzed by a fungal laccase. FEBS Letters, 451(2), 186–190.
Kandelbauer, A., Erlacher, A., Cavaco-Paulo, A., Gubitz, G.M., 2004. Laccase-catalyzed Decolorization of the Synthetic Azo-dye Diamond Black PV 200 and of some Structurally Related Derivatives. Biocatalysis and Biotransformation, 22, 331-339.
Kang, Q., Gao, B., Yue, Q., Zhou, W., Shen, D., 2007. Residual color profiles of reactive dyes mixture during a chemical flocculation process. Colloids and Surfaces A: Physicochemical and Engineering Aspects, 299, 45-53.
Mechichi, T., Mhiri, N., Sayadi, S., 2006. Remazol Brilliant Blue R decolourization by the laccase from Trametes trogii. Chemosphere, 64, 998-1005.
Moldes, D., Sanromán, M.Á., 2006. Amelioration of the ability to decolorize dyes by laccase: relationship between redox mediators and laccase isoenzymes in Trametes versicolor. World Journal of Microbiology and Biotechnology, 22, 1197-1204.
Mukherjee, A.K., Gupta, B., Chowdhury, S.M.S., 1999. Separation of dyes from cotton dyeing effluent using cationic polyelectrolytes. Am. Dyest. Rep, February, 25-8.
Murugesan, K., Nam, I.-H., Kim, Y.-M., Chang, Y.-S., 2007. Decolorization of reactive dyes by a thermostable laccase produced by Ganoderma lucidum in solid state culture. Enzyme and Microbial Technology, 40, 1662-1672.
Pearce, C. I., Lloyd, J. R., Guthrie, J. T., 2003. The removal of colour from textile wastewater using whole bacterial cells: a review. Dyes and Pigments, 58, 179-196.
Peralta-Zamora, P., Pereira, C. M., Tiburtius, E. R. L., Moraes, S. G., Rosa, M. A., Minussi, R. C., Durán, N., 2003. Decolorization of reactive dyes by immobilized laccase. Applied Catalysis B: Environment, 42, 131-144.
Pinheiro, H. M., Touraud, E., Thomas, O., 2004. Aromatic amines from azo dye reduction: status review with emphasis on direct UV spectrophotometric detection in textile industry wastewaters. Dyes and Pigments, 61, 121-139.
Reinhammar, B.R.M., 1984. Laccase. In copper proteins and copper enzymes, enzymes, chapter 1. In: Lontie R, editor, Boca Raton, FL: CRC Press, p. 1–35.
Reyes, R., Pickard, M., Vazquez-Duhalt, R., 1999. Hydroxybenzotriazole increase the range of textile dyes decolorized by immobilized laccase. Biotechnology Letters, 21, 875–880.

Part IV – Kinetic Modelling and Simulation
140
Robinson, T., McMullan, G., Marchant, R., Nigam, P., 2001. Remediation of dyes in textile effluents: a critical review on current treatment technologies with a proposed alternative. Bioresource Technology, 77, 247–255.
Ryan, S., Schnitzhofer, W., Tzanov, T., Cavaco-Paulo, A., Gubitz, G.M., 2003. An acid-stable laccase from Sclerotium rolfsii with potential for wool dye decolourization. Enzyme and Microbial Technology, 33, 766–774.
Salcedo, R., Gonçalves, M.J., Azevedo, S.F., 1990. An improved random-search algorithm for non-linear optimization. Computers and Chemical Engineering, 14, 1111-1126.
Salcedo, R., 1992. Solving Nonconvex Nonlinear Programming and Mixed-Integer Nonlinear Programming Problems with Adaptive Random Search. Industrial and Engineering Chemistry Research, 31, 262-273.
Sarayu, K., Swaminathan, K., Sandhya, S., 2007. Assessment of degradation of eight commercial reactive azo dyes individually and in mixture in aqueous solution by ozonation. Dyes and Pigments, 75, 362-368.
Shaul, G.M., Holdsworth, T.J., Dempsey, C.R., Dostall, K.A., 1991. Fate of water soluble azo dyes in the activated sludge process. Chemosphere, 22, 107–119.
Solomon, E.I., Sundaram, U.M., Machonkin, T.E., 1996. Multicopper oxidases and oxygenases. Chemical Reviews, 96, 2563–605.
Spadaro, J.T., Isabelle, L., Renganathan, V., 1994. Hydroxyl radical mediated degradation of azo dyes: evidence for benzene generation. Environmental Science and Technology, 28, 1389–1393.
Tavares, A.P.M, Cristóvão, R.O., Loureiro, J.M., Boaventura, R.A.R., Macedo, E.A., 2008. Optimisation of reactive textile dyes degradation by laccase–mediator system. Journal of Chemical Technology and Biotechnology, 83, 1609-1615.
Tavares, A.P.M., Cristóvão, R.O., Loureiro, J.M., Boaventura, R.A.R., Macedo, E.A., 2009. Application of statistical experimental methodology to optimize reactive dye decolourisation by commercial laccase. Journal of Hazardous Materials, 162, 1255-1260.
Torres, E., Bustos-Jaimes, I., Le Borgne, S., 2003. Potential use of oxidative enzymes for detoxification of organic pollutants. Applied Catalysis B, 46, 1-15.
Vandevivere, P. C., Bianchi, R., Verstraete, W., 1998. Treatment and Reuse of Wastewater from the Textile Wet-Processing Industry: Review of Emerging Technologies. Journal of Chemical Technology and Biotechnology, 72, 289-302.
Wong, Y., Yu, J., 1999. Laccase-catalyzed decolorization of synthetic dyes. Water Research, 33, 3512-3520.
Xu, F., 2001. Dioxygen reactivity of laccase—Dependence of laccase source, pH, and anion inhibition. Applied Biochemistry and Biotechnology, 95(2), 125–133.
Zainal, Z., Lee, C. Y., Hussein, M. Z., Kassim, A., Yusof, N. A., 2007. Electrochemical-assisted photodegradation of mixed dye and textile effluents using TiO2 thin films. Journal of Hazardous Materials, 146, 73-80.
Zille, A., Górnacka, B., Rehorek, A., Cavaco-Paulo, A., 2005. Degradation of azo dyes by Trametes villosa laccase over long periods of oxidative conditions. Applied and Environmental Microbiology, 71, 6711-6718.
Zollinger, H., 1987. Colour Chemistry-Synthesis, Properties of Organic Dyes and Pigments. VCH Publishers, New York, pp. 92–100.

Part IV. 3 Treatment and kinetic modelling
of a simulated dye house effluent by enzymatic
catalysis*
IV. 3.1 Abstract
IV. 3.2 Introduction
IV. 3.3 Materials and Methods
IV. 3.4 Kinetic Modelling: Optimization and Simulation
IV. 3.5 Analytical Methods
IV. 3.6 Results and Discussion
IV. 3.7 Conclusions
IV. 3.8 References
*based on: Cristóvão, R.O., Tavares, A.P.M., Loureiro, J.M., Boaventura, R.A.R., Macedo, E.A., 2009. Treatment and kinetic modelling of a simulated dye house effluent by enzymatic catalysis. Bioresource Technology, 100, 6236-6242.


Part IV – Kinetic Modelling and Simulation
143
IV. 3 Treatment and kinetic modelling of a simulated dye house
effluent by enzymatic catalysis
IV. 3.1 Abstract
Biocatalytic treatment of a synthetic dye house effluent, simulating a textile wastewater
containing various reactive dyestuffs (Reactive Yellow 15, Reactive Red 239 and Reactive
Black 5) and auxiliary chemicals, was investigated in a batch reactor using a commercial
laccase. A high decolourization (above 86 %) was achieved at the maximum wavelength of
Reactive Black 5. The decolourization at the other dyes wavelengths (above 63 % for RY15 and
around 41 % for RR239) and the total decolourization based on all the visible spectrum (around
55 %) were not so good, being somewhat lower than in the case of a mixture of the dyes (above
89 % for RB5, 77 % for RY15, 68 % for RR239 and above 84 % for total decolourization). Even
so, these results suggest the applicability of this method to treat textile dyeing wastewaters.
Kinetic models were developed to simulate the synthetic effluent decolourisation by commercial
laccase. The kinetic constants of the models were estimated by minimizing the difference
between the predicted and the experimental time courses. The close correlation between the
experimental data and the simulated values seems to demonstrate that the models are able to
describe with remarkable accuracy the simulated effluent degradation. Water quality parameters
such as TOC, COD, BOD5 and toxicity were found to be under the maximum permissible
discharge limits for textile industries wastewaters.
IV. 3.2 Introduction
Large amounts of dyes are annually produced and applied in many different industries,
including the textile, cosmetic, paper, leather, pharmaceutical and food industries. The textile
industry accounts for two-thirds of the total dyestuff market (Asad et al., 2007). A large
proportion of reactive azo dyes is consumed due to the actual high demand for cotton fabrics
with brilliant colours. A significant fraction of the dye is hydrolysed and released into the
environment with the rejected dye baths or wash waters. The effluents from reactive dye baths
have highly coloured streams and contain unutilized, hydrolysed dyes, as well as salts, sizing
agents and auxiliary chemicals (Alaton et al., 2002). These effluents are of great priority once
they are toxic for several organisms and a threat to ecosystems. They block out the sunlight and
thus reduce photosynthesis and dissolved oxygen concentration (Aksu, 2005). Taking into
account the new strict rules for the protection of the environment which are implemented by
most countries around the world, measures have to be taken by the textile industry. The organic
nature of a textile wastewater can be addressed in terms of classical parameters such as BOD5,
COD and TOC.

Part IV – Kinetic Modelling and Simulation
144
Some physical and chemical treatments are effective, but their limitations render them
unattractive. These include excessive usage of chemicals, accumulation of concentrated sludge
with obvious disposal problems, expensive plant requirements, high operational costs and
sensitivity to variations in the wastewater input (Aksu, 2005). Enzymatic degradation is viewed
as one alternative. Laccase (benzendiol:oxygen oxidoreductase, EC 1.10.3.2) and laccase-
producing fungi were studied in the oxidation of textile dyes (Ramsay and Nguyen, 2002;
Soares et al., 2002; Tavares et al., 2008, 2009a,b). Studies showed that the range of substrate
specificity of laccases can be extended to non-phenolic substrates by addition of redox
mediators (Tavares et al., 2008, 2009a,b). The degradation of simulated effluents was already
tested by other methods, such as nanofiltration (Avlonitis et al., 2008), photocatalysis (Arslan et
al., 2000) and electrochemical oxidation (López-Grimau and Gutiérrez, 2006). Limited data are
available on the action of laccase over simulated real effluent degradation but it is important to
evaluate the feasibility of this method to treat real textile effluents. In a preliminary work, we
studied the effects of several operating conditions (pH, temperature and enzyme mass) on
separated dyes degradation (Tavares et al., 2009a). After that we studied the applicability of the
laccase degradation method for the treatment of a mixture of three dyes (Cristóvão et al., 2009).
An understanding of the kinetics of enzyme systems is essential for the design of efficient
reactors to carry out industrial processes as well as for optimization and control purposes. There
are some works that report the values of kinetic constants of enzymatic dye degradation
(Almansa et al., 2004; Moldes and Sanroman, 2006), but to our knowledge, apart from our
previous studies (Cristóvão et al., 2008, 2009), there was no other study that determined the
kinetic constants of enzymatic dye degradation from the entire time course data.
In the present work, commercial laccase was used for an experimental and modelling
study on the degradation of a simulated real effluent, containing a mixture of three reactive
textile dyes and other auxiliary chemicals, in the perspective of an industrial application of the
process. Besides these studies, to investigate the environmental impact of this process, the
total organic carbon (TOC), the chemical oxygen demand (COD), the biochemical oxygen
demand (BOD5) and the toxicity of the simulated effluent were evaluated, before and after
treatment.
IV. 3.3 Materials and Methods
IV. 3.3.1 Chemicals and enzyme
Textile dyes: Reactive Black 5 (Remazol Black B), Reactive Yellow 15 (Remazol Yellow
GR) and Reactive Red 239 (Remazol Brilliant Red 3BS) were kindly provided by DyStar
(Portugal) and were used for degradation experiments without any further purification.
Enzyme: Commercial laccase formulation (DeniLite II S; 120 U/g) from genetically
modified Aspergillus was kindly provided by Novozymes (Denmark). This formulation is used for

Part IV – Kinetic Modelling and Simulation
145
indigo dye decolourization in denim finishing operations and includes a buffer and an enzyme–
mediator.
IV. 3.3.2 Simulated real effluent preparation
To mimic the effluent produced by typical textile industries using reactive dyes, a
synthetic dye effluent was prepared. This simulated effluent was used in biodegradation
experiments to evaluate the effect of the presence of dyeing auxiliary chemicals and salts on
the biodegradation performance. Its preparation involved a first step where a dye bath with the
three reactive textile dyes was simulated based on a standard exhaust procedure of non
mercerised cotton as suggested by the dye supplier: 50 g/L of NaCl were dissolved in warm tap
water and 1.0 g/L of each of the auxiliaries Sera Wet C-AS (anionic wetting agent), Sera Lube
M-CF (a non-ionic nature crease inhibitor and lubricant agent) and Sera Quest M-PP (anionic
sequestrant) were added. The desired amount of a mixture of three reactive textile dyes (from
50 mg/L to 125 mg/L, with equal proportions of each dye) was then carefully dissolved at 60 ºC
for 20 min. 2 g/L of NaOH and 10 g/L of Na2CO3 were added and the solution was maintained at
constant temperature for 1 h more. Taking into account the dyeing process and the following
rinse and softening baths steps industrially used, an estimated dilution of the dye bath in the
final effluent by a factor of eight was considered fair. Using this hypothesis, the prepared dye
bath was then accurately diluted and neutralized for use in biotreatment experiments.
The complex effluent was employed since industrial effluents usually contain a mixture
of dyes derivating from the baths of different machines. Moreover all the dyes were dissolved in
saline solution since textile effluents are usually characterised by high salt concentrations. This
solution fed to the reactor was also previously hydrolysed to simulate dye bath conditions used
in the textile industry.
IV. 3.3.3 Simulated effluent decolourization kinetics
The conditions used in this work were exactly the same used to study the degradation
kinetics of the dye mixture by commercial laccase (Cristóvão et al., 2009). To compare the
kinetic constants of the dye mixture degradation reaction with the ones of the simulated effluent
degradation, the degradation kinetics were studied at the same wavelengths.
So, to study the kinetic behaviour of the simulated effluent, five different concentrations
of the dyes (from 50 mg/L to 125 mg/L) and 432 U/L of commercial laccase were incubated in
50 mL Erlenmeyer flasks at 35 ºC with phosphate buffer (50 mM/pH 7.0) under stirring. For
each assay duplicate runs were made.
After withdrawing samples at 0h, degradation was started by the addition of laccase.
Samples were withdrawn at certain time intervals and subsequently analyzed by UV–visible
spectrophotometry.

Part IV – Kinetic Modelling and Simulation
146
IV. 3.3.4 Determination of simulated effluent degradation
Since the degradation of a simulated effluent containing a mixture of three dyes is to be
studied, it seems appropriated to study not only the degradation as the percentage of
absorbance reduction at the maximum absorbance wavelength of each dye, but also the total
colour removal based on the residual absorbance over all the visible spectrum.
The simulated effluent degradation by commercial laccase was determined by
monitoring the decrease in the absorbance peak at the maximum absorbance wavelength of
each dye, Reactive Yellow 15 (416 nm), Reactive Red 239 (542 nm) and Reactive Black 5 (598
nm), as well as by calculating the total area under the plot, by integration of the absorbance
between 350 and 800 nm (Thermo model UV1, UV–visible spectrophotometer). Percent
decolourization was calculated as (Ai - Af)/Ai x 100, where Ai is the initial absorbance at a given
wavelength or the total area under the initial spectrum and Af is the final absorbance of the dye
or the total area under the final spectrum.
IV. 3.3.5 Determination of dyes concentrations
Dyes concentrations were calculated from calibration curves by reading the absorbance
of the samples at the maximum absorbance wavelength of each dye present in the effluent.
UV–visible spectrophotometer (Thermo model UV1) was used in all the experiments. By
measuring the amount of the substrate remaining overtime it is possible to obtain the
concentration vs. time plot which is known as time course. Equilibrium was considered to be
achieved when no significant changes in the concentration were detected.
IV. 3.4 Kinetic modelling: optimization and simulation IV. 3.4.1 Kinetic models
Most kinetic studies of laccase catalyzed reactions involved the application of the
Michaelis–Menten kinetic model (Gianfreda et al., 1998; Hofer and Schlosser, 1999; Ryan et al.,
2003; Xu, 2001). According to Cristóvão et al. (2009), the kinetics of the laccase catalyzed
degradation of a mixture of dyes can be described by the following equations based on
Michaelis–Menten equation:
[ ][ ]SK
Svv
MS
max
+= (IV. 3.1)

Part IV – Kinetic Modelling and Simulation
147
[ ] [ ]
[ ] [ ]SK
P1K
K
PSv
v
MP
MS
eq
max
+
+
−
= (IV. 3.2)
[ ][ ]
)e1(SK
Svv kt
MS
max −−+
= (IV. 3.3)
[ ] [ ]
[ ] [ ]( )kt
MP
MS
eq
max
e1
SK
P1K
K
PSv
v −−
+
+
−
= (IV. 3.4)
where v is the reaction rate, vmax is the maximum reaction rate, Keq is the equilibrium constant of
the catalytic reaction, KMS and KMP are the Michaelis–Menten constants for the substrate and for
the product, respectively, [S] and [P] are concentrations of the substrate and the product,
respectively, k is the rate constant of the activation period of the laccase–mediator system and t
is time. Since these models are valid for the degradation of a mixture of dyes: RY15 (Equation
(IV. 3.4)), RR239 (Equation (IV. 3.2)) and RB5 (Equation (IV. 3.4)) (Cristóvão et al., 2009), we
tried to use the same models to describe the kinetics of the degradation of the simulated
effluent.
IV. 3.4.2 Batch reactor balance
The differential equation obtained from the mass balance to the batch reactor is given
by Equation (IV. 3.5):
[ ]
L
EV
1.W.v
dt
Sd=− (IV. 3.5)
where WE is the enzyme mass and VL is the volume of the reactor.
IV. 3.4.3 Estimation of the reaction kinetics and kinetic constants
As in previous works (Cristóvão et al., 2008, 2009), the system of equations obtained
from the batch reactor balance (Equation (IV. 3.5)) and from the proposed kinetics for the
enzymatic reactions (Equations (IV. 3.1) – (IV. 3.4)) was solved using a Fortran program with
integration by the LSODE code (Livermore Solver for Ordinary Differential Equations) based on
Adams backward differentiation formulae methods, to predict the profile of the effluent

Part IV – Kinetic Modelling and Simulation
148
concentrations versus time in the batch reactor. The initial concentrations of the effluent and
first guesses of the parameters values were fed to the program. This program was combined
with an optimization algorithm to estimate the kinetic constants of the proposed model by
minimizing the difference between the predicted time courses and the ones obtained
experimentally. The function to minimize between both time courses was the sum of squared
relative residuals and was calculated as in Equation (IV. 3.6):
∑−
=n
1
2
exp
expcalc
C
CCF (IV. 3.6)
where Ccalc is the concentration calculated using the model equation, Cexp is the experimental
concentration and n is the total number of experimental and calculated points. The function was
minimized through an optimization loop based on an adaptive random search algorithm that
varies the values of the kinetic constants until a global minimum within the optimization criterion
is achieved (Salcedo et al., 1990; Salcedo, 1992). This procedure was repeated for each dye
present in the effluent.
IV. 3.5 Analytical methods
The routine analysis of conventional wastewater parameters are necessary in order to
monitor the quality of effluents and to decide its further reuse or discharge. So, water quality
analyses such as TOC, COD and BOD were made.
IV. 3.5.1 Total organic carbon
Following the reduction in TOC it is possible to evaluate the mineralization of the
simulated effluent. The TOC was determined by catalytic oxidation followed by quantification of
the CO2 formed through infra-red spectrometry, as described in Method No. 5310 of the
Standard Methods for the Examination of Water and Wastewater (APHA, AWWA, WEF, 1998).
For that, a Shimadzu 5000A TOC analyser was used. TOC values reported represent the
average of at least two measurements; in most cases each sample was injected three times,
validation being performed by the apparatus only if the coefficient of variation (CV) is smaller
than 2 %.
IV. 3.5.2 Chemical oxygen demand
COD is often used as a measurement of pollutants in wastewater and natural waters.
COD was determined by colourimetric measurement after closed reflux digestion (APHA,
AWWA, WEF, 1998), carried out in a MERCK spectroquant, model TR 420.

Part IV – Kinetic Modelling and Simulation
149
IV. 3.5.3 Biochemical oxygen demand
The BOD is used to determine the relative oxygen requirements for the biodegradation
of wastewaters effluents and polluted waters. BOD5 (biochemical oxygen demand in a 5-days
test period at 20 ºC) was quantified by the dilutions method (APHA, AWWA, WEF, 1998). The
concentration of dissolved oxygen was measured with a Crison O2 meter electrode, model
oxi45.
IV. 3.5.4 Toxicity
The toxicity of simulated effluent was determined using the bioluminescent bacterium
Vibrio fischeri before and after the decolourization, by measuring the reduction of light
production due to interactions between bacteria and toxic compounds (Dutka et al., 1991). The
test is standardized for water and effluent samples (ISO 11348-3, 1998), but the toxicity
assessment of colourful and turbid samples with this method is complicated or impossible due
to the interferences in the measurement. According to Lappalainen et al. (1999, 2001) the
toxicity of that highly colourful samples can be measured with kinetic Flash method using, also,
the luminescent V. fischeri. In this method, each sample acts as a reference for itself.
The toxicity of the simulated effluent was evaluated by this bioluminescence test in
Toxicity Analyzer Microtox 2055, according to the Microtox acute toxicity basic test procedure.
All samples were serially diluted in 2 % w/v NaCl, and each assay was performed in duplicate at
pH 7.0, 15 ºC. Sodium chloride (2 % w/v) was used as the negative control. For colour
correction the bacteria were dispensed into the sample and the signal was recorded
continuously. The maximum signal received after immediately dispensing was compared to the
signal after an incubation period. The sample concentrations that inhibited 20 % and 50 % of
the light output (EC20 and EC50, respectively) were determinated after a 5 and 15 min. exposure
times. Phenol was used as the positive control with EC20 ranging from 3 to 6 mg/L and EC50
from 13 to 26 mg/L.
IV. 3.6 Results and Discussion
IV. 3.6.1 Degradation of the simulated effluent
A simulated effluent containing three reactive textile dyes, salts and dyeing auxiliary
chemicals was used in equilibrium and kinetic experiments, in order to evaluate the applicability
of the degradation process of textile effluents by commercial laccase to a real situation. An
artificial reactive dye bath was prepared due to three reasons: firstly, it enables research to be
carried out in the absence of a local source of effluent; secondly, simulated effluents have a
constant composition and, hence, enable the effect of treatment to be more readily understood;
and thirdly, from the practical point of view it is of utmost importance to assess the treatment

Part IV – Kinetic Modelling and Simulation
150
performance of the selected treatment systems in the presence of several dye assisting
chemicals since reactive dyes are always found in the form of an ‘‘exhausted” dye bath
formulation.
The degradation of the simulated real effluent by commercial laccase was evaluated by
the percentage of absorbance reduction at the maximum absorbance wavelength of each dye
present in the effluent as well as by the total colour removal based on all the visible spectrum.
These results are presented in Table IV. 3.1 and show that the degradation is more pronounced
at the RB5 maximum wavelength. At this wavelength decolourization above 86 % was
observed. At the maximum wavelength of RY15 it was also observed a good decolourization
(above 63 %), but at 542 nm (corresponding to RR239) a worse decolourization was observed:
only around 41 %. The total degradation based on all the visible spectrum range presented
values in order of 55 %. These decolourizations were lower than those obtained with the
mixture of dyes only (above 89 % for RB5, 77 % for RY15, 68 % for RR239 and above 84 % for
total decolourization) (Cristóvão et al., 2009) due to the presence of salts and auxiliary
chemicals. Probably happens one or more of the following things: the formation of strong
chemical bonds with the species involved in the degradation process, the creation of products
during the process or even because of enzyme deactivation.
Table IV. 3.1 – Simulated effluent degradation (%) based on the absorbance peak at maximum
wavelength of each dye present in the effluent and on the area integration over all spectrum range.
RY15 416 nm RR239 542 nm RB5 598 nm Area
125 64.96 ± 1.74* 39.92 ± 0.69 86.41 ± 0.50 59.57 ± 0.72
100 63.38 ± 0.59 42.90 ± 0.05 87.36 ± 0.04 60.53 ± 0.35
85 63.84 ± 0.98 41.66 ± 0.13 87.65 ± 0.28 55.09 ± 0.24
75 64.86 ± 0.22 40.82 ± 1.36 87.45 ± 0.70 54.29 ± 2.27
50 63.82 ± 0.17 42.04 ± 0.34 87.33 ± 0.16 49.99 ± 0.50
[effluent] (mg/L)% Degradation
*Standard deviation
The laccase catalyzed degradation showed to be an interesting treatment method for a
mixture of dyes but its performance is a little worse when treating real textile dyeing effluents.
Nonetheless, the presented results show that this method could be used for treating textile
dyeing wastewaters, particularly as a polishing process for water recycling.
IV. 3.6.2 Kinetic modelling and estimation of kinetic constants
In previous works, kinetic models to simulate the decolourization of individual reactive
textile dyes (Cristóvão et al., 2008) and of a dye mixture (Cristóvão et al., 2009) in batch
reactors by commercial laccase formulation containing a specific mediator were proposed. In
this work, the kinetics of degradation of a simulated effluent is investigated, using the same
models previously established as above mentioned. It was the first study on the determination

Part IV – Kinetic Modelling and Simulation
151
of kinetic parameters of these reactions from the entire time course data. To our knowledge
there is no study about the kinetics of degradation of a simulated textile effluent.
The kinetics of the simulated effluent degradation was studied at the maximum
wavelength of each dye in the effluent, in order to enable the comparison with the results of the
dye mixture degradation. The kinetic constants of the proposed models were estimated by
comparing the experimental time courses with the predicted ones for each wavelength studied.
Experimental time courses were obtained in duplicate at five different initial effluent
concentrations for each wavelength. It was observed for all the wavelengths studied that initially
the concentration almost do not decrease, which probably corresponds to the activation time of
the laccase–mediator system. However these initial periods vary depending on the wavelength,
being more (598 nm) or less (416 nm) pronounced. Then, the kinetic models must present an
exponential term to predict these induction times. These reactions are not complete at any of
the wavelengths. The concentrations decreased along time until reaching a plateau where no
more effluent was degraded. However, at the wavelength corresponding to the RB5 the reaction
was almost complete, which is in accordance with the degradation observed (above 86 %).
Comparing these results with the ones obtained for the dye mixture (Cristóvão et al., 2009), it
was possible to observe that the degradations exhibit similar behaviours at 416 nm and at 598
nm. At 542 nm the behaviour is a little different. This was probably due to the presence of other
substances in the effluent.
As in the other cases, a program using the LSODE code to solve the differential
equation of the batch reactor balance (Equation (IV. 3.5)) considering the proposed kinetics for
the enzymatic degradation of the simulated effluent at the wavelengths of each dye in the
effluent (Equation (IV. 3.4) for all the wavelengths) was combined with an optimization program
(Salcedo et al., 1990; Salcedo, 1992) to obtain the theoretical time courses. The kinetic
constants were estimated by minimizing the difference between the predicted time courses and
the experimentally obtained ones. The developed algorithm adjusts automatically the kinetic
constants so that the output response (predicted by the model) and the input values
(experimental data) are as close as possible according to the objective function (Equation (IV.
3.6)). This process was repeated while the relative errors between the estimated and the
experimental values decreased.
The obtained kinetic constants for the kinetic models at each wavelength are shown in
Table IV. 3.2 and were used to draw the continuous lines in Figures IV. 3.1 – IV. 3.3, that
represent the behaviour of the effluent degradations at each wavelength.

Part IV – Kinetic Modelling and Simulation
152
Table IV. 3.2 - Proposed model, kinetic data and average sum of squared relative residuals (SSRR) of
RY15, RR239 and RB5 degradation by commercial laccase when in a simulated effluent.
RY15 (416 nm) RR239 (542 nm) RB5 (598 nm)
Kinetic equation (IV. 3.4) (IV. 3.4) (IV. 3.4)
vmax (mg/g.min) 10.0 19.7 58.0
KMS (mg/L) 10.0 8.1 7.0
KMP (mg/L) 2.43 372.3 49.0
Keq 1.95 0.752 23.2
k (min-1
) 0.044 0.075 0.050
SSRR/n 6.90 x 10⁻⁴ 1.14 x 10⁻³ 8.19 x 10⁻²
Figure IV. 3.1 - Comparison of experimental (x, run 1; o run 2) and simulated (continuous line) time
courses of RY15 degradation in a simulated effluent by commercial laccase under different initial
concentrations: (a) 120.5 mg/L and 124.7 mg/L; (b) 94.7 mg/L and 94.8 mg/L; (c) 86.8 mg/L and 85.4
mg/L; (d) 74.6 mg/L and 75.5 mg/L; (e) 51.4 mg/L and 51.5 mg/L.
0
20
40
60
80
100
120
140
0 20 40 60 80
Time (minutes)
Co
nc
en
tra
tio
n (
mg
/L)
(a)
(b) (c)
(d)
(e)
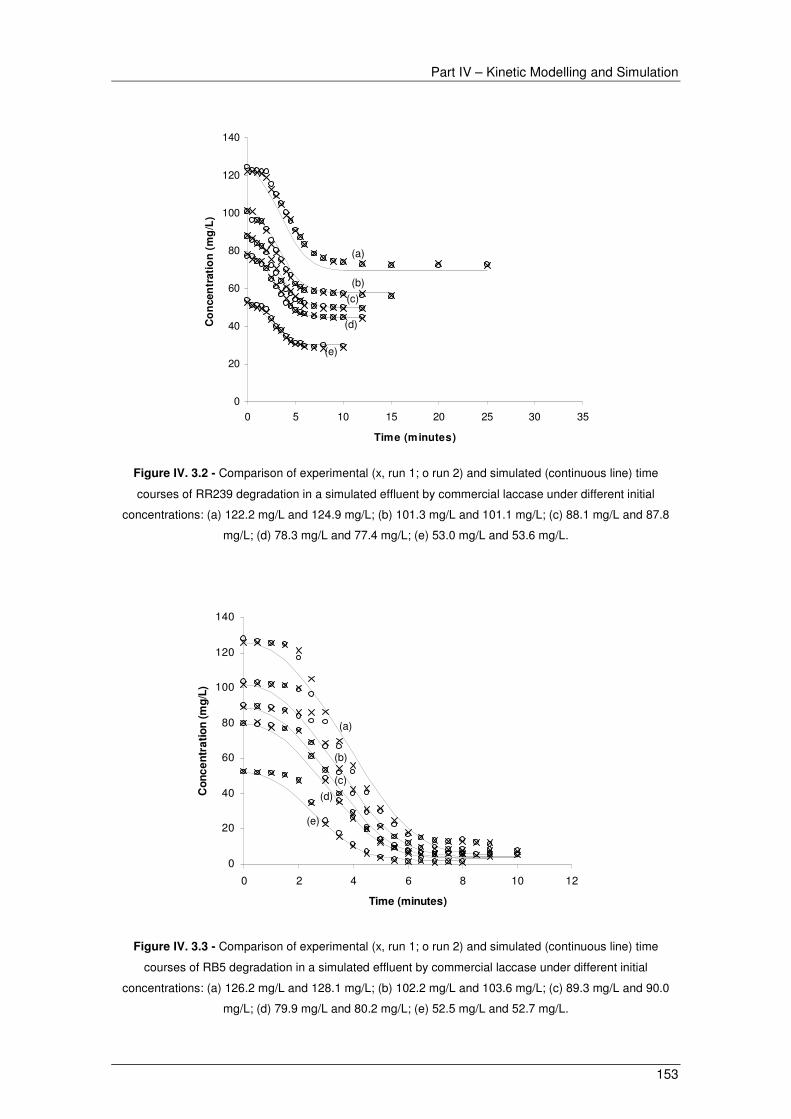
Part IV – Kinetic Modelling and Simulation
153
Figure IV. 3.2 - Comparison of experimental (x, run 1; o run 2) and simulated (continuous line) time
courses of RR239 degradation in a simulated effluent by commercial laccase under different initial
concentrations: (a) 122.2 mg/L and 124.9 mg/L; (b) 101.3 mg/L and 101.1 mg/L; (c) 88.1 mg/L and 87.8
mg/L; (d) 78.3 mg/L and 77.4 mg/L; (e) 53.0 mg/L and 53.6 mg/L.
Figure IV. 3.3 - Comparison of experimental (x, run 1; o run 2) and simulated (continuous line) time
courses of RB5 degradation in a simulated effluent by commercial laccase under different initial
concentrations: (a) 126.2 mg/L and 128.1 mg/L; (b) 102.2 mg/L and 103.6 mg/L; (c) 89.3 mg/L and 90.0
mg/L; (d) 79.9 mg/L and 80.2 mg/L; (e) 52.5 mg/L and 52.7 mg/L.
0
20
40
60
80
100
120
140
0 5 10 15 20 25 30 35
Time (minutes)
Co
ncen
trati
on
(m
g/L
)
(a)
(b)
(c)
(d)
(e)
0
20
40
60
80
100
120
140
0 2 4 6 8 10 12
Time (minutes)
Co
nc
en
tra
tio
n (
mg
/L)
(a)
(b)
(c)
(d)
(e)

Part IV – Kinetic Modelling and Simulation
154
According to Cristóvão et al. (2008), the KMS constant of the proposed model is the
equilibrium constant of the enzyme–mediator/substrate complex decomposition. It measures the
enzyme–mediator system affinity to the substrate. The lesser the value of KMS, the larger is the
affinity of the enzyme–mediator system to the substrate. Comparing the KMS values of each dye
in the effluent (Table IV. 3.2), the laccase–mediator system affinities for the dyes decrease
according to the following order: RB5 > RR239 > RY15. This result is easy to confirm in Figures
IV. 3.1 – IV. 3.3 by the time that each dye takes to reach the equilibrium. A larger dyes
degradation time corresponds to a more difficult decolourization (less affinity of the laccase–
mediator system for the dye). In the previous cases of single and mixture of dyes (Cristóvão et
al., 2008, 2009), the RR239 was always the slower dye. In this case, this dye reached the
equilibrium faster, however it was not so degraded: it continues to be the least degraded. The
degradation of each dye and its affinity to the laccase–mediator system depends on the redox
potentials of each substance (Tavares et al., 2009b). The RR239 is the dye with the highest
redox potential, thus being the more difficult to degrade.
The rates of the dyes degradation in the effluent can also be assessed by the value of
vmax – the theoretical maximum velocity. According to the values of vmax presented in the Table
IV. 3.2 for each dye in the effluent, the degradation rate decreases in the following order: RB5 >
RR239 > RY15, which is in a good agreement with the conclusions obtained with the other
parameters.
This study also enables to evaluate the activation rate of the laccase–mediator system
by the k values presented in Table IV. 3.2. According to the results, the activation of the
laccase–mediator system decreases according to the following order: RR239 > RB5 > RY15.
In order to evaluate the adequacy of the proposed models for the kinetics of the
simulated effluent decolourization by commercial laccase, the time courses calculated by the
kinetic models were compared with the experimental ones. These comparisons at the
wavelengths of RY15, RR239 and RB5 are displayed in Figures IV. 3.1 – IV. 3.3, respectively.
The close correspondence of the experimental data with the simulated values under different
effluent concentrations seems to demonstrate that the proposed mathematical models are able
to describe with remarkable accuracy the RY15, RR239 and RB5 laccase catalyzed
degradations when they are present in a simulated textile effluent. These kinetic models provide
an emergent tool to simulation and design of enzymatic bioreactors as for optimization of the
process.
Nonetheless, the correspondence between both time courses for RB5 wavelength
seems to be not as good as for the other wavelengths. This led us to try a new model for this
case, this time with a static period for the activation time of the laccase–mediator system, during
which the initial concentration does not change:

Part IV – Kinetic Modelling and Simulation
155
( )[ ]
[ ] [ ]
[ ] [ ])tt(H
SK
P1K
K
PSV
)tt(HtHCv 0
MP
MS
eq
max
00 −
+
+
−
+−−= (IV. 3.7)
where C0 corresponds to the initial concentration, H(t) is the Heaviside step function with values
of 0 for t < 0 and 1 for t ≥ 0 and t0 corresponds to the time at which the concentration starts to
decrease.
By observation of the experimental behaviour the concentration almost does not vary up
to 2 min., so it was assumed that t0 corresponds to 2 min.. The kinetic constants of the model
were estimated by minimizing the difference between the experimental time courses and the
ones predicted by the model from 2 min. to the end. The obtained kinetic constants for this
kinetic model were vmax = 11.887 mg/g.min, KMS = 21.31 mg/L, KMP = 108.71 mg/L and Keq =
22.57 with an average sum of squared relative residuals of 9.366 x 10⁻². Despite of having a
slightly larger error, we found important to show this new result as it seems to better follow the
initial behaviour at this wavelength and seems to be qualitatively more appropriate to describe
the system behaviour. The comparison between the experimental time courses and the ones
predicted by this new model is presented in Figure IV. 3.4.
Figure IV. 3.4 - Comparison of experimental (x, run 1; o run 2) and simulated (continuous line) time
courses by a new kinetic model with a static initial period of RB5 degradation in a simulated effluent by
commercial laccase under different initial concentrations: (a) 126.2 mg/L and 128.1 mg/L; (b) 102.2 mg/L
and 103.6 mg/L; (c) 89.3 mg/L and 90.0 mg/L; (d) 79.9 mg/L and 80.2 mg/L; (e) 52.5 mg/L and 52.7 mg/L
0
20
40
60
80
100
120
140
0 2 4 6 8 10 12
Time (minutes)
Co
nc
en
tra
tio
n (
mg
/L)
(a)
(b)
(c)
(d)
(e)
Part IV – Kinetic Modelling and Simulation
156
By these results, it was possible to conclude that the models can, probably, be also
applied to the decolourization of a real effluent by commercial laccase; however attention must
be paid to the values of the kinetic constants that vary with the system studied.
Comparing the kinetic constants values of the dye mixture degradation models
(Cristóvão et al., 2009) with the ones of the simulated effluent degradation containing the same
dyes studied, they are different and probably it is not possible to simulate the degradation of the
simulated effluent with the kinetic parameters obtained for the degradation of the dye mixture
and vice versa. When in a simulated effluent, with other auxiliary chemicals and salts, the RY15
and RR239 dyes present a higher degradation rate (vmax), while the RB5 dye presents a lower
degradation rate than when in a simple mixture of the dyes. The laccase–mediator system
affinity for the RR239 dye is highest when present in the simulated effluent, but it presents more
affinity to RY15 and RB5 dyes when they are in the simple mixture. It is also possible to
compare the activation rates of the laccase–mediator system in the degradation of both
systems. In the RB5 degradation case, the activation rate is equal in both situations, when
present in a simple mixture or when in a simulated effluent. Relatively to the RY15 degradation,
the activation rate is greater when it is present in the simple mixture. The degradation of the
RR239 dye does not present laccase–mediator system activation when present in a mixture of
dyes. Furthermore, the RR239 is the only dye that does not fit the same kinetic model in both
situations.
In order to assess the ability of the models developed for the dye mixture in the
prediction of the simulated effluent degradation, the time responses of each dye predicted by
the models of the mixture were evaluated for each of the characteristic wavelengths for the
simulated effluent. The comparison of these predictions with the actual results reveals that, in
the case of RB5 and RY15 the models are able to reproduce the general qualitative behaviour.
However, when the quantitative results are compared the predictions are far from reasonable.
For the RR239 the models are different in both cases, so this simulation does not make sense.
IV. 3.6.3 Environmental analysis
To simulate the dye bath conditions used in the textile industry, the solution fed to the
reactor was previously hydrolysed. After hydrolysis, the environmental parameters average
values of the dye bath effluent were in the order of: BOD5 = 17mg O2/L, COD = 394 mg O2/L
and TOC = 75 mg/L. For the toxicity, since the relationship between EC20 and EC50 is not linear
we decided to give both values presenting two toxic designations (Backhaus et al., 1997). The
values obtained were EC20 = 42 mg/L and EC50 = 64 mg/L, after 5 min. of exposure and EC20 =
28 mg/L and EC50 = 56 mg/L, after 15 min. of exposure. The initial solution was almost non-
toxic. It was only possible to determine the EC20 and EC50 values for effluent concentrations of
125 mg/L. For concentrations lesser than that, it was not possible to determine the toxicity since
it was not detected.

Part IV – Kinetic Modelling and Simulation
157
The final values of water quality analysis obtained after the laccase catalyzed
degradation of the simulated reactive dye bath wastewater were: BOD5 = 1338 mg O2/L, COD =
3383 mg O2/L, TOC = 957 mg/L and COD/BOD5 = 2.53 (defined here as the specific
biodegradability of the effluent in question). Regarding toxicity, only values after 5 min. of
exposure time were possible to obtain and only the EC50 value was possible to get: EC50 = 4.7
mg/L. All the other values give results of high toxicity, even for only 5 % of the effluent. In the
Flash method, the sample is used as a reference for itself, and the light output must be
recorded immediately after all the bacteria contact the sample. The light output of the bacteria
was reduced immediately after contact with the sample, and no actual peak value can be
measured due to the extreme toxicity.
A reduction in the studied values was expected, since the treatment method is based on
an oxidation. However, the simulated effluent has a high degree of complexity since it is a
mixture of auxiliaries, salts, surfactants, degradation products and unknown components of
refractory pollutants. So, the high toxicity to the luminescent bacteria, the high TOC, COD and
BOD5 could be explained as a result of some unknown products produced during the treatment
process. However the results were well above of those expected. So we decided to investigate
this and consider only the solution of enzyme (only with buffer and enzyme). After the same
analysis, the following values were obtained for this enzyme solution: BOD5 = 1300 mg O2/L,
COD = 3341 mg O2/L and TOC = 875 mg/L. Relatively to the toxicity, one more time it was only
possible to obtain the EC50 value for 5 min. of exposure: EC50 = 5.4 mg/L, a very high toxicity
value. By these results and comparing with the simulated effluent ones after treatment, it was
possible to conclude that they are of the same order of magnitude, leading to say that it is the
enzyme that contributes to the increase of these analytical parameters. Subtracting the values
corresponding to the enzyme, the values of the treated simulated effluent are similar or slightly
higher than the initial values, which could be due to the complexity of the treated effluent.
Besides that, these values are below the maximum permitted discharge values of textile
industries wastewaters in Portugal (BOD5 = 40 mgO2/L, COD = 150 mgO2/L). A possible
solution to solve the environmental problem caused by the enzyme in the effluent will be studied
and reported in the future, namely the immobilization of the enzyme. If this problem can be
overcome, it seems possible to conclude that the treatment of textile wastewaters by
commercial laccase is probably a good treatment method to implement in textile industries.
IV. 3.7 Conclusions
The decolourization of a simulated wastewater containing salts and auxiliary chemicals
was carried out effectively by laccase catalyzed degradation (around 55 % total decolourization,
86 % RB5, 63 % RY15 and 41 % RR239) showing that it would be a good potential candidate
for treatment of real textile wastewaters.

Part IV – Kinetic Modelling and Simulation
158
The good consistency between experimental and predicted data proved that the
proposed models could successfully simulate the kinetic behaviour of these reactions in batch
reactors. These kinetic models provide an emergent tool to simulation and design of enzymatic
bioreactors.
The water quality analyses showed values below the maximum permissible discharge
values of textile industrial wastewaters.
IV. 3.8 References Aksu, Z., 2005. Application of biosorption for the removal of organic pollutants: a review. Process Biochemistry, 40, 997-1026.
Alaton, I.A., Balcioglu, I.A., Bahnemann, D.W., 2002. Advance oxidation of a reactive dyebath effluent: comparison of O3, H2O2/UV-C and TuO2/UV-A processes. Water Research, 36, 1143-1154.
Almansa, E., Kandelbauer, A., Pereira, L., Cavaco-Paulo, A., Gubitz, G.M., 2004. Influence of structure on dye degradation with laccase mediator systems. Biocatalysis and Biotransformation, 22, 315-324.
APHA, AWWA, WEF, 1998. Standard methods for the examination of water and wastewater, twentieth ed. American Public Health Association, American Water Works Association, Water Pollution Control Federation, Washington, DC.
Arslan, I., Balcioglu, I.A., Bahnemann, D.W., 2000. Heterogeneous photocatalytic treatment of simulated dyehouse effluents using novel TiO2-photocatalysts. Applied Catalysis B – Environmental, 26, 193-206.
Asad, S., Amoozegar, M.A., Pourbabaee, A.A., Sarbolouki, M.N., Dastgheib, S.M.M., 2007. Decolorization of textile azo dyes by newly isolated halophilic and halotolerant bacteria. Bioresource Technology, 98, 2082-2088.
Avlonitis, S.A., Poulios, I., Sotiriou, D., Pappas, M., Moutesidis, K., 2008. Simulated cotton dye effluents treatment and reuse by nanofiltration. Desalination, 221, 259-267.
Backhaus, T., Froehner, K., Altenburger, R., Grimme, L.H., 1997. Toxicity testing with Vibrio fischeri: a comparison between the long term (24h) and the short term (30 min) bioassay. Chemosphere, 35, 2925-2938.
Cristóvão, R.O., Tavares, A.P.M., Ribeiro, A.S., Loureiro, J.M., Boaventura, R.A.R., Macedo, E.A., 2008. Kinetic modelling and simulation of laccase catalyzed degradation of reactive textile dyes. Bioresource Technology, 99, 4768-4774.
Cristóvão, R.O., Tavares, A.P.M., Ferreira, L.A., Loureiro, J.M., Boaventura, R.A.R., Macedo, E.A., 2009. Modeling the discoloration of a mixture of reactive textile dyes by commercial laccase. Bioresource Technology, 100, 1094-1099.
Dutka, B.J., Kwan, K.K., Rao, S.S., Kurkovic, A., McInnis, R., 1991. Use of bioassays to evaluate river water and sediment quality. Environmental Toxicology and Water Quality, 6, 309-327.
Gianfreda, L., Sannino, F., Filazzola, M.T., Leonowicz, A., 1998. Catalytic behaviour and detoxifying ability of a laccase from the fungal strain Cerrena unicolor. Journal of Molecular Catalysis B – Enzymatic, 4 (1-2), 13-23.
Hofer, C., Schlosser, D., 1999. Novel enzymatic oxidation of Mn2p to Mn3p catalyzed by a fungal laccase. FEBS Letters, 451 (2), 186-190.
Lappalainen, J., Juvonen, R., Vaajasaari, K., Karp, M., 1999. A new flash method for measuring the toxicity of solid and colored samples. Chemosphere, 38 (5), 1069-1083.
Lappalainen, J., Juvonen, R., Nurmi, J., Karp, M., 2001. Automated color correction method for Vibrio fischeri toxicity test. Comparison of standard and kinetic assays. Chemosphere, 45, 635-641.
López-Grimau, V., Gutiérrez, M.C., 2006. Decolourisation of simulated reactive dyebath effluents by electrochemical oxidation assisted by UV light. Chemosphere, 62, 106-112.

Part IV – Kinetic Modelling and Simulation
159
Moldes, D., Sanroman, M.A., 2006. Amelioration of the ability to decolorize dyes by laccase: relationship between redox mediators and laccase isoenzymes in Trametes versicolor. World Journal of Microbiology and Biotechnology, 22, 1197-1204.
Ramsay, K.V., Nguyen, T., 2002. Decolourisation of textile dyes by Trametes versicolor and its effect on dye toxicity. Biotechnology Letters, 24, 1757-61.
Ryan, S., Schnitzhofer, W., Tzanov, T., Cavaco-Paulo, A., Gubitz, G.M., 2003. An acid-stable laccase from Sclerotium rolfsii with potential for wool dye decolourisation. Enzyme and Microbial Technology, 33, 766-774.
Salcedo, R., Gonçalves, M.J., Azevedo, S.F., 1990. An improved random-search algorithm for non-linear optimization. Computers and Chemical Engineering, 14, 1111-1126.
Salcedo, R., 1992. Solving Nonconvex Nonlinear Programming and Mixed-Integer Nonlinear Programming Problems with Adaptive Random Search. Industrial and Engineering Chemical Research, 31, 262-273.
Soares, G.M.B., Pessoa de Amorim, M.T., Hrdina, R., Costa-Ferreira, M., 2002. Studies on biotransformation of novel disazo dyes by laccase. Process Biochemistry, 37, 581-7.
Tavares, A.P.M., Cristóvão, R.O., Loureiro, J.M., Boaventura, R.A.R., Macedo, E.A., 2008. Optimisation of reactive textile dyes degradation by laccase–mediator system. Journal of Chemical Technology and Biotechnology, 83, 1609-1615.
Tavares, A.P.M., Cristóvão, R.O., Loureiro, J.M., Boaventura, R.A.R., Macedo, E.A., 2009a. Application of statistical experimental methodology to optimize reactive dye decolourisation by commercial laccase. Journal of Hazardous Materials, 162, 1255-1260.
Tavares, A.P.M., Cristóvão, R.O., Gamelas, J.A.F., Loureiro, J.M., Boaventura, R.A.R., Macedo, E.A., 2009b. Sequential decolourisation of reactive textile dyes by laccase mediator system. Journal of Chemical Technology and Biotechnology, 84, 442-446.
Xu, F., 2001. Dioxygen reactivity of laccase-dependence of laccase-source, pH, and anion inhibition. Applied Biochemistry and Biotechnology, 95 (2), 125-133.


Part V
Immobilization


In this part of the thesis the study of the immobilization of commercial laccase (DeniLite
II S) into coconut fiber by physical adsorption is presented. The typical characteristics of
immobilized enzymes are evaluated and its implementation in the degradation of dyes is
checked.


Part V Immobilization of commercial laccase
onto green coconut fiber by adsorption and its
application for reactive textile dyes
degradation
V. 1 Abstract
V. 2 Introduction
V. 3 Materials and Methods
V. 4 Results and Discussion
V. 5 Conclusions
V. 6 References


Part V – Immobilization
167
V Immobilization of commercial laccase onto green coconut
fiber by adsorption and its application for reactive textile dyes
degradation
V. 1 Abstract
An effort has been made to find a cheaper, easily available and simple alternative for
the immobilization and subsequent utilization at large scale of commercially available enzymes
in textile wastewater treatment. Commercial laccase DeniLite II S was immobilized for the first
time on an agroindustrial residue, green coconut fiber, by physical adsorption. The effect of the
immobilization conditions (enzyme concentration, contact time and pH value) on the properties
of the biocatalyst was determined. Then, the immobilized enzyme characterization in the
optimized conditions was performed and kinetic parameters were obtained. Thermal and
operational stabilities were improved comparing with the free commercial laccase showing its
potential for continuous applications. Finally, the performance of immobilized laccase for the
continuous degradation of various reactive textile dyes and of a mixture of them in batch
reactors was evaluated, for application in continuous mode at industrial level. In these
experiments, two phenomena were observed: decolourization of the solutions due to dyes
adsorption on the support and degradation due to the enzyme action. A high decolourization
percentage of practically all dyes was obtained in the first two cycles, showing the suitability of
the immobilized commercial laccase for continuous colour removal from textile industrial
effluents. An effective dye mixture decolourization (about 50 % of total decolourization in all
visible spectra) by the immobilized enzyme was also observed. All these results confirm the
initial idea of commercial laccase immobilized on coconut fiber as a promising biocatalyst for
industrial applications.
V. 2 Introduction
A large number of synthetic dyes are being increasingly used in the textile, paper,
pharmaceutical, cosmetics and food industries. Over 7 x 10⁵ tonnes of approximately 100,000
different dyes and pigments are produced annually worldwide, of which about 50,000 tonnes
are discharged into the environment (Lewis, 1999; Slokar and Marechal, 1998). These
compounds cause serious environmental pollution. Most of them are toxic, mutagenic and
carcinogenic. Moreover, they are unusually resistant to degradation due to their complex
structure and synthetic origin. Colour can be removed from effluents by chemical and physical
methods including adsorption, coagulation-flocculation, ion-exchange, oxidation and
electrochemical methods (Anjaneyulu et al., 2005; Forgacs et al., 2004). However these
methods have financial and methodological disadvantages. They are also time-consuming and

Part V – Immobilization
168
mostly are ineffective. Alternatively, dye decolourization using microbial enzymes has received
great attention in recent years due to its efficient application (Casas et al., 2007; Champagne
and Ramsay, 2005; Couto et al., 2006). Laccase-based decolourization treatments are
potentially advantageous to bioremediation technologies since the enzyme is produced in larger
amounts. Laccase (p-diphenol oxidase, EC 1.10.3.2) catalyzes the oxidation of phenolic
compounds and aromatic amines and accepts a broad range of substrates (Claus, 2004;
Thurston, 1994). The number of substrates can further be extended by using laccase in
combination with mediators (Husain and Husain, 2008; Tavares et al., 2008).
One of the main drawbacks of using free enzymes to detoxify waste streams is their
instability towards thermal and pH denaturation, non-reusability, proteolysis, inactivation by
inhibitors. The immobilization of enzymes to water-insoluble supports can increase their
operational stability and durability and can provide easy separation of the product from reaction
media and easy recovery of the enzyme. Furthermore, enzyme immobilization would allow the
reuse of the enzyme and thus decrease the cost of industrial applications and allow the control
of the process. Therefore, many efforts have been made to immobilize laccase from various
sources (Cao, 2005; Durán et al., 2002), but most of the immobilized enzyme preparations
either use commercially available enzyme or expensive supports, which increase the cost of the
processes (Akhtar et al., 2005a,b).
Several techniques may be applied to immobilize enzymes on solid supports. They are
mainly based on chemical and physical mechanisms (Durán et al., 2002). Therefore, it is hardly
surprising that there is no general universally applicable method of enzyme immobilization. The
main task is to select a suitable carrier, condition (pH, temperature and nature of medium) and
enzyme itself (source, nature and purity) to design an immobilized biocatalyst. The selected
method should meet both the catalytic needs (expressed in productivity, space-time yield,
stability and selectivity) and the non-catalytic needs (e.g. separation, control, down-streaming
process) that are required by a given application. As a result, an immobilized enzyme can be
labelled as “robust, when both the catalytic and the non-catalytic functions can meet the
requirements of a specific application (Bornscheuer, 2003; Dyal et al., 2003).
Laccase, immobilized on several supports, has been evaluated for the elimination of
pollutants such as phenols, but few studies have investigated dye decolourization (Durán and
Esposito, 2000; Durán et al., 2002). Dye decolourization using laccase immobilized on imidazol-
modified silica gel (Peralta-Zamora et al., 2003) or silanized alumina particles (Zille et al., 2003)
occurred mainly by adsorption and to a lesser extent, by enzymatic decolourization. More
recently, Champagne and Ramsay (2007) demonstrated that laccase immobilized on controlled
porosity carrier glass beads using APTES-glutaraldehyde decolourized a single anthraquinone
dye mainly by enzymatic degradation.
An effort has been made to find a cheaper and easily available alternative for the
immobilization and subsequent utilization at large scale of commercially available enzymes.
Thus, green coconut fiber was used as support for laccase immobilization. To our knowledge,

Part V – Immobilization
169
no reports on laccase immobilization by physical adsorption on green coconut fiber have been
published. Among the various immobilization techniques, the physical adsorption on the basis of
bioaffinity may be a good choice for enzyme immobilization, as this process can immobilize
enzyme directly from crude homogenate and thus avoid the high cost of purification. It saves
time and labour since it is a simple operation, no further treatment of the support is needed and
supports can be reused after desorption of the inactivated enzyme, thus reducing the final price
and generating fewer residues (Alonso-Morales et al., 2004; Sari et al., 2006). The ease of
immobilization, lack of chemical modification and enhancement in stability are some of the
advantages offered by the adsorption procedures (Akhtar et al., 2005a,b; Kulshrestha and
Husain, 2006). Besides the mentioned advantages offered by the bioaffinity-based procedures,
there is an additional benefit, such as proper orientation of enzyme on the support (Khan et al.,
2005; Mislovicova et al., 2000). These supports provide high yield and stable immobilization of
enzymes. However, this technique possesses disadvantages, such as low linking energy
between enzyme and support, which may cause enzyme desorption in presence of the
substrate or when it is exposed to variations on temperature, pH and ionic strength.
Nevertheless, immobilization by adsorption is one of the most used techniques in the attainment
of insoluble biocatalysts (Kennedy et al., 1988).
The first objective of this study was to immobilize the commercial laccase by adsorption
on green coconut fiber and to determine the effect of the immobilization conditions (enzyme
concentration, contact time and pH value) on the properties of the biocatalyst. The second
objective was to evaluate the performance of immobilized laccase regarding the continuous
degradation of various reactive textile dyes and of a mixture of them in batch reactors.
V. 3 Materials and Methods
V. 3.1 Chemicals and enzyme
Textile Dyes: Reactive Black 5 (RB5) (Remazol Black B), Reactive Blue 114 (RB114)
(Levafix Brilliant Blue E-BRA), Reactive Yellow 15 (RY15) (Remazol Yellow GR), Reactive
Yellow 176 (RY176) (Remazol Yellow 3RS), Reactive Red 239 (RR239) (Remazol Brilliant Red
3BS) and Reactive Red 180 (RR180) (Remazol Brilliant Red F3B) were kindly provided by
DyStar (Portugal) and were used for degradation experiments without any further purification.
Enzyme: Commercial laccase formulation (DeniLite II S; 120 U/g) from genetically
modified Aspergillus was kindly provided by Novozymes. This formulation is used for indigo dye
decolourization in denim finishing operations and includes a buffer and an enzyme mediator.
Support: Green coconut fiber was kindly donated by Embrapa Agroindústria Tropical,
Ceará State, Brazil. It was cut and sieved to obtain particles between 32 and 35 mesh and then
washed with distilled water and dried at 60 ºC before being used as immobilization matrix.

Part V – Immobilization
170
V. 3.2 Immobilization procedures
To optimize the enzyme immobilization conditions by adsorption technique, 0.15 g of
green coconut fiber were incubated in syringes with 1.5 mL of laccase solution containing 0.08-
2.6 g/mL of enzyme at room temperature and varying pH from 4.0 to 9.0. The syringes with the
solutions were stirred on a rotational shaker TECNAL, model TE-165 (Figure V. 1). At the
optimized conditions of pH and enzyme concentration, the effect of contact time was evaluated
in the range 30 min. – 8 h. The solutions were also stirred on the rotational shaker. After
immobilization, the support was separated by filtration and washed three times with 0.1 M of
phosphate buffer (pH = 7.0). The supernatant was kept for enzyme activity measurements. The
immobilized enzyme activity was measured as described below. For each assay duplicate or
triplicate runs were made.
Figure V. 1 – Rotational shaker with syringes.
V. 3.3 Measurements of activity of free and immobilized laccase
The free laccase activity was assayed spectrophotometrically (Thermo Electron, model
UV1 spectrophotometer) with ABTS as substrate (0.4 mM) in 0.05 mM citrate/0.1 mM
phosphate buffer at pH 4.5. To measure the laccase activity, 0.1 mL of the incubated enzyme
solution was added to 1.9 mL of the ABTS solution at 40 ºC (Ander and Messner, 1998). The
change in absorbance at 420 nm (ε= 36×103 M−1·cm−1) was recorded for 30 s and the catalytic
activity was determined by measuring the slope of the initial linear portion of the kinetic curve.
One unit (U) was defined as the amount of enzyme that oxidized 1 µmol of ABTS per min. and
the activities were expressed in U/L.
The immobilized laccase activity was assayed by incubating 0.1 g of support in 7.0 mL
of the same citrate–phosphate buffer with 2.5 mL of ABTS (0.4 mM) at 40 ºC. The change in
absorbance was monitored every minute, over a 4 min. period, by withdrawing 2 mL of the

Part V – Immobilization
171
solution. After measurement, the solution was turned back to the reactor. The absorbance at
420 nm (ε= 36×103 M−1·cm−1) was measured as before. The final activity of immobilized laccase
was expressed in U/kg .
Immobilization yield (%) is defined as the difference between enzyme activity in the
supernatant before and after immobilization divided by the enzyme activity in the supernatant
before immobilization.
The recovery activity (%) of the immobilized enzyme is defined as the ratio between the
activity of the immobilized enzyme and the activity of a similar amount of the free enzyme.
V. 3.4 Thermal stability of free and immobilized laccase
The thermal inactivation of the free and immobilized laccase was investigated by
incubating the free and immobilized enzyme in phosphate (100 mM) buffer pH 7.0 at 60 ºC. For
this purpose 0.1 g of immobilized enzyme or free laccase (550 U/L) were incubated in a water
bath with temperature control. In certain time intervals consecutive aliquots were taken up to
complete inactivation. The initial activities were compared with the residual activities. The
thermal parameters were calculated according to the simplified deactivation model proposed by
Henley and Sadana (1985) referenced by Arroyo et al. (1999):
αα +−= −kte).1(A (V. 1)
where A is the residual enzyme activity, α is the ratio of specific activity E1/E to the different
states (see Equation V. 2), k the thermal inactivation parameter and t the time. Thermal
parameters were estimated by fitting the experimental data to Equation (V. 1) using a nonlinear
regression code (MicroCal Origin software v.3.01 (SPSS Inc., Northampton, USA).
1
k
EE → (V. 2)
Biocatalyst half-life (t1/2) was calculated from Equation V. 1, using the estimated
parameters (k and α) and making A equal to 0.5. In this work, stabilization factor (F) was
considered as the ratio of immobilized enzyme´s half-lives to soluble enzyme half-life.
V. 3.5 Operational stability of immobilized laccase
Operational stability of the immobilized laccase was assessed by incubating 0.1 g of the
immobilized laccase with 2.5 mL of ABTS (4 mM) in 7 mL of citrate–phosphate buffer pH 7.0 at
room temperature and under moderate mixing. 16 cycles of operational stability were carried
out. At each cycle, a sample was withdrawn in 1 min. intervals, absorbance was measured and
then it was returned to reactor (initial reaction rate measurements). Afterwards, the reaction was
stopped to the substrate removal. Then the immobilized enzyme was collected by filtration,

Part V – Immobilization
172
washed twice with phosphate buffer 100 mM pH 7.0 and resuspended in a fresh substrate
solution to begin the next cycle. For each assay duplicate runs were made.
V. 3.6 Determination of kinetic parameters
The Michaelis–Menten kinetic parameters KM and vmax of free and immobilized laccase
were determined by measuring the laccase activity using ABTS as substrate over a 0.1-1.5 mM
range of initial concentrations. The parameter values were obtained by non-linear curve fitting of
the plot of reaction rate versus substrate concentration using the MicroCal Origin software
v.3.01 (SPSS Inc., Northampton, USA).
V. 3.7 Degradation of Reactive dyes by immobilized laccase
A solution of single reactive dye (50 mg/L) (RB5, RB114, RR180, RR239, RY15 or
RY176) or a mixture of three dyes 50 mg/L (RB5, RY15 and RR239) was continuously orbital
stirred (240 rpm) with 0.4 g of support immobilized with laccase (0.067 g/mL of laccase per g
support) in phosphate buffer solution pH 7.0, final volume of 25 mL at 35 ºC (Figure V. 2). Three
cycles of dye degradation were carried out. Between each cycle, the support was washed three
times with phosphate buffer pH 7.0, 100 mM. Dye decolourization was determined by
monitoring the decrease in the absorbance peak at the maximum wavelength for each dye:
RY15 (416 nm), RR239 (542 nm), RB114 (593 nm), RB5 (579 nm), RR180 (540 nm) and
RY176 (421 nm). UV-visible spectrophotometer (Thermo, model UV1) was used in all
experiments. Decolourization is reported as: % decolourization = (Ai − Af)/Ai × 100, where Ai is
the initial absorbance or total area from the initial spectrum and Af is the final absorbance or
total area from the final spectrum. A control with support alone (without enzyme immobilization)
was carried out at the same conditions in order to determine the dye adsorption by the support.
For each assay duplicate runs were made.
Figure V. 2 – Initial dyes solutions and the coconut fiber.

Part V – Immobilization
173
V. 4 Results and Discussion
V. 4.1 Immobilization of commercial laccase on green coconut fiber by
adsorption
In this study the immobilization of commercial laccase using a simple, effective and
inexpensive process for the degradation of reactive textile dyes was studied. The effect of
enzyme concentration, pH and contact time between enzyme solution and coconut fiber on the
activity of immobilized commercial laccase was studied and optimized.
In order to determine the optimum commercial laccase concentration to be immobilized,
several experiments with the same amount of carrier and buffer were performed with initial
enzyme concentrations ranging from 0.008 to 0.26 g/mL at room temperature. Contact time
between the enzyme and the coconut fiber and pH were set at 3h30min. and 7.0, respectively.
The results are presented in Figure V. 3.
y = 2979.8x + 831.3
R2 = 0.9998
y = 17029x - 138.35
R2 = 0.988
0
200
400
600
800
1000
1200
1400
1600
1800
0 0.05 0.1 0.15 0.2 0.25 0.3
Initial commercial laccase concentration (g/mL)
Ac
tiv
ity
(U
/Kg
ca
rrie
r)
Figure V. 3 – Influence of initial enzyme concentration on the activity of the immobilized commercial
laccase on coconut fiber by adsorption at pH 7.0 and 3h30min. of contact time.
It can be seen that the activity of the immobilized laccase increases with the enzyme
concentration, however not always in a linear way. Two slopes are observed, with the first one,
for lower enzyme concentrations until 0.067 g/mL, steeper than the second one. According to
the literature (Arroyo et al., 1999; Blanco et al., 2004) enzyme adsorption is not restricted to a
monolayer on the support, and adsorption of secondary layers has been reported. Thus, the first
slope possibly corresponds to the formation of a monolayer of enzyme, while the second slope
corresponds to the binding of enzymes on top of the monolayer. A control experiment with fiber

Part V – Immobilization
174
without enzyme was also performed and no activity was found when only the fiber was used as
catalyst.
Recovered activity and immobilization yield were calculated, and results are listed in
Table V. 1. Recovered activity was maximum at the point of change of slope (0.067 g/mL), from
which begins to decrease (in a non-regular way). The maximum recovered activity at this point
suggests that probably at this concentration the enzyme molecules are immobilized at close
proximity to each other covering the entire support surface, thus preventing the enzyme
deactivation. In other words, when enzyme load was increased, more enzyme molecules were
immobilized and less area on the support is available for laccase to spread itself, which may
prevent loss in activity (de Oliveira et al., 2000). Above this concentration, probably a second
layer of commercial laccase was adsorbed on the first layer. Although more molecules were
immobilized on coconut fiber, not all of them were available to the substrate, causing decrease
in recovered activity. Coconut fiber surface does not have a porous structure, and it has a low
surface area. This poor surface area limits the number of enzyme molecules to be immobilized,
facilitating the multilayer adsorption of enzymes (Brígida et al., 2007). Immobilization yield
increases until an enzyme concentration of 0.033 g/mL, point from which starts to slowly
decrease (in a more regular way). With these results and taking into account the both values of
recovered activity and immobilization yield, the commercial laccase concentration of 0.067 g/mL
was selected to continue the studies, since it is the concentration that offers the best
relationship among the values of recovered activity and immobilization yield. From this enzyme
concentration (where the slope changes), no increase in recovered activity or immobilization
yield is observed, so there is no point on using higher initial enzyme concentrations.
Table V. 1 – Influence of initial enzyme concentration on recovered activity and immobilization yield.
Enzyme concentration (g/mL)
Recovered activity (%)
Immobilization yield (%)
0.008 11.0 3.3 0.017 4.2 43.3 0.033 6.7 45.2 0.067 12.0 37.5 0.13 7.4 37.2 0.26 9.6 23.3
The effect of pH was studied at pH values from 4.0 to 9.0. Enzyme concentration and
contact time between the support and the enzyme solution were set at 0.067 g/mL and
3h30min., respectively. The pH profiles of the free and the immobilized laccase are shown in
Figure V. 4. It can be clearly observed from Figure V. 4 b) that a maximum of immobilized
enzyme activity is reached at about pH 7.0, and for values lower or higher than 7.0 the activity
decreases. This optimum range is very similar to that observed for the soluble laccase (Figure
V. 4 a)) indicating that the immobilization procedure on green coconut fiber does not affect the

Part V – Immobilization
175
enzyme charge, which has also been reported in other studies (Kara et al., 2005; Wang et al.,
2008). Subtle changes in the activity/pH profiles have been reported on the immobilization of
enzymes to charged supports (Al-Adhami et al., 2002; Leontievsky et al., 2001).
Figure V. 4 – Effect of pH of the solution a) on initial commercial laccase activity and b) on the activity of
the immobilized commercial laccase on coconut fiber by adsorption at 0.067 g/mL of enzyme and
3h30min. of contact time.
Immobilization parameters, recovered activity and immobilization yield, were calculated
for all the range of pH studied. Table V. 2 shows that immobilization yield and recovered activity
were dependent on the pH of adsorption. Interactions between the molecule and its
environment influence the structure of an enzyme molecule and these interactions are pH-
dependent (Geluk et al., 1992). The best result for recovered activity (45.7 %) was achieved at
pH 5.0, value from which it starts to decrease. On the other hand, immobilization at pH 7.0
significantly improved the amount of immobilized enzyme (37.5 %). The commercial laccase
immobilization at pH 5.0 results in a high decrease in the immobilization yield. Thus, pH 7.0 was
chosen to continue the studies of optimization, as it represents the value where more enzyme
was immobilized and, despite of having a lower recovered activity, it corresponds to the highest
activity of immobilized enzyme (Figure V. 4 b)).
Table V. 2 – Influence of pH of the solution on recovered activity and immobilization yield.
pH Recovered activity (%) Immobilization yield (%)
4.0 31.9 10.8 5.0 45.7 13.3 6.0 24.5 16.8 7.0 12.0 37.5 8.0 18.2 20.1 9.0 14.0 29.4
0
500
1000
1500
2000
2500
3000
2.0 4.0 6.0 8.0 10.0
pH
Ac
itiv
ity
fre
e e
nzy
me
(U
/L)
0
200
400
600
800
1000
1200
2.0 4.0 6.0 8.0 10.0
pH
Ac
tiv
ity
(U
/kg
carr
ier)
(a) (b)

Part V – Immobilization
176
Finally, the influence of contact time between coconut fiber and commercial laccase
solution was evaluated at pH 7.0 and two different enzyme concentrations: 0.033 g/mL and
0.067 g/mL. The results are shown in Figure V. 5. Similar contact time profiles were achieved
for both enzyme concentrations studied. It was observed that commercial laccase immobilized
activity increases as time increased until 3h30min.. From 3h30min. till 5/6 hours no significant
changes in immobilized laccase activity were observed, but after this time the activity tends to
fall. Probably for longer contact times some enzyme desorption takes place or the enzyme
starts to adsorb at the second monolayer ceasing to have so available enzymes to react with
the substrate.
0
100
200
300
400
500
600
0 2 4 6 8 10
Contact time (h)
Ac
tiv
ity
(U
/kg
carr
ier)
Figure V. 5 – Effect of contact time on the activity of the immobilized commercial laccase on coconut fiber
by adsorption at pH 7.0 and at ● 0.033 g/mL and ■ 0.067 g/mL of enzyme.
These results can be confirmed by the recovered activity and immobilization yield
presented in Table V. 3. In both cases immobilization yield increased with the increase of
contact time once more till 5/6 hours, showing that there is no need to leave the support and the
enzyme solution in contact for longer periods. By the recovered activity that increases till
3h30min. and then starts to decrease, it is possible to conclude that there is no advantage in
leaving the enzyme solution in contact with the coconut fiber for longer times, since it does not
promote the immobilization. Although more molecules were immobilized on coconut fiber, not all
of them were available to the substrate, causing a decrease in recovered activity. So, this is a
way to avoid the formation of the second monolayer and the loss of enzyme activity.

Part V – Immobilization
177
Table V. 3 – Influence of contact time on recovered activity and immobilization yield for 0.033 g/mL and
0.067 g/mL of enzyme.
Contact Recovered activity (%) Immobilization yield (%)
time (h) 0.033 g/mL 0.067 g/mL 0.033 g/mL 0.067 g/mL
0.5 5.3 4.4 37.8 31.9
1.0 6.7 3.8 36.0 37.0
2.0 3.6 3.3 57.3 44.7
3.5 5.1 3.5 44.2 40.2
5.0 3.4 2.6 68.8 55.4
6.0 4.4 2.2 50.6 61.8
7.0 2.5 1.6 75.1 59.9
8.0 2.9 3.5 70.8 31.8
V. 4.2 Immobilized enzyme properties
V. 4.2.1 Thermal stability
The thermal stability is one of the most important features concerning the application of
the biocatalyst. Immobilization of an enzyme to a support often limits its freedom to undergo
drastic conformational changes and thus results in increased stability towards denaturation (Al-
Adhami et al., 2002; Leontievsky et al., 2001).
Thermal stability experiments were carried out with free and immobilized enzyme, which
were incubated at 60 ºC. The immobilized enzyme was obtained by contacting 0.067 g/mL of a
commercial laccase solution of pH 7.0 with the coconut fiber for 3h30min.. The thermal
deactivation model (Equation V. 1) was fitted to experimental data (Figure V. 6) and the model
parameters are listed in Table V. 4, for free and immobilized enzyme.
Table V. 4 – Kinetic parameters of thermal deactivation at 60ºC of free commercial laccase and
immobilized by adsorption on coconut fiber.
Enzyme k (h-1
) αααα t1/2 (h) F R2
free 34.8 0.026 0.02 1.0 0.998
immobilized 5.64 0.067 0.14 6.6 0.995
As it can be seen from the results in Table V. 4, the α values are quite small, indicating
that possibly these can be discarded. Therefore it is possible the use of simple exponential
decay model, that states the final activity of the enzyme as zero, as reported by many authors
on their researches (Longo and Combes, 1999; Santos et al., 2007). However, the final activity

Part V – Immobilization
178
of the enzyme observed is very small but not zero, then the correct formula to use is the
Equation V. 1, used in this work.
Figure V. 6 show that commercial laccase immobilization led to a significant stabilizing
effect towards heat denaturation at 60 ºC. The immobilized laccase was inactivated at a much
slower rate than that of the free form under the same conditions. After 5 minutes of incubation at
60 ºC the free enzyme shows a percentage of deactivation that the immobilized one shows only
after 1 hour of incubation.
Figure V. 6 – Thermal stability of (●) free and (♦) immobilized commercial laccase obtained by adsorption
at 60 ºC.
These results can be confirmed by the kinetic parameters of thermal deactivation
presented in Table V. 4. The half-life time (t1/2) is the period of time that takes for a substance
undergoing decay to decrease by half. The free enzyme has a half-life of 0.02 h whereas the
value for the immobilized one is 0.14 h, 6.6 times higher. This means that the free enzyme lost
50 % of the initial activity 6.6 times earlier than the immobilized one. This 6.6 value is exactly
the stabilization factor (F) which shows that the immobilization of commercial laccase on
coconut fiber promoted an improvement on thermal stability, as immobilized commercial laccase
is more stable than the free one at 60 ºC. The increased stability of immobilized laccase was
due to the restricted conformational mobility of the molecules following immobilization. Other
authors obtained similar results when immobilizing laccase on other supports (Arica et al., 2009;
D’Annibale et al., 2000; Leontievsky et al., 2001). The increased resistance to thermal
denaturation of laccase arising from immobilization would be an advantage for its industrial
application due to the high temperatures used in the industrial processes (Berrio et al., 2007;
D’Annibale et al., 1999).
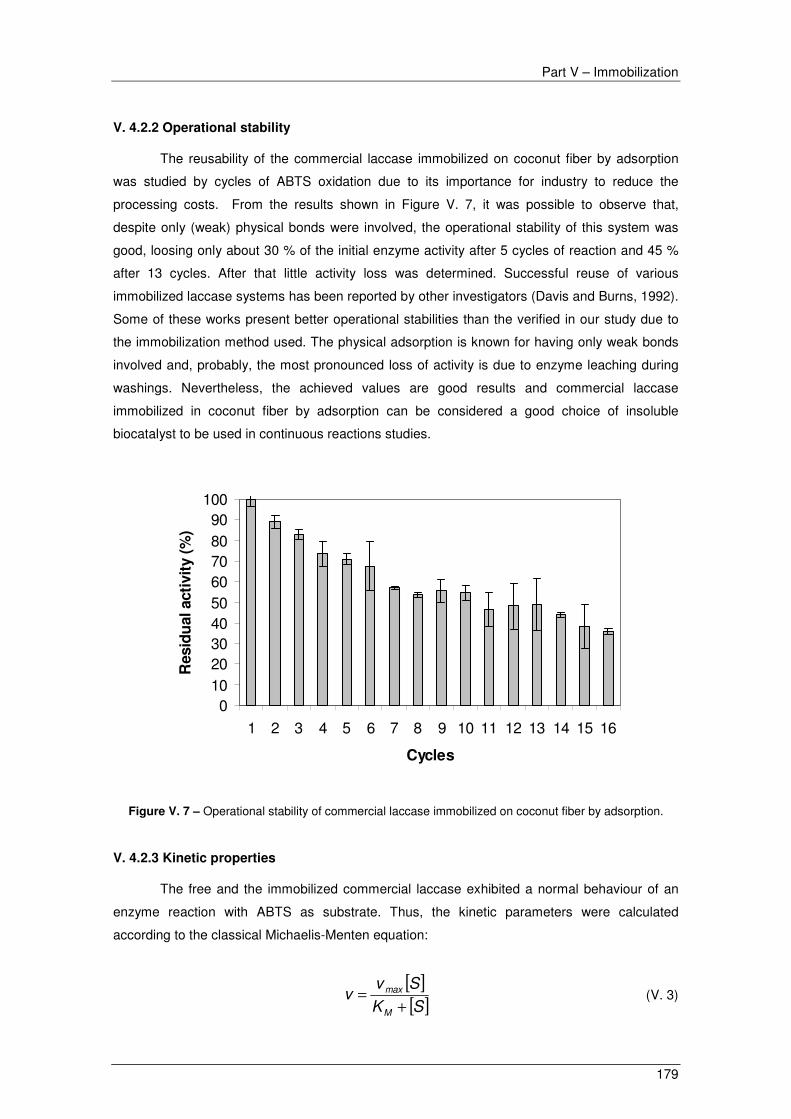
Part V – Immobilization
179
V. 4.2.2 Operational stability
The reusability of the commercial laccase immobilized on coconut fiber by adsorption
was studied by cycles of ABTS oxidation due to its importance for industry to reduce the
processing costs. From the results shown in Figure V. 7, it was possible to observe that,
despite only (weak) physical bonds were involved, the operational stability of this system was
good, loosing only about 30 % of the initial enzyme activity after 5 cycles of reaction and 45 %
after 13 cycles. After that little activity loss was determined. Successful reuse of various
immobilized laccase systems has been reported by other investigators (Davis and Burns, 1992).
Some of these works present better operational stabilities than the verified in our study due to
the immobilization method used. The physical adsorption is known for having only weak bonds
involved and, probably, the most pronounced loss of activity is due to enzyme leaching during
washings. Nevertheless, the achieved values are good results and commercial laccase
immobilized in coconut fiber by adsorption can be considered a good choice of insoluble
biocatalyst to be used in continuous reactions studies.
0102030405060708090
100
1 2 3 4 5 6 7 8 9 10 11 12 13 14 15 16
Cycles
Resid
ual acti
vit
y (
%)
Figure V. 7 – Operational stability of commercial laccase immobilized on coconut fiber by adsorption.
V. 4.2.3 Kinetic properties
The free and the immobilized commercial laccase exhibited a normal behaviour of an
enzyme reaction with ABTS as substrate. Thus, the kinetic parameters were calculated
according to the classical Michaelis-Menten equation:
[ ][ ]SK
Svv
M
max
+= (V. 3)
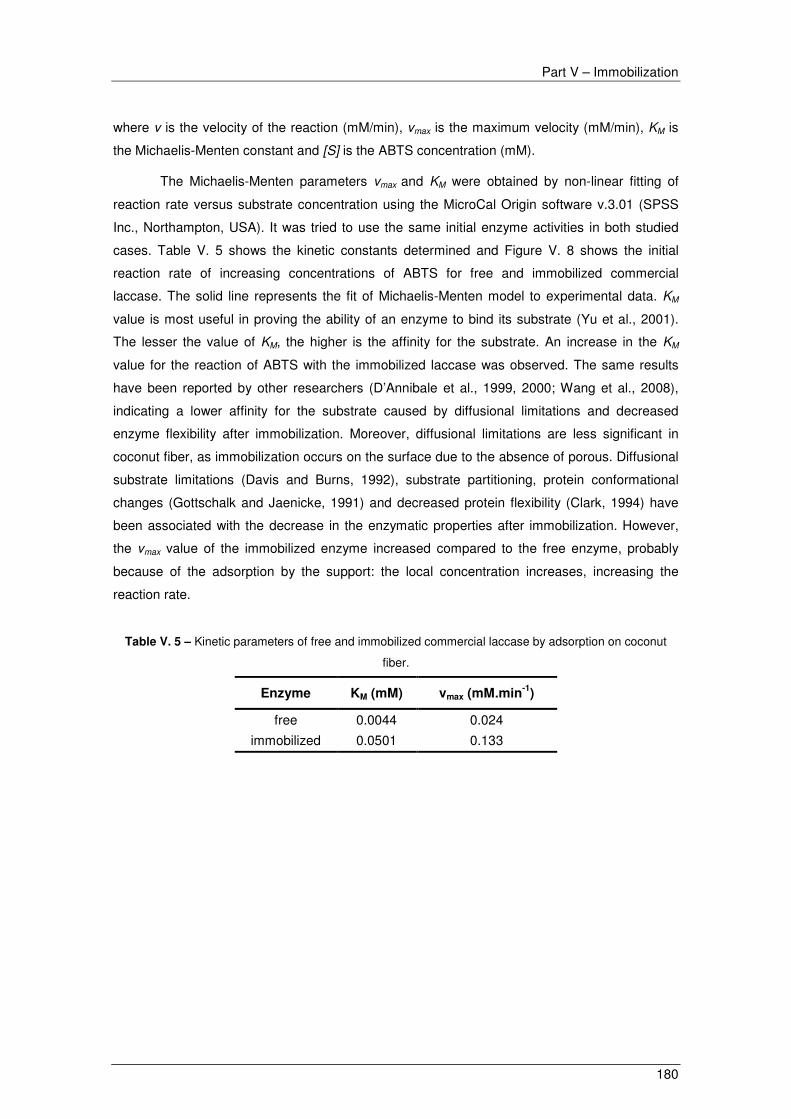
Part V – Immobilization
180
where v is the velocity of the reaction (mM/min), vmax is the maximum velocity (mM/min), KM is
the Michaelis-Menten constant and [S] is the ABTS concentration (mM).
The Michaelis-Menten parameters vmax and KM were obtained by non-linear fitting of
reaction rate versus substrate concentration using the MicroCal Origin software v.3.01 (SPSS
Inc., Northampton, USA). It was tried to use the same initial enzyme activities in both studied
cases. Table V. 5 shows the kinetic constants determined and Figure V. 8 shows the initial
reaction rate of increasing concentrations of ABTS for free and immobilized commercial
laccase. The solid line represents the fit of Michaelis-Menten model to experimental data. KM
value is most useful in proving the ability of an enzyme to bind its substrate (Yu et al., 2001).
The lesser the value of KM, the higher is the affinity for the substrate. An increase in the KM
value for the reaction of ABTS with the immobilized laccase was observed. The same results
have been reported by other researchers (D’Annibale et al., 1999, 2000; Wang et al., 2008),
indicating a lower affinity for the substrate caused by diffusional limitations and decreased
enzyme flexibility after immobilization. Moreover, diffusional limitations are less significant in
coconut fiber, as immobilization occurs on the surface due to the absence of porous. Diffusional
substrate limitations (Davis and Burns, 1992), substrate partitioning, protein conformational
changes (Gottschalk and Jaenicke, 1991) and decreased protein flexibility (Clark, 1994) have
been associated with the decrease in the enzymatic properties after immobilization. However,
the vmax value of the immobilized enzyme increased compared to the free enzyme, probably
because of the adsorption by the support: the local concentration increases, increasing the
reaction rate.
Table V. 5 – Kinetic parameters of free and immobilized commercial laccase by adsorption on coconut
fiber.
Enzyme KM (mM) vmax (mM.min-1
)
free 0.0044 0.024
immobilized 0.0501 0.133
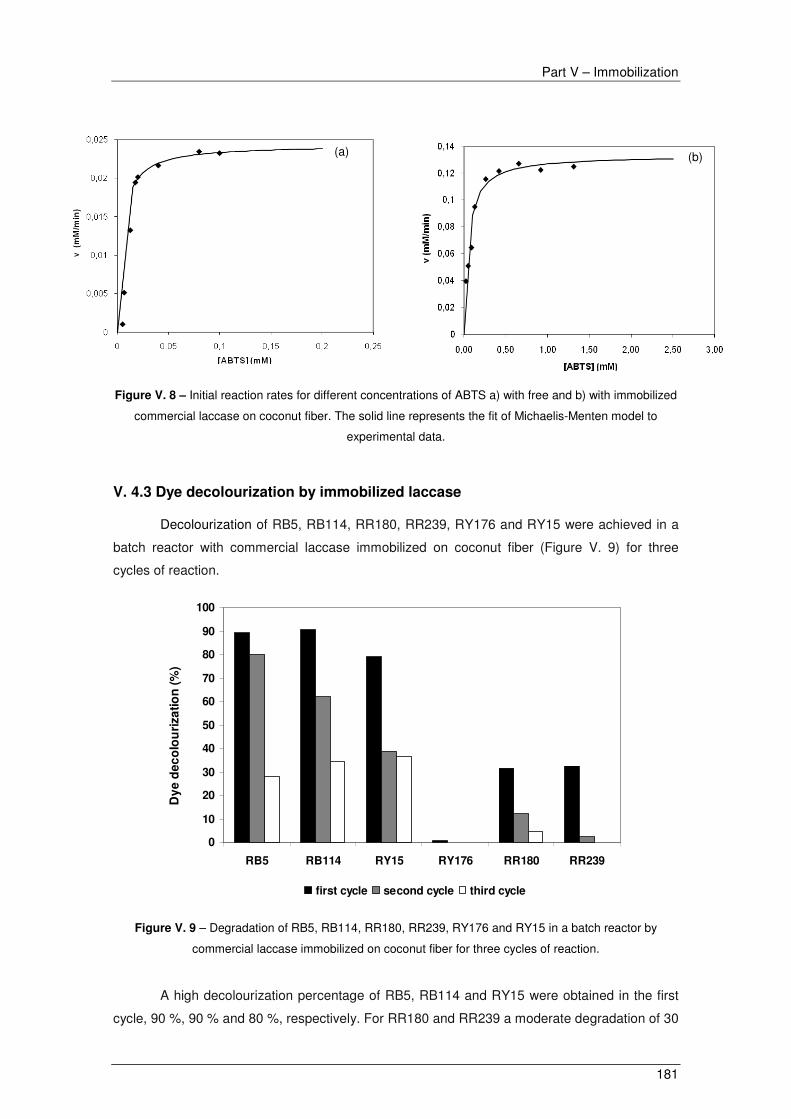
Part V – Immobilization
181
Figure V. 8 – Initial reaction rates for different concentrations of ABTS a) with free and b) with immobilized
commercial laccase on coconut fiber. The solid line represents the fit of Michaelis-Menten model to
experimental data.
V. 4.3 Dye decolourization by immobilized laccase
Decolourization of RB5, RB114, RR180, RR239, RY176 and RY15 were achieved in a
batch reactor with commercial laccase immobilized on coconut fiber (Figure V. 9) for three
cycles of reaction.
0
10
20
30
40
50
60
70
80
90
100
RB5 RB114 RY15 RY176 RR180 RR239
Dy
e d
ec
olo
uri
za
tio
n (
%)
first cycle second cycle third cycle
Figure V. 9 – Degradation of RB5, RB114, RR180, RR239, RY176 and RY15 in a batch reactor by
commercial laccase immobilized on coconut fiber for three cycles of reaction.
A high decolourization percentage of RB5, RB114 and RY15 were obtained in the first
cycle, 90 %, 90 % and 80 %, respectively. For RR180 and RR239 a moderate degradation of 30
(a) (b)

Part V – Immobilization
182
% was observed. No significant reduction of colour was observed for RY176. The second cycle
presented a good degradation for both RB5 (80 %) and RB114 (62 %), whilst RY15 shows a
significant decrease on the decolourization (39 %). A poor degradation for the third cycle was
observed. This tendency can be explained, when compared to ABTS oxidation cycles (Figure V.
7), by the laccase mediator. It is known that no mediator is necessary for ABTS reaction with
laccase. However, for most dyes and other phenolic compounds, a mediator is necessary to
complete the catalytic cycle with laccase (Husain and Husain, 2008; Tavares et al., 2008,
2009a). The laccase used in this study is a commercial formulation which includes a mediator.
The mediator probably is not being reoxidised, as occurs in a system with free enzyme. Thus,
after some time there is no longer available mediator to oxidize the dyes. Additionally, the
difference of dye decolourization percentage among the different dyes can be explained mainly
due to the different molecular structure of the dyes and different potential redox as observed in
an earlier study with free laccase (Tavares et al., 2009a).
When immobilized enzymes are used in decolourization studies the evaluation of the
adsorption capacity of the support is necessary. Generally, the colour removal is the result of
both enzymatic and adsorption processes. When an operation is carried out batchwise, the
overall extent of decolourization is strongly affected by the physical removal of the dye from the
liquid phase. Thus, another point that should be considered in this study is the colour removal
by the adsorption on the support. Many dye decolourization tests carried out with immobilized
laccase have showed that support adsorption presents a significant contribution to the colour
degradation (Kandelbauer et al., 2004; Peralta-Zamora et al., 2003; Zille et al., 2003). In order
to verify this tendency, a control experiment with dyes and support alone was carried out. The
adsorption of the dye by the support surface was around 40 % for RB114, 48 % for RY15, 23 %
for RB5, 4 % for RY176, 7 % for RR180 and no adsorption for RR239 was detected. These
results show that, depending on the dye, in the first cycle of the reaction with immobilized
laccase, a percentage of colour removal was due to adsorption of the dyes by the support. In
the next cycles, partial saturation of the support occurred and the contribution of laccase
increased. Using the supported laccase in experiments that involve the consecutive addition of
several dye samples the catalytic effect of the enzyme is evidenced, maybe due to the
progressive saturation of the active free-sites of the support. This was observed by Peralta-
Zamora et al. (2003) applying consecutive feeds to a batch system loaded with immobilized
laccases. Since the enzyme is only active in the presence of a mediator, they observed that, in
the absence of the mediator, the extent of decolourization in the consecutive dye additions
decreased as adsorption approached equilibrium; on the contrary, in the presence of the
mediator, the extent of decolourization during each cycle remained constant up to eight dye
additions. Comparing with dyes degradation (90 % for RB5, 90 % for RB114, 93 % for RY15, 96
% for RR239, 93 % for RR180 and 0 % for RY176) by free laccase (Cristóvão et al., 2008;
Tavares et al., 2009b), at the same conditions of dye concentration, temperature and agitation,
a considerable difference was observed. A decreased in all dyes degradation was observed

Part V – Immobilization
183
taking into account only the degradation by the immobilized laccase. This might be attributed to
the diffusional limitations and the loss of laccase activity during the immobilization process.
As most industrial effluents contains a mixture of dyes, this part of the study is important
in order to validate the applicability of the process. To our knowledge there is no study on
degradation of a mixture of dyes by an immobilize laccase. The Table V. 6 shows the
decolourization of a mixture of three dyes, RY15, RR239 and RB5, by the immobilized laccase
and by the adsorption. The degradation of the mixture was obtained from both corresponding
wavelength of each dye and the integration of the area of the all visible spectrum.
Table V. 6 - Dye mixture degradation (%) by immobilized laccase based on the absorbance peak at
maximum absorbance wavelength of each dye present in the mixture and on the area under all dye
absorbance spectrum range. It was taked into account the percentage of adsorption and of enzymatic
activity.
λλλλ (nm) Total dye
degradation (%)
Adsorption by the coconut
fiber (%)
Dye degradation by the immobilized
enzyme (%)
416 58 13 45
542 51 1.7 49
579 79 16 63
Area under all spectrum 54 0 54
When compared with a single dye, a decrease in dye degradation of the mixture was
observed. This probably occurs due to the competition between several compounds for the
active sites of the enzyme. Comparing the decolouration with free laccase (Cristóvão et al.,
2009), at the same conditions of dye concentration, temperature and agitation, a considerable
difference was also observed, a decrease in total decolouration of the mixture about 36 %, from
90 % (free enzyme) to 54 % (immobilized enzyme), was obtained with immobilized enzyme.
This might be also attributed to the diffusional limitations and the loss of laccase activity during
the immobilization process.
V. 5 Conclusions
Green coconut fiber was successfully used to immobilize commercial laccase by
adorption in the optimized conditions. A high decolourization percentage of practically all
reactive textile dyes in the first two cycles and a good dye mixture decolourization by the
immobilized enzyme were obtained. Despite the observed dye degradations are not higher than

Part V – Immobilization
184
those observed with free enzyme, the laccase immobilization allows enzyme reuse (with high
operational stabilities) and has been shown to improve its stability, which could be a potential
advantage in wastewater treatment. In addition, immobilization on green coconut fiber by
adsorption of commercial laccase DeniLite II S is a simple and inexpensive method with an
easily available support. This work may provide a basis for the development of suitable
biocatalysts for continuous colour removal from various industrial effluents at large scale.
V. 6 References
Akhtar, S., Khan, A., Husain, Q., 2005a. Partially purified bitter gourd (Momordica charantia) peroxidase catalyzed decolorization of textile and other industrially important dyes. Bioresource Technology, 96, 1804-1811.
Akhtar, S., Khan, A., Husain, Q., 2005b. Simultaneous purification and immobilization of bitter gourd (Momordica charantia) peroxidases on bioaffinity suport. Journal of Chemical Technology and Biotechnology, 80, 198-205.
Al-Adhami, A., Bryjak, J., Greb-Markiewicz, B., Peczynska-Czoch, W., 2002. Immobilization of wood-rotting fungi laccases on modified cellulose and acrylic carriers Process Biochemistry, 37, 1387-1394.
Alonso-Morales, N., Lopez-Gallego, F., Betancor, L., Hidalgo, A., Mateo, C., Fernandez-Lafuente, R., 2004. Reversible Immobilization of Glutaryl Acylase on Sepabeads Coated with Polyethyleneimine. Biotechnology Progress, 20, 533-536.
Ander, P., Messner, K., 1998. Oxidation of 1-hydroxybenzotriazole by laccase and lignin peroxidase. Biotechnology Techniques, 12, 191-195.
Anjaneyulu, Y., Sreedhara Chary, N., Samuel Suman Raj, D., 2005. Decolourization of Industrial Effluents – Available Methods and Emerging Technologies – A Review. Reviews in Environmental Science and Biotechnology, 4, 245-273.
Arica, M.Y., Altintas, B., Bayramoglu, G., 2009. Immobilization of laccase onto spacer-arm attached non-porous poly(GMA/EGDMA) beads: Application for textile dye degradation. Bioresource Technology, 100, 665-669.
Arroyo, M., Sánchez-Montero, J., Sinisterra, J., 1999. Thermal stabilization of immobilized lipase B from Candida antarctica on different supports: Effect of water activity on enzymatic activity in organic media - A practical procedure for organic chemists Enzyme and Microbial Technology, 24, 3-12.
Berrio, J., Plou, F.J., Ballesteros, A., MartÃ-nez, Ã.n.T., MartÃ-nez, M.a.J.s., 2007. Immobilization of pycnoporus coccineus laccase on Eupergit C: Stabilization and treatment of olive oil mill wastewaters. Biocatalysis and Biotransformation, 25, 130 - 134.
Blanco, R.M., Terreros, P., Fernández-Pérez, M., Otero, C., Díaz-González, G., 2004. Functionalization of mesoporous silica for lipase immobilization: Characterization of the support and the catalysts. Journal of Molecular Catalysis B: Enzymatic, 30, 83-93.
Bornscheuer, U., 2003. Immobilizing enzymes: how to create more suitable biocatalysts Angewandte Chemie International Edition English, 43, 3336-3337.
Brígida, A., Pinheiro, Á., Ferreira, A., Pinto, G., Gonçalves, L., 2007. Immobilization of Candida antarctica lipase B by covalent attachment to green coconut fiber. Applied Biochemistry and Biotechnology, 137-140, 67-80.
Cao, L., 2005. Immobilised enzymes: science or art? Current Opinion in Chemical Biology, 9, 217-226.
Casas, N., Blanquez, P., Gabarrell, X., Vicent, T., Caminal, G., Sarra, M., 2007. Degradation of orange G by laccase: Fungal versus enzymatic process. Environmental Technology, 28, 1103-1110.
Champagne, P.-P., Ramsay, J.A., 2005. Contribution of manganese peroxidase and laccase to dye decoloration by Trametes versicolor. Appl Microbiol Biotechnol, 69, 276-285.
Champagne, P.P., Ramsay, J.A., 2007. Reactive blue 19 decolouration by laccase immobilized on silica beads. Applied Microbiology and Biotechnology, 77, 819-823.

Part V – Immobilization
185
Clark, D.S., 1994. Can immobilization be exploited to modify enzyme activity? TRENDS in Biotechnology, 12, 439-443.
Claus, H., 2004. Laccases: structure, reactions, distribution. Micron, 35, 93-96.
Couto, S.R., Rosales, E., Sanromán, M.A., 2006. Decolourization of synthetic dyes by Trametes hirsuta in expanded-bed reactors. Chemosphere, 62, 1558-1563.
Cristóvão, R.O., Tavares, A.P.M., Ribeiro, A.S., Loureiro, J.M., Boaventura, R.A.R., Macedo, E.A., 2008. Kinetic modelling and simulation of laccase catalyzed degradation of reactive textile dyes. Bioresource Technology, 99, 4768-4774.
Cristóvão, R.O., Tavares, A.P.M., Ferreira, L.A., Loureiro, J.M., Boaventura, R.A.R., Macedo, E.A., 2009. Modeling the discoloration of a mixture of reactive textile dyes by commercial laccase. Bioresource Technology, 100, 1094-1099.
D'Annibale, A., Rita Stazi, S., Vinciguerra, V., Di Mattia, E., Giovannozzi Sermanni, G., 1999. Characterization of immobilized laccase from Lentinula edodes and its use in olive-mill wastewater treatment. Process Biochemistry, 34, 697-706.
D'Annibale, A., Stazi, S.R., Vinciguerra, V., Giovannozzi Sermanni, G., 2000. Oxirane-immobilized Lentinula edodes laccase: stability and phenolics removal efficiency in olive mill wastewater. Journal of Biotechnology, 77, 265-273.
Davis, S., Burns, R.G., 1992. Covalent immobilization of laccase on activated carbon for phenolic effluent treatment. Applied Microbiology and Biotechnology, 37, 474-479.
de Oliveira, P.C., Alves, G.M., de Castro, H.F., 2000. Immobilisation studies and catalytic properties of microbial lipase onto styrene-divinylbenzene copolymer. Biochemical Engineering Journal, 5, 63-71.
Duran, N., Esposito, E., 2000. Potential applications of oxidative enzymes and phenoloxidase-like compounds in wastewater and soil treatment: a review. Applied Catalysis B-Environmental, 28, 83-99.
Durán, N., Rosa, M.A., D'Annibale, A., Gianfreda, L., 2002. Applications of laccases and tyrosinases (phenoloxidases) immobilized on different supports: a review. Enzyme and Microbial Technology, 31, 907-931.
Dyal, A., Loos, K., Noto, M., Chang, S., Spagnoli, C., Shafi, K., Ulman, A., Cowman, M., Gross, R., 2003. Activity of Candida rugosa lipase immobilized on gamma-Fe2O3 magnetic nanoparticles. Journal of the American Chemical Society, 125, 1684-1685.
Forgacs, E., Cserháti, T., Oros, G., 2004. Removal of synthetic dyes from wastewaters: a review. Environment International, 30, 953-971.
Geluk, M.A., Norde, W., Van Kalsbeek, H.K.A.I., Van't Riet, K., 1992. Adsorption of lipase from Candida rugosa on cellulose and its influence on lipolytic activity. Enzyme and Microbial Technology, 14, 748-754.
Gottschalk, N., Jaenicke, R., 1991. Authenticity and reconstitution of immobilized enzymes: characterization and denaturation/renaturation of glucoamylase II. Biotechnology and Applied Biochemistry, 14, 324-335.
Husain, M., Husain, Q., 2008. Applications of redox mediators in the treatment of organic pollutants by using oxidoreductive enzymes: A review. Critical Reviews in Environmental Science and Technology, 38, 1-42.
Kandelbauer, A., Maute, O., Kessler, R.W., Erlacher, A., Gubitz, G.M., 2004. Study of dye decolorization in an immobilized laccase enzyme-reactor using online spectroscopy. Biotechnology and Bioengineering, 87, 552-563.
Kara, A., Osman, B., Yavuz, H., Besirli, N., Denizli, A., 2005. Immobilization of alfa amylase on Cu2+ chelated poly(ethylene glycol dimethacrylate-n-vinyl imidazole) matrix via adsorption. Reactive and Functional Polymers, 62, 61-68.
Kennedy, J., White, C., Melo, E., 1988. The immobilization of enzymes and cells. Chimica Oggi, 5, 21-29.
Khan, A., Akhtar, S., Husain, Q., 2005. Simultaneous purification and immobilization of mushroom tyrosinase on immunoaffinity support. Process Biochemistry, 40, 2379-2386.
Kulshrestha, Y., Husain, Q., 2006. Bioaffinity-based an inexpensive and high yield procedure for the immobilization of turnip (Brassica rapa) peroxidase. Biomolecular Engineering, 23, 291-297.
Leontievsky, Leontievsky, A., Myasoedova, Myasoedova, N., Baskunov, Baskunov, B., Golovleva, Golovleva, L., Bucke, Bucke, C., Evans, Evans, C., 2001. Transformation of 2,4,6-trichlorophenol by free and immobilized fungal laccase. Applied Microbiology and Biotechnology, 57, 85-91.
Lewis, D., 1999. Coloration in the next century. Review of Progress in Coloration, 29, 23-28.

Part V – Immobilization
186
Longo, M., A., Combes, D., 1999. Thermostability of modified enzymes: a detailed study. Journal of Chemical Technology & Biotechnology, 74, 25-32.
Mislovicova, D., Gemeiner, P., Sandula, J., Masarova, J., Vikartovska, A., Doloomansky, P., 2000. Examination of bioaffinity immobilization by precipitation of mannan and mannan-containing enzymes with legume lectins. Biotechnology and Applied Biochemistry, 31, 153-159.
Peralta-Zamora, P., Pereira, C.M., Tiburtius, E.R.L., Moraes, S.G., Rosa, M.A., Minussi, R.C., Duran, N., 2003. Decolorization of reactive dyes by immobilized laccase. Applied Catalysis B-Environmental, 42, 131-144.
Santos, A.M.P., Oliveira, M.G., Maugeri, F., 2007. Modelling thermal stability and activity of free and immobilized enzymes as a novel tool for enzyme reactor design. Bioresource Technology, 98, 3142-3148.
Sari, M., Akgol, S., Karatas, M., Denizli, A., 2006. Reversible immobilization of catalase by metal chelate affinity interaction on magnetic beads. Industrial & Engineering Chemistry Research, 45, 3036-3043.
Slokar, Y.M., Marechal, A.M.L., 1998. Methods of Decoloration of Textile Wastewaters. Dyes and Pigments, 37, 335-356.
Tavares, A.P.M., Cristóvão, R.O., Loureiro, J.M., Boaventura, R.A.R., Macedo, E.A., 2008. Optimisation of reactive textile dyes degradation by laccase-mediator system. Journal of Chemical Technology and Biotechnology, 83, 1609-1615.
Tavares, A.P.M., Cristóvão, R.O., Gamelas, J.A.F., Loureiro, J.M., Boaventura, R.A.R., Macedo, E.A., 2009a. Sequential decolourization of reactive textile dyes by laccase mediator system. Journal of Chemical Technology and Biotechnology, 84, 442-446.
Tavares, A.P.M., Cristóvão, R.O., Loureiro, J.M., Boaventura, R.A.R., Macedo, E.A., 2009b. Application of statistical experimental methodology to optimize reactive dye decolourization by commercial laccase. Journal of Hazardous Materials, 162, 1255-1260.
Thurston, C.F., 1994. The structure and function of fungal laccases. Microbiology, 140, 19-26.
Wang, F., Guo, C., Liu, H., Liu, C., 2008. Immobilization of Pycnoporus sanguineus laccase by metal affinity adsorption on magnetic chelator particles. Journal of Chemical Technology and Biotechnology, 83, 97-104.
Yu, J., Wang, X.W., Yue, P.L., 2001. Optimal decolorization and kinetic modeling of synthetic dyes by Pseudomonas strains. Water Research, 35, 3579-3586.
Zille, A., Tzanov, T., Gubitz, G.M., Cavaco-Paulo, A., 2003. Immobilized laccase for decolourization of Reactive Black 5 dyeing effluent. Biotechnology Letters, 25, 1473-1477.
Part VI
Supercritical Carbon Dioxide Media


In part VI the degradation of the reactive textile dyes by commercial laccase in
supercritical carbon dioxide media is investigated. The operational conditions are optimized by
experimental design combined with response surface methodology.


Part VI Optimization of laccase catalyzed
degradation of reactive textile dyes in
supercritical carbon dioxide media by
response surface methodology*
VI. 1 Abstract
VI. 2 Introduction
VI. 3 Materials and Methods
VI. 4 Results and Discussion
VI. 5 Conclusions
VI. 6 References
*based on: Cristóvão, R., Amaral, P., Tavares, A., Coelho, M., Cammarota, M., Loureiro, J., Boaventura, R., Macedo, E., Pessoa, F., 2010. Optimization of laccase catalyzed degradation of reactive textile dyes in supercritical carbon dioxide media by response surface methodology. Reaction Kinetics, Mechanisms and Catalysis, 99, 311-323


Part VI – Supercritical Carbon Dioxide Media
193
VI Optimization of laccase catalyzed degradation of reactive
textile dyes in supercritical carbon dioxide media by response
surface methodology
VI. 1 Abstract
In this work, the laccase catalyzed degradation of reactive textile dyes was studied in
supercritical carbon dioxide media. A two level Box–Behnken factorial design with two factors
and response surface methodology (RSM) were performed to investigate and optimize the
effects of pressure and temperature on reactive red 239 (RR239), reactive yellow 15 (RY15)
and reactive black 5 (RB5) dye degradations by commercial laccase in supercritical carbon
dioxide media. Mathematical models were developed for each dye showing the effect of each
factor and their interactions on colour removal. Pressure and the interaction between
temperature and pressure were the main factors affecting the decolourization. The optimum
conditions for RB5 and RY15 were found to be high pressure values (>120 bar), whilst
temperature presented low effect on their degradation at these pressures. For RR239, both
variables influenced the decolourization and the optimum conditions appear to be at low values
of pressure and high values of temperature.
VI. 2 Introduction
The use of supercritical fluids as nonaqueous solvents for enzyme-catalyzed reactions
has been an innovative area of research for the last times (Cantone et al., 2007; Habulin et al.,
2008a; Hammond et al., 1985; Palocci et al., 2008; Randolph et al., 1985). Many substrates as
well as many reaction products have low solubility in water, making biocatalyzed reactions
difficult to employ in aqueous phase. By using enzymes in nonaqueous solvents, it is possible to
overcome this barrier, but their uses in organic solvents have been limited by relatively low
catalytic activity observed when compared to reactions in water (Celia et al., 2005). Therefore,
in addition to ongoing research in solvent free systems, synthesis in supercritical fluids can be
potentially preferred as a new alternative to enzyme catalyzed reactions.
The ability to manipulate the physical properties of the solvent by simply changing the
pressure or temperature is unique to supercritical systems (Erickson et al., 1990; Nakamura et
al., 1990). Therefore, supercritical fluids are attractive media to perform and, more importantly,
control biocatalytic reactions.
Actually, an increasing number of works was reported on the basic studies relating to
supercritical fluid dyeing (SFD) such as dyes solubility measurements (Kim et al., 2006). The
use of dyes in supercritical media has been directed as a new concept of dyeing to replace the

Part VI – Supercritical Carbon Dioxide Media
194
traditional wet dyeing process (Jun et al., 2004; Montero et al., 2000). The traditional dyeing
processes cause environmental problems such as water pollution due to the inevitable use of
an excess amount of water and the discharge of unfixed dyes and various chemical additives.
However, few studies about the treatment of textile effluents in supercritical fluids have been
published. Conventional methods of textile wastewater treatment include adsorption,
coagulation/flocculation, electrochemical methods, membrane separation, ozonization and
biological oxidation. The disadvantages of some of these treatments are the potential toxicity of
dyes and their degradation products, especially the suspected carcinogenicity of potential
intermediate products. Supercritical treatment shows to be a promising clean technology for
efficient decontamination of many aqueous organic wastes like textile wastes. The oxidation of
organic compounds contained in aqueous waste effluents is carried out in supercritical water.
Future applications are also foreseen in supercritical CO2 oxidation to treat contaminated
effluents (Schmieder and Abeln, 1999).
In enzymatic catalysis, the supercritical fluid carbon dioxide has been used in benefit of
making the enzyme reactions greener, because of being a natural, unregulated solvent, with low
cost and low toxicity, non-flammability and high availability (Braker and Mossman, 1980;
Habulin et al., 2008a). Apart from being non-toxic, easily available and cheap, many enzymes
proven to be stable and active in it (Primo et al., 2007). Besides, carbon dioxide offers
possibilities to reduce the reactor volumes to a great extent and to accelerate enzymatic
processes (Hauthal, 2001). The gaslike diffusivities and low viscosities enhance mass transfer
rates of reactants to the active sites on enzymes dispersed in supercritical fluids. Reactions
which are limited by the rates of diffusion, rather than intrinsic kinetics, will proceed faster in
supercritical fluids than in liquids (Cantone et al., 2007).
Many industrial applications are hindered by the obstacle that high-pressure equipment
can be quite costly. Despite this difficulty, the attraction of combining natural catalysts with
green solvents has been the driving force behind a growing body of literature concerning the
stability, activity, and specificity of enzymes in supercritical carbon dioxide (Martym et al., 1990).
Recent studies have shown that fungi or their enzymes are able to decolourize and
detoxify industrial dyes (Amaral et al., 2004; Cristóvão et al., 2008; Romero et al., 2006;
Tavares et al., 2008). Enzyme methods applied in dye degradation have low energy costs, are
easy to control and have low impact on ecosystems. Laccase (benzendiol:oxygen
oxidoreductase, EC 1.10.3.2) has been studied in the oxidation of textile dyes. Studies have
shown that the range of substrate specificity of laccases can be extended to non-phenolic
substrates by the addition of redox mediators (Tauber et al., 2005; Tavares et al., 2009a).
Although the enzymatic treatment presents good results in concern with dye decolourization
(above 90% degradation), toxic dye degradation products can be formed (Tauber et al., 2005).
These products can also be more toxic than the pollutant. In order to avoid this, the treatment
with supercritical carbon dioxide was studied as an alternative solvent for enzymatic synthesis,

Part VI – Supercritical Carbon Dioxide Media
195
as it is known to leave no residues in the products and to be easy to separate of the unreacted
substances (Celebi et al., 2007; Habulin et al., 2008b; Palocci et al., 2008).
In this study parameters such as temperature and pressure were examined to optimize
the reactive textile dye degradation in supercritical medium. For this purpose, a two-level Box–
Behnken full factorial design coupled with RSM was employed to maximize the decolourization
of three reactive textile dyes, reactive black 5 (RB5), reactive yellow 15 (RY15) and reactive red
239 (RR239) by commercial laccase in supercritical carbon dioxide medium.
VI. 3 Materials and Methods
VI. 3.1 Chemicals and enzyme
Textile dyes: Reactive yellow 15 (Remazol Yellow GR), reactive red 239 (Remazol
Brilliant Red 3BS) and reactive black 5 (Remazol Black B) were kindly provided by DyStar
(Porto, Portugal).
Enzyme: Commercial laccase formulation (DeniLite II S; 120 U/g) from genetically
modified Aspergillus was kindly provided by Novozymes (Germany). This formulation is used for
indigo dye decolourization in denim finishing operations and includes a buffer and an enzyme
mediator.
VI. 3.2 Factorial design for dye decolourization in supercritical media
The response surface methodology (RSM) is a collection of statistical and mathematical
techniques useful for developing, improving and optimizing processes. Additionally, the factors
that influence the experiments are identified, optimized and possible synergic or antagonistic
interactions that may exist between factors can be evaluated (Box et al., 1978). The accuracy of
the models generated is evaluated by the coefficient of determination R2. RSM is a multivariate
technique that mathematically fits the experimental domain studied in the theoretical design
through a response function.
A 22 Box–Behnken full factorial design, including one replicate at the central point, was
carried out in order to study the factors (temperature and pressure) that influence the
decolourization of reactive textile dyes by commercial laccase in supercritical carbon dioxide
media (Table VI. 1). The factors temperature and pressure were chosen since they are known
to be important parameters for synthesis of chemical compounds in supercritical carbon dioxide
medium (Hartmann et al., 2001; Lin et al., 2006; Razei et al., 2007), and once the other
parameters such as pH and enzyme concentration had been optimized in aqueous medium and
we wanted to use the same values. On the basis of preliminary experiments, the values of
temperature and pressure were defined taking into consideration the dyes degradation by
enzyme laccase in aqueous medium (Cristóvão et al., 2008; Tavares et al., 2009b). Therefore,
the ranges of temperature and pressure were: 30 to 50 ºC and 60 to 120 bar, respectively. It is

Part VI – Supercritical Carbon Dioxide Media
196
important to point out that carbon dioxide is a near critical fluid at 30 ºC and 60 bar, once its
critical temperature and pressure are 31 ºC and 73.8 bar, respectively.
This design establish both linear and quadratic models determining their accuracies by
comparing lacks of fit of model predictions to experimental points with experimental error
estimated from replicates at the central point. Table VI. 1 gives the range and the levels of the
variables investigated and the experimental design. The experimental Box–Behnken design,
analysis of variance (ANOVA) and 3D response surface were carried out using the software
Statistica v.5.1 (Statsoft Inc.). Equation VI. 1 describes the regression model of the present
system, which includes the interaction term:
Ŷŷ = β0 + β1x1+β2x2 + β12x1x2 (VI. 1)
where Yˆyˆ is the predicted response, i.e. the colour removal; x1 and x2 are the coded levels of
the independent factors pressure and temperature, respectively. The regression coefficients
are: β0 the intercept term; β1 and β2 the coefficients for linear effects and β12 the coefficient for
interaction effects. The model evaluates the effect of each independent factor on the response.
VI. 3.3 Dye decolourization experiments
The laccase catalyzed degradation of reactive black 5, reactive yellow 15 and reactive
red 239 was performed in a supercritical fluid medium batch reactor. The system consisted of a
high-pressure syringe pump, a reactor, a controller unit and an adjustable flow rate restrictor.
Experiments were carried out with 50 mg/L of each dye and 432 U/L of commercial laccase
dissolved in 40 mL of phosphate buffer (50 mM, pH = 7.0) with a total volume of 50 mL. Cooled
carbon dioxide was fed into the high-pressure reactor, pressurized at the desired target
pressure by the syringe pump and heated to the reaction temperature, with a stirring rate of 320
rpm. This step was quite fast, so the conversion degree was ignored during it. The experiments
lasted for 2 hours after the temperature and pressure were stable. The starting point of the
reaction was assumed to be when both the pressure and temperature of the system reached
the abovementioned values. The conditions were chosen by the previously optimum conditions
determined by the studies in aqueous medium (Cristóvão et al., 2008; Tavares et al., 2009b).
VI. 3.4 Determination of dye decolourization
Dye decolourization by laccase was determined by monitoring the decrease in the
absorbance peak at the maximum wavelength (peak) for each dye: reactive yellow 15 (416 nm),
reactive red 239 (542 nm) and reactive black 5 (579 nm). A UV-visible spectrophotometer (Hach
DR/4000 UV) was used in all experiments. Decolourization is reported as: % decolourization =
(Ai - Af)/Ai x 100, where Ai is the initial absorbance and Af is the final absorbance.

Part VI – Supercritical Carbon Dioxide Media
197
VI. 4 Results and Discussion
VI. 4.1 Experimental design
In order to optimize the dye degradation conditions, Box–Behnken full factorial design
with two factors (pressure and temperature) was chosen. The levels of the factors and the
results from the 5 experiments for each dye are presented in Table VI. 1. The dye
decolourization results calculated by the models (Equations VI. 2 – VI. 4), at each experimental
point, are also presented in Table VI. 1. The optimum operating conditions for each dye can be
predicted from the second-order polynomial function.
Using the experimental data, the second order polynomial model was fitted to
decolourization results of RB5, RR239 and RY15 and obtained in terms of coded factors:
Ŷŷ (RB5) = 49.2 + 0.16x1 – 0.10x2 + 0.003x1x2 (VI. 2)
Ŷŷ (RR239) = 64.5 + 0.70x1 + 1.91x2 – 0.019x1x2 (VI. 3)
Ŷŷ (RY15) = 42.5 + 1.05x1 + 2.30x2 – 0.021x1x2 (VI. 4)
Table VI. 1 – Comparison between experimental data and calculated values for RB5, RR239 and RY15
decolourization.
Runs
Factors Dye degradation (%)
x1
pressure (bar)
x2
temperature
(ºC)
RB5 RR239 RY15
Actual Value
Calculated Value
Actual Value
Calculated Value
Actual Value
Calculated Value
1 60 30 59.94 60.60 0 0.35 51.54 51.30
2 60 50 61.19 61.85 15.39 15.75 72.05 71.82
3 120 30 74.21 74.87 7.46 7.82 76.31 76.08
4 120 50 78.61 79.27 0 0.35 71.31 71.08
5 90 40 71.79 69.15 7.47 6.07 66.64 67.57
The Pareto chart displays the statistically relevant effect of each factor on the response
and it is a practical mode to view the results. These are sorted from the largest to the smallest,
and the effects to the right of the divisor line are considered statistically significant. From Figure
VI. 1, it is possible to observe that there is no significant effect for RB5, all the effects are to the
left of the divisor line corresponding to a p value of 0.1. For RR239 the only significant effect
was the interaction between both factors (pressure and temperature), but for RY15 all the
factors were significant, although the temperature had a much smaller influence.

Part VI – Supercritical Carbon Dioxide Media
198
Figure VI. 1 – Pareto chart of standardized effects for 22 Box-Behnken factorial design for (a) RB5, (b)
RR239 and (c) RY15 degradation. (1) pressure; (2) temperature.
(a)
(b)
(c)

Part VI – Supercritical Carbon Dioxide Media
199
The statistical significance of the polynomial model for the experimental responses
(Table VI. 1) was evaluated by analysis of variance (ANOVA). According to the ANOVA results
(Table VI. 2), the models present high determination coefficients (R2): 0.937, 0.985 and 0.997
for the degradation of RB5, RR239 and RY15, respectively. These results indicate that the
accuracy of fitting of the polynomial models was good. The values of adjusted determination
coefficients R2adj are also high to advocate for high significances of the models. The results
showed that the experimental values were significantly in agreement with the calculated values
and also suggested that the models (Equations VI. 2 – VI. 4) were satisfactory and accurate
(Figure VI. 2).
Table VI. 2 – Analysis of variance (ANOVA) for the fitted quadratic polynomial models of RB5, RR239 and
RY15 decolourization.
Source Sum of squares (SS)
dfa
Mean Square (MS) F-value p-value
RB5 RR239 RY15 RB5 RR239 RY15 RB5 RR239 RY15 RB5 RR239 RY15
x1 250.9 15.7 144.4 1 250.9 15.7 144.4 28.8 6.35 133.5 0.117 0.24 0.055
x2 7.96 15.7 60.2 1 7.96 15.7 60.2 0.913 6.35 55.6 0.514 0.24 0.085
x1 by x2 2.49 130.6 162.8 1 2.49 130.6 162.8 0.286 52.8 150.5 0.687 0.087 0.052
Error 8.71 2.47 1.08 1 8.71 2.47 1.08
Total SS 270.1 164.5 368.5 4
dfa: degrees of freedom
RB5: R2 = 0.938; R2adj = 0.871
RR239: R2 = 0.985; R2adj = 0.940
RY15: R2 = 0.997; R2adj = 0.988
The significance of each coefficient was determined through a p value test, considering
90 % of confidence, in which low p values (p<0.1) indicate a high significance of the
corresponding coefficient. It was possible to observe by the analysis of variance (Table VI. 2)
that the interaction between both factors and the pressure were the factors that influenced most
the degradations, since they presented the lowest values of p. The variable temperature was
shown to be almost statistically insignificant.

Part VI – Supercritical Carbon Dioxide Media
200
Figure VI. 2 – Observed vs predicted values in the degradation of (a) RB5, (b) RR239 and (c) RY15 in
supercritical carbon dioxide. + observed; − predicted.
(a)
(b)
(c)

Part VI – Supercritical Carbon Dioxide Media
201
Using RSM, the effects of the independent factors (pressure and temperature) and their
interaction on the dyes decolourization are represented, the response can be predicted and the
optimum values of decolourization can be determined. The response surface plots (Figure VI. 3)
show the decolourization in supercritical medium of RB5, RR239 and RY15 as function of the
two factors.
Figure VI. 3a represents the response surface for RB5 decolourization. The surface plot
shows the increase in dye degradation with increasing pressure values. The plot clearly shows
that the decolourization of this dye in supercritical carbon dioxide was sensitive to small
pressure variations. The temperature slightly influenced the decolourization. This influence is a
little clearer for higher values of pressure. So, the degradation (>80 %) seems to increase with
the increase of both factors.
The response surface plot of RR239 degradation is presented in Figure VI. 3b. From the
results, it can be observed that this dye does not present a very consistent behaviour. At low
pressures it seems that the degradation increases with the increase of temperature but for high
pressures, despite being less pronounced, the opposite happens. So, it seems that the
maximum decolourization of RR239 (>15 %) is given by the increase of temperature and by the
decrease of pressure. However, it should be considered that it is not possible to work at
temperatures much higher than that studied, because it can deactivate the enzyme.
Nevertheless, it does not seem possible to attain large percentages of degradation of this dye
with this method. From previous studies in aqueous medium, the red dye was also the most
difficult dye to degrade (Cristóvão et al., 2008). The degradation of each dye depends on the
redox potentials of each substance (Tavares et al., 2009a). The RR239 is the dye with the
highest redox potential, thus being the most difficult dye to degrade.
Finally, the response surface plot of RY15 degradation is presented in Figure VI. 3c. For
this dye it is evident that the degradation increases with the increase of pressure and
temperature. The degradation is low for low values of both variables. But at low pressures,
when the temperature increases, the dye degradation starts to increase as well, and the same
happens at low temperatures when the pressure increases, leading to degradations above 76%.
At high pressures the temperature influences almost nothing the dye degradation and vice
versa. For this dye the variables present almost the same influence in the degradation, despite
pressure being the variable that influences a little more.
By Figure VI. 3 it is possible to observe that the response surface plots of all the three
dyes were very different, which we think that could be explained by the structure and by the
redox potential of each dye. The dyes present very different structures, with many different
bonds, what influences each dye degradation by the laccase-mediator system. After studying
the potential redox of the enzyme and of each dye studied (Tavares et al., 2009a), it is possible
to conclude that the degradation is strongly influenced by the potential redox of each substance,
leading to the different response surface plots. The lesser the value of the redox potential of the
dye, the larger is the degradation by the enzyme laccase.

Part VI – Supercritical Carbon Dioxide Media
202
Figure VI. 3 - Response surface plot for decolourization of (a) RB5 (b) RR239 and (c) RY15 in supercritical
carbon dioxide as a function of pressure and temperature.
(a)
(b)
(c)

Part VI – Supercritical Carbon Dioxide Media
203
The results presented show that pressure was the most relevant factor for the
decolourization of the three dyes in supercritical medium. As is known supercritical fluids are
compressible. A small change in pressure is accompanied by a dramatic change in density,
thus altering the physical properties of the supercritical fluid. Since the properties of the fluid
may modulate the enzyme properties suspended therein, the effect of pressure on enzyme-
catalyzed reactions in supercritical fluids is probably an important factor (Mesiano et al., 1999).
Ikushima et al. (1995) reported that pressure could induce modification of both structure and
function of enzyme particles leading to a change in the enzyme activity. The interactions
between carbon dioxide and enzyme molecules, in the near critical region, are increased and
enabled to stimulate conformational changes in the enzyme, even though their role during the
catalytic step is not yet well understood.
DeniLite II S is a commercial laccase with great potential to decolourize textile dyes.
There are few studies regarding the use of this enzyme on the treatment of effluents containing
dyes, especially with reactive dyes (Cristóvão et al., 2008; Soares et al., 2002; Tavares et al.,
2009b). Some reports of the literature show the chemical treatment of textile wastewater by
supercritical water oxidation (Sogut and Akgun, 2007). However, to our knowledge, this is the
first work on dyes degradation by commercial laccase in supercritical carbon dioxide medium.
The enzymatic reactions in supercritical carbon dioxide are attractive due to its low toxicity and
cost, as well as its environmental friendliness, among other characteristics (Braker and
Mossman, 1980). Other advantage of using a supercritical fluid is that its physical properties
can be manipulated by merely changing the temperature or pressure of the reaction system.
However, the results obtained showed that a higher degradation is achieved most often when
the pressure is increased. It is known that high pressure equipment can be quite costly,
hindering many industrial applications. While there are examples that clearly demonstrate that
the use of supercritical carbon dioxide can be advantageous, one must still realize that there are
certain economic issues that may prevent the implementation of this method in some
processes. So, for technical application of supercritical fluids the benefits gained must be
carefully weighed against the higher costs of supercritical process technology. This balancing
will limit economic and beneficial applications. In this study, apart of high pressure being
preferred, the results of degradation seem to be lower than those obtained in aqueous medium,
despite of being studied in a shorter reaction period (3 h against 24 h in literature) (Cristóvão et
al., 2008; Tavares et al., 2009b). So, it seems that for the reactive textile dye degradation by
commercial laccase, it is preferable to work in aqueous medium instead of working in
supercritical conditions, since it is cheaper and more efficient.
VI. 5 Conclusions
Commercial laccase (DeniLite II S) was tested for decolourization of reactive textile
dyes in supercritical carbon dioxide medium. The Box–Behnken statistical experimental design
Part VI – Supercritical Carbon Dioxide Media
204
and response surface methodology were found to be efficient tools to optimize these reactions
conditions. The optimum conditions for RB5 and RY15 in the range studied were found to be
high pressure values (>120 bar), whilst temperature presented a reduced effect on their
degradation at these pressures. For RR239 both variables (pressure and temperature)
influenced the decolourization and, despite of having a strange behaviour, the optimum
conditions in this range appear to be at low values of pressure and high values of temperature.
Pressure was the factor that influenced most the dyes degradation, probably due to the
fact that a small change in pressure causes dramatic variations in the density of supercritical
fluids, altering their physical properties. So, pressure may have the capacity of induce
modification on both the structure and function of enzyme particles leading to a change in the
enzyme activity.
Despite the use of supercritical carbon dioxide present many advantages, probably it is
not the best technique for this process. This method implies the use of high pressures which
makes the equipment cost quite expensive and the degradation results obtained are not better
than those obtained in aqueous medium. Therefore, it seems that the benefits of using a
supercritical fluid do not outweigh the disadvantages founded.
VI. 6 References Amaral, P.F.F., Fernandes, D.L.A., Tavares, A.P.M., Xavier, A.B.M.R., Cammarota, M.C., Coutinho, J.A.P., Coelho, M.A.Z., 2004. Decolorization of dyes from textile wastewater by Trametes versicolor. Environmental Technology, 25, 1313-1320.
Box, G.E.P., Hunter, W.G., Hunter, J.S., 1978. Statistics for Experiments: An Introduction to Design, Data Analysis, and Model Building. John Wiley & Sons, Inc., United States of America.
Braker, W., Mossman, A.L., 1980. Matheson Gas Data Book. Matheson Company, Lyndhurst, New Jersey.
Cantone, S., Hanefeld, U., Basso, A., 2007. Biocatalysis in non-conventional media – ionic liquids, supercritical fluids and the gas phase. Green Chemistry, 9, 954-971.
Celebi, N., Yildiz, N., Demir, A.S., Calimli, A., 2007. Enzymatic synthesis of benzoin in supercritical carbon dioxide. Journal of Supercritical Fluids, 41, 386-390.
Celia, E., Cernia, E., Palocci, C., Soro, S., Turchet, T., 2005. Tuning Pseudomonas cepacea lipase (PCL) activity in supercritical fluids. Journal of Supercritical Fluids, 33,193-199.
Cristóvão, R.O., Tavares, A.P.M., Ribeiro, A.S., Loureiro, J.M., Boaventura, R.A.R., Macedo, E.A., 2008. Kinetic modelling and simulation of laccase catalyzed degradation of reactive textile dyes. Bioresource Technology, 99, 4768–4774.
Erickson, J.C., Schyns, P., Cooney, C.L., 1990. Effect of pressure on an enzymatic reaction in supercritical fluid. AlChe Journal, 36, 299-301.
Habulin, M., Sabeder, S., Sampedro, M.A., Knez, Z., 2008a. Enzymatic synthesis of citronellol laurate inorganic media and in supercritical carbon dioxide. Biochemical Engineering Journal, 42, 6-12.
Habulin, M., Sabeder, S., Knez, Z., 2008b. Enzymatic synthesis of sugar fatty acid esters in organic solvent and in supercritical carbon dioxide and their antimicrobial activity. Journal of Supercritical Fluids, 45, 338-345.
Hammond, D.A., Karel, M., Klibanov, A.M., Krukonis, V.J., 1985. Enzymatic reactions in supercritical gases. Applied Biochemistry and Biotechnology, 11, 393-400.

Part VI – Supercritical Carbon Dioxide Media
205
Hartmann, T., Meyer, H., Scheper, T., 2001. The enantioselective hydrolysis of 3-hydroxy-5-phenyl-4-pentenoicacidethylester in supercritical carbon dioxide using lipases. Enzyme and Microbial Technology, 28, 653-660.
Hauthal, W.H., 2001. Advances with supercritical fluids (review). Chemosphere, 43, 123-135.
Ikushima, Y., Saito, N., Arai, M., Blanch, H.W., 1995. Activation of a lipase triggered by interactions with supercritical carbon dioxide in the near critical region. The Journal of Physical Chemistry, 99, 8941-8944.
Jun, J.H., Sawada, K., Ueda, M., 2004. Application of perfluoropolyether reverse micelles in supercritical CO2 to dyeing process. Dyes and Pigments, 61, 17-22.
Kim, T., Kim, G., Park, J.Y., Lim, J.S., Yoo, K.P., 2006. Solubility Measurement and Dyeing Performance Evaluation of Aramid NOMEX Yarn by Dispersed Dyes in Supercritical Carbon Dioxide. Industrial and Engineering Chemistry Research, 45, 3425-3433.
Lin, T.J., Chen, S.W., Chang, A.C., 2006. Enrichment of n.3 PUFA contents on triglycerides of fih oil by lipase catalyzed trans-esterification under supercritical conditions. Biochemical Engineering Journal, 29, 27-34.
Martym, A., Chulalaksananukul, W., Condoret, J.S., Willemot, R.M., Durand, G., 1990. Comparison of lipase-catalysed esterification in supercritical carbon dioxide and in n-hexane. Biotechnology Letters, 12, 11-16.
Mesiano, A.J., Beckman, E.J., Russel, A.J., 1999. Supercritical Biocatalysis. Chemical Reviews, 99, 623-633.
Montero, G.A., Smith, C.B., Hendrix, W.A., Butcher, D.L., 2000. Supercritical Fluid Technology in Textile Processing: An Overview. Industrial and Engineering Chemistry Research, 39, 4806-4812.
Nakamura, K., Fujii, H., Chi, Y.M., Yano, T., 1990. Supercritical fluid a novel nonaqueous medium to integrate enzymatic reaction and separation. Annals of the New York Academy of Sciences, 613, 319-332.
Palocci, C., Fakoni, M., Chronopoula, L., Cernia, E., 2008. Lipase-catalyzed regioselective acylation of tritylglycosides in supercritical carbon dioxide. Journal of Supercritical Fluids, 45, 88-93.
Primo, M.S., Ceni, G.C., Marcon, N.S., Antunes, O.A.C., Oliveira, D., Oliveira, J.V., Dariva, C., 2007. Effects of compressed carbon dioxide treatment on the specificity of oxidase enzymatic complexes from mate tea leaves. Journal of Supercritical Fluids, 43, 283-290.
Randolph, T.W., Blanch, H.W., Prausnitz, J.M., Wilke, C.R., 1985. Enzymatic catalysis in a supercritical fluid. Biotechnology Letters, 7, 325-328.
Razei, K., Temelli, F., Jenab, E., 2007. The effects of pressure and temperature on the enzymatic reactions in supercritical mediums. Biotechnology Advances, 25, 272-280.
Romero, S., Blánquez, P., Caminal, G., Font, X., Sarrà, M., Gabarrell, X., Vicent, T., 2006. Different approaches to improving the textile dye degradation capacity of Trametes versicolor. Biochemical Engineering Journal, 31, 42-47.
Schmieder, H., Abeln, J., 1999. Supercritical Water Oxidation: State of the Art. Chemical Engineering and Technology, 22, 903-908.
Soares, G.M.B., Amorim, M.T.P., Hrdina, R., Costa-Ferreira, M., 2002. Studies on the biotransformation of novel disazo dyes by laccase. Process Biochemistry, 37, 581-587.
Sogut, O.O., Akgun, M., 2007. Treatment of textile wastewater by SCWO in a tube reactor. Journal of Supercritical Fluids, 43, 106–111.
Tauber, M.M., Guebitz, G.M., Rehorek, A., 2005. Degradation of Azo Dyes by Laccase and Ultrasound Treatment. Applied and Environmental Microbiology, 71, 2600–2607.
Tavares, A.P.M., Cristóvão, R.O., Loureiro, J.M., Boaventura, R.A.R., Macedo, E.A., 2008. Optimisation of reactive textile dyes degradation by laccase–mediator system. Journal of Chemical Technology and Biotechnology, 83, 1609-1615.
Tavares, A.P.M., Cristóvão, R.O., Gamelas, J.A.F., Loureiro, J.M., Boaventura, R.A.R., Macedo, E.A., 2009a. Sequential decolourisation of reactive textile dyes by laccase mediator system. Journal of Chemical Technology and Biotechnology, 84, 442-446.
Tavares, A.P.M., Cristóvão, R.O., Loureiro, J.M., Boaventura, R.A.R., Macedo, E.A., 2009b. Application of statistical experimental methodology to optimise reactive dye decolourisation by commercial laccase. Journal of Hazardous Materials, 162, 1255-1260.


Part VII
Conclusions and Future Work


Part VII – Conclusions and Future Work
209
VII. 1 Conclusions
The aim of this thesis was the study of the reactive textile dyes degradation by laccase,
the optimization of operative conditions and the kinetic modelling of the process.
The best working conditions for the catalysis of the six reactive textile dyes studied
(reactive black 5, reactive blue 114, reactive yellow 15, reactive yellow 176, reactive red 239
and reactive red 180) by laccase (DeniLite II Base) were established by testing five traditional
mediators (ABTS, VA, HBT, NHA and TEMPO), the mediator concentrations, temperature and
pH. Laccase without mediator did not decolourize any dye during the incubation time,
demonstrating that these reactive dyes were not primary substrates for laccase. When a redox
mediator was introduced, there was already degradation of dyes whose extension depends on
the dye and on the mediator. ABTS was the most effective mediator leading to higher
decolourization. The optimum temperature and pH values were 35 ºC and 5.0, respectively, for
maximum decolourization (above 70 %) of reactive black 5, reactive blue 114 and reactive
yellow 15. For reactive red 239 the optimum conditions were found to be 40 ºC and pH 4.5
(above 56 % decolourization). Reactive yellow 176 and reactive red 180 were not decolourized
at any of these conditions. Three level Box-Behnken factorial design with three factors (pH,
temperature and enzyme concentration) combined with response surface methodology was
applied to optimize dyes degradation with commercial laccase (DeniLite II S). pH proved to be
the principal factor that affects the decolourization of all dyes. The mathematical models
developed estimate a degradation equal or above 90 % for all reactive dyes with the exception
of reactive yellow 176, that was not degraded. A comparison between dye decolourization by
absorbance reduction at the maximum absorbance wavelength and total colour removal based
on the overall spectrum was made, showing that the second was less efficient, probably due to
the degradation products formed during the decolourization of some of the dyes. These results
are very promising and reveal the potential of laccase mediator system for reactive dye
decolourization since it has been reported that these dyes are only 10% (on average) removed
by conventional treatments.
The large variation in the decolourization percentage of the six different reactive dyes by
laccase-mediator system can be explained by voltammetric studies. The voltammetric
measurements showed a remarkably good linear correlation between the percentage of
decolourization of each dye and the respective anodic peak potential: the efficiency of
decolourization by laccase increases with decreasing dye oxidation potential. It was thus
demonstrated that the redox potential differences between the biocatalysts and the dyes are a
relevant preliminary tool to predict the decolourization capacity of oxidative and reductive
biocatalysts.
The sequential decolourization of the reactive textile dyes by laccase mediator system
during seven cycles demonstrated that the treatment with laccase can be used over a long

Part VII – Conclusions and Future Work
210
period, proving the feasibility of biological catalysts and their reuse in reactive dyes degradation.
Thus, laccase mediator systems may be applied for the treatment of textile dyeing effluents.
As real industrial effluents often contain several mixtures of unfixed and hydrolyzed
dyes, as well as salts, sizing agents and auxiliary chemicals, the degradation by commercial
laccase of a mixture of three reactive dyes (reactive black 5, reactive yellow 15 and reactive red
239) and of a synthetic dye house effluent, simulating a real textile wastewater, containing the
three dyes, salts and auxiliary chemicals were tested in the previously optimized conditions in a
batch reactor, in order to evaluate the applicability of this method to a real situation.
A high decolourization of the simulated textile effluent was achieved at the maximum
wavelength of reactive black 5 (above 86 %). The decolourization at the other dyes wavelengths
(above 63 % for reactive yellow 15 and around 41 % for reactive red 239) and the total
decolourization based on all the visible spectrum (around 55 %) were not so good, being
somewhat lower than in the case of the mixture of the dyes (above 89 % for RB5, 77 % for
RY15, 68 % for RR239 and above 84 % for total decolourization) which, in turn, is already lower
than the degradation of each of these dyes. This is probably due to the competition between
several compounds for the active sites of the enzyme, to the formation of strong chemical bonds
with the species involved in the degradation process, to the enzyme deactivation or to the
polymerization of the reaction products that can provide unacceptable colour levels in effluents.
Even so, the good results of decolourization as measured by the percentage of absorbance
reduction at the maximum absorbance wavelength of each dye and by the total colour removal
based in all the visible spectrum indicate the possibility of implementing this technique for textile
wastewater treatment.
The water quality analysis (total organic carbon, chemical oxygen demand, biochemical
oxygen demand and toxicity) showed that values below the maximum permissible discharge
limits for textile industrial wastewaters are achieved if the degradation is carried out with
immobilized commercial laccase.
Mathematical models based on Michaelis-Menten equation were developed to simulate
the kinetics of commercial laccase decolourization of the separated reactive dyes, of their
mixture and of the simulated effluent in a batch reactor. The unusual kinetic behaviour of some
of these reactions suggests that the kinetic model must consider the activation of the laccase
mediator system. Kinetic constants were determined by minimizing the difference between the
time courses predicted by the model and the experimental ones. The close correlation between
the predicted and the experimental results seems to support the reliability of the established
models. Thus with the knowledge of these models it is possible to predict the system
performance under different operating conditions, reactor design, scale-up, optimization and
control of the system. In principle, the models can be applied whenever the commercial laccase
is used in the degradation of reactive dyes (from an effluent with only one reactive dye up to a
real effluent). But the fact that the behaviour of the commercial laccase changes with the colour
of the dye and with the effluent composition indicates that they should be used with care.

Part VII – Conclusions and Future Work
211
In order to perform the treatment of textile effluents by enzymatic catalysis at large-
scale and to obtain an effluent with parameters below the legal discharge limits the
immobilization of commercial laccase by physical adsorption into coconut fiber was also
studied. The immobilization conditions (enzyme concentration, contact time and pH) were
optimized obtaining an immobilized enzyme with thermal and operational stabilities improved
when compared with the free commercial laccase. Despite the degradations of practically all
reactive dyes and of their mixture in batch reactors are lower than those obtained by the free
enzyme, the decolourizations achieved, the enzyme reuse and the improvement in stability
indicate the potential of the immobilized enzyme for continuous applications in the wastewater
treatment of textile industries.
The laccase catalyzed degradation of the reactive dyes was also tested in supercritical
carbon dioxide media as a promising clean technology. The effect of pressure and temperature
in the system were investigated using the experimental design and the response surface
methodology. Pressure was the most relevant factor. The results obtained showed that a higher
degradation is achieved most often when the pressure is increased, turning it in an expensive
process. Since the results in supercritical media are not so good as those found in aqueous
solution, despite its advantages, it seems preferable to perform reactive dyes degradation by
commercial laccase in aqueous medium, since it is a cheaper and more efficient method.
In summary, it was demonstrated that the laccase catalyzed system is an efficient
method for the decolourization of reactive textile dyes containing wastewaters (the most difficult
to degrade dyes), although further studies are recommended for implementing a continuous
system. The results obtained for this enzymatic treatment of industrial textile dye effluent and
respective kinetic models could be the bases for a wide range of other similar dyes, suggesting
its suitability for larger scale applications. Moreover, compared to the common and often
expensive physical or chemical ways for dye effluent remediation, the biodegradation by the use
of commercial laccase appears to be an attractive alternative.
VII. 2 Future Work
The work described in the present thesis allowed to retrieve important information about
the use of laccase in textile applications. Significant steps forward are possible and efforts are
already being made in that direction.
Studies of simulated textile effluent degradation with the immobilized laccase should be
performed in batch reactor to understand the impact of salts and auxiliary chemicals on the
decolourization. The best conditions for effective degradation should be determined and
environmental parameters must be also evaluated.

Part VII – Conclusions and Future Work
212
Studies of immobilization should be more thorough regarding the enzyme reuse in a
continuous mode. Possibly, the immobilization of the pure laccase (DeniLite II Base) and the
subsequent addition of a mediator, which is re-oxidized during the process will be needed to get
a good degradation for a longer period of time. Different and more efficient immobilization
supports and techniques should also be investigated to improve immobilized laccase dye
decolourization.
Based on batch reactor results, studies carried out in a continuous reactor with
immobilized enzyme should be made. For this, an experimental set-up that includes a
continuous fixed bed reactor can be created. Several parameters must be considered and
optimized, e.g., flow-rate, immobilized enzyme activity and temperature.
The decolourization of a real effluent from a textile industry in the continuous reactor
with immobilized laccase should be evaluated in order to examine the effectiveness of the
method to a more complex system. The effect of real textile wastewater components on the
enzymatic degradation may be different, so it is recommended that the kinetic behaviour of
these reactions should also be characterized and modelled. Comparing the kinetics of the
simulated and real effluents may help to identify other components and the knowledge of its
behaviour over time will allow to develop better strategies in order to maintain long term enzyme
stability. Once a kinetic model is obtained, an enzyme reactor can be sized, allowing the
development of a pilot treatment plant to apply in a textile industry.
Further study should consider different and less polluting mediators such as the natural
mediators produced by laccase in natural environment during lignin degradation
(acetosyringone, syringaldehyde, etc.).
Studies should be performed in order to understand the laccase mediated degradation
mechanism of dyes. Experiments will be needed to evaluate the products formed during the
enzymatic degradation of the effluent and to analyze their interference in the process. Further
studies should be performed in order to find a possible method for reaction products removal.
It is also interesting to investigate the effect of known inhibitors of laccase catalyzed
degradation of dyes. There is much to study about any possible inhibitions by other products
used in textile processing, dyeing and finishing.
This type of study could also be extended to other classes of dyes (basic, direct, acid,
etc.) often present in effluents from textile industries.
Appendices


Appendix A
215
Appendix A – Dyes Safety Data Sheets
A1 – Remazol Black B I – Product Information
Product name: Remazol Black B 133 % gran Composition: Dangerous component: C.I. Reactive Black 5 Content: 70-80 % EC Number: 241-164-5 II – Physico-Chemical properties
Physical state: granulated Colour: black Odour: odourless Ignition temperature: > 240 ºC Bulk density: about 600 kg/m3 Water solubility: > 100 g/L (25ºC) pH value: about 4.5 (10 g/L) water Combustibility index: BZ1 – does not enter into combustion III – Stability and Reactivity
Thermal decomposition: > 190 ºC Dangerous reactions:
Tendency to blow the dust: non-flammable IV – Toxicological information
Acute oral toxicity: DL50 > 2.000 mg/kg (vole) Effect of skin irritation: not irritating (rabbit) Irritating to eyes: not irritating (rabbit eye) V – Ecological information
Biodegradability: 10-25 % (static test) Toxicity to fish: CL50 > 100 mg/L (48h, Brachydanio rerio) Toxicity to bacteria: > 1.000 mg/L (fermentation tube test) VI – Standards
Danger symbol: Xn (harmful) R42/43: may cause sensitization by inhalation and skin contact S22: not breathe dust S24: avoid skin contact S37: use appropriate gloves

Appendix A
216
A2 – Remazol Yellow GR I – Product Information
Product name: Remazol Yellow GR 133 % gran Composition: C.I. Reactive Yellow 15 II – Physico-Chemical properties
Physical state: granulated Colour: dark yellow Odour: odourless Melting temperature: > 250 ºC Ignition temperature: from 240 ºC Bulk density: about 833 kg/m3 Water solubility: 80 g/L (20 ºC) pH value: about 5.5 (50 g/L) water Combustibility index: BZ1 not enter into combustion III – Stability and Reactivity
Thermal decomposition: > 260 ºC Dangerous reactions: in the case of organic powders, should be counted, as a rule, with
dust explosion IV – Toxicological information
Acute oral toxicity: DL50 > 2.000 mg/kg (vole) Effect of skin irritation: not irritating (rabbit) Irritating to eyes: not irritating (rabbit eye) V – Ecological information
Physico-chemical elimination: 10-25 % (precipitation of iron sulphate) Biodegradability: 10-25 % (static test)
Toxicity to fish: CL50 = 500 mg/L (48h, Leuciscus idus) Toxicity to bacteria: CE0 > 500 mg/L (biological sludge) COD: 630 mg/g BOD5: 70 mg/g VI – Standards
S22: not breathe dust

Appendix A
217
A3 – Remazol Yellow 3RS I – Product Information
Product name: Remazol Yellow 3RS 133 % gran Composition: C.I. Reactive Yellow 176 II – Physico-Chemical properties
Physical state: granulated Colour: red to brown Odour: odourless Ignition temperature: from 270 ºC Bulk density: 400-500 kg/m3 Water solubility: 50 g/L (20 ºC) pH value: about 7.0 (25 ºC, 10 g/L) Combustibility index: BZ3 localized burning without spread III – Stability and Reactivity
Thermal decomposition: > 150 ºC Dangerous reactions: in the case of organic powders, should be counted, as a rule, with
dust explosion IV – Toxicological information
Acute oral toxicity: DL50 > 2.000 mg/kg (vole) Effect of skin irritation: not irritating (rabbit) Irritating to eyes: not irritating (rabbit eye) V – Ecological information
Toxicity to fish: CL50: 500 – 1.000 mg/L (96h, Leuciscus idus) Toxicity to bacteria: CE10: 1.000 mg/L (activated sludge bacteria) VI – Standards
S22: not breathe dust
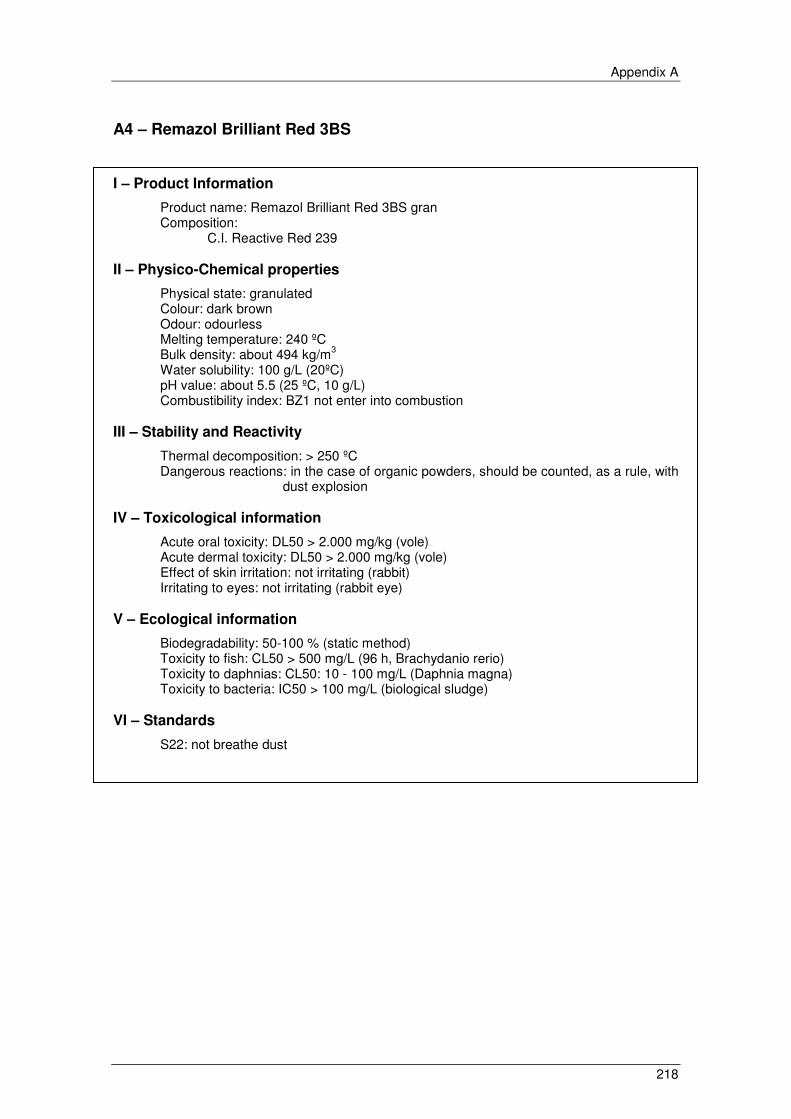
Appendix A
218
A4 – Remazol Brilliant Red 3BS I – Product Information
Product name: Remazol Brilliant Red 3BS gran Composition: C.I. Reactive Red 239 II – Physico-Chemical properties
Physical state: granulated Colour: dark brown Odour: odourless Melting temperature: 240 ºC Bulk density: about 494 kg/m3 Water solubility: 100 g/L (20ºC) pH value: about 5.5 (25 ºC, 10 g/L) Combustibility index: BZ1 not enter into combustion III – Stability and Reactivity
Thermal decomposition: > 250 ºC Dangerous reactions: in the case of organic powders, should be counted, as a rule, with
dust explosion IV – Toxicological information
Acute oral toxicity: DL50 > 2.000 mg/kg (vole) Acute dermal toxicity: DL50 > 2.000 mg/kg (vole) Effect of skin irritation: not irritating (rabbit) Irritating to eyes: not irritating (rabbit eye) V – Ecological information
Biodegradability: 50-100 % (static method) Toxicity to fish: CL50 > 500 mg/L (96 h, Brachydanio rerio)
Toxicity to daphnias: CL50: 10 - 100 mg/L (Daphnia magna) Toxicity to bacteria: IC50 > 100 mg/L (biological sludge) VI – Standards
S22: not breathe dust

Appendix A
219
A5 – Remazol Brilliant Red F3B I – Product Information
Product name: Remazol Brilliant Red F3B gran Composition: C.I. Reactive Red 180 II – Physico-Chemical properties
Physical state: granulated Colour: red Odour: odourless Ignition temperature: from 280 ºC Bulk density: about 494 kg/m3 Water solubility: > 10 g/L (20 ºC) pH value: 4.5 - 5.0 (25 ºC, 10 g/L) Combustibility index: BZ1 not enter into combustion III – Stability and Reactivity
Thermal decomposition: > 350 ºC Dangerous reactions: in the case of organic powders, should be counted, as a rule, with
dust explosion IV – Toxicological information
Acute oral toxicity: DL50 > 5.000 mg/kg (vole) Effect of skin irritation: not irritating (rabbit) Irritating to eyes: not irritating (rabbit eye) V – Ecological information
Biodegradability: < 20 % (static method) Toxicity to fish: CL50: 100 - 500 mg/L (96 h, Cyprinus carpio)
Toxicity to bacteria: CE0 > 2.000 mg/L (inhibition of respiration of activated sludge organisms) VI – Standards
S22: not breathe dust
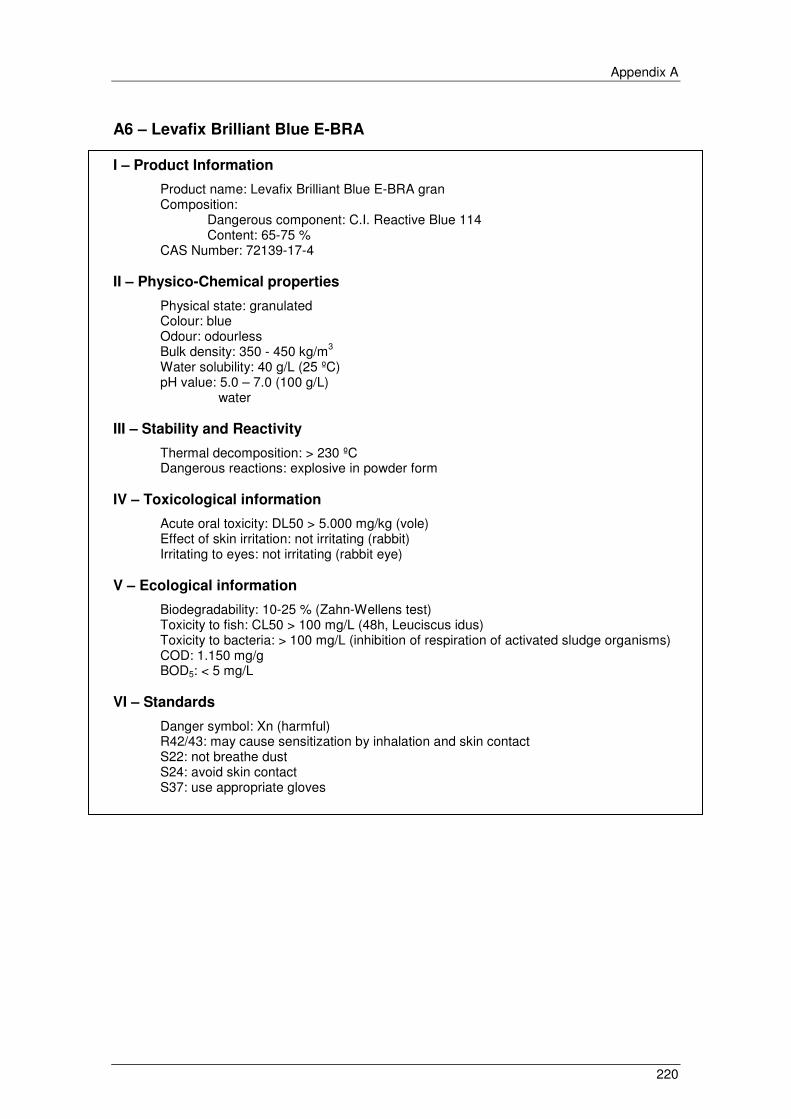
Appendix A
220
A6 – Levafix Brilliant Blue E-BRA I – Product Information
Product name: Levafix Brilliant Blue E-BRA gran Composition: Dangerous component: C.I. Reactive Blue 114 Content: 65-75 % CAS Number: 72139-17-4 II – Physico-Chemical properties
Physical state: granulated Colour: blue Odour: odourless Bulk density: 350 - 450 kg/m3 Water solubility: 40 g/L (25 ºC) pH value: 5.0 – 7.0 (100 g/L) water III – Stability and Reactivity
Thermal decomposition: > 230 ºC Dangerous reactions: explosive in powder form IV – Toxicological information
Acute oral toxicity: DL50 > 5.000 mg/kg (vole) Effect of skin irritation: not irritating (rabbit) Irritating to eyes: not irritating (rabbit eye) V – Ecological information
Biodegradability: 10-25 % (Zahn-Wellens test) Toxicity to fish: CL50 > 100 mg/L (48h, Leuciscus idus) Toxicity to bacteria: > 100 mg/L (inhibition of respiration of activated sludge organisms) COD: 1.150 mg/g BOD5: < 5 mg/L VI – Standards
Danger symbol: Xn (harmful) R42/43: may cause sensitization by inhalation and skin contact S22: not breathe dust S24: avoid skin contact S37: use appropriate gloves

Appendix B
221
Appendix B – Enzymes Data Sheets
B1 – DeniLite II Base I – Description
DeniLite II Base is a highly concentrated laccase (EC 1.10.3.2) produced by submerged fermentation of a genetically modified Aspergillus microorganism. II – Product Properties
DeniLite II Base is a beige granulated product available with a standard strength of 800 LAMU/g. Product colour may vary from batch to batch. Colour intensity is not an indication of product strength. The enzyme activity of DeniLite II Base is declared in LAMU (Laccase Units). DeniLite II Base is a non-food-grade product intended for technical applications only. III – Application
DeniLite II Base should be formulated together with DeniLite II Assist. The combined product is used for the decolourisation of indigo in denim processing applications. A ready-to-use formulation will contain DeniLite II Base, DeniLite II Assist and suitable buffer salts to target pH 4.5 during washing. The end-user formulation should be made as a solid product and not exposed to water or other liquids prior to use. The final product offers the following benefits:
- Creation of new looks, new fashions and finishes (e.g. grey cast/antique finishes) - Enhancement of denim abrasion – overall reduction in processing time - Maximum strength retention at high abrasion levels (e.g. destruct finishes) - Clean-up of backstaining and improved garment contrast - Easily controllable and reproducible dye decolourisation process
Suggested process conditions are: - Liquor/garment ratio: 4:1 – 20:1 (optimum 5:1 – 10:1) - Treatment time: 10 – 30 min. - pH: 4.0 – 5.5 - Temperature: 60-70 ºC - Afterwash: Rinse
IV – Safety
Enzymes are proteins and inhalation of dust or aerosols may induce sensitization and may cause allergic reactions in sensitized individuals. Some enzymes may irritate the skin, eyes and mucous membranes upon prolonged contact. V – Storage
Enzymes gradually loose activity over time depending on storage temperature. Cool conditions are recommended. Close container after partial use to protect from humidity. When stored in closed containers at 25 ºC, the product will maintain its declared activity for at least three months. Extended storage and/or adverse conditions, including higher temperatures, may lead to a higher dosage requirement.

Appendix B
222
B2 – DeniLite II S I – Description
DeniLite II S is a laccase (EC 1.10.3.2) produced by submerged fermentation of a genetically modified Aspergillus microorganism. II – Product Properties
DeniLite II S is light grey powder product available in the following standard strength: 120 LAMU/g. Colour intensity is not an indication of product strength. The enzyme activity of DeniLite II S is declared in LAMU (Laccase Units). DeniLite II Base is a non-food-grade product intended for technical applications only. III – Application
DeniLite II S is a ready-to-use product for indigo dye decolourisation in denim finishing operations. DeniLite II S is used when the following is sought:
- Creation of new looks, new fashions and finishes - Enhancement of denim abrasion, allowing for a very fast denim abrasion process - Denim finishing with optimum fabric strength retention - Easily controllable and reproducible dye decolourisation process
DeniLite II S is a fully formulated product including buffer and an enzyme mediator, and
needs no further formulation. The phosphate adipic acid buffering system in DeniLite II S ensures a pH of 4-5 during washing. The product contains no water and it is essential that the product is not mixed with water before use.
Suggested process conditions are: - DeniLite II S: 0.5 – 2 % of weight of garment - Liquor/garment ratio: 4:1 – 20:1 (optimum 5:1 – 10:1) - Treatment time: 10 – 30 min. - pH: 4.0 – 5.5 - Temperature: 60-70 ºC - Afterwash: Rinse
IV – Safety
Enzymes are proteins and inhalation of dust or aerosols may induce sensitization and may cause allergic reactions in sensitized individuals. Some enzymes may irritate the skin, eyes and mucous membranes upon prolonged contact. V – Storage
Enzymes gradually loose activity over time depending on storage temperature. Cool conditions are recommended. Close container after partial use to protect from humidity. When stored in closed containers at 25 ºC, the product will maintain its declared activity for at least three months. Extended storage and/or adverse conditions, including higher temperatures, may lead to a higher dosage requirement.
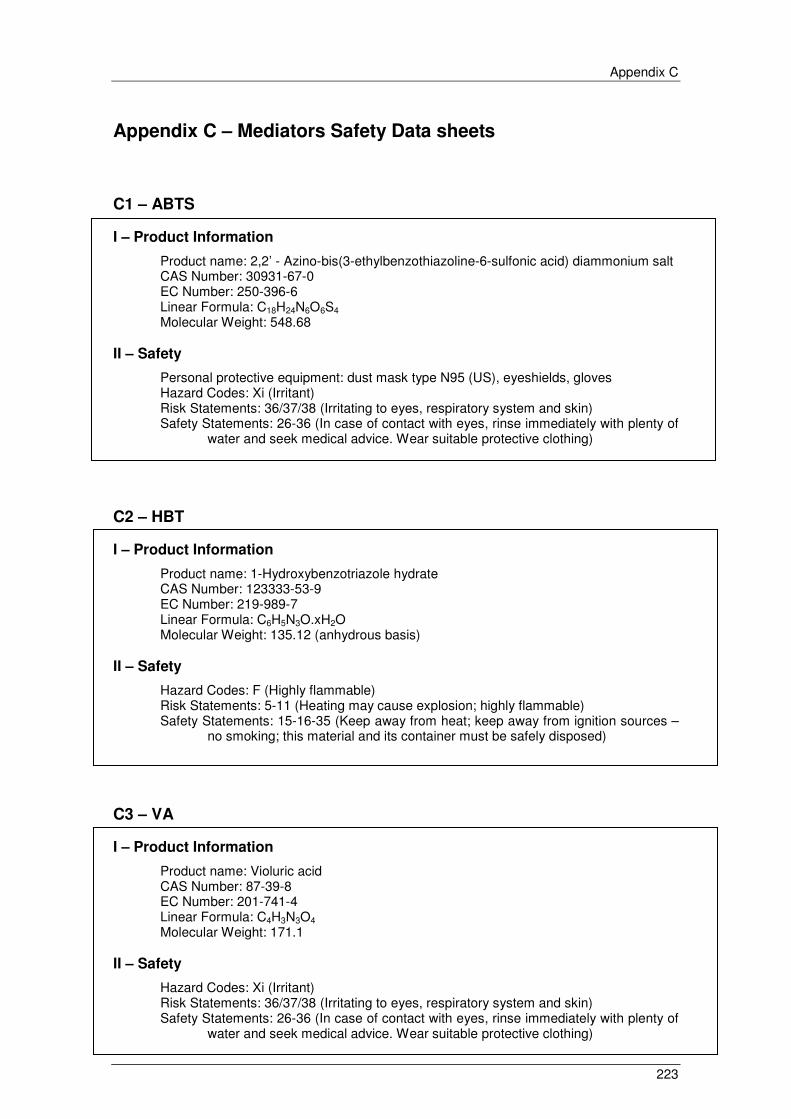
Appendix C
223
Appendix C – Mediators Safety Data sheets
C1 – ABTS I – Product Information
Product name: 2,2’ - Azino-bis(3-ethylbenzothiazoline-6-sulfonic acid) diammonium salt CAS Number: 30931-67-0 EC Number: 250-396-6 Linear Formula: C18H24N6O6S4 Molecular Weight: 548.68 II – Safety
Personal protective equipment: dust mask type N95 (US), eyeshields, gloves Hazard Codes: Xi (Irritant) Risk Statements: 36/37/38 (Irritating to eyes, respiratory system and skin)
Safety Statements: 26-36 (In case of contact with eyes, rinse immediately with plenty of water and seek medical advice. Wear suitable protective clothing)
C2 – HBT I – Product Information
Product name: 1-Hydroxybenzotriazole hydrate CAS Number: 123333-53-9 EC Number: 219-989-7 Linear Formula: C6H5N3O.xH2O Molecular Weight: 135.12 (anhydrous basis) II – Safety
Hazard Codes: F (Highly flammable) Risk Statements: 5-11 (Heating may cause explosion; highly flammable)
Safety Statements: 15-16-35 (Keep away from heat; keep away from ignition sources – no smoking; this material and its container must be safely disposed)
C3 – VA I – Product Information
Product name: Violuric acid CAS Number: 87-39-8 EC Number: 201-741-4 Linear Formula: C4H3N3O4 Molecular Weight: 171.1 II – Safety
Hazard Codes: Xi (Irritant) Risk Statements: 36/37/38 (Irritating to eyes, respiratory system and skin)
Safety Statements: 26-36 (In case of contact with eyes, rinse immediately with plenty of water and seek medical advice. Wear suitable protective clothing)
Appendix C
224
C4 – TEMPO I – Product Information
Product name: 2,2,6,6 – Tetramethyl-1-piperidinyloxy, free radical CAS Number: 2564-83-2 EC Number: 219-888-8 Linear Formula: C9H18NO Molecular Weight: 156.25 II – Safety
Personal protective equipment: Eyeshields, faceshields, full-face particle respirator type N100 (US), gloves, respirator cartridge type N100 (US), type P1 (EN143) respirator filter, type P3 (EN 143) respirator cartridges
Hazard Codes: C (Corrosive) Risk Statements: 34 (Causes burns)
Safety Statements: 26-36/37/39-45 (In case of contact with eyes, rinse immediately with plenty of water and seek medical advice. Wear clothing, gloves and appropriate protective devices for eyes and face. In case of accident or sickness, seek medical help immediately; if possible, show the label)

Appendix D
225
Appendix D – Textile processing auxiliaries
D1 – Sera Lube M-CF I - Function
Crease inhibitor and lubrificant for dyeing and scouring processes. II – Properties
Has lubricating properties. Prevents crease formation in dyeing of fabrics made of acrylic, wool, wool blends,
polyamide, silk and cellulosic knit goods. Prevents crease formation during milling wool-containing fabrics. Reduces milling of wool blends during dyeing. Does not foam and may therefore be used on all dyeing machines including jets. Shows good compatibility with anionic and cationic dyestuffs. Does not retard dyes. Avoids moiré in beam dyeing machines. Prevents channelling of dye liquor in dyeing of hanks and raw stock.
III – Amounts required
1 – 2 % in dyeing processes 1,000 kg IBC / 120 kg drum IV – Appearance
Almost colourless Viscous liquid V – Ionic nature
Nonionic D2 – Sera Quest M-PP I - Function
Sequestrant with dispersing, soil suspending and buffering ability for scouring, bleaching and dyeing of textile material. II – Properties
Has sequestering ability for calcium, magnesium and heavy metal ions in a wide pH range.
Improves the removal of soil, mineral contaminations as well as heavy metal ions, sizes and yarn lubricants in scouring processes; aids in pretreating the fabrics for subsequent bleaching or dyeing.
Prevents the agglomeration of dispersions and emulsions. Stabilises dyebaths when dyeing natural and synthetic fibers. Improves the fastness to rubbing when soaping dyeings and prints, also the wet fastness when soaping reactive dyeings and prints.
Appendix D
226
III – Amounts required
0.5 – 2.0 g/L for washing 0.5 – 1.0 g/L for preparation and dyeing 1,100 kg IBC / 120 kg drum IV – Appearance
Yellowish liquid V – Ionic nature
Anionic D3 – Sera Wet C-AS I - Function
Low-foaming rapid wetting and deaerating agent for pre-treatment and dyeing processes of cotton and synthetic fibers. II – Properties
Provides rapid wetting over a wide temperature range Does not impair the solubility of water soluble dyes Improves dye penetration Does not foam Promotes high liquor pick-up Stable in alkaline solution up to 30 g/L caustic soda APEO-free
III – Amounts required
1.0 – 4.0 g/L in preparation and dyeing 950 kg IBC / 110/120 kg drum IV – Appearance
Clear, colourless to slightly yellowish liquid V – Ionic nature
Anionic