degradation of estradiol in water and soil using a new
TRANSCRIPT

Degradation of Estradiol in Water and Soil Using a New Class of Stabilized
Manganese Dioxide Nanoparticles and Hydrodechlorination of Triclosan Using
Supported Palladium Catalysts
by
Bing Han
A dissertation submitted to the Graduate Faculty of
Auburn University
in partial fulfillment of the
requirements for the Degree of
Doctor of Philosophy
Auburn, Alabama
August 1, 2015
Keywords: Estradiol, Triclosan, Manganese dioxide nanoparticles,
Transport, In-situ degradation, Hydrodechlorination
Copyright 2015 by Bing Han
Approved by
Dongye Zhao, Chair, Professor of Civil Engineering
Mark O. Barnett, Professor of Civil Engineering
Prabhakar Clement, Professor of Civil Engineering
Yucheng Feng, Professor of Crop, Soil and Environmental Sciences
David Stanbury, Professor of Chemistry and Biochemistry

ii
Abstract
Pharmaceuticals and personal care products (PPCPs), such as 17-estradiol (E2)
and triclosan (TCS), are endocrine disruptors that have been found in surface water and
groundwater. The low concentration of these endocrine disrupting chemicals can cause
adverse effects on humans and wildlife via interactions with their endocrine system.
To facilitate in-situ remediation of E2 in groundwater, this research developed a
new class of stabilized manganese oxide nanoparticles using “green” and low-cost
carboxymethyl cellulose (CMC) as a stabilizer. The most mono-dispersed MnO2
nanoparticles were obtained at a CMC/MnO2 molar ratio of 1.3910-3, which yielded a
mean hydrodynamic size of 39.50.8 nm. The CMC-MnO2 nanoparticles could effectively
degrade E2 in both aqueous and soil phases. Column transport tests confirmed that the
nanoparticles can be delivered through three natural sandy loams, although retention of the
particles varied with soils. The particle retention is strongly dependent on injection pore
velocity, and in-situ treatment effectiveness is strongly affected by the mass transfer rates
of both the nanoparticles and contaminants. When the E2-laden soils were treated with 0.17
g/L of the MnO2 nanoparticle suspension, 13-88% of water leachable E2 was degraded,
depending on the soil type. The nanoparticles appear to be promising in terms of filling the
technology gap for in-situ oxidation of endocrine disruptors in soil and groundwater.
This study also developed and tested a new class of supported Pd catalyst by
immobilizing the Pd particles on two strong basic anion exchange resins (IRA-900 and
iii
IRA-958). The resin-supported Pd catalysts could facilitate a rapid and complete
hydrodechlorination (HDC) of TCS with very low concentration of chlorinated
intermediates were present in the very early stage of HDC process. These resin supported
catalysts showed long-term sustainability with only < 2% reactivity lost after eight
exhausting runs, which contribute to the advantage of minimum Pd bleeding from the
supports and high resistance to organic fouling. Catalytic HDC with resin-supported Pd
catalysts have proved to be a promising solution for completely degrade the chlorinated
pollutants and diminish highly toxic byproducts produced by other degradation methods.

iv
Acknowledgments
I would like to express my sincere gratitude to my advisor Dr. Dongye Zhao, Elton
Z. and Lois G. Huff Professor in Department of Civil Engineering at Auburn University,
for his patient guidance, encouragement, and support throughout my PhD study as his
student. I have been extremely lucky to have an advisor who has such immense
professional knowledge, and who helped me to develop my skills to work independently.
I gratefully acknowledge all the members of my committee, Dr. Mark Barnett, Dr.
Prabhakar Clement, Dr. Yucheng Feng, and Dr. David Stanbury for their insightful
comments and constructive suggestions through this work. Sincere appreciation is also to
Dr. Yifen Wang, who served on the committee as the outside reader, and provided
constructive criticism and great advice on this dissertation.
Best regards to all members of Dr. Zhao’s research group for their friendship and
helps. I gratefully acknowledge Dr. Clifford Lange and Mr. Jinling Zhuang for their patient
help on GC analysis and other instruments operation in the lab. In addition, I would deeply
appreciate for all my friends for their warmth to me and belief in me.
Finally, and the most important, I would like to thank my parents for their endless
care, encouragement, and support to me in all my life. Their love accompanies with me to
support me to succeed in finishing my PhD research work and made this dissertation
possible.
v
Table of Contents
Abstract ............................................................................................................................... ii
Acknowledgments.............................................................................................................. iv
List of Tables ..................................................................................................................... ix
List of Figures ......................................................................................................................x
CHAPTER 1. BACKGROUND AND INTRODUCTION .................................................1
1.1 The emergence of PPCPs in environment ....................................................................1
1.2 The source and occurrence of E2 and TCS ...................................................................5
1.3 Current treatment methods for PPCPs ..........................................................................7
1.3.1 Adsorption on activated carbon ....................................................................7
1.3.2 Ozone oxidation ............................................................................................8
1.3.3 UV radiation ..................................................................................................9
1.3.4 Electro-oxidation .........................................................................................10
1.3.5 Soil-aquifer treatment (SAT) ......................................................................11
1.3.6 Microbial degradation .................................................................................12
1.3.7 Nanoparticle remediation ............................................................................12
CHAPTER 2. DEGRADATION OF AQUEOUS AND SOIL-SORBED ESTRADIOL
USING A NEW CLASS OF STABILIZED MANGANESE OXIDE
NANOPARTICLES ...........................................................................................................14
2.1 Introduction .................................................................................................................14
2.2 Materials and methods ................................................................................................17
vi
2.2.1 Materials .....................................................................................................17
2.2.2 Preparation of CMC-stabilized MnO2 nanoparticles ..................................20
2.2.3 Degradation of E2 in water ...........................................................................20
2.2.4 Soil sorption and desorption kinetics of E2 ..................................................21
2.2.5 Degradation of soil-sorbed E2 ......................................................................23
2.2.6 Nanoparticle characterization .......................................................................23
2.2.7 Analytical methods .......................................................................................24
2.3 Results and discussion ................................................................................................24
2.3.1 Effect of CMC/MnO2 molar ratio on particle size ........................................24
2.3.2 Degradation of aqueous E2 with CMC-stabilized MnO2 nanoparticles .......29
2.3.3 Effect of pH on E2 removal in water ...........................................................40
2.3.4 Effect of CMC on E2 desorption from soil ...................................................41
2.3.5 Degradation of soil-sorbed E2 ......................................................................44
2.3.6 Effect of leachable soil components on E2 degradation ...............................49
2.4 Conclusions ..................................................................................................................54
CHAPTER 3. IN-SITU DEGRADATION OF SOIL-SORBED 17-ESTRADIOL
USING CARBOXYMETHYL CELLULOSE STABILIZED MANGANESE OXIDE
NANOPARTICLES: COLUMN STUDIES ......................................................................56
3.1 Introduction ..................................................................................................................56
3.2 Materials and methods ................................................................................................60
3.2.1 Preparation and characterization of CMC-MnO2 nanoparticles .................60
3.2.2 Soils and E2 sorption/desorption ................................................................60
3.2.3 Column transport tests ..................................................................................64
3.2.4 Column degradation tests ..............................................................................67

vii
3.2.5 Analytical method .........................................................................................67
3.2.6 Transport modeling ......................................................................................68
3.3 Results and discussion .................................................................................................69
3.3.1 Characterization of CMC-stabilized MnO2 nanoparticles .........................69
3.3.2 Transport of CMC-MnO2 in three soils .....................................................71
3.3.3 Effect of flow velocity on transport behavior ..............................................79
3.3.4 Effect of nanoparticle concentration on transport behavior .........................82
3.3.5 Degradation of E2 in three soils ...................................................................84
3.3.6 Effect of flow velocity on degradation behavior .........................................91
3.3.7 Effect of particle concentration on degradation behavior ............................94
3.4 Conclusions ..................................................................................................................96
CHAPTER 4. CATALYTIC HYDRODECHLORINATION OF TRICLOSAN WITH
ANION-EXCHANGE-RESIN SUPPORTED PALLADIUM ..........................................98
4.1 Introduction .................................................................................................................98
4.2 Materials and methods ..............................................................................................101
4.2.1 Materials ...................................................................................................102
4.2.2 Catalyst preparation ..................................................................................104
4.2.3 Catalyst characterization .............................................................................105
4.2.4 Catalytic hydrodechlorination of TCS ........................................................105
4.2.5 Catalyst lifetime ..........................................................................................106
4.2.6 Analysis of hydrodechlorination byproducts .............................................107
4.2.7 Analysis of Cl balance ................................................................................107
4.3 Results and discussion ...............................................................................................108

viii
4.3.1 Catalysts characterization ........................................................................108
4.3.2 Effect of Pd loading on the rate of hydrodechlorination reaction ............114
4.3.3 Effect of support on the rate of TCS adsorption and reaction ...................119
4.3.4 Lifetime of the catalyst ..............................................................................122
4.3.5 Effect of humic acid ...................................................................................125
4.3.6 Hydrodechlorination pathway of TCS in liquid phase ..............................128
4.4 Conclusions ................................................................................................................133
CHAPTER 5. CONCLUSIONS AND SUGGESTIONS FOR FUTURE RESEARCH .135
5.1 Summary and conclusions .........................................................................................135
5.2 Suggestions for future work ......................................................................................138
References ......................................................................................................................141
APPENDIX A. ................................................................................................................160

ix
List of Tables
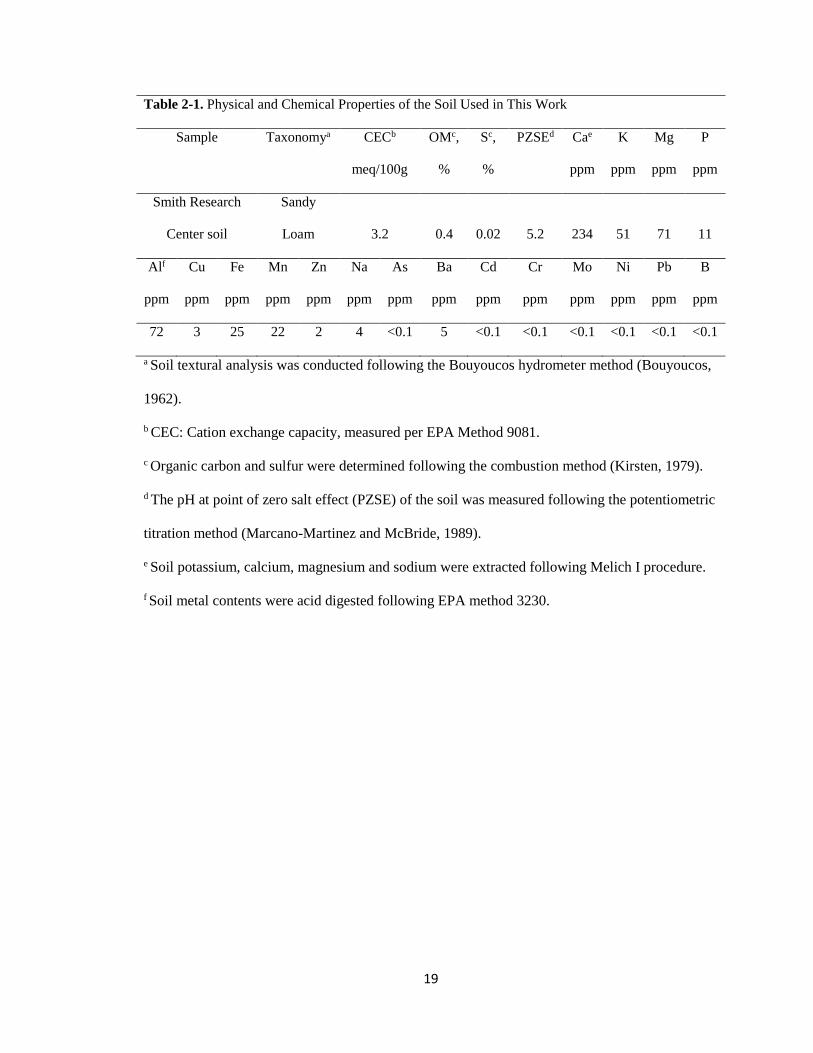
Table 2-1. Physical and chemical properties of the soil used in this work .......................19
Table 2-2. CMC surface density on MnO2 .......................................................................36
Table 2-3. Retarded rate model parameters ......................................................................37
Table 3-1. Physical and chemical properties of the three soils used in this work ............63
Table 3-2. Experiment conditions of MnO2 transport tests conducted at various
velocities and concentrations in saturated columns packed with different
porous media ....................................................................................................65
Table 3-3. Simulation parameters obtained by fitting breakthrough curves of column
experiments to the model .................................................................................75
Table 3-4. Degradation efficiency of CMC-MnO2 treated columns .................................87
Table 4-1. Salient properties of ion exchange resins used in this study ..........................103
Table 4-2. Reaction rate constants for HDC of TCS catalyzed by resin supported Pd ...117

x
List of Figures
Figure 1-1. Structure of 17-estradiol (E2) and triclosan (TCS) ........................................4
Figure 2-1. (a) Hydrodynamic size distribution and mean hydrodynamic diameter of
MnO2 nanoparticles prepared at various CMC:MnO2 molar ratios;
(b) MnO2 stability measured as normalized Mn concentration (C/C0) as a
function of time through sedimentation tests ..................................................27
Figure 2-2. Photographs and TEM images of: a) non-stabilized MnO2, and b) CMC-
stabilized MnO2 particles. Pictures were taken 30 minutes after synthesis.
[MnO2] = 810-4 M (0.07 g/L) for both cases, and CMC/MnO2 molar ratio
= 1.3910-3 for case b) ...................................................................................28
Figure 2-3. a) Oxidative degradation of E2 in water by MnO2 particles prepared in the
presence of various concentrations of CMC and at a fixed MnO2 dosage of
210-5 M. b) Linearized first-order plot for non-stabilized and
CMC-stabilized degradation rate data. .........................................................31
Figure 2-4. Batch kinetic profiles of E2 degradation in consecutive spikes of E2 using
the same MnO2: a) non-stabilized MnO2; b) CMC-stabilized MnO2. ..........32
Figure 2-5. Effect of pH on oxidative removal of E2 in water by: a) Non-stabilized
MnO2, and b) CMC-stabilized MnO2. ..........................................................38
Figure 2-6. Comparing E2 removal rates of non-stabilized and CMC-stabilized MnO2
particles at pH 5, 6, 7, and 8. ..........................................................................39
Figure 2-7. a) E2 sorption kinetics with a sandy loam soil (initial aqueous [E2] =
410-6 M). b) Effect of CMC on desorption of E2 from the soil.
In figure b) Mt: E2 remaining in soil at time t. ...............................................43
Figure 2-8. Degradation of aqueous and soil-sorbed E2 at various dosages (210-5 to
210-4 M) of MnO2. .......................................................................................45
Figure 2-9. Degradation of soil-sorbed E2 with bare and CMC-stabilized MnO2
particles: a) in the whole system, and b) in the aqueous phase ....................47
Figure 2-10. Zeta potential of three different suspensions containing: soil exudates,
non-stabilized MnO2 and CMC-stabilized MnO2, respectively ....................48
xi
Figure 2-11. Oxidation kinetics of E2 in water with or without soil extracts: a) non-
stabilized MnO2, and b) CMC-stabilized MnO2. ..........................................51
Figure 2-12. Degradation of E2 in water by CMC-stabilized and non-stabilized MnO2
in the presence of added cations: a) [Mn2+] = 0.01 M, and
b) [Ca2+] = 0.01 M. .........................................................................................52
Figure 2-13. Degradation of E2 in water by CMC-stabilized and non-stabilized MnO2
in the presence of humic acid (HA): a) non-stabilized MnO2, and b)
CMC-stabilized MnO2. ...................................................................................53
Figure 3-1. Column experiment setup. ..............................................................................66
Figure 3-2. Photographs and TEM images of: (a) non-stabilized MnO2, and (b)
CMC-stabilized MnO2 particles. ....................................................................70
Figure 3-3. Measured and fitted breakthrough curves of a KBr tracer and CMC-MnO2
nanoparticles through: (a) SL1 soil, (b) SL2 soil, (c) SL3 soil, and nanoparticle
retention profiles (c) obtained after MnO2 transport through the three soils. ...........76
Figure 3-4. Measured duplicate breakthrough curves of CMC-MnO2 nanoparticles
through: (a) SL1 soil, (b) SL2 soil, and (c) SL3 soil. ...................................77
Figure 3-5. MnO2 sorption kinetics in three soils. ............................................................78
Figure 3-6. Breakthrough curves of CMC-MnO2 nanoparticles through SL2 soil at
different pore velocities. ..............................................................................81
Figure 3-7. Breakthrough curves of different concentrations of CMC-MnO2
nanoparticles through SL2 soil. ......................................................................83
Figure 3-8. Elution histories of E2 from soils when subjected to a background CMC
solution and a suspension of CMC-MnO2 nanoparticles: (a) SL1 soil
(E2 = 0.0019 mg-E2/g-soil), (b) SL2 soil (E2 = 0.0065 mg-E2/g-soil),
and (c) SL3 soil (E2 = 0.0104 mg-E2/g-soil). ................................................88
Figure 3-9. Duplicate of elution histories of E2 from SL2 soil when subjected to a
background CMC solution and a suspension of CMC-MnO2
nanoparticles. ..................................................................................................89
Figure 3-10. E2 (a) sorption kinetics with three soils (initial aqueous [E2] = 410-6 M),
and successive desorption kinetics in (b) SL1 soil, (c) SL2 soil, and
(d) SL3 soils. ..................................................................................................90
Figure 3-11. Elution histories of E2 from SL2 soil at different MnO2 injection pore
velocities. ........................................................................................................93

xii
Figure 3-12. Elution histories of E2 from SL2 soil under different MnO2 injection
concentrations. ................................................................................................95
Figure 4-1. XRD patterns of bare resins, freshly prepared resin-supported Pd
catalysts, and used catalysts after 8 consecutive runs of HDC of TCS.
Bragg angles (2θ) from 30 to 80 were scanned at scan rate of 4/min. .....111
Figure 4-2. SEM images of resin-supported Pd catalysts: cross-section of
(a) IRA-900 and (b) IRA-958 at low magnification, and internal of
(c) IRA-900 and (d) IRA-958 at high magnification. ...................................112
Figure 4-3. Radial distribution of Pd at the cross-section of the (a) IRA-900 and (b)
IRA-958 analyzed by EDXS. The R/R0>0 and R/R0<0 scanning positions
are along the radius in right and upper direction shown in Figure 4-2. Pd
distribution was plotted as Pd to Cl atomic percentage. ...............................113
Figure 4-4. Kinetic profiles of catalytic HDC of TCS with different Pd loadings on
resin (a) IRA-900 and (b) IRA-958, and linearized pseudo first-order plot
for (c) IRA-900 and (d) IRA-958. ................................................................118
Figure 4-5. TCS adsorbed and degraded in the process of catalytic HDC with (a) 0.2
wt.% Pd/IRA-900, (b) 0.2 wt.% Pd/IRA-958, (c) 2.0 wt.% Pd/IRA-900,
and (d) comparison of the degradation rate of TCS over catalysts of
0.2 wt.% Pd loading on two resins. ...........................................................121
Figure 4-6. Catalytic HDC of TCS in eight consecutive batch tests where the Pd
catalysts supported on resins (a) IRA-900 and (b) IRA-958 were
repeatedly used, and linearized pseudo first-order plot for (c) IRA-900
and (d) IRA-958. ...........................................................................................124
Figure 4-7. HDC of TCS using resin (a) IRA-900 and (b) IRA-958 supported Pd
catalysts in the presence of various concentrations of humic acid, and
HDC of TCS using (c) Pd/IRA-900 and (d) Pd/IRA-958 supported
catalysts in presence of 30 mg/L TOC through six consecutive runs. ..........127
Figure 4-8. GC/MS chromatogram of TCS HDC byproducts. ........................................130
Figure 4-9. Schematic representation for catalytic HDC of TCS ....................................131
Figure 4-10. Concentration histories of Cl- in aqueous phase, Cl- adsorbed on resins,
and TCS-Cl (i.e., TCS-bounded Cl) during HDC of TCS using
IRA-958 supported Pd catalysts. ..................................................................132

1
CHAPTER 1. BACKGROUND AND INTRODUCTION
1.1 The emergence of PPCPs in environment
Over the last decades, pharmaceuticals and personal care products (PPCPs) have
been receiving increasing attention due to their widespread usage and continuous release
into the environment (Jiang et al., 2013; Kasprzyk-Hordern et al., 2009; Ternes, 1998).
The most common PPCPs include anti-inflammatories, antibiotics, cardiovascular
pharmaceuticals, antiepileptic drugs, and hormonal compounds. PPCPs are considered as
emerging pollutants because as analytical technology improves, the ability to detect
contaminants in water at very low concentration has improved. This has brought these
contaminants into public view, recently. In addition, these contaminants still remain
unregulated or are currently undergoing a regularization process (Pal et al., 2010). The
increasing attention to PPCPs has induced interests to investigate the source, behavior,
fate, risk, and control of such emerging pollutants (Drewes et al., 2003; Khanal et al.,
2006; Pal et al., 2010).
Most PPCPs are known to have biological effects, but only limited information
has been obtained by quantifying their potential ecotoxicological impacts. One typical
approach is to conduct toxicity tests using various organisms, for instance, fish,
invertebrates, algae, and also human embryonic cells (Pal et al., 2010). The sex hormones
inculding endogenous estrone (E1), 17β-estradiol (E2), estriol (E3), as well as synthetic
17α-ethinylestradiol (EE2) are generally viewed to be of utmost concern (Kolpin et al.,
2002; Shore and Shemesh, 2003; Diamanti-Kandarakis et al., 2009). Their associated

2
adverse effects include abnormal development (e.g., malformations, sex reversal in male
species), reproductive disorders (e.g., declines in the quality and quantity of sperm
production), and cancers (e.g., breast, prostate, and testicular).
Other PPCPs, such as antibiotics, cardiovascular drugs, and antineoplastics were
also proven to have ecotoxicological effects. One of the most commonly used broad-
spectrum antimicrobials, triclosan (5-chloro-2-(2,4-dichlorophenoxy)phenol, TCS), is
concerned as an endocrine disrupting chemical and reported to have adverse effects on
thyroid hormone homeostasis (Veldhoen et al., 2006). Moreover, TCS, which was found
to accumulate in various aquatic organisms, is highly toxic to certain types of algae and
fish (Orvos et al. 2002; Ishibashi et al., 2004). As an antibacterial, TCS may induce the
bacterial resistance development (McMurry et al., 1998; Halden et al., 2014). Of
particular concern is sewage sludge, where an abundance of pathogens and multiple
antimicrobials coexist creating a large risk of drug resistance for the pathogens.
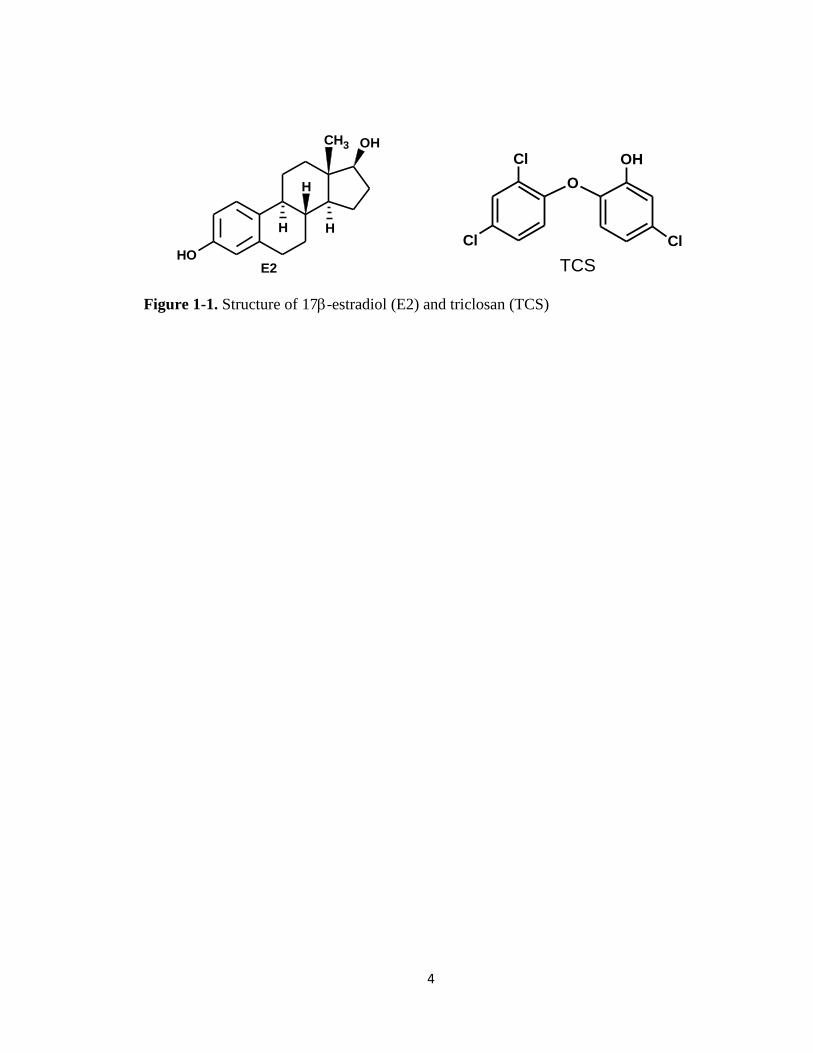
In this research, the focus was aimed toward 17-estradiol (E2, C18H24O2), a
naturally produced steroid hormone, and triclosan (TCS, C12H7Cl3O2), a broad-spectrum
antimicrobial. The molecular structures of both E2 and TCS are shown in Figure 1-1. E2
is the major concern within steroid hormone research because it exerts physiological
effects at a lower concentration than other steroid hormones. E2 can be detected above
their lowest observable effect level (LOEL) for fish (10 ng/L) in the environment (Shore
and Shemesh, 2003). TCS is one of the worldwide largest consumed PPCPs, which is
used as a preservative or an antiseptic agent in many personal care (e.g., toothpaste, soaps,
deodorants, shampoos, and cosmetics) and household (e.g., plastic additives) products.
TCS annual usage has been estimated higher than 300 t in the USA and 450 t in the

3
Europe (Halden and Paull, 2005; SCCS, 2010). TCS is an authorized ingredient used in
cosmetic products and other household products in USA and Europe (Bedoux, et al.,
2012).
4
Figure 1-1. Structure of 17-estradiol (E2) and triclosan (TCS)
CH3 OH
H
HH
OHE2
O
Cl
Cl
OH
Cl
TCS

5
1.2 The source and occurrence of E2 and TCS
PPCPs are frequently detected in waste water treatment plant effluent (WWTP)
and in sewage treatment plants (STP), surface water and groundwater. Generally, the
concentration of pharmaceuticals decreases from the effluent of WWTP/STP to the
freshwater and groundwater (Li, 2014). This may be due to pharmaceuticals that are
concentrated in WWTP/STP and the current waste water treatment could not effectively
remove these contaminants. In freshwater, natural processes, such as photolysis, sorption,
volatilization, and dispersion can occur to attenuate pharmaceuticals. Moreover, in
groundwater, after the sand filtration, sorption, and microbiology degradation, the
concentration of pharmaceuticals can be lowered (Li, 2014).
Municipal wastewater is considered one of the main sources of hormones in
aquatic systems (Ternes et al., 1999), and the land application of animal wastes releases
significant amounts of hormones into soil and groundwater (Shore and Shemesh, 2003).
The U.S. Geological Survey reported that various reproductive hormones were detected
in 40% of the 139 streams across 30 states (Kolpin et al., 2002), with maximum and
median concentrations of 93 ng/L and 9 ng/L for E2, respectively. The maximum effluent
concentration in German and Canadian sewage treatment plant ranged from 3 ng/L to 64
ng/L for E2 (Ternes et al., 1999). Poultry litters contain substantial amounts of estrogen
and testosterone. Shore and Shemesh (2003) reported that the average concentrations of
estrogen and testosterone in laying hen litter were 533 µg/kg and 254 µg/kg, respectively.
The land application of broiler litter has been found to greatly increase the E2
concentration in soil to 675 ng/kg from a background value of 55 ng/kg (Finlay-Moore et

6
al., 2000). Shore and Shemesh (2003) also reported that leachates from chicken manure
stockpiles contained 730 ng/L of estrogen and 630 ng/L of testosterone.
Most hormones are detected at very low concentrations in groundwater due to
their easily binding to soil; however, low concentration of estrogens were reported to
break through porous media and release into groundwater, causing long-term threats to
ecosystems. Kolodziej et al. (2004) detected 6.3 ng/L of E2 in a monitoring well located
downstream of a waste lagoon. The analysis of 112 samples in 59 groundwater sites in
Austria detected E2 in more than 50% of the samples with a maximum concentration of
0.79 ng/L (Hohenblum et al., 2004). Following rainfall, a large amount of estrogens were
found in the runoff from field discharges. Nichols et al. (1998) reported 1-3 µg/L of
estrogen and testosterone in rainwater runoff.
As a pharmaceuticals and personal care products (PPCPs) ingredient, substantial
amounts of TCS were discharged into WWTPs. Studies on the fate of TCS during
wastewater treatment indicate that substantial TCS can be removed by wastewater
treatment plants with a high efficiency of 80%-96% (Bester, 2003; Winkler et al., 2007).
However, residues of TCS are still detected in effluents, leading to discharge in surface
water. The U.S. Geological Survey reported that TCS was among the seven most
frequently detected organic contaminants in 139 streams sampled across 30 states with
the median concentration of 0.14 µg/L (Kolpin et al., 2002). In addition, the removed
TCS by activated sludge was not degraded by biomass, the antimicrobials distribute
themselves into carbon- and lipid-rich sewage sludge, and accumulate in the biosolids
(Winkler et al., 2007; Heidler, 2007). In 2004, over seven million tons of biosolids were
generated in US, and more than 55% of which were land applied in agricultural soils
7
(McClellan and Halden, 2010). Consequently, an excess amount of TCS were released
into the soil and groundwater through biosolid application.
A US EPA National Sewage Sludge Survey reported TCS was also the most
abundant PPCP in 110 biosolids samples collected from WWTPs across 32 states with its
mean concentration of 12.6 mg/kg (McClellan and Halden, 2010). Biosolids application
is the main source of TCS occurrence in soil and groundwater. TCS has been found
relatively persistent in agricultural soil after biosolids amendment. Lozano et al. (2010)
observed a half-life of 107.4 days for TCS in a biosolids applied agricultural field. Barnes
et al. (2008) detected TCS in 14.9 % of 47 groundwater sites in US. Data from UK
Environmental Agency show that out of 22 monitored groundwater sites, 100% contained
TCS, and the maximum concentration was detected to be 2.11 µg/L (Stuart et al., 2012).
1.3 Current treatment methods for PPCPs
1.3.1 Adsorption on activated carbon
Adsorption by activated carbons (AC) is commonly used for controlling taste and
odor in drinking water. This technology has been proven to be effective in removing
micropollutants and antibiotics (Ji et al., 2010; Mestre et al., 2014). There are numerous
studies on the adsorption mechanisms of aromatic compounds by AC, such as the
following, have been proposed: 1) dispersive interactions between π electrons of the
aromatic ring and π electrons of the graphene planes, 2) coupling of the aromatic ring of
the organic compound function as π-electron-acceptor with the highly polarized graphene
surface function as π-electron-donor to form electron-donor-acceptor (EDA) interactions,
3) electrostatic interactions and formation of hydrogen bonds (Rivera-Utrilla et al., 2013).
Due to various types of compounds being involved in the adsorption process, it is not
8
possible to give a general adsorption mechanism. Ji et al. (2010) studied adsorption of
three antibiotics, sulfamethoxazole, tetracycline, and tylosin on synthesized micro- and
mesoporous carbons and commercial microporous AC, and found the antibiotic molecule
size and AC pore size, shape and structure are important factors to affect adsorption
kinetics and isotherms. It was also found among the three antibiotics tested, that
tetracycline obtained the strongest adsorption on AC. This result was attributed to the
multiple adsorption sites (phenol, enone, and protonated amino) in the tetracycline
molecule. Furthermore, Mendez-Diaz et al. (2010) studied the kinetics of adsorption of
three nitroimidazole antibiotics on three ACs and found hydrophobic interactions
appeared to govern the kinetics of the adsorption process.
1.3.2 Ozone oxidation
The recent interests in using ozone oxidative removal of pharmaceuticals includes
application of O3, O3/OH- and O3/H2O2 (Huber et al., 2003; Rosal et al., 2008). Huber et
al. (2003) investigated the oxidation of pharmaceuticals during conventional ozonation
and advanced oxidation process (AOPs), which was based on the generation of free
radicals (·OH). Among the selected pharmaceuticals (bezafibrate, carbamazepine,
diazepam, diclofenac, 17α-ethinylestradiol, ibuprofen, iopromide, sulfamethoxazole, and
roxithromycin), it is found that some of the named analgesics can be completely
transformed during conventional process with the second order rate constant kO3 >5104
M-1s-1, while other pharmaceuticals cannot, such as diazepam (kO3 =0.75 0.15 M-1s-1),
ibuprofen (kO3 =9.6 1.0 M-1s-1), and iopromide (kO3 <0.8 M-1s-1). When the free
radical ·OH is involved, the rate constants kOH range from 3.3 to 9.8109 M-1s-1, which is
about two or three times faster than conventional ozonation. Rosal et al. (2008)

9
investigated the mineralization of wastewater from the secondary clarifier of urban and
domestic WWTP. When using ozone in alkaline conditions (O3/OH- pH at 8), a TOC
decay of 15% was obtained. Conversely, when injecting hydrogen peroxide (O3/H2O2),
which is AOP, the degree of mineralization reached over 90%. The results indicated the
highly reactive hydroxyl radical (·OH) can successfully attack numerous pharmaceutical
molecules and achieve effective removal.
1.3.3 UV radiation
High efficiency oxidative removal of organic compounds using hydroxyl radicals
has attracted researchers’ interests to explore photochemical degradation. In nature, many
organic compounds can decompose via photochemical reaction under solar light. The
most widely used wavelength for photolysis is 200-400 nm, which falls in the ultraviolet
spectrum region (Rivera-Utrilla et al., 2013). Some compounds are degraded by direct
photolysis as the molecules absorb a certain type of radiation and reach an excited state,
while other compounds are degraded by radical generation, known as indirect photolysis
(Rivera-Utrilla et al., 2013).
Most pharmaceuticals are photolytic, as they generally contain aromatic rings,
heteroatoms, and other functional groups that allow absorption of solar radiation to
conduct photodegradation (Puma et al., 2010; Rosenfeldt and Linden, 2004; Ryan et al.,
2011). Ryan et al. (2011) studied the photolysis of two antibiotics (sulfamethoxazole and
trimethoprim) in wastewater treatment plant effluent. They suggested sulfamethoxazole
and trimethoprim removal was enhanced in wastewater effluent, due to indirect
photolysis. In the wastewater effluents, photolysis can be divided into direct photolysis
(48% removal for sulfamethoxazole, 18% removal for trimethoprim), reaction with

10
hydroxyl radicals (36% and 62% for sulfamethoxazole and trimethoprim, respectively),
and reaction with triplet excited effluent organic matter (16% and 20% for
sulfamethoxazole and trimethoprim, respectively). Rosenfeldt and Linden (2004)
investigated the degradation of three endocrine disrupting chemicals (EDCs), bisphenol
A, ethinyl estradiol, and E2 by UV radiation photolysis and the UV/H2O2 AOP. They
used both monochromatic low-pressure (LP) UV lamps and polychromatic medium-
pressure (MP) UV lamps for the photolysis, and found that polychromatic MP UV
radiation was more effective for direct photolysis than conventional LP VU lamps. In all
cases, the EDCs were more effectively degraded using UV/H2O2 than direct UV
photolysis treatment. Lin and Reinhard (2005) found a common anti-inflammatory
medication, naproxen, can be photodegraded. However, degradation products are more
toxic than original naproxen. In addition, the antibiotic triclosan and triclocarban were
also found to produce highly toxic byproducts such as chlorodioxins and chloroanilines
under sunlight (Aranami and Readman, 2007).
1.3.4 Electro-oxidation
Currently, one of the most popular oxidation techniques for wastewater treatment
is electrochemical oxidation. This technique usually treats the pollutants in an electrolytic
cell by: 1) direct electron transfer to the anode, and 2) indirect oxidation with
heterogeneous radicals formed from water decompose at the anode, such as OH radical,
and active oxygen.
For water treatment, the only disadvantage of electro-oxidation is the high energy
requirement. Usually, high cell voltages are a prerequisite to achieve oxidation of both
pollutants and water, maintaining the anode activity. The anode material has an important

11
influence on the selectivity and efficiency of the process which will result in either
electrochemical conversion or electrochemical combustion. The electrochemical
conversion is to transform the original organic pollutants into higher oxidative
compounds by chemisorbed active oxygen. The electrochemical combustion could
mineralize the organic pollutants by physisorbed OH.
Feng et al. (2010) used Ti/SnO2 as an anode to electro-oxidative degradation of
17-ethinylestradiol, conducting at 60 mA for 480 min, and achieved a 79% of 17-
ethinylestradiol removal. Yoshihara and Murugananthan (2009) studied E2 electro-
oxidation on boron-doped diamond anode with a 350 mA electric current for 270 min,
and detected almost 94 % of the initial E2 was transformed.
1.3.5 Soil-aquifer treatment (SAT)
The use of secondary or tertiary treated waste water effluent to recharge ground
water is known as soil-aquifer treatment (SAT) (Mansell and Drewes, 2004). SAT is a
way to solve the water shortage problem by pumping reclaimed wastewater from
recovery wells near the recharge area and delivering to the arid part of the country for
unrestricted agricultural irrigation (Arye et al., 2011). SAT removes of organic
contaminants, nutrients, and pathogens through physical filtration, adsorption to soil
particles, microbial biotransformation, and dilution with groundwater (Laws et al., 2011).
SAT attracts more interests from researchers because it requires minimal energy and
chemical input, as well as it replenishes groundwater supplies, particularly in arid and
semiarid regions (Mansell and Drewes, 2004). Arye et al. (2011) investigated fate and
transport of carbamazepine (CBZ) in SAT in Israel. The results showed adsorption and
filtration of CBZ only occurred in the upper soil layers (0-25 cm), but not in the deeper

12
layers (25-150 cm). The monitoring well analysis revealed the concentration of CBZ
decreased from 1094 166 ng/L to 560 175 ng/L after the SAT. Laws et al. (2011)
studied the attenuation of 17 contaminants of emerging concern (CECs) during a surface-
spreading aquifer recharge and found the concentration of all compounds were reduced
after SAT, with 11 of the compounds attenuated by > 80% after 60 days of travel.
1.3.6 Microbial degradation
The potential of PPCPs to undergo biotransformation is an important pathway for
them to “self-degrade” in environment. Biodegradation of PPCP compounds may have
following pathways: 1) mineralization, 2) transformation to more hydrophobic
compounds, which partition onto the soil, and 3) transformation to more hydrophilic
compounds, which remain in the groundwater. To date, most of the studies on
biodegradation of PPCPs mainly focus on laboratory studies to identify the possible
biodegradation pathways for PPCPs removal (Onesios et al., 2009).
The laboratory studies of PPCP removal often result in discrepant removal
efficiencies, and the influential conditions include PPCPs concentrations, primary
substrate concentrations, incubation times, and microbial inoculum sources (Onesios et
al., 2009). For instance, a study on biodegradation of an anticancer drug, 5-fluorouracil,
with an initial concentration > 800 mg/L, yielded a removal of 2% (Kummerer and Al-
Ahmad, 1997), whereas another study on the same chemical with a starting
concentration > 50 µg/L, achieved a 50% removal (Yu et al, 2006).
1.3.7 Nanoparticle remediation
Recently, application of nanoparticles for in-situ remediation of soil/groundwater
has attracted significant interests. The application of nanoparticles in the environmental

13
field offers many advantages for in-situ remediation. First, nano-scale particles have
larger surface area, thus offering more reactive sites for binding to target compounds.
Because many environmental reactions (e.g. sorption, redox, ion exchange) with particles’
participation are a surface-mediated process, increasing the surface area will thus increase
the reaction rate and reduce remediation time. Second, nanoparticles have high transport
capacity and can easily gain access to contaminant plumes deep in the ground or
underneath built infrastructures, and thus, potentially reduce remediation cost. Third,
injection of nanoparticles to contaminated zones is a process easy controllable and known
for causation of less environmental disruption.
Similar to biodegradation, nanoparticle technology has been used in laboratory
tests to degrade PPCPs (Joo and Zhao, 2008). However, no studies have been done to
apply in field remediation. The most mature in-situ application is to use zero valent iron
(ZVI) for remediation of chlorinated solvents (Bennett, et al., 2010; He et al., 2010; Wei
et al., 2010).

14
CHAPTER 2. DEGRADATION OF AQUEOUS AND SOIL-SORBED
ESTRADIOL USING A NEW CLASS OF STABILIZED MANGANESE OXIDE
NANOPARTICLES*
2.1 Introduction
Endocrine disrupting chemicals (EDCs) have been known to interfere with
hormonal and homeostatic system functions (Diamanti-Kandarakis et al., 2009). In recent
years, there has been a growing interest in steroidal estrogen hormones as they have been
widely detected in surface and ground waters (Kolpin et al., 2002). Of particular
environmental concern are endogenous estrone (E1), 17β-estradiol (E2), and estriol (E3)
released with human and animal wastes, as well as synthetic 17α-ethinylestradiol (EE2)
(Kolpin et al., 2002; Shore and Shemesh, 2003). The associated adverse effects include
abnormal development (e.g., malformations, sex reversal in male species), reproductive
disorders, and cancers (Diamanti-Kandarakis et al., 2009). Exposure to trace
concentrations (even at ng/L) of hormones can result in serious physiological
consequences for some aquatic lives. For instance, the male Japanese medaka was found
to produce female specific proteins when exposed to E2 at 5 ng/L (Tabata et al., 2001).
Municipal wastewater is considered one of the main sources of hormones in the
aquatic systems (Ternes et al., 1999), and the land application of animal wastes releases
significant amounts of hormones into soil and groundwater (Shore and Shemesh, 2003).
* This chapter was published as Han et al., 2015. Permission for reuse in dissertation has been
obtained from Elsevier.

15
The U.S. Geological Survey reported that various reproductive hormones were detected
in 40% of the 139 streams across 30 states (Kolpin et al., 2002), with maximum and
median concentrations of 93 and 9 ng/L for E2, respectively. The maximum effluent
concentration in a German and Canadian sewage treatment plant ranged from 3 to 64
ng/L for E2 (Ternes et al., 1999). Poultry litters contain substantial amounts of estrogen
and testosterone. Shore and Shemesh (2003) reported that the average concentrations of
estrogen and testosterone in laying hen litter were 533 µg/kg and 254 µg/kg, respectively.
The land application of broiler litter has been found to greatly increase the E2
concentration in soil to 675 ng/kg from a background value of 55 ng/kg (Finlay-Moore et
al., 2000). Shore and Shemesh (2003) also reported that leachates from chicken manure
stockpiles contained 730 ng/L of estrogen and 630 ng/L of testosterone.
To mitigate the health and environmental impacts, researchers have explored
various treatment processes to degrade these emerging contaminants, including ozonation,
UV radiation, and chemical oxidation (Huber et al., 2003; Jiang et al., 2009; Rosenfeldt
and Linden, 2004). Yet, knowledge has been lacking on degradation of soil-sorbed
estrogen.
The conventional MnO2 is typically a porous particulate material, which has a
specific surface area from dozens to hundreds of m2/g and a low pH of point of zero
charge (PZC) of 2.25 (Murray, 1974). MnO2 has been known to be an oxidizing agent
effective for a range of organic contaminants (Clarke and Johnson, 2010; Lin et al., 2009;
Zhang and Huang, 2003), and has been shown to be promising for estrogen degradation
in water (Jiang et al., 2009; Xu et al., 2008). E2 oxidation by MnO2 has been known to

16
proceed via Eqs. (2-1) and (2-2) to give estrone (E1) and 2-hydroxyestradiol (Jiang et al.,
2009):
C18H24O2+MnO2+2H+ → C18H22O2+Mn2++2H2O (2-1)
C18H24O2+MnO2+2H+ → C18H24O3+ Mn2++H2O (2-2)
The oxidative transformation was shown to lower the estrogenic activities of the
parent E2 (Jiang et al., 2010; Xu et al., 2008). Typically, the process involves a first rapid
adsorption of the solutes on the particle surface followed by the oxidation reaction.
Consequently, the degradation effectiveness can be influenced by factors that affect
adsorption and reactivity of MnO2, such as particle size, surface area, surface charge, and
accessibility of the reactive sites. In addition, environmental factors (e.g. pH, temperature
and co-solutes) also influence the oxidation power of MnO2 (Xu et al., 2008; Zhang and
Huang, 2003). Mashtare et al. (2011) reported that E2 strongly binds to soil, forming soil-
bound residues, and E2 sorption is correlated to the soil organic carbon with a high
logKOC of 3.140.16. Lee et al. (2003) studied sorption and dissipation of testosterone,
E2, and EE2 in soil and sediment, and found that the hormones can be transformed in
aerobic soil and sediment slurries. Sheng et al. (2009) reported MnO2 minerals in natural
soil were responsible for dissipation of E2, indicating that MnO2 holds the potential for
degradation of soil-sorbed E2. In general, soil-adsorption limits the chemical availability
and degradation rate, and various soil exudates may inhibit the reactivity of nanoparticles
(Zhang et al., 2011).
Laboratory and field experiments have shown that stabilized nanoparticles can be
delivered in soil and facilitate in-situ remediation of contaminated soil and groundwater
by direct injection of the nanoparticles into contaminated source zones (e.g., He and Zhao,

17
2005; 2007; He et al., 2007; 2009; 2010; Xiong et al., 2009). He et al. (2009; 2010) tested
the soil transportability of carboxymethyl cellulose (CMC) stabilized zero-valent iron
(ZVI) nanoparticles through bench-scale and field experiments. They observed that the
stabilized nanoparticles can be directly injected into a sandy aquifer (hydraulic
conductivity 1.9810-3 cm/s) under field conditions at an injection pressure less than 5 psi.
They found that for a given soil, the maximum travel distance is a function of the
injection pressure, and the delivered nanoparticles become virtually immobile under
natural groundwater flow conditions. The delivered nanoparticles were able to effectively
degrade soil-sorbed TCE and PCE in the aquifer (He et al., 2010; Su et al., 2012). To
facilitate in-situ degradation of soil-sorbed E2 in aquifers, the desired MnO2
nanoparticles will need to meet some key criteria: 1) they must be soil deliverable, 2)
they must be reactive toward the target contaminants, and 3) they must be environmental
friendly.
The overall goal of this work was to develop and test a new class of stabilized
MnO2 nanoparticles toward in-situ oxidation of soil-sorbed E2. The specific objectives
were to: 1) Synthesize and characterize a new class of stabilized MnO2 nanoparticles
using CMC as a stabilizer, 2) Test the effectiveness of the nanoparticles for oxidation of
aqueous and soil-sorbed E2, 3) Determine the effects of pH, CMC concentration, soil
exudates on oxidation of E2, and elucidate the underlying mechanisms, and 4)
Demonstrate the soil transportability of the nanoparticles.
2.2 Materials and methods
2.2.1 Materials
18
The following chemicals of analytical or higher grade were used as received: 17β-
estraidol (C18H24O2, E2, purity >97%, Spectrum Chemical Mfg Corp., New Brunswick,
NJ, USA), manganese chloride tetrahydrate (MnCl2·4H2O, Alfa Aesar, Ward Hill, MA,
USA), potassium permanganate (KMnO4, Acros Organics, Morris Plains, NJ, USA),
sodium carboxymethyl cellulose (M.W. = 90,000, Acros Organics), sodium acetate
trihydrate (C2H3NaO2·3H2O, Mallinckrodt Pharmaceuticals, St. Louis, MO, USA) and
sodium phosphate monobasic monohydrate (NaH2PO4·H2O, Fisher scientific, Fairlawn,
NJ, USA). Methanol (CH4O, Alfa Aesar), acetonitrile (CH3CN, EMD Millipore, Billerica,
MA, USA) and acetic acid glacial (C2H4O2, EMD Millipore) were of HPLC grade (>99%
purity). A stock solution of 17β-estraidol was prepared at 510-3 M in methanol. All other
solutions were prepared using deionized water (18.2 MΩ-cm).
A sandy loam soil was used in all soil-related tests in this study. The soil was
obtained from the E.V. Smith Research Center of Auburn University at Shorter, AL.
Before use, the soil was screened through a standard 2 mm sieve, and then washed with
tap water ten times (5 days) to remove the fine colloids and portion of water soluble
compositions that were hardly separated from water by normal centrifugation. The
washed soil sample was then air-dried, thoroughly mixed, and then stored at room
temperature (20±1˚C) for use. Soil texture, pH, compositions and cation exchange
capacity (CEC) were analyzed by the Auburn University Soil Testing Laboratory. Table
2-1 provides detailed soil properties and analytical methods.
19
Table 2-1. Physical and Chemical Properties of the Soil Used in This Work
Sample Taxonomya CECb
meq/100g
OMc,
%
Sc,
%
PZSEd Cae
ppm
K
ppm
Mg
ppm
P
ppm
Smith Research
Center soil
Sandy
Loam 3.2 0.4 0.02 5.2 234 51 71 11
Alf
ppm
Cu
ppm
Fe
ppm
Mn
ppm
Zn
ppm
Na
ppm
As
ppm
Ba
ppm
Cd
ppm
Cr
ppm
Mo
ppm
Ni
ppm
Pb
ppm
B
ppm
72 3 25 22 2 4 <0.1 5 <0.1 <0.1 <0.1 <0.1 <0.1 <0.1
a Soil textural analysis was conducted following the Bouyoucos hydrometer method (Bouyoucos,
1962).
b CEC: Cation exchange capacity, measured per EPA Method 9081.
c Organic carbon and sulfur were determined following the combustion method (Kirsten, 1979).
d The pH at point of zero salt effect (PZSE) of the soil was measured following the potentiometric
titration method (Marcano-Martinez and McBride, 1989).
e Soil potassium, calcium, magnesium and sodium were extracted following Melich I procedure.
f Soil metal contents were acid digested following EPA method 3230.

20
2.2.2 Preparation of CMC-stabilized MnO2 particles
CMC-stabilized MnO2 particles were synthesized by modifying to the classical
Murray’s method (Murray, 1974) in the presence of CMC. In brief, a 55.6 mg/L CMC
solution and a 4 mM MnCl2 solution were prepared separately and purged with purified
N2 gas for 20 minutes to remove dissolved oxygen (DO). Then, 3 mL of the MnCl2
solution was added into 45 mL of the CMC solution under N2 purging to yield a mixture
containing the CMC-Mn2+ complex. Then, 2 mL of a stock solution containing 4 mM of
KMnO4 and 8 mM of NaOH was added into the mixture dropwise while the reactor was
shaken at 250 rpm. After continued mixing/reaction for 20 min, the resulting 50 mL,
410-4 M MnO2 nanoparticles were allowed to stay still and grow for 24 h at room
temperature (21±1˚C) before subsequent tests. For comparison, non-stabilized MnO2
particles were also prepared following the same procedure but without the stabilizer. Our
XRD analysis indicated the synthesized non-stabilized and CMC-stabilized MnO2 are all
largely amorphous, which agrees with the reported observations (Lin et al., 2009; Zhang
and Huang, 2003). According to Murray (1974), the MnO2 particles are amorphous
birnessite (-MnO2).
2.2.3 Degradation of E2 in water
Batch experiments were conducted to test the effectiveness of the nanoparticles
for oxidation of E2 in the aqueous phase. The tests were carried out in duplicate in 1 L
glass flasks sealed with rubber stoppers (the stoppers had no contact with the solution).
Each reactor contained 50 mL of CMC-stabilized or non-stabilized MnO2 suspension
(MnO2 = 410-4 M), which was then diluted by adding 950 mL of a solution buffered by
NaAc/HAc (Ac- = 0.0053 M), yielding a final solution containing 210-5 M of MnO2 and

21
0.005 M of Ac- at pH 5. Oxidation of E2 was initiated by injecting 80 µL of an E2 stock
solution into the reactors, resulting in an initial E2 concentration of 410-6 M. The flasks
were covered by aluminum foil to avoid photolysis and mixed on a plate shaker at 200
rpm and at room temperature (20±1˚C). At selected times, 4 mL each sample was taken
from the reactors using a glass pipette and transferred into a glass tube containing 1 mL
of 0.4 g/L ascorbic acid, which was able to completely dissolve the MnO2 particles, and
thus terminate the reaction. The effectiveness of ascorbic acid for dissolution of MnO2
has been evaluated by Xu et al. (2008) and was confirmed in this work. The samples were
then filtered through an Anotop 10 filter (0.22 µm pore size aluminum-oxide membranes
(Whatman, GE Healthcare Life Sciences, Piscataway, NJ, USA), and 1 mL each of the
filtrate was transferred to 2 mL amber sample vials and analyzed for E2 by HPLC. The
E2 retention by the filters was negligible (<1.2±0.7%, mean±SD). To investigate the pH
effect, the same experiments were also conducted at pH 6, 7 and 8 buffered by
NaH2PO4/NaOH (total PO43- was 0.005 M). Control tests indicated that these buffers
themselves had negligible effect on E2 oxidation. Additional control tests showed that the
presence of 2.5 mg/L of CMC did not degrade any significant E2 without MnO2. To
investigate the effect of soluble soil organic matter, batch kinetic tests were carried out
using a soil-amended background solution, which was prepared by mixing soil with DI
water at a soil: solution ratio of 1(g):10 (mL) for 3 days, and then collecting the
supernatant upon centrifugation followed by filtration through a 0.22 µm membrane.
2.2.4 Soil sorption and desorption kinetics of E2
Soil sorption and desorption kinetic tests of E2 were conducted in 65 mL amber
glass vials sealed with open-top screw caps and PTFE-lined septa. The tests were
22
designed to gauge the sorption/desorption rates and reversibility, and how physical
availability of soil-sorbed E2 affects the subsequent oxidation of E2. Soil samples of 6 g
each were placed in the vials and then wet-autoclaved to eliminate bioactivities
(confirmed through control tests) in the subsequent tests following the method of
Mashtare et al. (2011). Autoclaving had less impact on soil sorption and desorption
properties than chemical sterilization methods (Hildebrand et al., 2006). Our tests
indicated that sodium azide (NaN3), a commonly used bio-inhibiting agent, inhibited E2
oxidation by MnO2, and thus, was avoided in our tests. The sorption tests were initiated
by adding 60 mL of 410-6 M of an E2 solution to each of autoclaved vials at a soil-to-
solution mass ratio of 1:10. The methanol content in the solution was less than 0.1% (v/v),
at which no co-solvent effect is expected on the sorption (Rao et al., 1990). The mixtures
were mixed on an end-over-end rotator (40 rpm) and placed in an incubator at 21±1˚C. At
predetermined times, duplicate vials were sacrificially centrifuged at 2000 rpm (805 g-
force) for 20 min, and the supernatants were then filtered using 0.1 µm Anotop syringe
filters and analyzed for E2 remaining in the aqueous phase by HPLC. Desorption kinetic
tests were carried out with the same batch reactors. Following the sorption equilibrium
(which took one week), the soil and solution were separated through centrifugation at 805
g-force, and desorption of E2 was initiated by replacing ~57 mL (95%) of the
supernatant with the same volume of soil-amended water (prepared by mixing the soil
and water at the same soil:solution ratio). The vials were then mixed on the rotator at 40
rpm in an incubator. At selected times, duplicate vials were sacrificially sampled and
analyzed for E2 in water following the same procedure as in the sorption tests. To assure
mass balance, E2 remaining in soil was extracted using 40 mL methanol in a hot water
23
bath at 70˚C for 4 hours. The recovery of E2 from the sorption and desorption tests was
94±4%.
2.2.5 Degradation of soil-sorbed E2
Following the sorption equilibrium, which resulted in an uptake of E2 of 0.0019
mg/g-soil, the soil and solution were separated by centrifugation. Then, the degradation
kinetic tests for the soil-sorbed E2 were initiated by replacing 95% (57 mL) of the
supernatant in each vial with the same volume of a MnO2 particle suspension. The
mixtures were then placed on an end-over-end rotator (40 rpm) in an incubator at
21±1˚C. At selected sampling times, duplicated vials were centrifuged and the
supernatants were sampled and analyzed for E2 in water in the same manner as described
above. E2 remaining in the soil phase was extracted by the hot-methanol method.
Duplicate control tests were conducted under identical conditions but without MnO2.
2.2.6 Nanoparticle characterization
TEM images of the nanoparticles were obtained using a Zeiss EM10 transmission
electron microscope (Zeiss, Thornwood, NJ, USA) operated at 60 kV. To this end, the
nanoparticle samples were prepared by placing 30 µL each of a freshly synthesized
nanoparticle suspension on a formvar/carbon coated copper grid and then air-dried
overnight. The hydrodynamic particle size and zeta potential of CMC-stabilized MnO2
nanoparticles were determined by dynamic light scattering (DLS) (Zetasizer Nano ZS,
Malvern Instruments Ltd, Malvern, Southborough, MA, USA) at 25˚C, where the
resultant intensity data were converted to the volume-weighted hydrodynamic diameter.
The physical stability of CMC-stabilized MnO2 nanoparticles were tested through
gravitational sedimentation experiments. The particles were prepared at a fixed MnO2
24
concentration of 17.4 mg/L but with various concentrations (1-250 mg/L) of CMC. After
preparation, the particles suspensions were allowed to standstill, and samples were taken
at predetermined times from the top 2 cm of the suspensions and analyzed for the total
Mn using an atomic-absorption spectrophotometer following proper acid dissolution (0.4
g/L ascorbic acid) of the particles.
2.2.7 Analytical methods
E2 was analyzed using an HP Agilent 1100 high-performance liquid
chromatography (HPLC) system equipped with a ZORBAX SB-C18 column
(4.6150mm, 3.5 µm) and by modifying the method by (Havlikova et al., 2006). The
mobile phase was a mixture of 40:60 (v/v) of acetonitrile and phosphoric acid (0.085%)
at a flow rate of 1 mL min-1. A UV detector (G1314A VWD) was operated at a
wavelength of 210 nm, giving a detection limit of 110-7 M. Manganese was analyzed
with a flame atomic-absorption spectrophotometer (AAS) (220FS, Varian, Palo Alto,
CA). Bromide was analyzed using a Dionex Ion Chromatography (DX-120, Dionex,
Sunnyvale, CA), with a detection limit <0.05 mg/L.
2.3 Results and discussion
2.3.1 Effect of CMC/MnO2 molar ratio on particle size
Based on our prior work, CMC molecules can be adsorbed onto the surface of
various kinds of iron-based nanoparticles such as zero-valent iron (He and Zhao, 2007;
He et al., 2007), FeS (Xiong et al., 2009), Fe3O4 (An et al., 2011), and the sorbed CMC
was able to stabilize the nanoparticles through concurrent steric and electrostatic
repulsions that prevent the nanoparticles from aggregation. However, the critical
stabilization concentration (i.e., the minimum CMC concentration required to fully
25
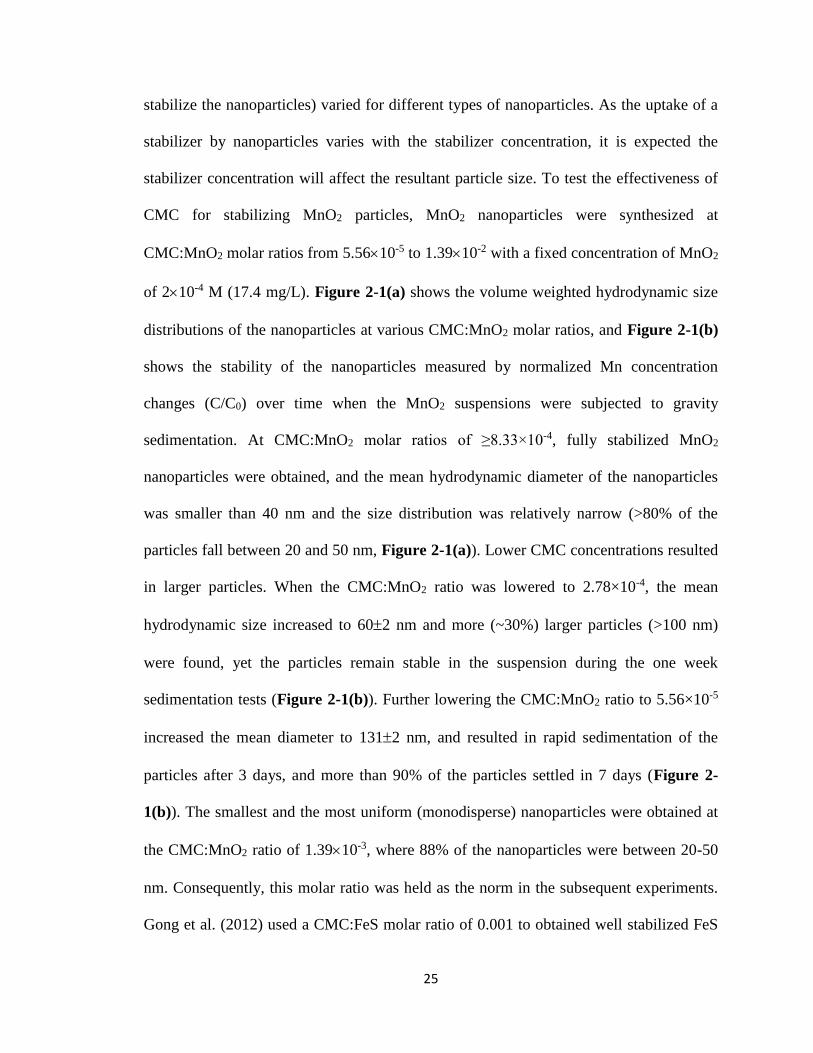
stabilize the nanoparticles) varied for different types of nanoparticles. As the uptake of a
stabilizer by nanoparticles varies with the stabilizer concentration, it is expected the
stabilizer concentration will affect the resultant particle size. To test the effectiveness of
CMC for stabilizing MnO2 particles, MnO2 nanoparticles were synthesized at
CMC:MnO2 molar ratios from 5.5610-5 to 1.3910-2 with a fixed concentration of MnO2
of 210-4 M (17.4 mg/L). Figure 2-1(a) shows the volume weighted hydrodynamic size
distributions of the nanoparticles at various CMC:MnO2 molar ratios, and Figure 2-1(b)
shows the stability of the nanoparticles measured by normalized Mn concentration
changes (C/C0) over time when the MnO2 suspensions were subjected to gravity
sedimentation. At CMC:MnO2 molar ratios of ≥8.33×10⁻⁴, fully stabilized MnO2
nanoparticles were obtained, and the mean hydrodynamic diameter of the nanoparticles
was smaller than 40 nm and the size distribution was relatively narrow (>80% of the
particles fall between 20 and 50 nm, Figure 2-1(a)). Lower CMC concentrations resulted
in larger particles. When the CMC:MnO2 ratio was lowered to 2.78×10⁻⁴, the mean
hydrodynamic size increased to 602 nm and more (~30%) larger particles (>100 nm)
were found, yet the particles remain stable in the suspension during the one week
sedimentation tests (Figure 2-1(b)). Further lowering the CMC:MnO2 ratio to 5.56×10⁻⁵
increased the mean diameter to 1312 nm, and resulted in rapid sedimentation of the
particles after 3 days, and more than 90% of the particles settled in 7 days (Figure 2-
1(b)). The smallest and the most uniform (monodisperse) nanoparticles were obtained at
the CMC:MnO2 ratio of 1.3910-3, where 88% of the nanoparticles were between 20-50
nm. Consequently, this molar ratio was held as the norm in the subsequent experiments.
Gong et al. (2012) used a CMC:FeS molar ratio of 0.001 to obtained well stabilized FeS
26
nanoparticles, and He and Zhao (2007) used a CMC:Fe2+ of 0.0124 to stabilize ZVI
nanoparticles.
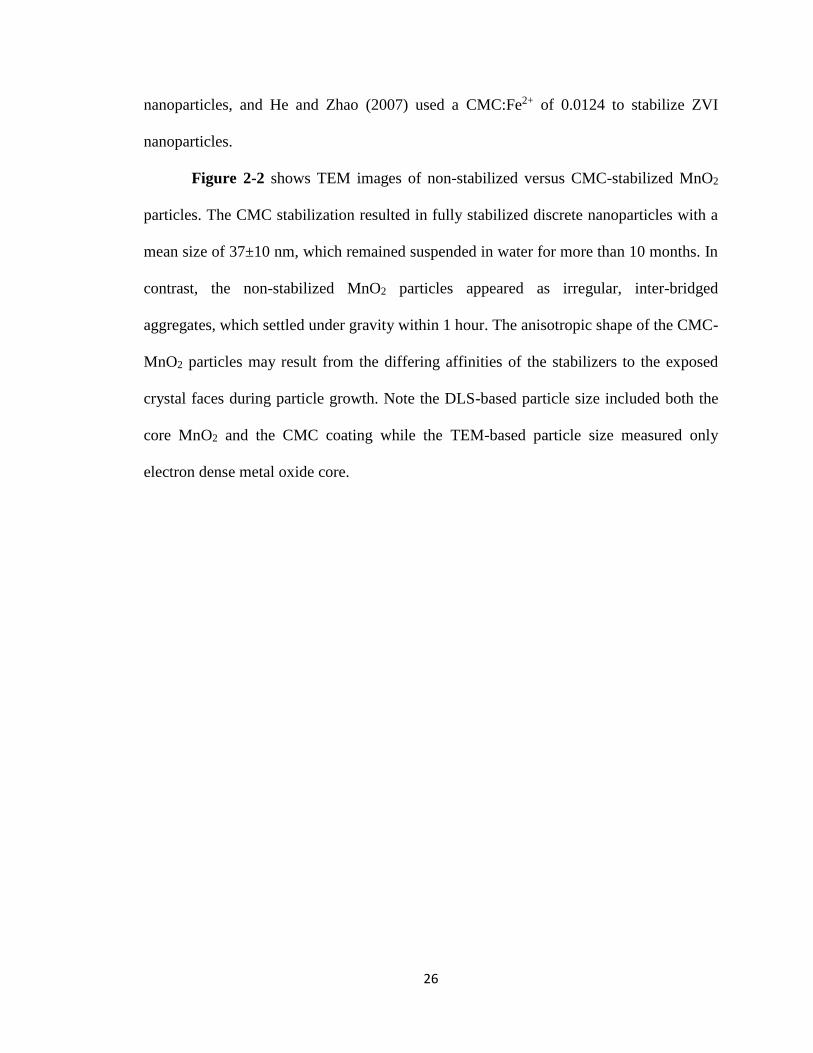
Figure 2-2 shows TEM images of non-stabilized versus CMC-stabilized MnO2
particles. The CMC stabilization resulted in fully stabilized discrete nanoparticles with a
mean size of 37±10 nm, which remained suspended in water for more than 10 months. In
contrast, the non-stabilized MnO2 particles appeared as irregular, inter-bridged
aggregates, which settled under gravity within 1 hour. The anisotropic shape of the CMC-
MnO2 particles may result from the differing affinities of the stabilizers to the exposed
crystal faces during particle growth. Note the DLS-based particle size included both the
core MnO2 and the CMC coating while the TEM-based particle size measured only
electron dense metal oxide core.

27
Figure 2-1. a) Hydrodynamic size distribution and mean hydrodynamic diameter of
MnO2 nanoparticles prepared at various CMC:MnO2 molar ratios; b) MnO2 stability
measured as normalized Mn concentration (C/C0) as a function of time through
sedimentation tests. Note: [MnO2] = 210-4 M (17.4 mg/L), [CMC] = 1.110-8-2.810-6
M (1-250 mg/L); D: mean hydrodynamic diameter, C: Mn concentration in the top 2 cm
of the suspension at time t, and C0: total Mn concentration; Error bars indicate standard
deviation from the mean. Data are plotted as mean of duplicates.
CMC/MnO2, mole/mole
5.56e-5 2.78e-4 8.33e-4 1.39e-3 2.78e-3 0.0139
Vo
lum
e P
erc
en
tag
e,
%
0
20
40
60
80
100
120
D<20 nm
20 nm<D<50 nm
50 nm<D<100 nm
D>100 nm
(D=131±2 nm)
(D=60±2 nm)
(D=39.6±0.9 nm)
(D=39.5 ±0.8nm)
(D=37±2 nm)
(D=38±3 nm)
a)
Time, day
0 2 4 6 8
C/C
0
0.0
0.2
0.4
0.6
0.8
1.0
1.2
MnO2/CMC 1.39E-02
MnO2/CMC 1.39E-03
MnO2/CMC 2.78E-04
MnO2/CMC 5.56E-05
b)

28
a) b)
Figure 2-2. Photographs and TEM images of: a) non-stabilized MnO2, and b) CMC-
stabilized MnO2 particles. Pictures were taken 30 minutes after synthesis. [MnO2] =
810-4 M (0.07 g/L) for both cases, and CMC/MnO2 molar ratio = 1.3910-3 for case b).
29
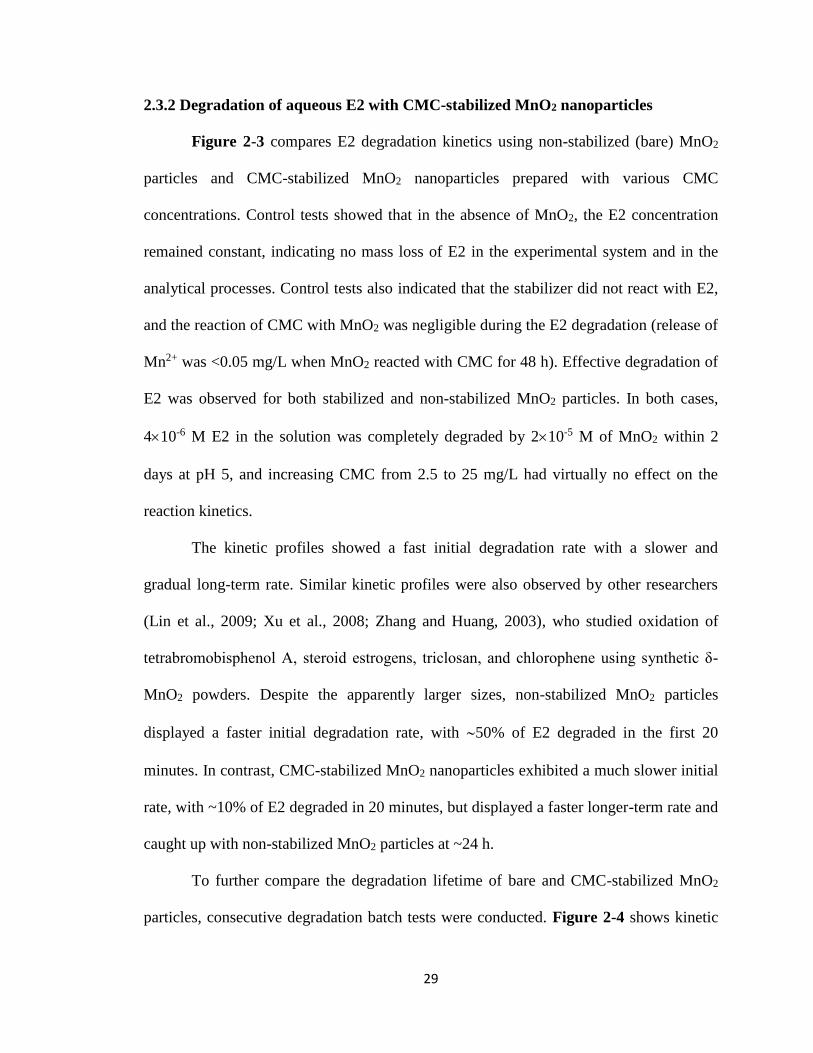
2.3.2 Degradation of aqueous E2 with CMC-stabilized MnO2 nanoparticles
Figure 2-3 compares E2 degradation kinetics using non-stabilized (bare) MnO2
particles and CMC-stabilized MnO2 nanoparticles prepared with various CMC
concentrations. Control tests showed that in the absence of MnO2, the E2 concentration
remained constant, indicating no mass loss of E2 in the experimental system and in the
analytical processes. Control tests also indicated that the stabilizer did not react with E2,
and the reaction of CMC with MnO2 was negligible during the E2 degradation (release of
Mn2+ was <0.05 mg/L when MnO2 reacted with CMC for 48 h). Effective degradation of
E2 was observed for both stabilized and non-stabilized MnO2 particles. In both cases,
410-6 M E2 in the solution was completely degraded by 210-5 M of MnO2 within 2
days at pH 5, and increasing CMC from 2.5 to 25 mg/L had virtually no effect on the
reaction kinetics.
The kinetic profiles showed a fast initial degradation rate with a slower and
gradual long-term rate. Similar kinetic profiles were also observed by other researchers
(Lin et al., 2009; Xu et al., 2008; Zhang and Huang, 2003), who studied oxidation of
tetrabromobisphenol A, steroid estrogens, triclosan, and chlorophene using synthetic δ-
MnO2 powders. Despite the apparently larger sizes, non-stabilized MnO2 particles
displayed a faster initial degradation rate, with 50% of E2 degraded in the first 20
minutes. In contrast, CMC-stabilized MnO2 nanoparticles exhibited a much slower initial
rate, with ~10% of E2 degraded in 20 minutes, but displayed a faster longer-term rate and
caught up with non-stabilized MnO2 particles at ~24 h.
To further compare the degradation lifetime of bare and CMC-stabilized MnO2
particles, consecutive degradation batch tests were conducted. Figure 2-4 shows kinetic

30
profiles of E2 degradation in consecutive spikes of E2 with non-stabilized and CMC-
stabilized MnO2. When the same MnO2 particles were exposed to repeated spikes of E2
(E2 = 410-6 M in each spike), CMC-stabilized MnO2 remained effective in three
consecutive runs and degraded cumulatively 1.2110-5 (0.3%) M of E2, whereas bare
MnO2 exhausted at the end of the second run and degraded a total of 7.5010-6 (0.01%)
M of E2. This observation confirms that the CMC stabilization resulted in greater surface
area, more reactive surface sites, and longer reactive lifetime of the nanoparticles.

31
Figure 2-3. a) Oxidative degradation of E2 in water by MnO2 particles prepared in the
presence of various concentrations of CMC and at a fixed MnO2 dosage of 210-5 M. b)
Linearized first order plot for non-stabilized and CMC-stabilized degradation rate data.
Initial [E2] = 410-6 M, [CMC] = 2.5 mg/L (CMC/MnO2 molar ratio = 1.3910-3), 5
mg/L (CMC/MnO2 = 2.7810-3), 10 mg/L (CMC/MnO2 = 5.5610-3) and 25 mg/L
(CMC/MnO2 = 0.0139). All tests were buffered at pH 5 by HAc/NaAc. Data plotted as
mean of duplicates and errors calculated as standard deviation.
Time, hour
0 10 20 30 40 50
C/C
0
0.0
0.2
0.4
0.6
0.8
1.0
1.2
Non-stabilized
25 mg/L CMC-stabilized
10 mg/L CMC-stabilized
5 mg/L CMC-stabilized
2.5 mg/L CMC-stabilized
Control
a)
Time, hour
0 5 10 15 20 25
ln C
/C0
-3.5
-3.0
-2.5
-2.0
-1.5
-1.0
-0.5
0.0 Non-stabilized
2.5 mg/L CMC-stabilized
First-order fitting (bare)
Retarded first-order fitting (bare)
Retarded first-order fitting (stabilized)
b)

32
Figure 2-4. Batch kinetic profiles of E2 degradation in consecutive spikes of E2 using the same
MnO2: a) non-stabilized MnO2; b) CMC-stabilized MnO2. In both cases, [MnO2] = 210-5 M,
[CMC] = 2.5 mg/L, [E2] in each spike = 410-6 M, pH = 5 (buffered by HAc/NaAc). At the end
of each run there is still trace of amount of E2 residual. C0: Initial E2 concentration in each run.
For Case a), the initial E2 concentration for the first run and second run was 410-6, and 4.1910-6
M, respectively; For case b), the initial E2 concentration for the four runs was 410-6, 4.1810-6,
4.2010-6, and 4.3510-6 M, respectively.
Time, hour
0 2 4 6 8 10 12 14
C/C
0
0.0
0.2
0.4
0.6
0.8
1.0
1.2
non-stabilized MnO2
a)
Time, day
0 2 4 6 8 10 12
C/C
0
0.0
0.2
0.4
0.6
0.8
1.0
1.2
CMC-stabilized MnO2
b)

33
Based on work on synthetic or mineral MnO2, researchers (Jiang et al., 2010; Lin
et al., 2009; Rubert and Pedersen, 2006; Zhang and Huang, 2003) described the oxidation
of organic contaminants on surface of MnO2 as a two-step process: 1) adsorption of E2
onto the MnO2 surface, forming a precursor surface complex, and 2) electron transfer
from E2 to MnO2 and release of the organic products and Mn2+.
For both stabilized and non-stabilized MnO2, the reaction rate decreases over time,
indicating a gradual loss of the reactive sites or the reactivity. Several factors can cause
the reactivity loss, including accumulation of degradation products and Mn2+ onto the
MnO2 particles (i.e., an auto-inhibiting effect) and poisoning of the MnO2 surface by the
reaction products (Rubert and Pedersen, 2006). The oxidation potential of MnO2
decreases as more reduction products (e.g., Mn2+) are formed (Eqs. 1-2) (Lin et al., 2009;
Zhang and Huang, 2003). For non-stabilized MnO2, the bare particle surface offers easier
accessibility of the reactive sites (i.e., less mass transfer resistance), resulting in the
observed faster initial rate. For stabilized nanoparticles, the CMC coating on the
nanoparticles plays some opposing roles. First, the CMC stabilization resulted in smaller
particles sizes of the core MnO2, which gives higher specific surface area and thus favors
E2 removal. Second, the CMC coating adds a mass transfer barrier, which inhibits the
accessibility of the reactive sites and limits the formation of the precursor complex for E2
degradation. The added mass transfer resistance is revealed by comparing the initial
degradation rates for bare and CMC-stabilized particles (Figure 2-3) and by the fact in
Figure 2-4 that CMC-stabilized MnO2 degraded more E2 but with a slower initial rate
than the bare particles. Previous studies also showed coating a polymer or dissolved
organic matter on nanoparticles could inhibit the mass transfer rate (Sakulchaicharoen et
34
al., 2010; Zhang et al., 2011). Lastly, the CMC layer may also prevents adsorption of the
reaction products (e.g., Mn2+) on the nanoparticles, thereby mitigating the auto-inhibitive
effects of the by-products. Fig. S3 in SI shows that the inhibitive effect of Mn2+ was
much alleviated for CMC-MnO2 than the bare particles. It is noteworthy from Figure 2-3
that the presence of various concentrations of CMC (from 2.5 to 25 ppm) resulted in
nearly identical degradation rates. This observation suggests that the opposing effects of
CMC are counteracting. On the one hand, higher CMC concentration gives smaller
nanoparticles; on the other hand, the mass transfer resistance increases with increased
CMC uptake. For example, the CMC surface excess on MnO2 was measured to be
0.0420.003, 0.0440.007, and 0.0570.007 g/m2 for 2.5, 5 and 25 mg/L CMC,
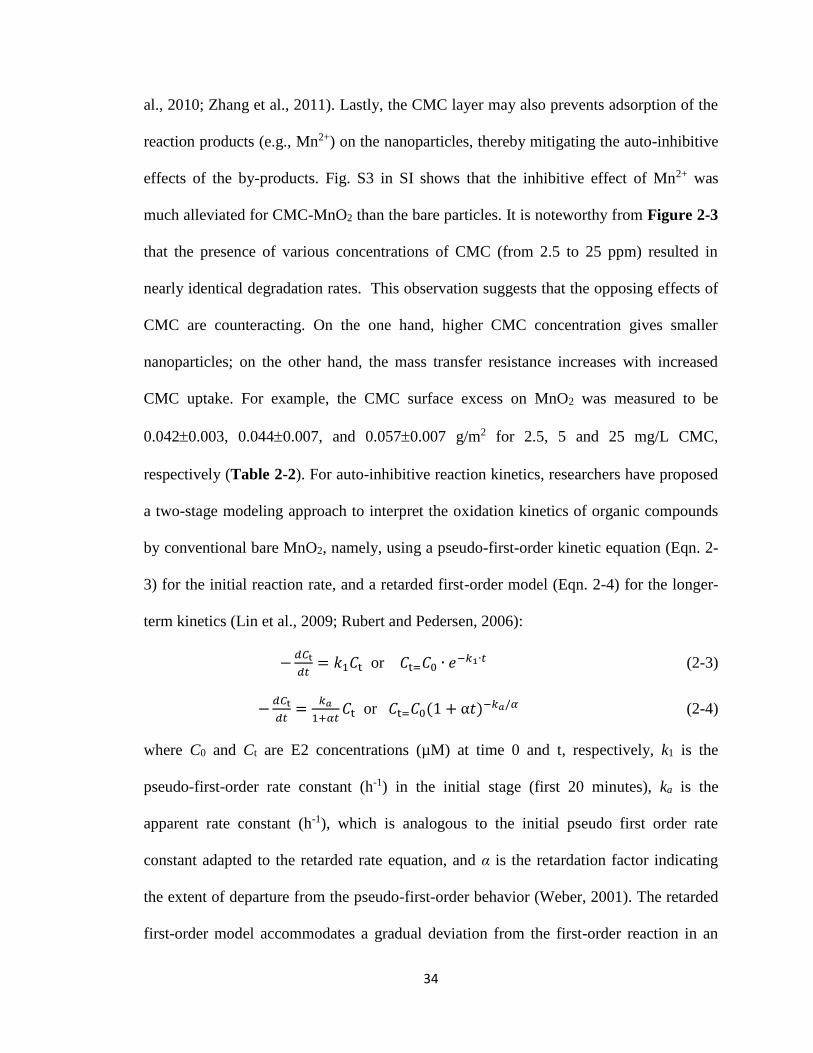
respectively (Table 2-2). For auto-inhibitive reaction kinetics, researchers have proposed
a two-stage modeling approach to interpret the oxidation kinetics of organic compounds
by conventional bare MnO2, namely, using a pseudo-first-order kinetic equation (Eqn. 2-
3) for the initial reaction rate, and a retarded first-order model (Eqn. 2-4) for the longer-
term kinetics (Lin et al., 2009; Rubert and Pedersen, 2006):
−𝑑𝐶t
𝑑𝑡= 𝑘1𝐶t or 𝐶t=𝐶0 ∙ 𝑒
−𝑘1∙𝑡 (2-3)
−𝑑𝐶t
𝑑𝑡=
𝑘𝑎
1+𝛼𝑡𝐶t or 𝐶t=𝐶0(1 + α𝑡)
−𝑘𝑎/𝛼 (2-4)
where C0 and Ct are E2 concentrations (µM) at time 0 and t, respectively, k1 is the
pseudo-first-order rate constant (h-1) in the initial stage (first 20 minutes), ka is the
apparent rate constant (h-1), which is analogous to the initial pseudo first order rate
constant adapted to the retarded rate equation, and α is the retardation factor indicating
the extent of departure from the pseudo-first-order behavior (Weber, 2001). The retarded
first-order model accommodates a gradual deviation from the first-order reaction in an

35
empirical way by incorporating a “sliding” factor in the reaction rate constant (Lin et al.,
2009).
Figure 2-3(b) shows that the pseudo-first-order kinetic equation adequately
interpreted the rapid initial (first 20 minutes) degradation kinetics (R2 = 0.988), but failed
to fit the long-term kinetics (R2 = 0.371) for non-stabilized MnO2, while the first-order
retarded model was able to interpret the longer-term rate (R2 = 0.955). Interestingly, for
CMC-stabilized MnO2, the retarded model was able to well simulate the entire oxidation
kinetics (R2 = 0.997), suggesting that the CMC coating may have mitigated the auto-
inhibitive effects, and diffusion through the surface layer is an important step throughout
the reaction course. The same good fitting was also observed for CMC-stabilized MnO2
at pH 5, 6, 7, and 8 (Figure 2-5 and Figure 2-6), where the retarded first-order model
was able to nicely simulate the entire kinetic data with a coefficient of determination
(R2) > 0.97 (Table 2-3). For bare MnO2, the two-stage model was necessary to simulate
the kinetics at pH 5, where a much rapider initial degradation rate was evident. However,
at elevated pH (6-8), the retarded equation alone was able to adequately simulate the
degradation data for bare MnO2 as well (R2 >0.98). Table 2-3 gives the best-fitted
retarded first-order model parameters. In all cases, the ka values decreased with increasing
pH, and CMC-stabilized nanoparticles showed a lower ka and also a lower α value than
non-stabilized MnO2, which is consistent with the observed rate data.

36
Table 2-2. CMC Surface Density on MnO2
Con. of CMC, mg/L 𝐶𝑎𝑑𝑠a, mg/L 𝑟b, nm 𝛿c, g/m2
2.5
5
25
1.30.1
1.40.2
1.80.2
19.80.4
18.30.8
191
0.0420.003
0.0440.007
0.0570.007
aCMC concentration adsorbed on the particle surface, is determined by measuring the
differences between the initial and final CMC concentrations in the aqueous phase using
a TOC analyzer. bMean particle radius, is obtained from the DLS measurement. c𝛿 is
CMC surface density on MnO2 calculated by 𝛿 = 𝐶𝑎𝑑𝑠 · 𝑎𝑠, where average specific area
of MnO2 nanoparticles 𝑎𝑠 = 3(𝜌𝑟)−1.
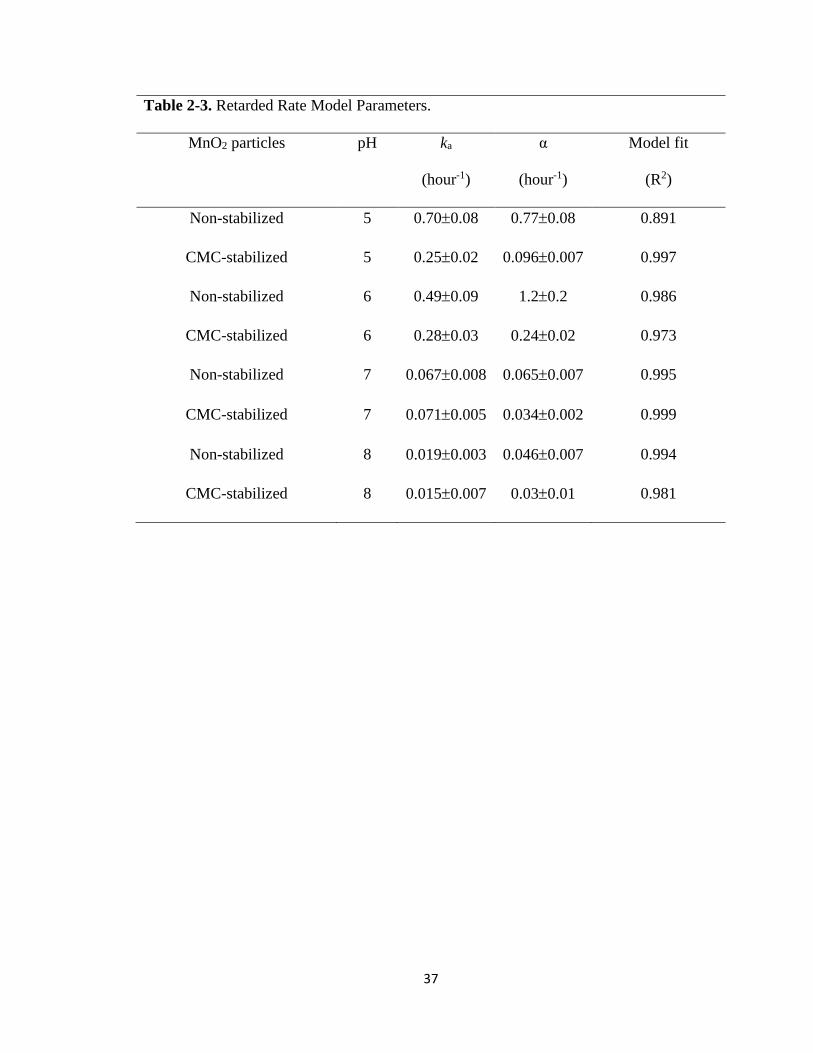
37
Table 2-3. Retarded Rate Model Parameters.
MnO2 particles pH ka
(hour-1)
α
(hour-1)
Model fit
(R2)
Non-stabilized 5 0.700.08 0.770.08 0.891
CMC-stabilized 5 0.250.02 0.0960.007 0.997
Non-stabilized 6 0.490.09 1.20.2 0.986
CMC-stabilized 6 0.280.03 0.240.02 0.973
Non-stabilized 7 0.0670.008 0.0650.007 0.995
CMC-stabilized 7 0.0710.005 0.0340.002 0.999
Non-stabilized 8 0.0190.003 0.0460.007 0.994
CMC-stabilized 8 0.0150.007 0.030.01 0.981

38
Figure 2-5. Effect of pH on oxidative removal of E2 in water by: a) Non-stabilized
MnO2, and b) CMC-stabilized MnO2. Initial [E2] = 410-6 M, [MnO2] = 210-5 M,
[CMC] = 2.5 mg/L, pH 5 buffered by HAc/NaAc, pH 6-8 buffered by NaH2PO4/NaOH.
Symbols: experimental data; lines: retarded first-order model fittings.
Time, hour
0 5 10 15 20 25
C/C
0
0.0
0.2
0.4
0.6
0.8
1.0
1.2
a)
Control
pH 8
pH 7
pH 6
pH 5
Non-stabilized MnO2
Time, hour
0 5 10 15 20 25
C/C
0
0.0
0.2
0.4
0.6
0.8
1.0
1.2
b)
Control
CMC-stabilized MnO2
pH 8
pH 7
pH 6
pH 5
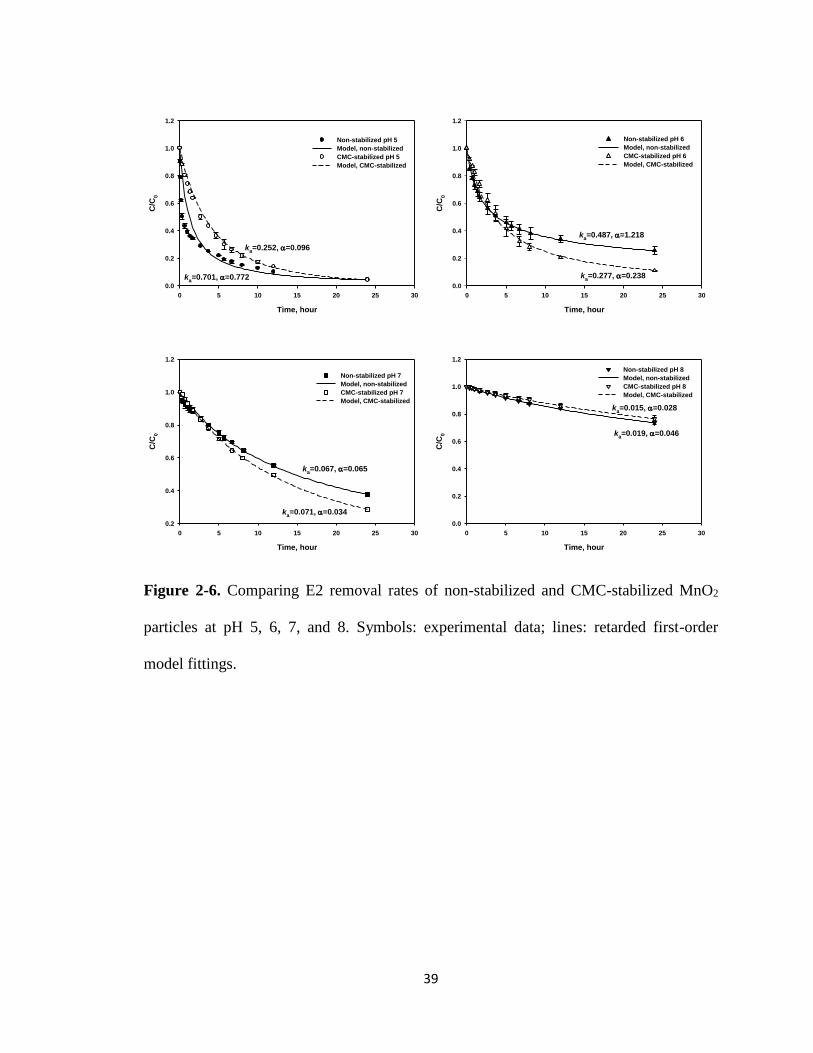
39
Figure 2-6. Comparing E2 removal rates of non-stabilized and CMC-stabilized MnO2
particles at pH 5, 6, 7, and 8. Symbols: experimental data; lines: retarded first-order
model fittings.
Time, hour
0 5 10 15 20 25 30
C/C
0
0.0
0.2
0.4
0.6
0.8
1.0
1.2
Non-stabilized pH 5
Model, non-stabilized
CMC-stabilized pH 5
Model, CMC-stabilized
ka=0.701, =0.772
ka=0.252, =0.096
Time, hour
0 5 10 15 20 25 30
C/C
0
0.0
0.2
0.4
0.6
0.8
1.0
1.2
Non-stabilized pH 6
Model, non-stabilized
CMC-stabilized pH 6
Model, CMC-stabilized
ka=0.487, =1.218
ka=0.277, =0.238
Time, hour
0 5 10 15 20 25 30
C/C
0
0.2
0.4
0.6
0.8
1.0
1.2
Non-stabilized pH 7
Model, non-stabilized
CMC-stabilized pH 7
Model, CMC-stabilized
ka=0.067, =0.065
ka=0.071, =0.034
Time, hour
0 5 10 15 20 25 30
C/C
0
0.0
0.2
0.4
0.6
0.8
1.0
1.2
Non-stabilized pH 8
Model, non-stabilized
CMC-stabilized pH 8
Model, CMC-stabilized
ka=0.015, =0.028
ka=0.019, =0.046

40
2.3.3 Effect of pH on E2 removal in water
Researchers have reported that the MnO2-mediated oxidation of various organic
compounds (triclosan, chlorophene, oxytetracycline, tetrabromobisphenol A, and E2) is
pH dependent (Lin et al., 2009; Rubert and Pedersen, 2006; Xu et al., 2008; Zhang and
Huang, 2003). Figure 2-5 shows oxidation rates of E2 by stabilized and non-stabilized
MnO2 particles at pH 5-8. Overall, the lower pH favors the reaction. Increasing pH from
5 to 8 decreased the ka value from 0.700.08 to 0.0190.003 hour-1, and 0.250.02 to
0.0150.007 hour-1 for non-stabilized and stabilized MnO2, respectively (Table 2-3).
With a pKa of 10.71, E2 is present in the undissociated neutral form within the pH range.
The observed pH-dependent removal rate can be attributed to several factors. First,
protons catalyze reduction of MnO2 (Zhang and Huang, 2003), i.e.,
1/2 MnO2 (s) + 2H+ + e → 1/2 Mn2+(aq) + H2O (2-5)
According to (Stumn and Morgan, 1996), lowering pH from 8 to 4 increases the
reduction potential of MnO2 from 0.76 to 0.99 V. Second, given that the pH at PZC for
MnO2 is 2.25 (Murray, 1974), the surface of MnO2 is largely negatively charged under
the experiment conditions. Zeta potential analysis showed that when pH decreased from 8
to 5, the MnO2 particle surface potential varied from -33 mV to -28 mV for CMC-
stabilized MnO2 and from -29 mV to -24 mV for bare MnO2 (analyzed upon sonication).
The higher surface charge at higher pH renders the surface less favorable toward the
hydrophobic E2 (logKOC is 2.96), forming less precursor complexes. In addition, the
oxide surface is less likely to adsorb cations (e.g., Mn2+) at lower pH, which liberates
more reactive surface sites for E2.
41
It is noteworthy that the pH effects are notably different for bare and CMC-
stabilized MnO2 particles, especially in the pH range of 5-7. Figure 2-6 compares E2
removal rates for bare and CMC-stabilized MnO2 in the pH range from 5 to 8. In all cases,
bare MnO2 displayed faster initial reaction rates. However, CMC-stabilized MnO2
nanoparticles caught up and even surpassed the bare MnO2 at longer times, and the catch-
up time was shortened with increasing pH. For instance, at pH 6, CMC-MnO2 started
exceeding bare MnO2 at 4 h, while at pH 7 the turning point was shortened to ~2 h. In the
end, CMC-stabilized MnO2 degraded 15% and 9% more E2 at pH 6 and 7, respectively.
At pH 8, both reactions became very slow and the difference was insignificant. The mean
hydrodynamic size of CMC-stabilized MnO2 particles were 42.80.2, 441, 452, and
451 nm for pH 5, 6, 7, and 8 before the degradation tests, respectively. Therefore, pH
had little effect on the particle size. The much (9%-15%) better performance of CMC-
stabilized MnO2 suggests that the CMC coating renders the surface reactive sites less
vulnerable to the aforementioned unfavorable effects of elevated pH.
2.3.4 Effect of CMC on E2 desorption from soil
As mentioned earlier, the primary purpose to stabilize the nanoparticles is to
facilitate particle delivery into the subsurface (i.e., to promote particle mobility) toward
in-situ remediation of soil-sorbed E2. As sorption/desorption often limits chemical and
biological availabilities, soil sorption and desorption of E2 in the presence of CMC were
tested. Figure 2-7(a) shows the sorption kinetic data of E2 by the sandy loam soil. The
equilibrium was reached in 1 week, and the equilibrium uptake was 0.0019 mg-E2/g-soil.
The sorption partition coefficient of E2 (logKOC) was determined to be 2.960.03 based
on the soil organic carbon (organic matter = 1.724 organic carbon). The relatively low E2
42
uptake is consistent with the low SOM (soil organic matter) content (0.4%) of the soil
(Table 2-1).
Following the sorption equilibrium, desorption kinetic tests were carried out with
the same E2-loaded soil. Figure 2-7(b) shows E2 desorption kinetics without CMC and
in the presence of 25 mg/L CMC. The data showed a rapid initial (<3 hours) desorption
rate followed by a much slower rate. Approximately 33% of E2 was desorbed in the
initial 3 hours, and another 15% was desorbed in the following 7 days. Similar two-phase
desorption profiles have been widely reported. Rapid desorption happens in the labile
domain where the adsorption sites are easily accessible, while slow desorption is
associated with slow diffusion from soil micropores.

43
Figure 2-7. a) E2 sorption kinetics with a sandy loam soil (initial aqueous [E2] = 410-6
M). b) Effect of CMC on desorption of E2 from the soil. In figure b) Mt: E2 remaining in
soil at time t; M0: initial E2 in soil (0.0019 mg/g); pH was 5.65-5.98. Control tests were
carried out without soil under otherwise identical conditions.
Time, day
0 2 4 6 8 10 12 14 16
Mes
trad
iol/M
so
il,
mg
/g
0.0000
0.0005
0.0010
0.0015
0.0020
0.0025
a)
Time, day
0 2 4 6 8
Mt/M
0
0.0
0.2
0.4
0.6
0.8
1.0
1.2Desorption without CMC
Desorption with 25 mg/L CMC
Control
b)
44
2.3.5 Degradation of soil-sorbed E2
Figure 2-8 compares the degradation kinetics of E2 in water and E2 that was pre-
loaded on the sandy loam at various dosages of CMC-stabilized MnO2 nanoparticles.
More than 97% of aqueous E2 (1.09 mg/L) was degraded in 48 hours by 210-5 M (1.74
mg/L) CMC-stabilized MnO2. In contrast, <5% of soil-sorbed E2 (0.0019 mg/g) was
degraded with the same dosage of CMC-MnO2. When the nanoparticle dosage was
increased to 810-5 M and 210-4 M, 20% and 80% of soil-sorbed E2 were degraded,
respectively.
Evidently, the presence of the soil inhibited the oxidation of E2 by the
nanoparticles. Several factors can contribute to this effect. First, soil desorption of E2 can
limit the degradation kinetics, especially in the later stage of the oxidation process.
Second, the nanoparticles can be adsorbed or become associated with the soil, which not
only reduces particle mobility and accessibility, but also loses part of the reactive sites. In
addition, the dissolved organic matter (DOM) (e.g., humic acid) and metal ions (e.g.,
Ca2+, Mn2+) released from soil may also competitively react with MnO2 (Xu et al., 2008).
As a result, larger dosages of MnO2 particles may be required to treat E2 in contaminated
soil.

45
Figure 2-8. Degradation of aqueous and soil-sorbed E2 at various dosages (210-5 to
210-4 M) of MnO2. Initial [E2] in soil = 0.0019 mg/g, CMC/MnO2 molar ratio =
1.38910-3 in all cases, pH = 6.0±0.2 (buffered by NaH2PO4/NaOH). M0 = Initial E2 in
the reactor system (77.6% in soil); Mt = E2 remaining in the system at time t. Soil mass =
6 g, Solution/suspension volume = 60 mL.
Time, day
0 2 4 6 8
Mt/M
0
0.0
0.2
0.4
0.6
0.8
1.0
1.2
2*10-5
M
8*10-5
M
2*10-4
M
Soil-sorbed estradiol, CMC-MnO2=
Aqueous estradiol
Control
46
Figure 2-9 compares the effectiveness of non-stabilized MnO2 and CMC-
stabilized MnO2 nanoparticles in degradation of soil-sorbed E2. To gauge the effects of
desorption and the inhibition of soil components, Figure 2-9 is plotted in terms of E2
remaining in the whole reactor system (both aqueous and soil phases) (Figure 2-9(a))
and that in the aqueous phase only (Figure 2-9(b)). After 96 hours of reaction, 83% and
70% of E2 were degraded in the heterogeneous system by 210-4 M of CMC-stabilized
and non-stabilized MnO2 particles, respectively (Figure 2-9(a)). Unlike in the
homogeneous solution systems (Figure 2-3), CMC-stabilized MnO2 clearly
outperformed bare MnO2 particles for degrading soil-sorbed E2 in both degradation rate
and extent, and the soil system inhibits the bare MnO2 more than CMC-MnO2.
A comparison of the desorption rate (Figure 2-7(b)) and degradation data (Figure
2-9(b)) reveals that the presence of CMC-stabilized MnO2 lowered the equilibrium E2
concentration in the aqueous phase from 47% to 8%, and bare MnO2 from 47% to 17%.
At any given time during the experiment, E2 in the aqueous phase accounted for more
than 50% of total E2 remaining in the system, indicating that desorption was not the rate-
limiting step.
As stated before, soil sorption of the nanoparticles may render some of the
reactive sites inaccessible. At day 6, only 7% of CMC-stabilized nanoparticles remained
suspended (i.e., 93% attached to soil). Figure 2-10 shows the zeta potential of soil
exudates and the two types of particle suspensions at pH 6 (note the soil pHPZC was 5.2).
The less negative zeta potential of bare MnO2 forecasts a more favorable sorption
potential to the soil, i.e., more reactivity loss.

47
Figure 2-9. Degradation of soil-sorbed E2 with bare and CMC-stabilized MnO2 particles:
a) in the whole system, and b) in the aqueous phase. Initial [E2] in soil = 0.0019 mg/g,
MnO2 concentration = 210-4 M, CMC/MnO2 molar ratio = 1.38910-3 for stabilized
particles, Soil mass = 6 g, Suspension volume = 60 mL, pH = 6.0±0.2 (buffered by
NaH2PO4/NaOH). M0: Initial E2 in the reactor system (77.6% in soil), Mt and Ma: E2
remaining in the whole system and the aqueous phase, respectively.
Time, day
0 1 2 3 4 5 6 7
Mt/M
0
0.0
0.2
0.4
0.6
0.8
1.0
1.2
Non-stabilized MnO2
CMC-stabilized MnO2
a)
Time, day
0 1 2 3 4 5 6 7
Ma/M
0
0.0
0.2
0.4
0.6
0.8
1.0
1.2
Non-stabilized MnO2
CMC-stabilized MnO2
b)
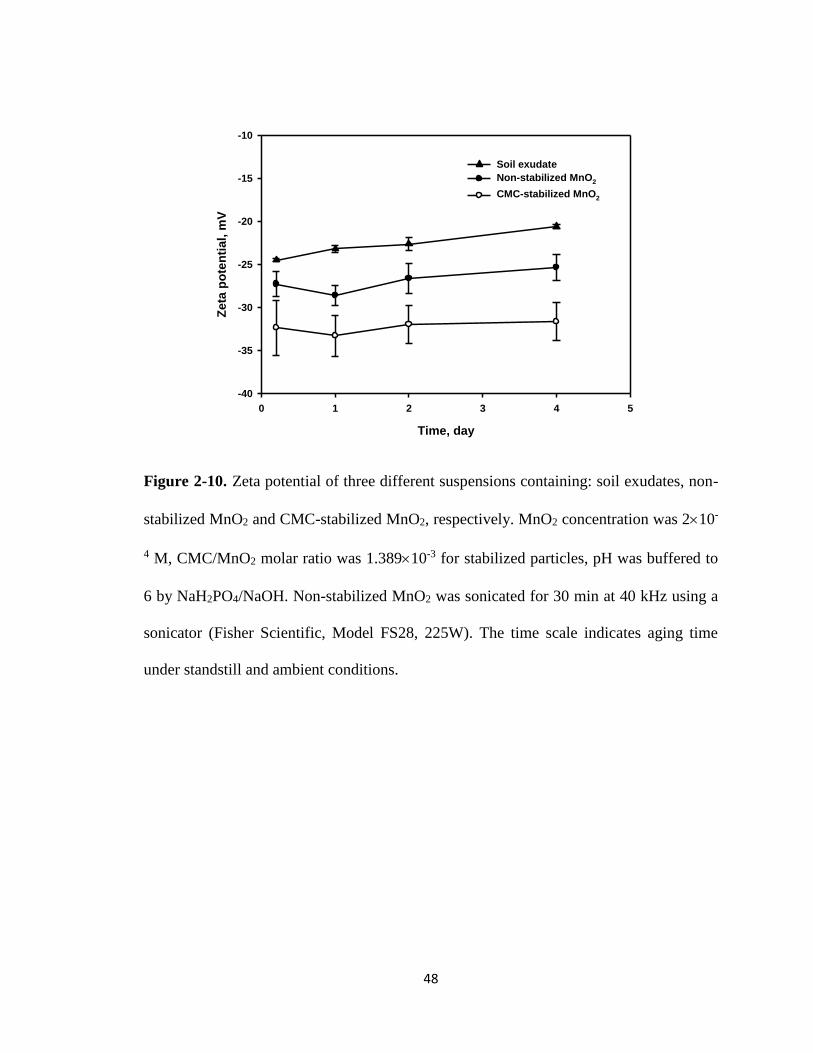
48
Figure 2-10. Zeta potential of three different suspensions containing: soil exudates, non-
stabilized MnO2 and CMC-stabilized MnO2, respectively. MnO2 concentration was 210-
4 M, CMC/MnO2 molar ratio was 1.38910-3 for stabilized particles, pH was buffered to
6 by NaH2PO4/NaOH. Non-stabilized MnO2 was sonicated for 30 min at 40 kHz using a
sonicator (Fisher Scientific, Model FS28, 225W). The time scale indicates aging time
under standstill and ambient conditions.
Time, day
0 1 2 3 4 5
Zeta
po
ten
tial,
mV
-40
-35
-30
-25
-20
-15
-10
Soil exudate
Non-stabilized MnO2
CMC-stabilized MnO2

49
2.3.6 Effect of leachable soil components on E2 degradation
Figure 2-11 shows the aqueous phase E2 degradation kinetics with or without soil
extracts by bare and CMC-stabilized MnO2. The soil extracts contained 6±2 mg/L DOM
measured as TOC, 2.5±0.5 mg/L Ca2+ and 1.9±0.3 mg/L Mn2+. The presence of the soil
extracts inhibited the reaction rate in the initial stage (12-16 h), but facilitated the longer
term reaction rate. At the end of 24 h experiments, E2 removal was increased from 74%
(no soil extracts) to 90% (with soil extracts) by bare MnO2 and from 89% to 96% by
CMC-stabilized MnO2. Xu et al. (2008) investigated E2 removal rate affected by
coexisting metal ions including Fe3+, Cu2+, Zn2+ and Mn2+ as well as humic acid, and
found that the metal ions inhibited E2 removal but humic acid at low concentrations (1
mg/L) enhanced E2 removal rate. The metal ions were considered competing for the
active surface sites with E2 by adsorption to the MnO2 surface, whereas humic acid can
bind with Mn2+ and thus, alleviate its inhibitive effects as Mn2+ is continuously produced
during the redox reaction. Figure 2-12 shows that the presence of 0.01 M Mn2+ or Ca2+
remarkably inhibited the degradation rates for both bare and CMC-stabilized MnO2. The
inhibitive effects are attributed to: 1) cation-induced coagulation that destabilized the
particles (which was observed in a few minutes), and thus decrease the reactive sites; 2)
blockage of the reactive sites due to uptake of the cations; and 3) product (Mn2+) auto-
inhibition/poisoning of the MnO2 reduction. Nonetheless, it was clearly evident from
Figure 2-12(a) that CMC shielded the nanoparticles from the auto-inhibitive effects of
Mn2+: while Mn2+ almost ceased the reaction for bare MnO2, nearly 50% E2 degradation
was achieved by CMC-stabilized MnO2. In contrast, Ca2+ exerted nearly the same effects
for both forms of MnO2 (Figure 2-12(b)), suggesting that Ca2+ exerted similar inhibitive

50
effects (site blockage and enhanced aggregation of the particles) on the two forms of
MnO2. Figure 2-13 shows that the addition of 5 mg/L humic acid (as TOC) increased the
reaction rates, resulting in comparable E2 degradation for the two forms of MnO2. In the
presence of soil extracts (Figure 2-11), the early inhibitive effect was due to the rapid
initial uptake of the soil extracts (DOM, Ca2+, Mn2+ and their complexes), which
diminishes the reactive sites and increases the mass transfer resistance at the particle
surface. However, as more Mn2+ is produced, the exuded DOM acts as a scavenger of
Mn2+, thereby alleviating further inhibitive effects. It is noteworthy that the soil extracts
exhibited less impact on CMC-stabilized MnO2 than bare MnO2, which can be attributed
to the protective effect of the sorbed CMC that reduces the accessibility of soil released
components to MnO2 particles and to the ability of CMC molecules to complex with the
metal ions.

51
Figure 2-11. Oxidation kinetics of E2 in water with or without soil extracts: a) non-
stabilized MnO2, and b) CMC-stabilized MnO2. Initial [E2] = 410-6 M, [MnO2] = 210-5
M, [CMC] = 2.5 mg/L, pH = 6 (buffered by NaH2PO4/NaOH). Data plotted as mean of
duplicates and errors calculated as standard deviation.
Time, hour
0 5 10 15 20 25
C/C
0
0.0
0.2
0.4
0.6
0.8
1.0
1.2
Non-stabilized MnO2 with soil extracts (TOC=6 mg/L)
Non-stabilized MnO2 without soil extracts
a)
Time, hour
0 5 10 15 20 25
C/C
0
0.0
0.2
0.4
0.6
0.8
1.0
1.2
CMC-stabilized MnO2 with soil extracts (TOC=6 mg/L)
CMC-stabilized MnO2 without soil extracts
b)
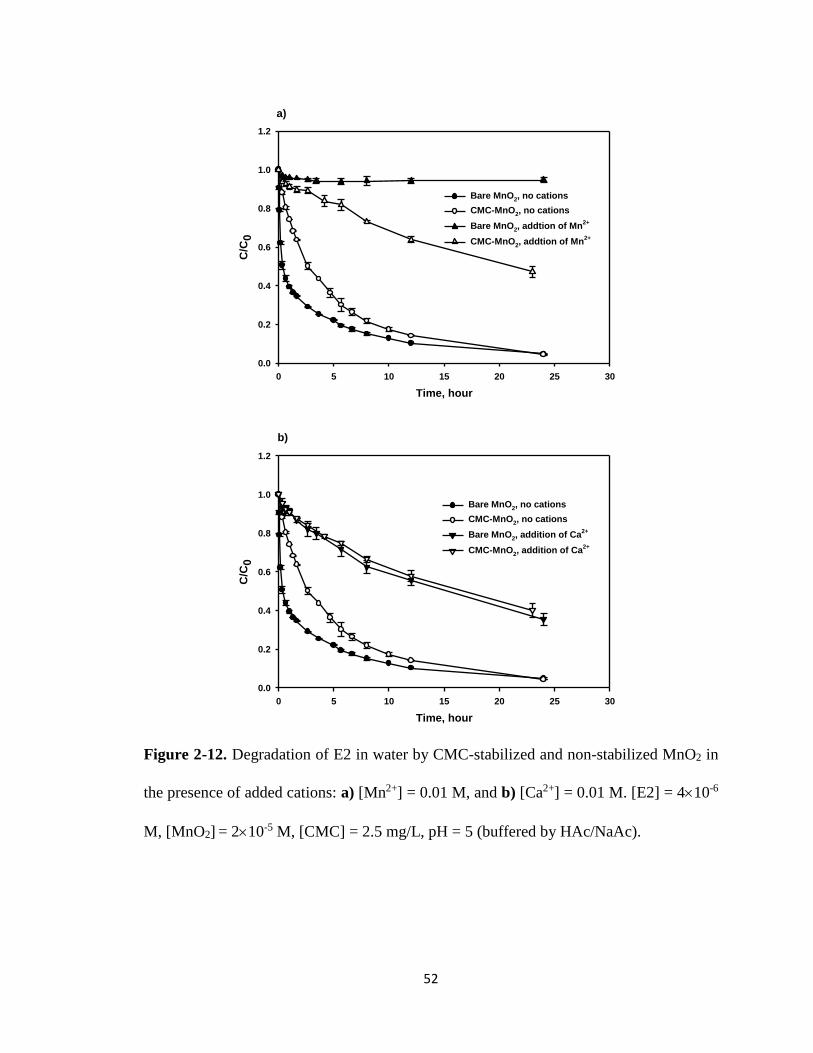
52
Figure 2-12. Degradation of E2 in water by CMC-stabilized and non-stabilized MnO2 in
the presence of added cations: a) [Mn2+] = 0.01 M, and b) [Ca2+] = 0.01 M. [E2] = 410-6
M, [MnO2] = 210-5 M, [CMC] = 2.5 mg/L, pH = 5 (buffered by HAc/NaAc).
Time, hour
0 5 10 15 20 25 30
C/C
0
0.0
0.2
0.4
0.6
0.8
1.0
1.2
Bare MnO2, no cations
CMC-MnO2, no cations
Bare MnO2, addtion of Mn2+
CMC-MnO2, addtion of Mn2+
a)
Time, hour
0 5 10 15 20 25 30
C/C
0
0.0
0.2
0.4
0.6
0.8
1.0
1.2
Bare MnO2, no cations
CMC-MnO2, no cations
Bare MnO2, addition of Ca2+
CMC-MnO2, addition of Ca2+
b)

53
Figure 2-13. Degradation of E2 in water by CMC-stabilized and non-stabilized MnO2 in
the presence of added humic acid (HA): a) non-stabilized MnO2, and b) CMC-stabilized
MnO2. [E2] = 410-6 M, [MnO2] = 210-5 M, [CMC] = 2.5 mg/L, pH = 5 (buffered by
HAc/NaAc), [HA] = 5 mg/L as TOC.
Time, hour
0 5 10 15 20 25 30
C/C
0
0.0
0.2
0.4
0.6
0.8
1.0
1.2
Bare MnO2 no HA
Bare MnO2, addition of HA
a)
Time, hour
0 5 10 15 20 25 30
C/C
0
0.0
0.2
0.4
0.6
0.8
1.0
1.2
CMC-MnO2 no HA
CMC-MnO2, addition of HA
b)
54
2.4 Conclusions
This work prepared and tested a new class of CMC-stabilized MnO2 nanoparticles
for oxidative degradation of water-dissolved as well as soil-sorbed E2. The major
findings are summarized as follows:
1) CMC was able to act as a low-cost and green stabilizer for synthesizing well-
stabilized birnessite (-MnO2) nanoparticles. While conventional non-stabilized
MnO2 particles aggregate rapidly, and thus lose their soil deliverability and mobility,
CMC-stabilized nanoparticles remain well-dispersed in aqueous suspension for
months. The most desired particles (highest reactivity and soil deliverability) were
obtained at a CMC/MnO2 molar ratio of 1.3910-3, which yielded a mean
hydrodynamic size of 39.5 nm and a narrow size distribution (SD=0.8 nm).
2) At typical aquatic pH (6-7), CMC-stabilized MnO2 exhibited faster degradation
kinetics for oxidation of 17β-E2 than non-stabilized MnO2. This reactivity advantage
becomes more evident when used for treating soil-sorbed E2 owing to the ability of
CMC to complex with metal ions and shield the reactive sites from binding with soil
extracts that inhibit E2 oxidation.
3) The retarded first-order kinetic model was able to interpret the E2 oxidation kinetics
for CMC-stabilized MnO2, however, a two-stage model is needed for bare MnO2
particles.
4) When used for degrading soil-sorbed E2, several factors may inhibit the oxidation
effectiveness, including desorption rate, soil-MnO2 interactions, soil-released metals
and reductants. CMC-stabilized MnO2 displayed much greater resistance to the soil
inhibitive effects than non-stabilized MnO2.

55
Based on the findings, CMC-stabilized MnO2 nanoparticles hold the potential to
be used for facilitating in-situ oxidative degradation of various emerging contaminants in
soil and groundwater.

56
CHAPTER 3. IN-SITU DEGRADATION OF SOIL-SORBED 17-ESTRADIOL
USING CARBOXYMETHYL CELLULOSE STABILIZED MANGANESE OXIDE
NANOPARTICLES: COLUMN STUDIES
3.1. Introduction
Steroidal hormones are a class of endocrine disrupting chemicals (EDCs), and
have been used in almost all combined oral contraceptive pills (Kolpin et al., 2002; Shore
and Shemesh, 2003). Exposure to even ng/L levels of the chemicals can cause adverse
effects on wildlife and humans via interactions with the endocrine systems, such as
abnormal development (e.g., malformations, sex reversal in male species), reproductive
disorders, and cancers (Colborn, 1993; Diamanti-Kandarakis, 2009). Over the last decade
or so, numerous endogenous and synthetic hormones have been detected in sewage
treatment effluents, septic system effluents, surface waters, ground water, and soils
worldwide (Kolpin et al., 2002; Shore and Shemesh, 2003; Desbrow et al., 1998; Drewes
et al., 2003; Finlay-Moore et al., 2000; Ternes et al., 1999). Municipal wastewater is
considered one of the main sources of hormones discharged in the water bodies (Ternes
et al., 1999). In addition, animal manure contains large quantities of endogenous
hormones (such as estrone (E1), 17β-estradiol (E2), and testosterone), and application of
animal waste as a fertilizer contributes significant amounts of hormones to soil and
groundwater (Shore and Shemesh, 2003).
In general, estrogens are subjected to adsorption by soil. As a result, the
concentrations in groundwater are lower than in surface waters. However, soil-sorbed

57
estrogens can be slowly released into groundwater, causing a long-term threat to
ecosystems. Kolodziej et al (2004) detected 6.3 ng/L of E2 in a monitoring well located
downstream of a waste lagoon. The analysis of 112 samples in 59 groundwater sites in
Austria detected E2 in more than 50% of the samples with a maximum concentration of
0.79 ng/L (Hohenblum et al., 2004). Nichols et al. (1998) reported 1-3 µg/L of estrogen
and testosterone in rainwater runoff. Yet, there has been no in-situ technology available
for degrading estrogens in the subsurface.
Conventional manganese oxide (MnO2) powder particles have been found
effective for oxidizing EDCs such as E2, Tetrabromobisphenol A (TBBPA), and
bisphenol A in water (Xu et al., 2008; Jiang et al., 2009; Lin et al., 2009a; Lin et al.,
2009b). However, these aggregated particles are not deliverable in contaminated
soil/groundwater systems. To facilitate soil deliverability and in-situ remediation of soil,
Han et al. (2015) prepared a new class of stabilized MnO2 (CMC-MnO2) nanoparticles
using a low-cost, food-grade carboxymethyl cellulose (CMC) as a stabilizer, and
preliminary batch tests indicated that the new nanoparticles can effectively degrade
aqueous and soil-sorbed E2. However, there remains a dearth of pertaining to: 1) detailed
transport and deposition behaviors of the nanoparticles in different soils, 2) effectiveness
of the nanoparticles when applied in column settings (i.e., under conditions of simulated
in-situ soil treatment), and 3) factors that govern the effectiveness of the technology.
Although transport of colloids has been studied for decades, there is limited
knowledge of nano-scale particle transport behavior in real natural soils. Studies on the
transport of engineered nanoparticles showed that the presence of the polymer and
polyelectrolyte coatings can improve particle deliverability in porous media due to their

58
stabilization of the particles and the increased electrostatic repulsive forces created by
carboxylic and phenolic groups (He et al., 2009; Quevedo and Tufenkji, 2012; Wang et
al., 2012). In general, laboratory nanoparticle transport tests were conducted in columns
using glass beads or pure quartz sand as a model porous matrix. However, variability in
the nanoparticles (NPs) breakthrough and retention could be obtained when using a more
complex porous media such as natural soil. The composition of soil (e.g., mineral content
and organic matter content) differs from locations, and NPs exhibit varying affinity to
different soil components. The inherent geochemical and charge heterogeneity of the
natural soil is a key factor controlling the nanoparticle deposition. Quevedo and
Tenfenkji (2012) compared three engineered nanoparticle attachment efficiencies (α)
obtained from the breakthrough of loamy sand packed column with quartz sand packed
column, and found α values are much higher in the loamy sand than quartz sand. Basnet
et al. (2015) observed a notably reduced transport potential of modified Pd-nZVI
nanoparticles in loamy sand, and they suggested the high deposition was attributed to the
heterogeneities created by the clay fraction. The complex heterogeneity of natural soils
presents challenges to develop a correlation between the nanoparticle transport behavior
and physicochemical properties of the porous media. Nevertheless, to investigate in-situ
remediation efficiency using nanoparticles, studies on nanoparticle transport behavior in
natural soils are needed to identify the links between the particle transport and
contaminant removal.
Recently, application of nanoparticles for in-situ remediation of soil/groundwater
has attracted significant interest. Among various nanoparticles, nano-scale zero-valent
iron (nZVI) have been extensively studied and used for in-situ dechlorination of

59
chlorinated solvents in groundwater aquifers (Bennett et al., 2010; He et al., 2010; Wei
et al., 2010). He et al. (2010) tested stabilized ZVI nanoparticles for in-situ destruction of
chlorinated ethenes in south US. After two serial injections, the iron nanoparticles that
moved five feet down-gradient from the injection well were achieved 70% of recovery
(compared with the tracer bromide). After 596 days, the total chlorinated ethenes were
decreased by 40% and 61% five and ten feet down-gradient of injection wells,
respectively. Although the synthesis method is the same, sometimes the in-situ
remediation consequent was quite different. For instance, Zhang and Zhao (2013)
synthesized the nZVI particles with the same method as He et al. (2010), and they used
the nanoparticles in remediation of chlorinated contaminants in Utah. However, the ZVI
deliverability and chlorinated contaminant removal efficiency in their tests were much
lower than reported by He et al. (2010) in the sandy aquifer. They suggested that the
different soil components and low permeability were the reason that caused significant
reduction of the particle deliverability and contaminant removal.
The overall goal of this study was to test the feasibility of the CMC-MnO2
nanoparticles for in-situ degradation of E2 in soil and groundwater. The specific
objectives were to: 1) test and simulate the transport of CMC-MnO2 through 1-D column
tests with three model soils of different properties; 2) determine the effectiveness of
CMC-MnO2 for in-situ degrading soil-sorbed E2; 3) examine the effects of injection
velocity and particle concentration on treatment effectiveness; and 4) test effects of soil
properties, adsorption/desorption, mass transfer, and particle deposition and identify the
key constraints and optimal conditions for the technology.
3.2. Materials and methods
60
3.2.1 Preparation and characterization of CMC-MnO2 nanoparticles
CMC-MnO2 was synthesized following a modified manganese redox method
using CMC as a stabilizer. Detailed information on the preparation of CMC-stabilized
MnO2 is provided in 2.2.2 of Chapter 2. The resulting CMC-MnO2 nanoparticles were
aged for one day at room temperature (20±1˚C) to allow for full growth before all tests.
TEM images of the nanoparticles were obtained using a Zeiss EM10 transmission
electron microscope (Zeiss, Thornwood, NJ, USA). The hydrodynamic particle size and
ζ-potential were determined by dynamic light scattering (DLS) (Zetasizer Nano ZS,
Malvern Instruments Ltd, Malvern, Southborough, MA, USA). Details of TEM and DLS
analyses have been described in 2.2.6 of Chapter 2.
3.2.2 Soils and E2 sorption/desorption
Three sandy loam soils (SL1, SL2, and SL3) were obtained from the bamboo
field, corn farm, and wood field, respectively, of the E.V. Smith Research Center of
Auburn University in Shorter, AL, USA. Before use, the soils were screened through a
standard 2 mm sieve, and then washed with tap water five times to remove debris, fine
colloids and water soluble compositions that cannot be separated from water by normal
centrifugation. The soil samples were then air-dried, thoroughly mixed, and stored at
room temperature (20±1˚C) for use. Soil texture, pH, total organic carbon, metal
contents, and cation exchange capacity (CEC) were analyzed by the Auburn University
Soil Testing Laboratory. Detailed results and analytical methods are described in Table
3-1. The pH at point of zero charge (PZC) was determined following the potentiometric
titration method (Marcano-Martinez and McBride, 1989), and the particle size
distribution was determined following the hydrometer and sieve analysis (Bouyoucos,

61
1962). Table 3-1 presents the salient physical and chemical properties of the soils. The
key different properties of the soils are the clay content, organic matter (OM) content,
and PZC value of the soils. Although the three soils are all sandy loam, the clay content is
higher for SL1 (18%) than SL2 (15%) and SL3 (16%). The organic matter content order
is SL3 (5.9%) > SL2 (1.3%) > SL1 (0.4%), and the pH of the PZC of the three soils are
SL3 (5.9) > SL1 (5.2) > SL2 (4.5).
E2 was pre-loaded on the soils through soil sorption tests of E2. Soil sorption tests
of E2 were conducted in 65 mL amber glass vials sealed with open-top screw caps and
PTFE-lined septa. Six gram of soil each was weighed in the vials and then wet-
autoclaved to eliminate bioactivities in the subsequent tests following the method of
Mashtare et al. (2011). The sorption tests were initiated by adding 60 mL of 410-6 M of
an E2 solution to each of autoclaved vials at a soil-to-solution mass ratio of 1:10. After
mixing on an end-over-end rotator (40 rpm) for 7 days, the sorption equilibrium for the
three soils was reached. The sorption tests resulted in an E2 loading of 0.0019, 0.0065
and 0.0104 mg/g for SL1, SL2 and SL3, respectively, based on initial and final
concentrations in the solution. The E2-laden soils were then dried under N2 atmosphere.
The E2 loadings were determined per hot methanol extraction, where the soil is mixed
with methanol at a soil-to-methanol ratio of 3 (g):20 (ml) and in a hot water bath at 70˚C
for 4 hours. The recovery of using this hot methanol method to extract E2 was
determined to be 94±4%, 91±4% and 86±4%, for SL1, SL2, and SL3, respectively.
To probe the desorption rates of the soil-sorbed E2, desorption kinetic tests were
carried out following the successive desorption method. Successive desorption kinetic
tests were conducted with the same batch reactors. Following the sorption equilibrium,

62
the soil and solution were separated through centrifugation at 805 g-force, and desorption
of E2 was initiated by replacing ~57 mL (95%) of the supernatant with the same volume
of soil-amended water (prepared by mixing the soil and water at the same soil:solution
ratio). The vials were then mixed on the rotator at 40 rpm in an incubator. At selected
times, duplicate vials were sacrificially sampled and analyzed for E2 in water following
the same procedure as in the sorption tests. Upon equilibrium, the soil and solution were
separated again through centrifugation, and the second run of desorption was initiated by
replacing ~57 mL of the supernatant with the same volume of E2 free soil-amended
water. At selected times, E2 in the supernatant was analyzed following the same
procedure.

63
Table 3-1. Physical and Chemical Properties of the Three Soils Used in This Work
Soil Taxonomya Claya,
%
CECb
meq/100g
OMc,
%
pH PZSEe Caf
ppm
K
ppm
Mg
ppm
P
ppm
Alg
ppm
Cu
ppm
Fe
ppm
Mn
ppm
Zn
ppm
Na
ppm
As
ppm
Cd
ppm
Cr
ppm
Pb
ppm
SL1 Sandy Loam 18 3.20 0.4 6.7 5.2 234 51 71 11 72 3 25 22 2 4 <0.1 <0.1 <0.1 <0.1
SL2 Sandy Loam 15 3.69 1.3 5.9 4.5 392 18 50 12 130 4 24 18 2 33 <0.1 <0.1 <0.1 <0.1
SL3 Sandy Loam 16 28.94 5.9 7.8 5.9 4612 77 497 109 3 <0.1 <0.1 31 1 53 <0.1 <0.1 <0.1 <0.1
a Soil texture analysis was conducted following the Bouyoucos hydrometer method (Bouyoucos, 1962).3
b CEC: Cation exchange capacity, measured per EPA Method 9081.
c Organic carbon was determined following the combustion method (Kirsten, 1979).
d pH of soil was analyzed in a soil-to-DI water volume ratio of 1:1.
e The pH at point of zero salt effect (PZSE) of the soil was measured following the potentiometric titration method (Marcano-Martinez and
McBride, 1989).
f Soil potassium, calcium, magnesium, phosphate and sodium were extracted following Melich I procedure.
g Soil metal contents were acid digested following EPA method 3230.

64
3.2.3 Column transport tests
The transport behavior of CMC-MnO2 in the model soils was examined through
column breakthrough tests using a glass column (ID = 1 cm, L = 15 cm) with adjustable
headspace (Omnifit, Cambridge, England). A layer of 0.3-cm thick glass wool was
packed at the bottom and top of the soil bed. In each test, a dry mass of 12 grams of a soil
was packed in the column with a constant porosity. Each column was slow flushed (0.03
ml/min) with ~10 pore volumes (PVs) of a nitrogen-sparged background solution (0.84
mM NaCl+0.16 mM NaHCO3, pH=7.5) in the up-flow mode to avoid air entrapment and
achieve complete water saturation. The breakthrough test was then initiated by pumping a
suspension of CMC-MnO2 through the soil bed in the up-flow mode using a HPLC pump
(Acuflow series II pump, Lab Alliance, USA) with Teflon tubing. The effluent samples
were collected by a fraction collector (Eldex, CA, USA), then each 2 mL of the samples
was mixed with 0.5 mL of ascorbic acid (0.05 M) to completely dissolve the
nanoparticles, and the CMC-MnO2 effluent history was obtained by measuring the total
Mn concentration. Following the full breakthrough, the influent reservoir was switched to
the background solution at the same flow rate to elute the retained nanoparticles. Bromide
tracer (KBr as 30 mg/L) tests were conducted under the same condition of breakthrough
tests to acquire the hydrodynamic parameters of the column. To investigate the spatial
distribution of the nanoparticles delivered in the soil, the soil beds were sectioned into 5
segments, and the concentration of the nanoparticles in each section was obtained via
EPA Method 3050B (acid digestion). A summary of experiment conditions is provided in
Table 3-2, and the column experiment setup is shown in Figure 3-1.

65
Table 3-2. Experiment conditions of MnO2 transport tests conducted at various velocities and concentrations in saturated columns
packed with different porous media
Soil Bed
depth
Flow rate Pore
velocity
EBCTa Injection MnO2
conc.
Pulse
Duration
Grain
sizeb
Bulk
density
Porosity Saturated hydraulic
conductivityc
cm mL/min cm/min min g/L PV mm g/cm3 cm/day
SL1 9.4 0.05 0.167 147.7 0.017 9.9 0.101 1.60 0.38 5.690.08
SL2 8.4 0.05 0.202 131.9 0.017 11.9 0.098 1.80 0.32 6.160.07
8.4 0.2 0.808 33.0 0.017 14.8 0.098 1.80 0.32 6.160.07
8.4 0.03 0.121 219.9 0.017 11.4 0.098 1.80 0.32 6.160.07
8.4 0.01 0.040 659.7 0.017 11.8 0.098 1.80 0.32 6.160.07
8.4 0.05 0.202 131.9 0.087 12.3 0.098 1.80 0.32 6.160.07
8.4 0.05 0.202 131.9 0.174 12.3 0.098 1.80 0.32 6.160.07
SL3 10.6 0.05 0.153 166.5 0.017 7.2 0.083 1.44 0.42 3.500.05
a EBCT is the empty bed contact time. b Mean grain diameter is determined following the hydrometer and sieve analysis (Bouyoucos,
1962). c Saturated hydraulic conductivity is determined following the constant head method.

66
Figure 3-1. Column experiment setup
HPLC Pump
Fraction Collector

67
3.2.4 Column degradation tests
Column tests were carried out to simulate in-situ treatment of E2-contaminated
soil. In each case, 12 grams of a soil were dry-packed in the column under constant
patting with a glass bar, with the soil porosity (bed height) being kept the same as in the
transport tests. Column degradation tests were initiated by pumping a CMC-MnO2
suspension through the column at a constant rate, and effluent was collected immediately
into a glass tube containing 1 mL of 10 g/L ascorbic acid. The effectiveness of ascorbic
acid for dissolution of MnO2 and termination of the reaction has been shown by Xu et al.
(2008). Upon filtration through an Anotop 10 syringe filter (0.22 µm alumina
membrane), the filtrate was analyzed by HPLC for E2. The control tests were conducted
by pumping through the same concentration of CMC solution as in degradation tests, but
without MnO2 nanoparticles, and the other experiment conditions were kept identical as
degradation tests. E2 remaining in the soils after column degradation tests was
determined through the hot methanol extraction method.
3.2.5 Analytical method
Bromide concentration was measured using a Dionex Ion Chromatography (DX-
120, Dionex, Sunnyvale, CA), with a detection limit <0.05 mg/L. Total manganese was
analyzed with a flame atomic-absorption spectrophotometer (AAS) (220FS, Varian, Palo
Alto, CA) with a detection limit of 0.05 mg/L. E2 was analyzed using an HP Agilent
1260 Infinity HPLC system equipped with a Poroshell 120 EC-C18 column (4.650mm,
2.7 µm) and by modifying the method by Havlikova et al (2006). The mobile phase was a
mixture of 40:60 (v/v) of acetonitrile and phosphoric acid (0.085%) at a flow rate of 1
68
mL min-1. A UV detector (G1365D 1260 MWD VL) was operated at a wavelength of 210
nm, giving a detection limit of 510-8 M.
3.2.6 Transport modeling
The one-dimensional advection-dispersion equation (ADE) that accounts for
advection, dispersion, and solid-phase deposition was used to simulate the transport
behavior of CMC-MnO2 through the water-saturated soils (Wang et al., 2008):
∂𝐶
∂𝑡= λ𝑣𝑝
∂2𝐶
∂𝑧2− 𝑣𝑝
∂𝐶
∂𝑧−ρ𝑏
𝜃𝑤
𝜕𝑆
𝜕𝑡 (3-1)
where C is the MnO2 concentration in the aqueous phase (NcL-3), Nc is the number of
particles, S is the MnO2 concentration in the solid phase (NcM-1), M is the mass of solid
phase (only in chapter 3.2.6), z is the distance along the column from the inlet (L), t is the
time (T), λ is the dispersivity (L), 𝑣𝑝 is the average pore velocity (LT-1), ρb is the soil
bulk density (ML-3), and 𝜃𝑤 is the water content, which is equal to porosity under
saturation condition. The accumulation of CMC-MnO2 onto the soil is given by (Bolster
et al., 1999):
ρ𝑏
𝜃𝑤
𝜕𝑆
𝜕𝑡= 𝑘𝑑𝑒𝑝𝜓𝐶 −
ρ𝑏
𝜃𝑤𝑘𝑑𝑒𝑡𝑆 (3-2)
where 𝑘𝑑𝑒𝑝 is the first-order deposition coefficient of CMC-MnO2 [T-1], 𝑘𝑑𝑒𝑡 is first-
order detachment coefficient [T-1], and 𝜓 is a dimensionless blocking function to describe
the change of the available fraction of deposition surface sites.
A simple Langmuirian blocking function, which was derived from the Langmuir
adsorption model, was used to account for the dynamic blocking (Adamczyk et al.,
1994):
𝜓 =𝑆𝑚𝑎𝑥−𝑆
𝑆𝑚𝑎𝑥 (3-3)
69
where 𝑆𝑚𝑎𝑥 is the maximum MnO2 deposition capacity [NcM-1]. In case of negligible
release of nanoparticles from sand grains, detachment coefficient 𝑘𝑑𝑒𝑡 approaches zero,
and Eqn (3-2) reduces to an irreversible deposition kinetic. The HYDRUS-1D code was
used to solve Eqs (3-1)-(3-3) (Simunek et al., 2005). The details of parameters used in
this chapter were provided in Appendix A.
3.3. Results and discussion
3.3.1 Characterization of CMC-stabilized MnO2 nanoparticles
Figure 3-2 shows digital photographs and TEM images of non-stabilized MnO2
particles and CMC-stabilized particles prepared at a molar ratio of CMC/MnO2 =
1.3910-3. The CMC stabilization resulted in fully stabilized discrete nanoparticles which
could be well suspended for several months, with a TEM image based average diameter
of 36±10 nm. In addition, DLS measurements gave a mean volume weighted
hydrodynamic size of 39.50.8 nm, and a zeta-potential of -342 mV (MnO2 = 0.017 g/L,
pH = 5.1, I 2.410-4 M) for CMC-MnO2 which indicate a good stabilization of the
nanoparticles due to electrostatic repulsion. In the experiment concentration range of
210-4 M (0.017 g/L) to 210-3 M (0.174 g/L), the hydrodynamic size and zeta-potential
of MnO2 nanoparticle did not vary much, the average hydrodynamic size was within
422 nm to 39.50.8 nm, and the zeta-potential was within -342 mV to -323 mV. The
X-ray Diffraction (XRD) analysis showed the synthesized non-stabilized and CMC-
stabilized MnO2 are all largely amorphous, and indicated the synthesized MnO2 particles
are birnessite (-MnO2) (Murray, 1974; Zhang and Huang, 2003).
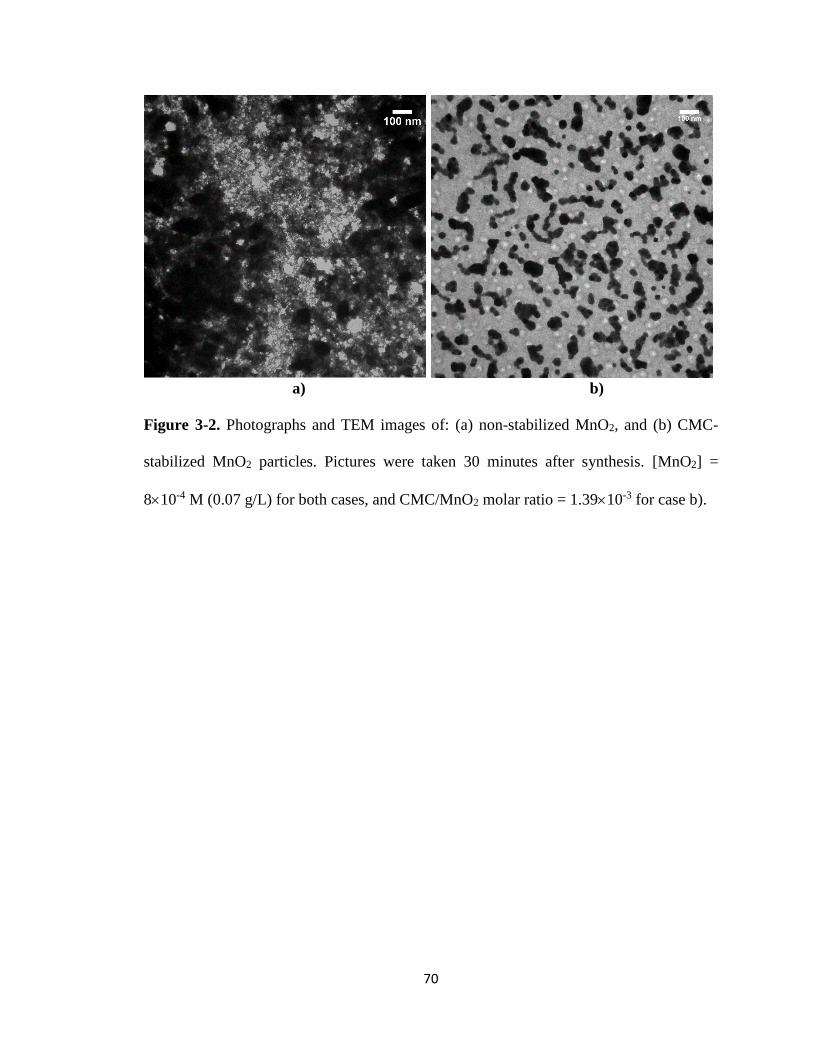
70
a) b)
Figure 3-2. Photographs and TEM images of: (a) non-stabilized MnO2, and (b) CMC-
stabilized MnO2 particles. Pictures were taken 30 minutes after synthesis. [MnO2] =
810-4 M (0.07 g/L) for both cases, and CMC/MnO2 molar ratio = 1.3910-3 for case b).

71
3.3.2 Transport of CMC-MnO2 in three soils
Figure 3-3(a)-(c) shows the measured and fitted breakthrough curves (BTCs) of
tracer (KBr) and CMC-MnO2 transport through the three sandy loam soils. Table 3-2
summarizes experiment conditions of the transport tests. The results of duplicate
experiments under identical conditions are presented in Figure 3-4 to demonstrate the
reproducibility of the experimental system. In all cases, the effluent bromide
concentration rapidly reached influent concentration at ~ 1.3 PVs (the number of pore
volumes (PVs) is equivalent to a dimensionless time), and decrease sharply to zero upon
pumping through background solution. For MnO2 nanoparticles, the effluent
concentrations were increased more gradually after breakthrough and then reached a
plateau, although the plateau relative concentration (C/C0) was different for the three
soils. For SL1 soil, MnO2 breakthrough at ~5 PVs with the average plateau C/C0 was
0.90, and the plateau exhibited a slightly ascent until the influent was switched to
background solution. For SL2 soil, the average plateau C/C0 was 0.93 with a fast
breakthrough at ~2 PVs. For SL3 soil, the breakthrough of MnO2 occurred at also ~2
PVs, but the effluent plateau relative concentration was the lowest, with a C/C0 of 0.66.
This behavior suggested that although MnO2 could attach to different soils by a different
extent, the synthesized nanoparticles were deliverable in natural sandy loam soils. Table
3-3 shows the simulation parameters obtained by fitting BTCs of column experiments
and calculated MnO2 retention parameters. The longitudinal dispersivity λ for each
medium was obtained by fitting the classic ADE (no deposition term) to tracer BTCs.
The deposition coefficient 𝑘𝑑𝑒𝑡 and maximum deposition concentration 𝑆𝑚𝑎𝑥 are
obtained by fitting the modified ADE (include deposition term) to MnO2 BTCs. The

72
numerical model was able to nicely simulate the tracer and MnO2 nanoparticle BTCs
with a coefficient of determination (R2) > 0.98.
The retention profiles of MnO2 nanoparticles are presented in Figure 3-3(d) as a
function of distance from the inlet. The result showed that the retention of CMC-MnO2
nanoparticles was about one order of magnitude lower in SL2 than in SL1 and SL3.
Consistent with the retention profile, compared the integrated area of BTCs (effluent
MnO2 mass) with the total injected mass of nanoparticles showed the retention of CMC-
MnO2 was 37.1 %, 4.3 % and 36.4 % for SL1, SL2 and SL3 soil, respectively, of the total
injected mass of MnO2 (Table 3-3). Comparing the retained plus eluted mass with the
total mass injected, the total measured mass balance of MnO2 for the three experiments
was ranged from 93.5% to 111.4% which confirms the mass balance closure of the
transport experiments (Table 3-3).
From Figure 3-3, it was noted that the deposition of MnO2 is higher in SL1 and
SL3 soils, and breakthrough of CMC-MnO2 was apparently retarded in SL1 soil than
other two soils. While the breakthrough occurred at ~2 PVs for SL2 and SL3 soils, it
occurred at ~5 PVs for SL1 soil. Such a time delay of the BTCs was also observed in
other engineered nanoparticles transport in porous media (Jones and Su, 2014; Li et al.,
2008). The deposition rate of nanoparticles in porous media depends on 1) the available
solid surface area that is favorable for deposition (related to 𝑆𝑚𝑎𝑥∗ ); and 2) the mass
transfer rate of the nanoparticles to the favorable sites where deposition can occur
(related to 𝑘𝑑𝑒𝑝) (Ko and Elimelech, 2000; Sasidharan et al., 2014; Torkzaban et al.,
2010). Under the experiment conditions presented here (i.e., the pH of influent MnO2
suspension was 5.1-5.3), the MnO2 nanoparticles (pH of point of zero charge

73
(pHpzc)=2.25) were negatively charged, which was confirmed by the highly negative zeta-
potential (-34 mV). As the pHpzc for soil SL1, SL2, and SL3 was measured to be 5.2, 4.5,
and 5.9 respectively, the soil surface is negatively charged for SL2, partially positively
charged for SL1 and positively charged for SL3, which indicates SL1 and SL3 soil
provided more favorable surfaces for the deposition of the negatively charged MnO2 NPs.
Consistent with the PZC value, the deposition of MnO2 was apparently higher for SL1
(37.1 %) and SL3 (36.4 %) soils than SL2 (4.3 %) soil. In addition, the model fitted data
shows the maximum deposition sites 𝑆𝑚𝑎𝑥∗ for SL3 soil (1.4210-1 m3/g) is two orders of
magnitude larger than SL1 (1.5110-3 m3/g) and SL2 (1.2810-3 m3/g) soils. These
findings clearly indicate that the large favorable solid surface area contributes most for
MnO2 deposition in SL3 soil, which resulted in a low plateau relative concentration
(C/C0=0.66) in effluent.
The observed delays in the BTCs for SL1 soil suggested a higher initial MnO2
deposition (attachment) rate. The high initial rates may be explained by the high mass
transfer rate of the nanoparticles from bulk solution to the favorable solid surface sites
(Torkzaban et al., 2010). The diffusive mass transfer rate of the colloids was considered
relevant to the deposition coefficient (Sasidharan et al., 2014; Torkzaban et al., 2010). The
first-order deposition coefficient 𝑘𝑑𝑒𝑡 fitted in the model for SL1 (0.252) is two orders of
magnitude larger than SL2 (0.001) and SL3 (0.004), indicating a faster deposition rate.
To further study the deposition kinetics of MnO2 nanoparticles to the three soils, batch
soil adsorption experiments were conducted, and the CMC-MnO2 sorption kinetics are
shown in Figure 3-5. Although batch adsorption kinetics could not fully represent
column deposition kinetics, they could illustrate the interaction energies between the
74
particles and soils. Figure 3-5 shows that the initial MnO2 adsorption is faster in SL1 soil
than the other two soils, while the adsorption extent in SL3 is the highest. At equilibrium,
MnO2 adsorption was 0.139 mg/g, 0.119 mg/g, and 0.145 mg/g for SL1, SL2, and SL3,
respectively. This observation also demonstrates that the MnO2 mass transfer from
solution to solid surface is fastest for SL1 soil, and the favorable surface area for
deposition is biggest in SL3 soil.
The results suggested MnO2 deposition is much higher in the soil that offer more
favorable deposition sites than those that are unfavorable for deposition which could be
predicted based on the collector (grain) average surface potential (PZC value)
(Torkazaban et al., 2010). In addition, the surface charge heterogeneity on mineral
surfaces is considered to play an important role in colloid deposition (Sasidharan et al.,
2014; Johnson et al. 1996; Rizwan and Bhattacharjee, 2009). Torkazaban et al. (2010)
found the gold nanoparticles deposited only on the clay surfaces, and did not deposit on
the sand removed of clay particles. They suggested surface charge heterogeneities on clay
particles are key factors controlling the deposition of nanoparticles on solid surface. In
our case, the soil analysis (Table 3-1) showed the clay content is 18%, 15%, and 16%,
suggesting a high surface charge heterogeneities for SL1 soil.

75
Table 3-3. Simulation parameters obtained by fitting breakthrough curves of column experiments to the model.
Soil 𝑣𝑝a C0
b Ret.c MBd λe 𝑘𝑑𝑒𝑝f 𝑆𝑚𝑎𝑥*g R2
cm/min g/L % % cm min-1 m3/g
SL1 0.169 0.017 37.1 93.5 0.359 0.252 1.5110-3 0.992
SL2 0.202 0.017 4.3 111.4 0.207 0.001 1.2810-3 0.991
0.808 0.017 0.7 - 0.423 0.001 1.8610-4 0.987
0.121 0.017 33.1 - 0.070 0.003 5.7510-1 0.995
0.040 0.017 81.1 - - - - 0.612
0.202 0.087 6.8 - 0.207 0.001 3.2910-3 0.998
0.202 0.174 6.9 - 0.207 0.001 4.2210-3 0.998
SL3 0.153 0.017 36.4 96.0 0.395 0.004 1.4210-1 0.981
a Pore velocity. b Injection MnO2 concentration. c Retention of CMC-MnO2, Ret.=1-Meff/Minj, where Meff is the effluent mass of MnO2
calculated by integrating the BTCs, Minj is the total injected mass of MnO2. d Mass balance of MnO2.
e Longitudinal dispersivity.
f First-order deposition coefficient. g 𝑆𝑚𝑎𝑥*=𝑆𝑚𝑎𝑥 /C0, where 𝑆𝑚𝑎𝑥 is the maximum MnO2 deposition concentration.
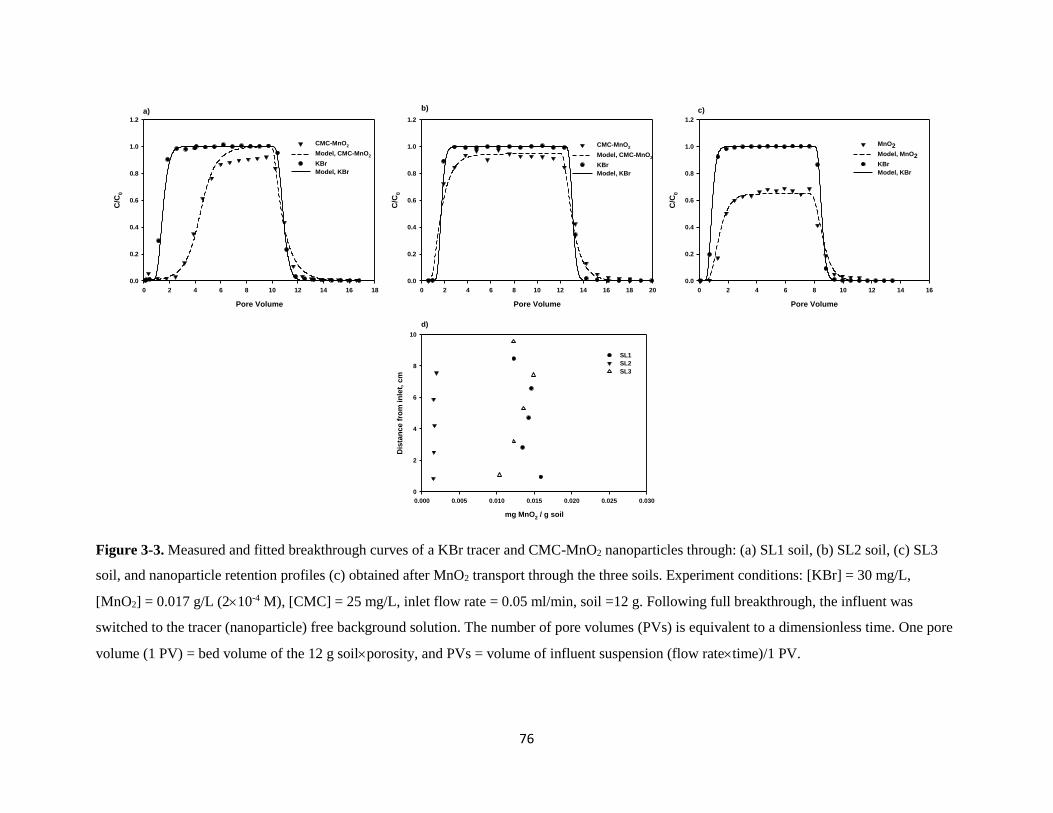
76
Figure 3-3. Measured and fitted breakthrough curves of a KBr tracer and CMC-MnO2 nanoparticles through: (a) SL1 soil, (b) SL2 soil, (c) SL3
soil, and nanoparticle retention profiles (c) obtained after MnO2 transport through the three soils. Experiment conditions: [KBr] = 30 mg/L,
[MnO2] = 0.017 g/L (210-4 M), [CMC] = 25 mg/L, inlet flow rate = 0.05 ml/min, soil =12 g. Following full breakthrough, the influent was
switched to the tracer (nanoparticle) free background solution. The number of pore volumes (PVs) is equivalent to a dimensionless time. One pore
volume (1 PV) = bed volume of the 12 g soilporosity, and PVs = volume of influent suspension (flow ratetime)/1 PV.
Pore Volume
0 2 4 6 8 10 12 14 16 18
C/C
0
0.0
0.2
0.4
0.6
0.8
1.0
1.2
CMC-MnO2
Model, CMC-MnO2
KBr
Model, KBr
a)
Pore Volume
0 2 4 6 8 10 12 14 16 18 20
C/C
0
0.0
0.2
0.4
0.6
0.8
1.0
1.2
CMC-MnO2
Model, CMC-MnO2
KBr
Model, KBr
b)
Pore Volume
0 2 4 6 8 10 12 14 16
C/C
0
0.0
0.2
0.4
0.6
0.8
1.0
1.2
MnO2
Model, MnO2
KBr
Model, KBr
c)
mg MnO2 / g soil
0.000 0.005 0.010 0.015 0.020 0.025 0.030
Dis
tan
ce
fro
m i
nle
t, c
m
0
2
4
6
8
10
SL1
SL2
SL3
d)

77
Figure 3-4. Measured duplicate breakthrough curves of CMC-MnO2 nanoparticles
through: (a) SL1 soil, (b) SL2 soil, and (c) SL3 soil. Experiment conditions: [MnO2] =
0.017 g/L (210-4 M), [CMC] =25 mg/L, inlet flow rate = 0.05 ml/min, soil = 12 g.
Pore Volume
0 2 4 6 8 10 12 14 16 18
C/C
0
0.0
0.2
0.4
0.6
0.8
1.0
1.2
1st
2nd
a)
Pore Volume
0 2 4 6 8 10 12 14 16 18 20
C/C
0
0.0
0.2
0.4
0.6
0.8
1.0
1.2
1st
2nd
b)
Pore Volume
0 2 4 6 8 10 12 14
C/C
0
0.0
0.2
0.4
0.6
0.8
1.0
1.2
1st
2nd
c)

78
Figure 3-5. MnO2 sorption kinetics in three soils. Experiment conditions: [MnO2] =
0.017 g/L (210-4 M), [CMC] = 25 mg/L, soil-to-MnO2 suspension ratio of 1 (g):10 (mL).
Time, hour
0 50 100 150 200 250
MM
nO
2/M
So
il (
mg
/g)
0.00
0.05
0.10
0.15
0.20
SL1
SL2
SL3
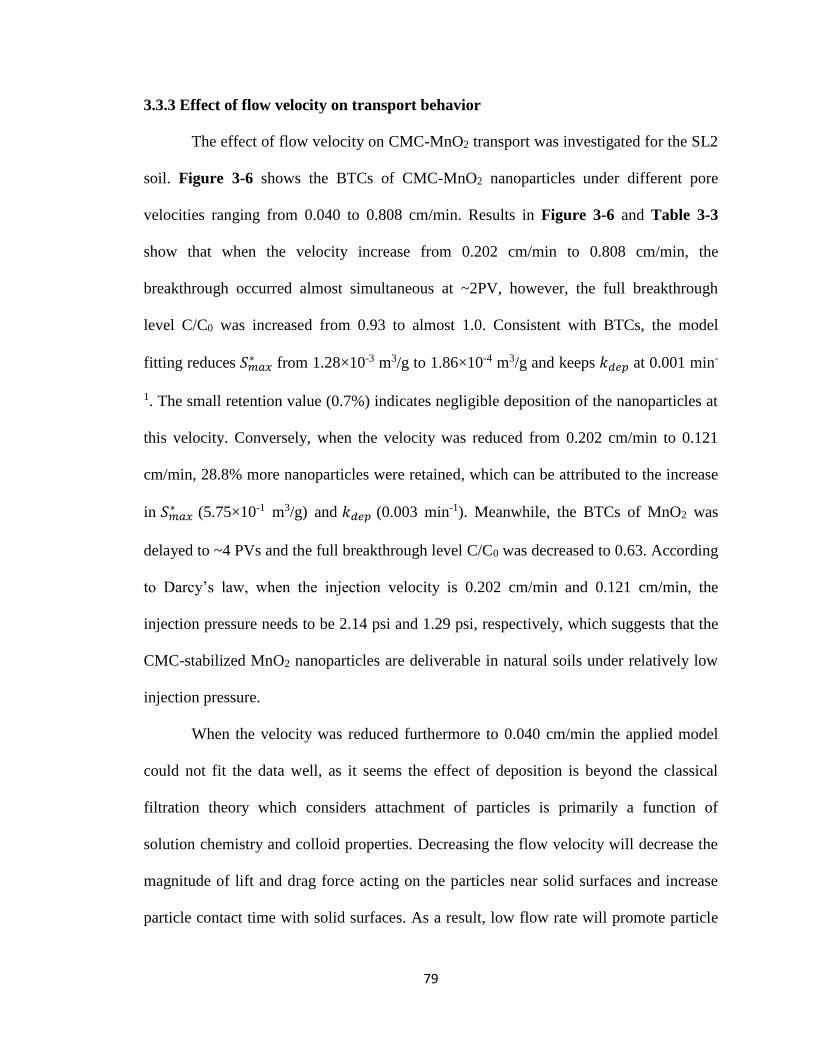
79
3.3.3 Effect of flow velocity on transport behavior
The effect of flow velocity on CMC-MnO2 transport was investigated for the SL2
soil. Figure 3-6 shows the BTCs of CMC-MnO2 nanoparticles under different pore
velocities ranging from 0.040 to 0.808 cm/min. Results in Figure 3-6 and Table 3-3
show that when the velocity increase from 0.202 cm/min to 0.808 cm/min, the
breakthrough occurred almost simultaneous at ~2PV, however, the full breakthrough
level C/C0 was increased from 0.93 to almost 1.0. Consistent with BTCs, the model
fitting reduces 𝑆𝑚𝑎𝑥∗ from 1.28×10⁻³ m3/g to 1.86×10⁻⁴ m3/g and keeps 𝑘𝑑𝑒𝑝 at 0.001 min-
1. The small retention value (0.7%) indicates negligible deposition of the nanoparticles at
this velocity. Conversely, when the velocity was reduced from 0.202 cm/min to 0.121
cm/min, 28.8% more nanoparticles were retained, which can be attributed to the increase
in 𝑆𝑚𝑎𝑥∗ (5.75×10⁻¹ m3/g) and 𝑘𝑑𝑒𝑝 (0.003 min-1). Meanwhile, the BTCs of MnO2 was
delayed to ~4 PVs and the full breakthrough level C/C0 was decreased to 0.63. According
to Darcy’s law, when the injection velocity is 0.202 cm/min and 0.121 cm/min, the
injection pressure needs to be 2.14 psi and 1.29 psi, respectively, which suggests that the
CMC-stabilized MnO2 nanoparticles are deliverable in natural soils under relatively low
injection pressure.
When the velocity was reduced furthermore to 0.040 cm/min the applied model
could not fit the data well, as it seems the effect of deposition is beyond the classical
filtration theory which considers attachment of particles is primarily a function of
solution chemistry and colloid properties. Decreasing the flow velocity will decrease the
magnitude of lift and drag force acting on the particles near solid surfaces and increase
particle contact time with solid surfaces. As a result, low flow rate will promote particle

80
deposition in small pores (Bergendahl and Grasso, 2000). Once a large amount of
particles has been deposited in the small pores near the inlet, they will block other
particles from passing, as the particles are accumulated, the large pores become smaller
and smaller, and the effluent of MnO2 was decreased (Figure 3-6). When the
nanoparticles completely block the inlet, the nanoparticle effluent becomes zero. This
result suggests that under groundwater flow velocity, the natural transport of CMC-MnO2
is rather confined.

81
Figure 3-6. Breakthrough curves of CMC-MnO2 nanoparticles through SL2 soil at
different pore velocities. Experiment conditions: [MnO2] = 0.017 g/L (210-4 M), [CMC]
= 25 mg/L, soil = 12 g.
Pore Volume
0 5 10 15 20 25 30
C/C
0
0.0
0.2
0.4
0.6
0.8
1.0
1.2
0.808 cm/min
Model, 0.808 cm/min
0.202 cm/min
Model, 0.202 cm/min
0.121 cm/min
Model, 0.121 cm/min
0.04 cm/min
Model, 0.04 cm/min

82
3.3.4 Effect of nanoparticle concentration on transport behavior
Figure 3-7 shows the BTCs of CMC-MnO2 nanoparticles under different MnO2
concentrations ranging from 0.017 g/L to 0.17 g/L. The result shows that the normalized
effluent concentration C/C0 was almost unchanged with the elevated inlet concentrations.
In the concentration range of the experiment, the breakthroughs of MnO2 all occurred at
~2 PVs, and the full breakthrough level C/C0 were all approximately to 0.93. Consistent
with the BTCs, the model fitted 𝑘𝑑𝑒𝑝 values were similar in the three tests (Table 3-3).
The normalized 𝑆𝑚𝑎𝑥∗ value (𝑆𝑚𝑎𝑥
∗ =𝑆𝑚𝑎𝑥/𝐶0) is increased slightly with increasing initial
MnO2 concentration, and the 𝑆𝑚𝑎𝑥∗ is 1.28×10⁻³, 3.29×10⁻³, and 4.22×10⁻³ for initial
concentration 𝐶0 of 0.017 g/L, 0.087 g/L, and 0.174 g/L respectively. The DLS
measurement showed the particle size was 39.50.8 nm, 401 nm, and 422 nm, and δ-
potential was -342 mV, -323 mV, and -332 mV for the particle concentration of
0.017 g/L, 0.085 g/L, and 0.17 g/L, respectively. This result agreed with clean bed
filtration theory, which means that once the particle size and potential energy of the
nanoparticles are identical, the concentration of particle did not influence the deposition
behavior. These results thereby suggest that the synthesized CMC stabilized
nanoparticles deliver well in soil even at higher MnO2 concentration which may be
required for site remediation.

83
Figure 3-7. Breakthrough curves of different concentrations of CMC-MnO2
nanoparticles through SL2 soil. Experiment conditions: [MnO2] = 0.017 g/L (210-4 M),
[CMC] = 25 mg/L, soil = 12 g.
Pore Volume
0 5 10 15 20 25 30
C/C
0
0.0
0.2
0.4
0.6
0.8
1.0
1.2
0.017 g/L
Model, 0.017 g/L
0.087 g/L
Model, 0.087 g/L
0.174 g/L
Model, 0.174 g/L

84
3.3.5 Degradation of E2 in three soils
The effectiveness of the CMC-stabilized MnO2 nanoparticles for in-situ
degradation of E2 in soil was investigated through a series of 1D column experiments.
Figure 3-8(a)-(c) shows the elution histories of E2 from SL1, SL2, and SL3 soil during
the nanoparticle treatments. For comparison, the same elution test was also carried out
using a CMC solution without the nanoparticles under otherwise identical conditions
(control). To confirm the reproducibility of the experimental system, duplicates were
conducted and results are shown in Figure 3-9. Figure 3-8 shows that under identical
conditions, nanoparticle suspension eluted less E2 than particle-free solution through the
three soils. Han et al. (2015) demonstrated soil-sorbed E2 could be oxidatively destroyed
by CMC-stabilized MnO2 nanoparticles through batch tests. The decreasing of E2 elution
in MnO2 treated columns were due to oxidative degradation of E2 by the nanoparticles.
The E2 degradation efficiency in different soils are shown in Table 3-4. For SL1,
the CMC solution eluted ~72% of E2 initially sorbed in the soil, while the nanoparticle
suspension eluted ~56% of E2 during the 20 PVs of the column runs (Figure 3-8(a)), i.e.,
the nanoparticle treatment degraded ~22% of the water leachable E2. For SL2, after
nanoparticle treatment, leachable E2 was reduced from ~67% to ~8% (Figure 3-8(b)),
i.e., the nanoparticles were able to degrade ~88% of water leachable E2 from SL2. For
SL3 soil (Figure 3-8(c)), after treatment, leachable E2 was reduced from ~8% to ~7%,
i.e., the nanoparticles degraded ~13% of the water leachable E2. To investigate total E2
degradation by nanoparticles, E2 remaining in the soil was extracted and analyzed. For
SL1, after CMC solution flushing, E2 residual in soil was ~20% of E2 initially sorbed in
the soil, while E2 residual was reduced to ~17% after treatment with nanoparticles

85
(Table 3-4), i.e., the nanoparticle treatment degraded ~15% of the non-leachable E2
during the 20 PVs of the column runs. For SL2, E2 remaining in the soil was reduced
from ~24% to ~14% after nanoparticle treatment, i.e., the nanoparticles degraded 42% of
the non-leachable E2. For SL3, E2 remaining in the soil was reduced from 75% to 61%
after degradation with nanoparticle suspension, i.e., the nanoparticles were able to
degrade 19% of the non-leachable E2. Based on mass balance, addition of E2 eluted and
remaining in soil, E2 recovery was 92%, 91%, and 83% for SL1, SL2, and SL3 when
pumping through CMC solution (control test), respectively. The loss of E2 in the control
test was probably due to adsorption of E2 in the PTFE tubing and soil loss in the process
of transfer from column to extraction bottles. These results indicate pumping through
MnO2 nanoparticles could not only degrade water-leachable E2 but also soil immobilized
E2.
The E2 sorption capacity for the three soils are different. The E2 sorption was the
lowest in SL1 with a loading mass of 0.0019 mg-E2/g-soil compared to SL2 (0.0065 mg-
E2/g-soil) and SL3 (0.0104 mg-E2/g-soil). In contrast, when flushing with CMC solution,
the elution of E2 was highest for SL1 soil with an elution concentration >1 mg/L in first
2.5 PVs (Figure 3-8). These results indicate a weak binding of E2 to SL1. Compared to
SL1, E2 elution is much slower in SL2 and SL3, and the highest elution concentration
was 0.43 mg/L and 0.05 mg/L, respectively. To further study the E2 mass transfer from
the soils, E2 successive desorption batch tests were conducted and results are shown in
Figure 3-10. Consistent with the E2 elution history, E2 desorption was highest in SL1,
and ~30% of initial sorbed E2 was able to desorb from soil in 20 min. After the second
desorption batch, ~70% of the initial E2 was desorbed from SL1 soil which corresponds

86
with 68% elution of E2 by CMC solution. For SL2, ~15% of initial sorbed E2 was
desorbed in 20 min, and ~40% of the initial E2 was desorbed from soil after the second
desorption run. For SL3 soil, only ~4% of the initial loaded E2 was desorbed from soil
after two runs of desorption batch. The disparate sorption affinity of E2 to soils is due to
the different organic matter (OM) content of the soils, for instance, the OM content is
0.4%, 1.3%, and 5.9% for SL1, SL2, and SL3, respectively. The dominant E2 sorption
mechanism is reported to be hydrophobic partitioning (Lee et al. 2003), thus higher OM
content soil have higher affinity to this hormone.
It is noted from Figure 3-8 that the MnO2 degradation efficiency of water
leachable E2 is much higher for SL2 than SL1 and SL3. The results indicate that the
effectiveness of the stabilized MnO2 nanoparticles is affected by both mass transfer of E2
and MnO2, i.e., the desorption rate of E2 from soil and transport of the nanoparticles
through the soil. SL1 has a much lower adsorption capacity for E2, but a much faster
desorption rate (as indicated by the high elution peak in Figure 3-8(a)), and SL1 has a
quicker adsorption rate for MnO2. When the nanoparticle influent passed through the soil
bed, MnO2 nanoparticles were quickly adsorbed on the soil and resulted in a retarded
transport of the nanoparticles relative to water (Figure 3-3(a)); thus the adsorbed E2 was
eluted by water before contacting with the nanoparticles, resulting in the observed lower
degradation rate. In contrast, SL2 has a greater E2 sorption capacity and a slower
desorption rate, and on the other hand, MnO2 had a faster breakthrough with almost no
retardation (Figure 3-3(b)), which allowed sufficient contact and reaction time to
complete the degradation. The E2 sorption affinity is too high in SL3 to elute out, so the
adsorbed E2 can hardly leach to groundwater.
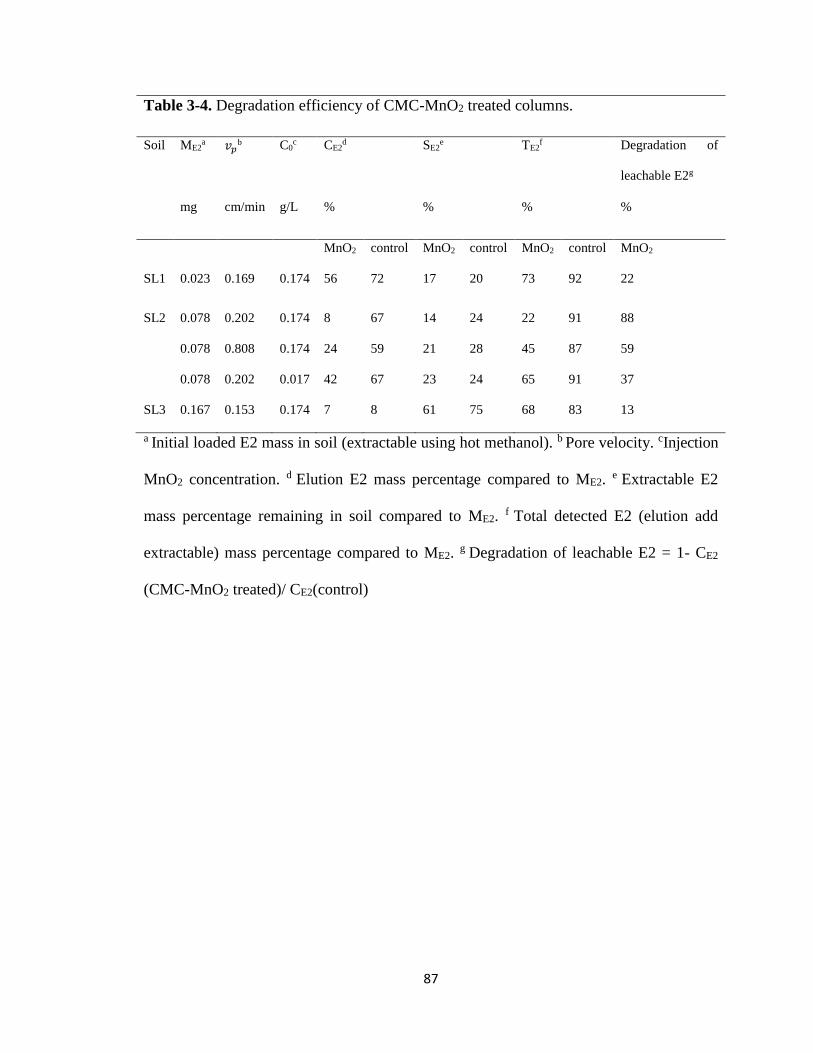
87
Table 3-4. Degradation efficiency of CMC-MnO2 treated columns.
Soil ME2a 𝑣𝑝
b C0c CE2
d SE2e TE2
f Degradation of
leachable E2g
mg cm/min g/L % % % %
MnO2 control MnO2 control MnO2 control MnO2
SL1 0.023 0.169 0.174 56 72 17 20 73 92 22
SL2 0.078 0.202 0.174 8 67 14 24 22 91 88
0.078 0.808 0.174 24 59 21 28 45 87 59
0.078 0.202 0.017 42 67 23 24 65 91 37
SL3 0.167 0.153 0.174 7 8 61 75 68 83 13
a Initial loaded E2 mass in soil (extractable using hot methanol). b Pore velocity. cInjection
MnO2 concentration. d Elution E2 mass percentage compared to ME2. e Extractable E2
mass percentage remaining in soil compared to ME2. f Total detected E2 (elution add
extractable) mass percentage compared to ME2. g Degradation of leachable E2 = 1- CE2
(CMC-MnO2 treated)/ CE2(control)

88
Figure 3-8. Elution histories of E2 from soils when subjected to a background CMC solution and
a suspension of CMC-MnO2 nanoparticles: (a) SL1 soil (E2 = 0.0019 mg-E2/g-soil), (b) SL2 soil
(E2 = 0.0065 mg-E2/g-soil), and (c) SL3 soil (E2 = 0.0104 mg-E2/g-soil). Experiment conditions:
MnO2=0.174 g/L (210-3 M), CMC=250 mg/L, inlet flow rate=0.05 ml/min, soil =12 g.
Pore Volume
0 5 10 15 20 25
Es
tra
dio
l C
on
c.,
mg
/L0.0
0.2
0.4
0.6
0.8
1.0
1.2
Control
CMC-MnO2
a)
Pore Volume
0 20 40 60 80 100 120 140
Es
tra
dio
l C
on
c.,
mg
/L
0.0
0.1
0.2
0.3
0.4
0.5
Control
CMC-MnO2
b)
Pore Volume
0 20 40 60 80 100
Es
tra
dio
l C
on
c.,
mg
/L
0.0
0.1
0.2
0.3
0.4
0.5
Control
CMC-MnO2
c)
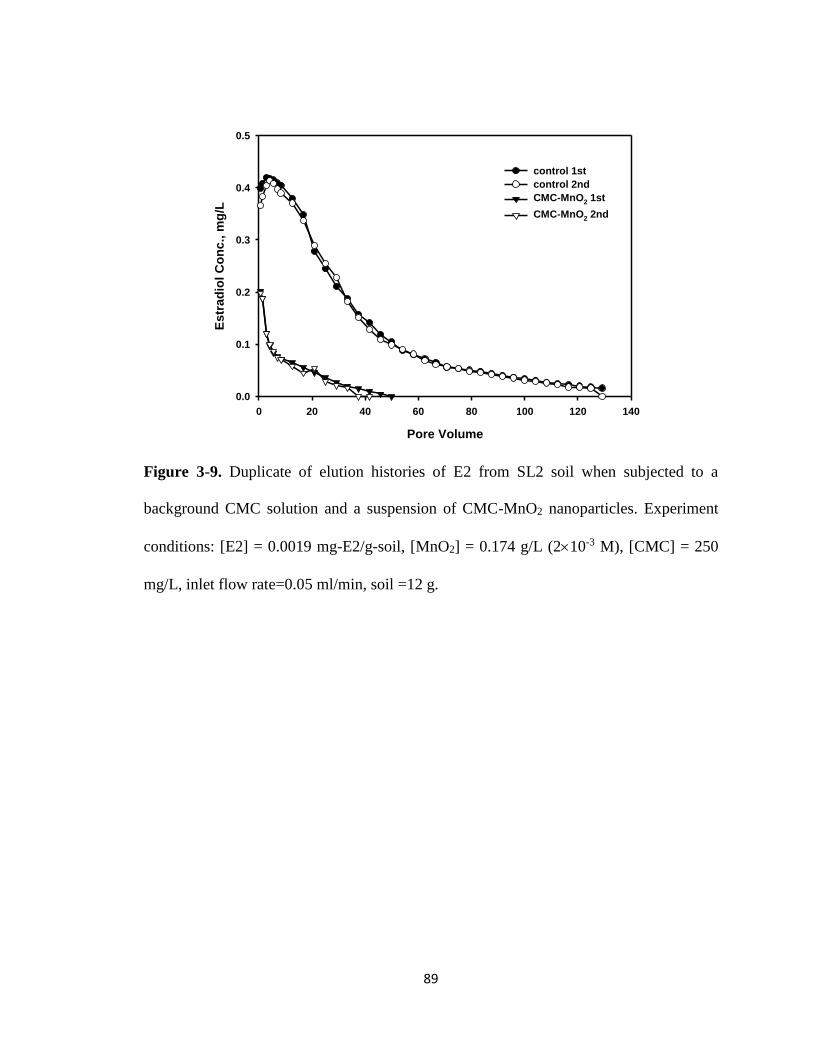
89
Figure 3-9. Duplicate of elution histories of E2 from SL2 soil when subjected to a
background CMC solution and a suspension of CMC-MnO2 nanoparticles. Experiment
conditions: [E2] = 0.0019 mg-E2/g-soil, [MnO2] = 0.174 g/L (210-3 M), [CMC] = 250
mg/L, inlet flow rate=0.05 ml/min, soil =12 g.
Pore Volume
0 20 40 60 80 100 120 140
Es
tra
dio
l C
on
c.,
mg
/L
0.0
0.1
0.2
0.3
0.4
0.5
control 1st
control 2nd
CMC-MnO2 1st
CMC-MnO2 2nd

90
Figure 3-10. E2 (a) sorption kinetics with three soils (initial aqueous [E2] = 410-6 M), and successive desorption kinetics in (b) SL1 soil, (c) SL2
soil, and (d) SL3 soils. In figure (b)-(d) Mt: E2 remaining in soil at time t; M0: initial E2 in soil (0.0019 mg/g for SL1, 0.0065 mg/g for SL2, and
0.0104 mg/g for SL3).
Time, hour
0 2 4 6 8 10 12 14 16
ME
2/
Mso
il (
mg
/ g
)
0.000
0.002
0.004
0.006
0.008
0.010
0.012
SL1
SL2
SL3
a)
Time, day
0 2 4 6 8 10 12 14
Mt /
M0
0.0
0.2
0.4
0.6
0.8
1.0
1.2
SL1
b)
Time, day
0 1 2 3 4 5 6
Mt /
M0
0.0
0.2
0.4
0.6
0.8
1.0
1.2
SL2
c)
Time, day
0 1 2 3 4 5 6M
t /
M0
0.0
0.2
0.4
0.6
0.8
1.0
1.2
SL3
d)

91
3.3.6 Effect of flow velocity on degradation behavior
The effect of flow velocity on CMC-MnO2 degradation was investigated for the
SL2 soil. Figure 3-11 shows the elution histories of E2 under different pore velocities of
0.202 and 0.808 cm/min for injection of nanoparticles and particle-free solution. Figure
3-11 and Table 3-4 show that when the injection velocity of nanoparticles was increased
from 0.202 cm/min to 0.808 cm/min, the elution of E2 was increased from 8% of the
initial loaded E2 to 24%. In the same way, E2 remaining in soil was increased from 14%
to 21%. These results indicate a less degradation of both water-leachable and soil-sorbed
E2 under higher injection velocity of nanoparticles.
Under injection of particle free solution (control), when the velocity was
increased from 0.202 cm/min to 0.808 cm/min, the elution of E2 was first increased
dramatically in initial 5 PVs and then decreased in the following 70 PVs, and the total
elution was reduced slightly from 67% to 59%. It is noted that the nanoparticle treatment
elution curves of two velocities showed significant discrepancy in the first 5 PVs, and the
E2 elution was significant higher under the velocity of 0.808 cm/min. Comparing the
control and MnO2 elution curves indicate that the faster desorption of E2 in initial several
PVs was one reason that caused the less degradation of E2 in high velocities. The MnO2
nanoparticle transport behavior (Figure 3-6) showed a simultaneous breakthrough of the
particles under the two velocities, and even a higher retention of the particle in lower
velocities. Although the breakthrough occurred at the same pore volume, the empty bed
contact time (BECT) of the particles is inversely proportional to velocities, which means
the life-time of the particle in the column is three times longer at 0.202 cm/min than
0.808 cm/min. The faster MnO2 transport rate at high velocity shortened the nanoparticles

92
from contacting with the contaminants, resulting in the observed lower degradation rate.
In contrast, the nanoparticle transport was slower at a low velocity, which allowed
sufficient contact and reaction time to degrade E2.
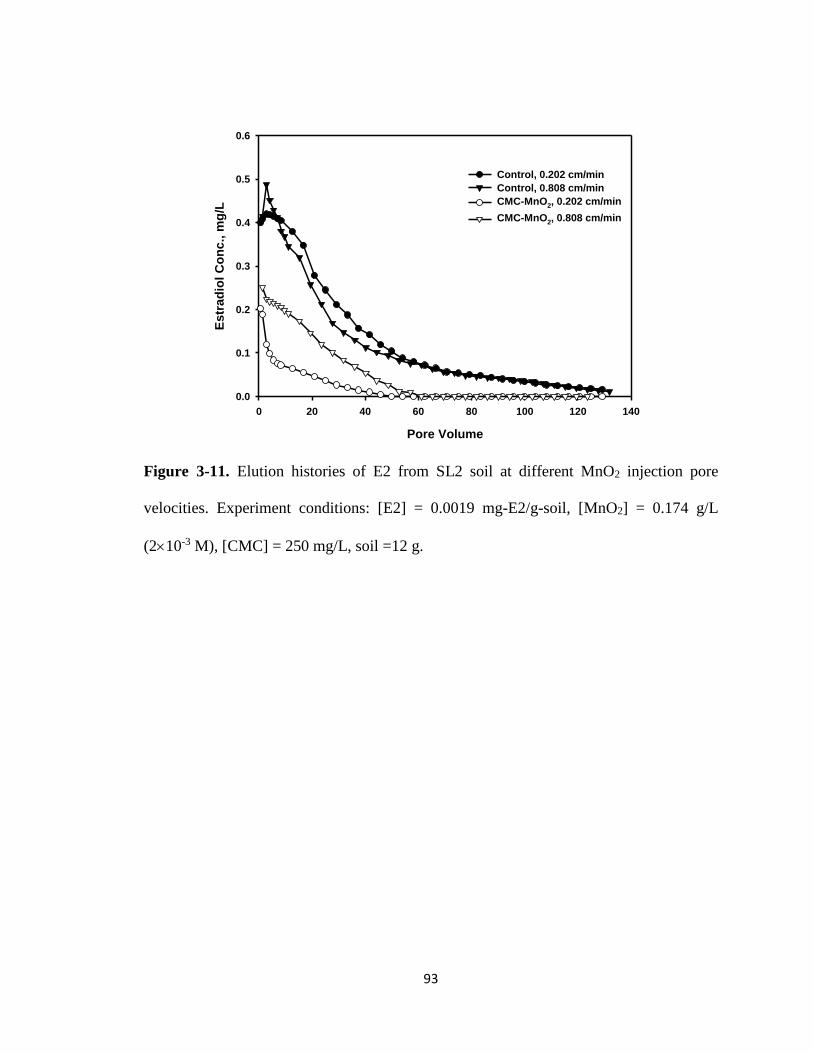
93
Figure 3-11. Elution histories of E2 from SL2 soil at different MnO2 injection pore
velocities. Experiment conditions: [E2] = 0.0019 mg-E2/g-soil, [MnO2] = 0.174 g/L
(210-3 M), [CMC] = 250 mg/L, soil =12 g.
Pore Volume
0 20 40 60 80 100 120 140
Es
tra
dio
l C
on
c.,
mg
/L
0.0
0.1
0.2
0.3
0.4
0.5
0.6
Control, 0.202 cm/min
Control, 0.808 cm/min
CMC-MnO2, 0.202 cm/min
CMC-MnO2, 0.808 cm/min

94
3.3.7 Effect of particle concentration on degradation behavior
Figure 3-12 shows the elution histories of E2 under different MnO2 injection
concentrations of 0.17 g/L and 0.017 g/L. When the injection MnO2 concentration was
decreased from 0.174 g/L to 0.017 g/L, the elution of E2 was increased significantly from
8% to 42%. Comparing to the control test, the degradation of leachable E2 was decreased
from 88% to 37% when the injection particle concentration was reduced to one tenth
(Table 3-4). After treatment with 0.017 g/L MnO2 for 120 PVs, there is still 23% of
initial E2 remaining in the soil, which showed almost no degradation for non-leachable
E2 comparing to control test (24% remaining) (Table 3-4). The lower than anticipated
degradation of E2 in the soil is probably due to the small amount of retention of CMC-
MnO2 by SL2 soil (Table 3-3). The high mobility and small amount of retention of
CMC-MnO2 in soil resulted in a difficult access of nanoparticles to soil immobilized E2.
Han et al. (2015) reported several factors such as soil-MnO2 interactions and soil-released
metals and reductants could inhibit the oxidation effectiveness, so high dosage of MnO2
is needed for effective field remediation of E2.

95
Figure 3-12. Elution histories of E2 from SL2 soil under different MnO2 injection
concentrations. Experiment conditions: [E2] = 0.0019 mg-E2/g-soil, inlet flow rate=0.05
ml/min, soil =12 g.
Pore Volume
0 20 40 60 80 100 120 140
Es
tra
dio
l C
on
c.,
mg
/L
0.0
0.1
0.2
0.3
0.4
0.5
Control
0.174 g/L
0.0174 g/L
96
3.4. Conclusions
The direct injection of nanoparticles into contaminated aquifers has been
suggested as a promising technology for in-situ remediation of contaminants. This work
tested CMC-stabilized MnO2 nanoparticles for in-situ oxidative degradation of soil-
sorbed E2 in saturated aquifers. The CMC-stabilized MnO2 nanoparticles exhibited high
deliverability in natural soils; however, the mobility of the nanoparticles may be
influenced by several factors concerning 1) nanoparticle surface chemistry, 2) soil surface
chemistry and geochemical heterogeneities, and 3) groundwater hydrology. Well
controlled column transport tests were conducted using three natural soils to address the
transport behavior in porous media of varied complexities. Our results suggested MnO2
deposition is much higher in soils that offer more favorable deposition sites than those
that are unfavorable for deposition, which could be predicted based on the collector
average surface potential. Surface charge heterogeneity which is related to the clay
fraction is also a key factor controlling the deposition of nanoparticles onto soil surface.
The shape of the BTCs of the nanoparticles was determined by both the available
favorable solid surface area and the mass transfer rate of the nanoparticles to the
favorable sites. The former influences the fully breakthrough concentration level (C/C0)
and the latter influences the breakthrough time. The BTCs were successfully simulated
using an advection-dispersion equation that accounted for irreversible deposition and
blocking. Results showed that the 𝑆𝑚𝑎𝑥∗ values reflected the available favorable
deposition sites on the solid surface, and 𝑘𝑑𝑒𝑝 values reflected the mass transfer rate of
the nanoparticles to deposition sites, which are two parameters predicting the
nanoparticle deposition rate. The 𝑆𝑚𝑎𝑥∗ and 𝑘𝑑𝑒𝑝 values are both increasing with

97
decreasing flow velocity. The results indicate the transport of the NPs can be controlled
by manipulating the injection pressure or pore velocity. Under natural groundwater
conditions, the delivered CMC-MnO2 nanoparticles will remain in a confined domain
facilitating in-situ oxidation of the contaminants.
This study first simulates the in-situ degradation of soil-sorbed E2 through
column tests, and provides insights into MnO2 nanoparticle degradation behavior in real
natural conditions. Results showed the degradation efficiency of the nanoparticles may be
influenced by several factors, such as soil properties, particle injection velocity, and
particle injection concentration. The combination of these factors affects the nanoparticle
degradation behavior in one key aspect, i.e., the contact time of the nanoparticles with the
contaminants. The nanoparticles are more effective for soils of moderate or high organic
contents that offer slow E2 desorption rate and a less delayed MnO2 breakthrough which
allow sufficient contact and reaction time to complete the degradation. For the same soil,
reducing injection velocity could increase particle and contaminant contact time, but on
the other aspect, reducing velocity could also increase nanoparticle retention by soil.
Therefore, choosing an optimal nanoparticle injection velocity is important. Compared to
water treatment, high dosage of MnO2 is needed to effective degradation of soil-sorbed
E2. This study provides a frame work for lab test of in-situ degradation of soil-sorbed
contaminants using nanoparticle treatment, and confirmed this in-situ remediation
technology may provide a powerful strategy to degrade E2 and other endocrine disruptors
in soil and groundwater.
98
CHAPTER 4. CATALYTIC HYDRODECHLORINATION OF TRICLOSAN
WITH ANION-EXCHANGE-RESIN SUPPORTED PALLADIUM
4.1 Introduction
Triclosan (5-chloro-2-(2,4-dichlorophenoxy)phenol, TCS) is a broad-spectrum
antimicrobial used worldwide, as a preservative or an antiseptic agent in many personal
care (e.g., toothpaste, soaps, deodorants, shampoos, and cosmetics) and household (e.g.,
plastic additives) products. Being a pharmaceutical and personal care product (PPCP)
ingredient, substantial amounts of TCS are discharged into wastewater treatment plants
(WWTPs). Studies on the fate of TCS during wastewater treatment indicated that TCS
can be removed by wastewater treatment plant with a high efficiency of 80%-96%
(Bester, 2003; Winkler et al., 2007). However, residues of TCS are still detected in
effluents, leading to discharge in surface water. The U.S. Geological Survey reported that
TCS was among the seven most frequently detected organic contaminants in 139 streams
sampled across 30 states with the median concentration of 0.14 µg/L (Kolpin et al., 2002).
In addition, the TCS removed by activated sludge was not degraded by biomass, the
antimicrobials distributed themselves into carbon- and lipid-rich sewage sludge, and
accumulated in the biosolids (Heidler and Halden, 2007; Winkler et al., 2007).
There is growing concerns raised over TCS’s persistence in the environment and
its potential risk to aquatic lives and humans. TCS is concerned as an endocrine
disrupting chemical and reported to have adverse effects on thyroid hormone homeostasis
(Veldhoen et al., 2006). Moreover, TCS, which was found to accumulate in various
99
aquatic organisms, is highly toxic to certain types of algae and fish (Ishibashi et al., 2004;
Orvos et al., 2002). Orvos et al. (2002) reported that 96 h median lethal concentration
values of TCS for Pimephales promelas and Lepomis macrochirus were 260 and 370
µg/L, respectively. As an antibiotic, TCS may induce the bacterial resistance
development (McMurry et al., 1998). Of particular concern is sewage sludge, where an
abundance of pathogens and multiple antibiotics coexist, and thus creating a large risk of
drug resistance for the pathogens (Halden, 2014). In addition, TCS may form highly toxic
chlorodioxins during incineration or under sunlight (Kanetoshi et al., 1987; 1988).
Various oxidation treatment processes were applied to degrade TCS in drinking
water and wastewater plants including chlorine oxidation, ozonation, and sunlight or UV
irradiation. However, these technologies produce more toxic byproducts (Inaba et al.,
2006; Klamerth et al., 2010; Latch et al., 2005; Rule et al., 2005). Therefore, other
techniques are needed to investigate to decrease the toxicity of TCS.
Hydrodechlorination (HDC) is a method of reductive degradation of chlorinated
organic compounds by hydrogen gas with release of inorganic chloride ions. Catalytic
HDC appears as an attractive technology for its complete destruction and elimination of
the toxicity of the chlorinated aliphatic and aromatic compounds with minimum
activation energy requirement (Janiak and Okal, 2009; Pizarro et al., 2014; Srebowata et
al., 2014; Zhang et al., 2013; Zhou et al., 2013). For instance, Schuth and Reinhard (1998)
demonstrated that an alumina supported palladium (Pd) was able to catalytic HDC of
aromatic compounds. They reported chlorinated benzenes and lindane were completely
hydrodechlorinated to benzene, and biphenyl and polycyclic aromatic hydrocarbons
(PAHs) were partially or completely hydrogenated to cleave the double bound of benzene

100
ring. One of the most frequently used catalysts in catalytic HDC was Pd for its high
efficiency in catalysis and its activity under ambient pressure and temperature. The
mechanism of Pd in HDC is considered to facilitate C-Cl bound cleavage and formation
of highly reactive atomic hydrogen (Chen et al., 2002; Lowry and Reinhard 2001).
To enhance metal dispersion and achieve recycle use of catalysts, Pd is often
loaded on supports. Among various support materials, the most common ones are
activated carbon (AC) and alumina (Al2O3) (Chaplin et al., 2012; Diaz et al., 2011; Zhang
et al., 2013). In spite of many advantages of catalytic HDC, in many cases the catalysts
suffered from loss of catalytic activity. The deactivation of Pd catalysts on supporting
materials is commonly due to Pd leaching, chloride poisoning, sintering, or accumulation
of products on the catalyst surface (Concibido et al., 2007; Diaz et al., 2011; Janiak and
Okal, 2009; Yuan and Keane, 2003; 2004). Conventionally, Pd particles are prepared in
the ionic form in solution and then loaded on a support via the incipient wetness
impregnation method. However, due to the lack of specific interactions between Pd and
the supporting materials, the loaded Pd catalysts are prone to leach, leading to loss of
catalytic activity. For instance, Yuan and Keane (2004) tested carbon and alumina
supported Pd activity in HDC of dichlorophenol, and observed a 34% of Pd leaching with
carbon support compared to 10% with alumina support, and suggested a stronger metal
support interactions between Pd and alumina. To enhance Pd interaction with supporting
material further to reduce Pd leaching, Gasparovicova et al. (2006) prepared a Pd-Cu
catalyst supported on strong cationic resins to reduce nitrates, and found undetectable of
Pd leaching from the supports. They observed a better selectivity to N2 production with

101
resin-supported catalyst, but lower activity than those obtained with inorganic supports
(Al2O3).
Compare to conventional supports such as alumina and AC, functional polymers
may offer some advantages when used for preparing supported catalysts. First, the
polymer resin may form strong specific interaction with Pd through chemical binding
(ionic bounds) or physical size exclusion (porosity), and therefore reduce Pd leaching
from the support. Second, the chemical interaction between resin and Pd allows a
different loading method (e.g., ion-exchange and then reduce under normal temperature)
from the incipient wetness impregnation approach. This method may eliminate
calcination and thereby save energy and reduce cost. Moreover, there have been diverse
types of ion exchange resins available on the market with a wide range of physical-
chemical characteristics (functionality, porosity, matrix hydrophobicity, and surface area),
which allow researchers to choose different resins for different purpose.
In this study, a new class of Pd catalysts supported on two strong basic anion
(SBA) exchange resins Amberlite IRA-900 and Amberlite IRA-958 were prepared by
ion-exchange and subsequent reduction method, and the liquid phase catalytic HDC of
TCS on the catalysts was investigated. The specific objectives of this study were to: 1)
Prepare and characterize of the resin-supported Pd catalysts; 2) Determine the effects of
Pd loading, type of resin matrix, and dissolved organic matter (DOM) on the
effectiveness of HDC of TCS; and 3) Identify the reaction pathway of catalytic HDC of
TCS. To the best of our knowledge, this has been the first study on degradation of TCS
using a reduction method.
4.2. Materials and methods

102
4.2.1 Materials
The following chemicals of analytical or higher grade were used: triclosan (5-
chloro-2-(2,4-dichlorophenoxy)phenol, C12H7Cl3O2, purity >99%, Alfa Aesar, Ward Hill,
MA, USA), sodium tetrachloropalladate (II) trihydrate (Na2PdCl43H2O, 99%, Strem
Chemicals, Newburyport, MA, USA), sodium borohydride (NaBH4, ICN Biomedicals,
Aurora, OH, USA), dichloromethane (CH2Cl2, Honeywell, Muskegon, MI, USA), and
Fluka humic acid No. 53680 (Sigma-Aldrich, St. Louis, MO, USA). Methanol (CH4O,
Alfa Aesar) and acetonitrile (CH3CN, EMD Millipore, Billerica, MA, USA) were of
HPLC grade (>99% purity). A stock solution of triclosan was prepared at 0.01 M in
methanol. All other solutions were prepared using deionized (DI) water (18.2 MΩ-cm).
Two ion exchange resins, Amberlite IRA-900 and IRA-958 (both are in Cl- form)
(Rohm & Haas, Philadelphia, PA, USA) were purchased from Sigma-Aldrich. Both
resins are macroporous SBA exchange resins, possessing identical functional group and
ion exchange capacity, but different in the polymer matrix. Table 4-1 lists the salient
properties of the two resins. Before use, the resins were conditioned following procedure
of cyclic exhaustion with 1 N sodium hydroxide, 1 N hydrochloric acid, 1 N NaCl,
rinsing successively with DI water, and then air-dried (Xiong et al., 2007).

103
Table 4-1. Salient properties of ion exchange resins used in this study.
Sorbent IRA 900 IRA 958
Description SBA resin
SBA resin
Functional Group R
CH3 N CH3
CH3
R’
CH3 N CH3
CH3
Matrix -CH2-CH-CH2-
Polystyrene,
macroporous
-CH2-CH-CH2-
C=O
HN-CH2-CH2
Polyacrylic,
macroporous
Bead size (mm) 0.65-0.82 0.63-0.85
IE Capacity (meq/g) 3.1a 2.2 a
Water Content (%) 58-64 66-72
BET Surface Area (m2/g) 22b 2.03c
Average pore diameter (nm) 37.2d 6.46e
Operating temperature (°C) < 60 < 80
* All data obtained from Rohm and Haas Technical Bulletins unless specified otherwise;
a From this work, determined by ion-exchange of Cl- with SO42-. b From Delgado et al
(2007). cFrom Kolodynska (2010). d From Schouten et al. (2007). e From Greluk and
Hubicki (2010).
104
4.2.2 Catalyst preparation
The resin-supported Pd catalysts were prepared by a two-step process of ion-
exchange and subsequent reduction. In brief, an anionic form of Pd ([PdCl4]2-) was first
absorbed on the resins through ion-exchange process via batch tests. Typically, to prepare
2.0 wt.% Pd loading catalysts, a solution containing of 21.5 mg/L of Pd and 1 g/L NaCl
was mixed with the resins with a solution-to-resin ratio of 1 (L):1 (g) until reach ion-
exchange equilibrium (shaking mixture at 150 rpm for 72 h ). The addition of NaCl is to
maintain the Pd in the anionic form (form ligands with Cl-). Then the supernatant was
decanted and a 0.86 g/L of borohydride solution (3 times of stoichiometric amount of Pd)
was added in the Pd-adsorbed resins dropwise with a solution-to-resin ratio of 50 (mL):1
(g). After reaction (150 rpm shaking) for 20 min, the PdCl42- on the ion exchange resins
was reduced to Pd0 via reaction
PdCl42-+2BH4
-+6H2O Pd0+2B(OH)3+4Cl-+7H2 (g) (4-1)
The resin-supported Pd catalysts (i.e., Pd/IRA-900 and Pd/IRA-958) were
washed with 100 mL of DI water three times to remove residual borohydride and air
dried for 12 h before being used for TCS HDC. Pd loading on the resins was calculated
based on the Pd contents in aqueous solution before and after ion exchange, and Pd
concentration in solution was analyzed using an Inductive Coupled Plasma–Optical
Emission Spectrometer (Varian ICP 710-ES, Varian Inc., Walnut Creek, CA) with a
detection limit of ~0.03 mg/L.
4.2.3 Catalyst characterization
The topography of the resin-supported Pd catalysts was investigated by scanning
electron microscopy (SEM, JSM-7000F, JEOL, USA) coupled with an energy-dispersive

105
X-ray spectroscopy (EDXS, INCA x-sight, Oxford Instruments) for elemental
composition analysis. The supported Pd catalysts were first vacuum dried at room
temperature for 5 days, then coated with a thin layer of gold before SEM analysis. To
explore the Pd internal distribution in resins and the morphology of the internal resins,
the Pd loaded resins were bisected and analyzed in selected cases using SEM and EDXS.
The powder X-ray diffraction (XRD) patterns of catalysts were obtained with a Bruker
D2 PHASER powder diffractometer (Bruker AXS, Germany) using Cu Kα radiation (λ =
1.5418 Å) at a scan rate (2θ) of 4/min. The XRD analyses were performed on the resin
only (i.e., IRA-900 and IRA-958) and resin catalysts (i.e., Pd/IRA-900 and Pd/IRA-958)
before and after 8 reaction cycles of HDC.
4.2.4 Catalytic hydrodechlorination of TCS
Duplicate batch experiments were conducted to test the effectiveness of the
supported Pd catalysts for HDC of TCS in the aqueous phase. First, 0.1 g of resin-
supported Pd catalysts were mixed with 100 mL of DI water in a 127 mL amber serum
bottle. Then the mixtures were purged with hydrogen gas for 25 min to obtain a H2-
saturated solution (H2 solubility 1.6 mg/L at 20C) and H2-filled headspace of the
reactor (~27 mL). Upon saturation, the bottle was quickly capped with an open-top screw
cap equipped with PTFE-lined septa. The HDC of TCS was then initiated by injecting of
100 µL of TCS stock solution to yield an initial TCS concentration of 10 µM (2.9 mg/L).
The reactor was then flat mounted to a shaker and mixed at 150 rpm at room temperature
to achieve a homogeneous mixture. At selected times, 0.5 mL of the solution was
withdrawn into a 2 mL of HPLC amber vial using a syringe. The TCS concentration was
analyzed with an HP Agilent 1260 Infinity HPLC system equipped with a Poroshell 120
106
EC-C18 column (4.650mm, 2.7 µm) and a UV detector. The analysis of TCS was
followed Zhang and Huang’s method (Zhang and Huang, 2003) with a detection limit of
2.510-8 M. To avoid TCS adsorption on resins, duplicate control tests were conducted
without both Pd and resins and under the same hydrogen conditions.
Because of the hydrophobicity of the resins, TCS loss in aqueous phase may due
to degradation or adsorption. To quantify TCS adsorbed on resins, ~99 mL of aqueous
supernatant was withdrawn at predetermined times and replaced with 30 mL of methanol.
After release of hydrogen gas, the HDC process was terminated, and the TCS adsorbed
on resin-supported catalysts were extracted using methanol by shaking at 250 rpm for 24
h. After extraction, 0.5 mL of the extract was transferred into a HPLC vial containing 0.5
mL of DI water for HPLC analysis. The extraction efficiency using this method was
determined to be 963 %, and 972 % for IRA-900, and IRA-958, respectively.
4.2.5 Catalyst lifetime
The lifetime and reusability of the resin-supported catalysts were tested in the
batch experiments with the same catalysts were repeatedly used in 8 consecutive cycles
without any treatment. Each cycle of the batch test was carried out in the same manner as
mentioned above. After saturation with hydrogen gas, a new reaction cycle was initiated
by injection the same volume of TCS stock solution. In each cycle, a total volume of 2.5
mL of aqueous phase was withdrawn (each sample time 0.5 mL was withdrawn) to
monitor TCS degradation until TCS was undetectable (<2.510-8 M). After each cycle,
2.5 mL of DI water was added into the duplicate bottles to maintain a total volume of 100
mL. To analyze the Pd bleeding during HDC, aqueous samples were acidified and
analyzed for total Pd after the last reaction cycle.

107
4.2.6 Analysis of hydrodechlorination byproducts
To determine the HDC byproducts of TCS, sacrificed batch tests were conducted
under the identical experiment condition with HDC of TCS. At selected times, 100 mL of
the reaction suspensions containing the organic reactant and resin-supported Pd catalysts
were extracted by vigorous shaking with 20 mL of dichloromethane (MeCl2) for 10 min.
The extract was then dehydrated with anhydrous sodium sulfate and then filtered through
a 0.22 µM PTFE syringe filter. Controls with only TCS and Pd loaded resins but without
hydrogen gas purge were also extracted in the same way and only TCS was detected,
yielding an extraction efficiency > 90%. The HDC byproducts were analyzed by a Gas
Chromatography/Mass Spectrometry (GC/MS) HP7890A/HP5975C system (Agilent
Technologies Inc., Santa Clara, CA) with a HP-5MS column (30 m×0.25 mm×0.25 µm).
The GC/MS conditions were programmed as follows: splitless injection at 280C and
oven temperature raised from 70C to 280C at 6C/min following by a 10 min holding at
280C. Helium was used as the carrier gas at a flow rate of 1.2 mL/min. Electron
ionization (EI) with the mass scan range from 35 to 550 m/z and temperature of MS
source of 250C was conducted.
4.2.7 Analysis of Cl balance
To check the total chlorine balance in the system, chloride ion production in the
process of HDC was analyzed. Because the reaction pathway is the same for the two type
of resins, thus, this test was only conducted with the IRA-958 supported Pd catalysts. In
order to avoid Cl- adsorption on the anion exchange resins or release from the chloride
form resins, after loading with Pd (i.e., just before HDC test) the resins were pretreated to
replace Cl- with SO42- in a column run using 5 mM SO4
2- to exchange the Cl- (also use
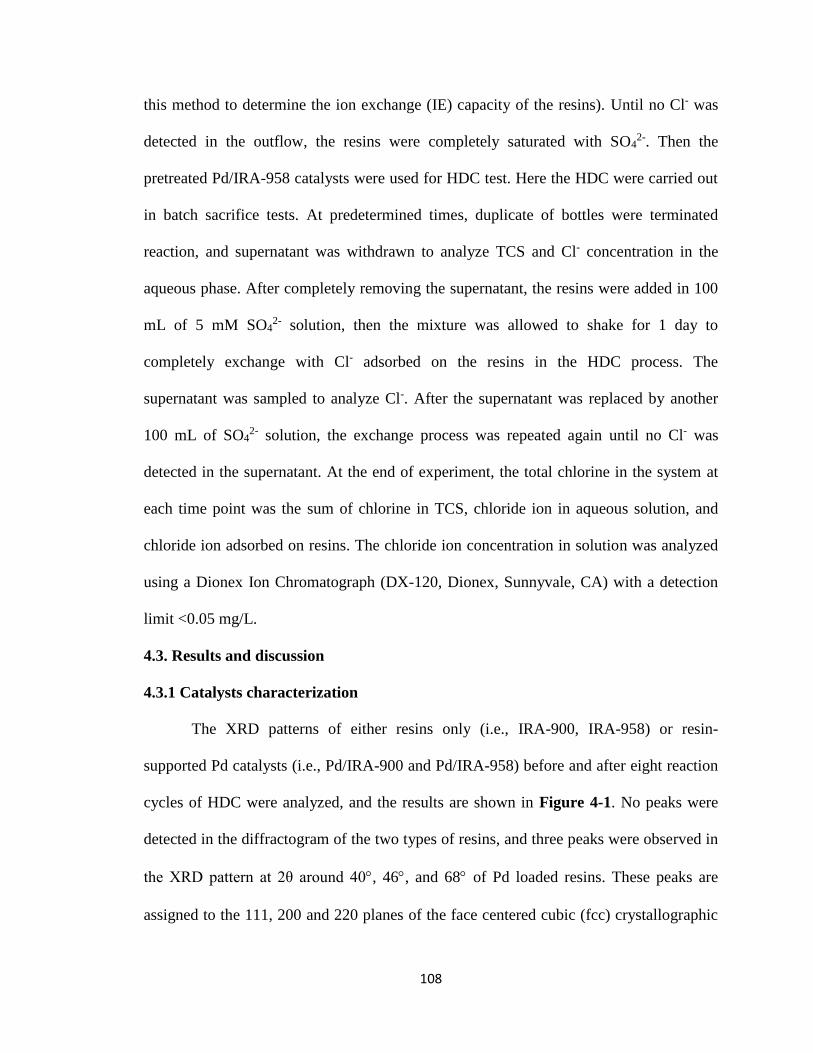
108
this method to determine the ion exchange (IE) capacity of the resins). Until no Cl- was
detected in the outflow, the resins were completely saturated with SO42-. Then the
pretreated Pd/IRA-958 catalysts were used for HDC test. Here the HDC were carried out
in batch sacrifice tests. At predetermined times, duplicate of bottles were terminated
reaction, and supernatant was withdrawn to analyze TCS and Cl- concentration in the
aqueous phase. After completely removing the supernatant, the resins were added in 100
mL of 5 mM SO42- solution, then the mixture was allowed to shake for 1 day to
completely exchange with Cl- adsorbed on the resins in the HDC process. The
supernatant was sampled to analyze Cl-. After the supernatant was replaced by another
100 mL of SO42- solution, the exchange process was repeated again until no Cl- was
detected in the supernatant. At the end of experiment, the total chlorine in the system at
each time point was the sum of chlorine in TCS, chloride ion in aqueous solution, and
chloride ion adsorbed on resins. The chloride ion concentration in solution was analyzed
using a Dionex Ion Chromatograph (DX-120, Dionex, Sunnyvale, CA) with a detection
limit <0.05 mg/L.
4.3. Results and discussion
4.3.1 Catalysts characterization
The XRD patterns of either resins only (i.e., IRA-900, IRA-958) or resin-
supported Pd catalysts (i.e., Pd/IRA-900 and Pd/IRA-958) before and after eight reaction
cycles of HDC were analyzed, and the results are shown in Figure 4-1. No peaks were
detected in the diffractogram of the two types of resins, and three peaks were observed in
the XRD pattern at 2θ around 40, 46, and 68 of Pd loaded resins. These peaks are
assigned to the 111, 200 and 220 planes of the face centered cubic (fcc) crystallographic

109
structure of Pd, respectively (JCPDS No. 05-0681). Comparing the freshly prepared Pd
catalysts with the catalysts after eight consecutive HDC cycles, there is no change or shift
of the Pd peaks of the XRD analysis, which indicate the catalysts composition and
crystallographic structure did not change in the reaction.
The dry state morphology of the cross-section of investigated resins is illustrated
in Figure 4-2 at low (Figure 4-2(a)-(b)) and high (Figure 4-2(c)-(d)) magnification. The
high magnification SEM images show a macroreticular internal structure of the resins,
and the macropores (pore diameter larger than 50 nm) result from “glueing” of a mass of
polymer nodules. It is noted that the porosity is higher for IRA-900 which contains much
more mesopores between the nodules while the nodules are more glued for IRA-958.
Consistent with the SEM images, the BET surface area of the IRA-900 (22 m2/g)
(Delgado et al., 2007) is much higher than IRA-958 (2.03 m2/g) (Kolodynska, 2010). The
dry state BET surface area of the resins is small compared to inorganic supports (e.g., 92
m2/g for Al2O3 and 1011 m2/g for AC) (Diaz et al., 2011; Zhang et al., 2013). However, it
was suggested that the BET surface area has little relevance to the actual performance of
the polymer-supported catalyst due to the swelling phenomenon of the resins under
aqueous phase conditions (Biffis et al., 2000; D'Archivio et al., 2000).
Radial distribution of Pd at the cross-section of the resins was analyzed by EDXS
via 11 point scan, where the 11 points were distributed along the radius in upper and right
direction (points position were shown in Figure 4-2(a)-(b)), and the EDXS results are
shown in Figure 4-3. The EDXS analysis gave the Pd atomic percentage relative to other
elements, and based on the hypothesis that the Cl- was evenly distributed in the whole
resins (the resins are in Cl- form and saturated with Cl-), Pd distribution was plotted as Pd

110
to Cl percentage. From the results we can see the Pd distribution was symmetric along the
distance from the center of the sphere, and the Pd was almost homogenously distributed
in the resins, with only a little higher at the surface (5% and 10% for IRA-900, and IRA-
958, respectively) than inner part of the resins. Similar observations were reported by
Zecca et al. (1998) and Biffis et al. (2000). The macroreticular structure of the resins and
the long time adsorption equilibrium (3 days) may contribute to the homogeneous
dispersion of Pd. The total concentration of Cl- in the resins (i.e., ion exchange capacity)
was determined to be 3.14 meq/g and 2.21 meq/g for IRA-900 and IRA-958, respectively,
through ion-exchange of Cl- with SO2-. Interior of the resin IRA-900 and IRA-958, the
average Pd to Cl atomic ratio is 7% and 9%, which is a 23 and 22 milligram Pd loading
per gram of resins, respectively. This result is reasonable compared with the 2.0 wt.% Pd
loading mass.

111
Figure 4-1. XRD patterns of bare resins, freshly prepared resin-supported Pd catalysts,
and used catalysts after 8 consecutive runs of HDC of TCS. Bragg angles (2θ) from 30
to 80 were scanned at a scan rate of 4/min. Pd loading is 2.0 wt.% of resins.
2 degree
30 40 50 60 70 80
Inte
ns
ity
0
5
10
15
20
25
30
Bare IRA-900
Fresh Pd/IRA-900
Used Pd/IRA-900
Pd(111)
Pd(200)
Pd(220)
2 , degree
30 40 50 60 70 80
Inte
ns
ity
0
10
20
30
Bare IRA-958
Fresh Pd/IRA-958
used Pd/IRA-958
Pd(111)
Pd(200)
Pd(220)

112
Figure 4-2. SEM images of resin-supported Pd catalysts: cross-section of (a) IRA-900
and (b) IRA-958 at low magnification, and internal of (c) IRA-900 and (d) IRA-958 at
high magnification. Pd loading is 2 wt.% of resins. The points in (a) and (b) are EDXS
scanning positions.
a)
a)
a)
b)
c) d)
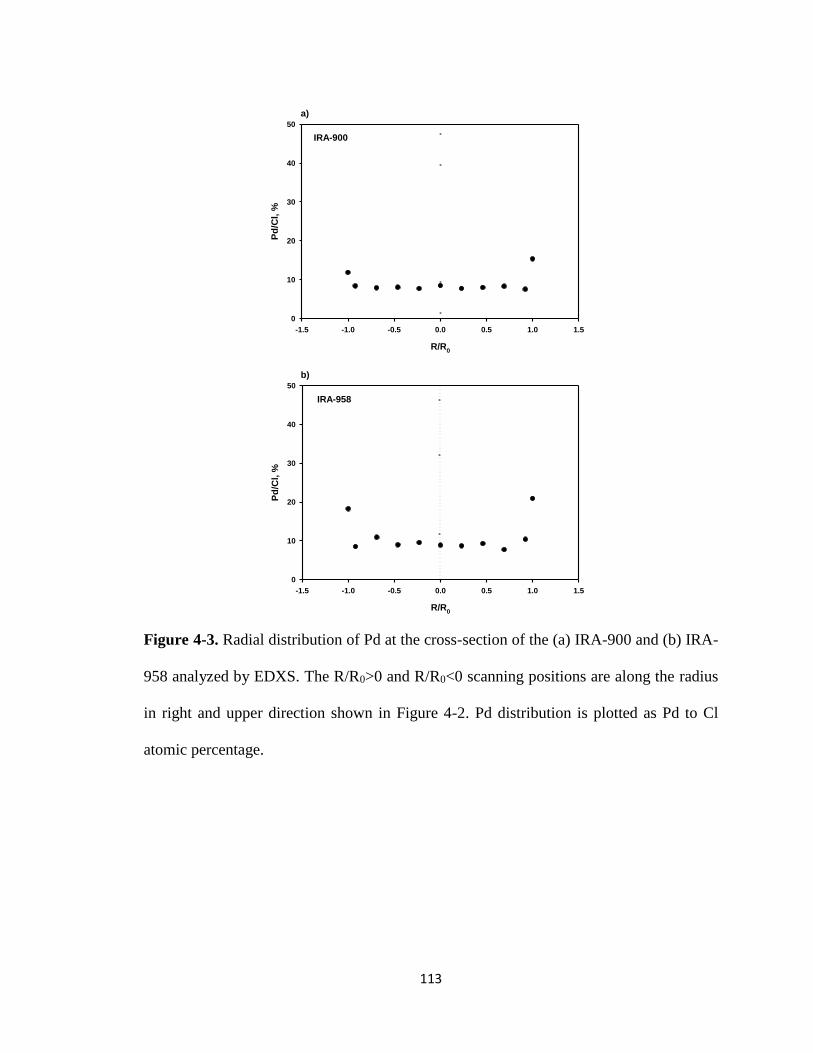
113
Figure 4-3. Radial distribution of Pd at the cross-section of the (a) IRA-900 and (b) IRA-
958 analyzed by EDXS. The R/R0>0 and R/R0<0 scanning positions are along the radius
in right and upper direction shown in Figure 4-2. Pd distribution is plotted as Pd to Cl
atomic percentage.
R/R0
-1.5 -1.0 -0.5 0.0 0.5 1.0 1.5
Pd
/Cl,
%
0
10
20
30
40
50
IRA-900
a)
R/R0
-1.5 -1.0 -0.5 0.0 0.5 1.0 1.5
Pd
/Cl,
%
0
10
20
30
40
50
IRA-958
b)
114
4.3.2 Effect of Pd loading on the rate of hydrodechlorination reaction
Batch kinetic tests of HDC of TCS were carried out under different Pd loadings.
Figure 4-4(a)-(b) compares the catalytic activity of the two resins with different Pd
loadings. In both cases, the total mass of resins was kept identical as 1 g/L. Control tests
were conducted without resin-supported Pd, and the result indicates without catalyst H2
gas can reduce 7% of TCS in 2 hours. Figure 4-4(c)-(d) plots the kinetic data according
to the linearized pseudo first-order rate equation as follows (Lowry and Reinhard, 1999):
−𝑑𝐶TCS
𝑑𝑡= 𝑘app𝐶TCS (4-2)
𝑘app𝐶TCS = 𝑘obs𝐶Pd𝐶TCS (4-3)
Where 𝐶TCS (mg/L) is the aqueous phase concentration of TCS, 𝑘app (min-1) is the
apparent rate constant. Eqn. 4-2 represents the pseudo first-order rate degradation of TCS.
𝑘obs (L/g/min) is the observed rate constant normalized to Pd catalyst concentration (𝐶Pd
(g/L)), so in Eqn. 4-3, the apparent rate constant is given as a product of observed rate
constant 𝑘obs times Pd concentration 𝐶Pd.
The pseudo first-order rate constants are provided in Table 4-2. For Pd/IRA-900,
when increasing the Pd loading from 0.2 wt.% to 17.6 wt.%, the apparent rate constant
was kept identical approximate to 0.0260.004 min-1. Based on the fact that without Pd
loading (0 wt.% Pd) the TCS concentration in aqueous phase was still reduced quickly
with the apparent constant rate of 0.0210.001 min-1, the TCS loss in aqueous phase
could be attributed to adsorption of TCS on the resins. Therefore, as long as TCS
adsorption rate was comparable to reaction rate, increasing of Pd loading would not
change the reduction rate of TCS in aqueous phase. In contrast, for IRA-958, when the Pd
loading increased from 0.2 wt.% to 11.2 wt.%, the apparent constant rate increased from
115
0.0240.003 min-1 to 0.0370.004 min-1. At 0 wt.% Pd loading, the aqueous phase TCS
was slightly decreased by 20%, indicating a weaker adsorption of TCS on IRA-958 than
IRA-900. This observation corroborates that the resin matrix, i.e., matrix hydrophobicity,
contributes to the adsorption of the organic compounds. Between polystyrene (IRA-900)
and polyacrylic (IRA-958) matrices, the latter one is less hydrophobic due to the open-
chain aliphatic structure containing carbonyl groups. Thus, the hydrophobic TCS (logKOC
is 3.8-4.0) (Lindstrom et al., 2002) is more easily adsorbed on IRA-900 through -
reaction. The observed rate constants 𝑘obs all decreased with an increase of Pd loading
for both type of resins, so use of low concentration of Pd has higher efficiency from both
cost and reaction rate aspects.
For Pd/IRA-958, the apparent first order rate constant (𝑘app) was estimated to be
0.0240.003 min-1, 0.0310.002 min-1, 0.0330.001 min-1, 0.0370.001 min-1, and
0.0370.004 min-1 containing 0.2 wt.%, 2.0 wt.%, 4.9 wt.%, 7.8 wt.%, and 11.2 wt.% Pd,
respectively. At a loading level below 7.8 wt.%, the catalytic activity on HDC of TCS
increased with the Pd loading, while a further increase in Pd loading could not enhance
the reaction rate any more. The observation suggests that the higher Pd loadings, the
greater of the catalysts activity, until a peak Pd loading is reached. Similar results were
observed by other researchers. Nutt et al. (2005) studied effect of Pd loading on TCE
degradation rate with a Pd-on-Au bimetallic catalyst, and found formation of multiple
layers of Pd particles at the support surface at elevated Pd loadings. The multiple surface
Pd layers may block the accessibility of the interior Pd sites of a porous support, which
resulted in a decrease in the specific surface area and the overall catalytic activity at
extremely high metal loadings. Zhou et al. (2013) determined that the optimal Pd loading

116
for HDC of chloroacetic acids over Pd/ZrO2 catalysts was 1.74 wt.%, and they attributed
the catalytic activity decrease to Pd particle size increase with elevation of Pd loadings.
They found Pd particle size was increased with Pd loading and suggested that the
increase of size resulted from aggregation of Pd particles on ZrO2 surface. As a result, the
catalyst surface area was not increased anymore with increasing of Pd loading.
Yuan and Keane (2004) reported an observed rate constant 𝑘obs of 6.78 L/min/g
and 7.20 L/min/g for HDC of 2,4 chlorophenol catalyzed by 1.0 wt.% Pd supported on
alumina and AC, respectively. In our case, at 0.2 wt.% and 2.0 wt.% Pd loading, the 𝑘obs
was determined to be 122 L/min/g and 1.60.1 L/min/g, respectively. With increasing
Cl substitution, the HDC rate was reported to decrease (Chaplin et al., 2012). As a result,
the resin-supported Pd catalysts have relative high catalytic activity toward HDC of TCS.

117
Table 4-2. Reaction rate constants for HDC of TCS catalyzed by resin-supported Pd
Support Pd content (wt.%) 𝑘app, min-1 𝑘obs, L/g/min R2
IRA-900 0 0.0210.001 0.995
0.2 0.0260.002 131 1.000
2.0 0.0250.001 1.250.06 0.999
4.9 0.0260.002 0.530.04 0.998
10.8 0.0280.002 0.260.02 0.999
17.6 0.0270.003 0.150.02 0.999
IRA-958 0 0.0020.000 0.702
0.2 0.0240.003 122 0.998
2.0 0.0310.002 1.60.1 1.000
4.9 0.0330.001 0.670.02 0.999
7.8 0.0370.001 0.460.01 1.000
11.2 0.0370.004 0.310.03 0.999

118
Figure 4-4. Kinetic profiles of catalytic HDC of TCS with different Pd loadings on resin (a) IRA-900 and (b) IRA-958, and linearized
pseudo first-order plot for (c) IRA-900 and (d) IRA-958. Initial [TCS] = 2.9 mg/L, resin = 1 g/L.
Time, min
0 20 40 60 80 100 120 140
C/C
0
0.0
0.2
0.4
0.6
0.8
1.0
1.2
0 % Pd
0.2 % Pd
2.0 % Pd
4.9 % Pd
10.8 % Pd
17.6 % Pd
Control
IRA-900
a)
Time, min
0 20 40 60 80 100 120 140
C/C
0
0.0
0.2
0.4
0.6
0.8
1.0
1.2
0 % Pd
0.2 % Pd
2.0 % Pd
4.9 % Pd
7.8 % Pd
11.2 % Pd
Control
IRA-958
b)
Time, min
0 20 40 60 80 100 120 140
ln (
C/C
0)
-5
-4
-3
-2
-1
0
1
0 % Pd
0.2 % Pd
2.0 % Pd
4.9 % Pd
10.8 % Pd
17.6 % Pd
c)
IRA-900
Time, min
0 20 40 60 80 100 120 140
ln (
C/C
0)
-5
-4
-3
-2
-1
0
1
0 % Pd
0.2 % Pd
2.0 % Pd
4.9 % Pd
7.8 % Pd
11.2 % Pd
d)
IRA-958

119
4.3.3 Effect of support on the rate of TCS adsorption and reaction
For a heterogeneous catalytic reaction, reactant adsorption to catalyst surface is a
prerequisite step, and the catalytic reaction rate is reported to relate to the adsorption rate
of the reactant (Andersin and Honkala, 2011; Zhou et al., 2013). To quantify the TCS
loss in aqueous phase due to adsorption instead of reaction, methanol was used to extract
TCS from resins in each reaction point, and TCS remaining in the aqueous phase and
resin phase was separately plotted in Figure 4-5.
Figure 4-5(a)-(b) shows TCS in aqueous phase, on resins, and total TCS
remaining (addition of TCS in aqueous phase and on resins) for Pd/IRA-900 and Pd/IRA-
958, respectively, when loading of 0.2 wt.% Pd. For IRA-958 there is no TCS remaining
on the resins, indicating of the reduction of TCS in aqueous phase was due to degradation.
For IRA-900, TCS was detected on the resins, so the TCS reduction in aqueous phase
was partially due to degradation and partially due to adsorption by resin support. From
Figure 4-5(a) (Pd/IRA-900), it is noted that the concentration of TCS on the resins was
increased in the first hour, and then decreased after that, with a peak amount of 20% of
initial TCS at 60 min As the adsorption rate was faster than HDC rate in the first hour,
TCS increased on the resin surface, however, with TCS accumulation, adsorption rate
decreased and HDC rate exceeded, which resulted in a decreasing amount of TCS on the
resins. When the Pd loading was increased to 2.0 wt.%, the HDC rate increased, and there
was no more TCS detected on the resins (Figure 4-5(c)), which indicates the adsorption
may become the rate-limiting step.
Considering the reactant adsorption affinity on the two resins is different, the
HDC rate of TCS over 0.2 wt.% supported Pd catalysts (i.e., the total TCS remaining in

120
the system) with different resins was compared in Figure 4-5(d). These results show the
TCS reduction rate due to HDC reaction was comparable for the two resins, which
indicate adsorption of TCS on the catalysts is not a key role in this reaction. The HDC
rate of the TCS was controlled by formation of highly reactive atomic hydrogen (H) or
C-Cl cleavage. This observation is different from Zhou et al. (2013). They studied
catalytic HDC of chloroacetic acids over supported Pd catalysts with different supports
including ZrO2, SiO2, and AC, and found a much higher reactivity of Pd supported by
ZrO2 than the other two supports. They attributed this high reactivity to the strong
electrostatic attraction between chloroacetic acids and ZrO2, which leads to an enhanced
adsorption and thus elevated HDC rate. However, in their study they only analyzed
chloroacetic acids concentration in aqueous phase and considered the “superficial”
decreasing rate as HDC rate, however, this may count the adsorption of chloroacetic
acids into the HDC removal.

121
Figure 4-5. TCS adsorbed and degraded in the process of catalytic HDC with (a) 0.2 wt.% Pd/IRA-900, (b) 0.2 wt.% Pd/IRA-958, (c)
2.0 wt.% Pd/IRA-900, and (d) comparison of the degradation rate of TCS over catalysts of 0.2 wt.% Pd loading on two resins. Initial
[TCS] = 2.9 mg/L, resin = 1 g/L.
Time, min
0 20 40 60 80 100 120 140
C/C
0
0.0
0.2
0.4
0.6
0.8
1.0
1.2
TCS in aqueous
TCS on resin
TCS total
IRA-900 0.2 %-Pd
a)
Time, min
0 20 40 60 80 100 120 140
C/C
0
0.0
0.2
0.4
0.6
0.8
1.0
1.2
TCS in aqueous
TCS on resin
TCS total
IRA-958 0.2 %-Pd
b)
Time, min
0 20 40 60 80 100 120 140
C/C
0
0.0
0.2
0.4
0.6
0.8
1.0
1.2
TCS in aqueous
TCS on resion
TCS total
IRA-900 2.0 %-Pd
c)
Time, min
0 20 40 60 80 100 120 140
C/C
00.0
0.2
0.4
0.6
0.8
1.0
1.2
IRA-900
IRA-958
0.2 %-Pd
d)

122
4.3.4 Lifetime of the catalyst
The lifetime and reusability of the resin-supported Pd catalysts were tested with a
2.0 wt.% Pd loading, through eight consecutive runs of HDC of TCS where the same
catalysts were repeatedly used without any treatment. The HDC kinetics of TCS in run 2,
4, 6, and 8 are shown in Figure 4-6(a)-(b), where data for run 1, 3, 5, and 7 are not
shown for brevity. The results show only 1.8 % and 0.4 % reactivity loss at the end of 2
hours after eight exhausting runs for IRA-900 and IRA-958, respectively. At the end of 8
consecutive runs, Pd bleeding in the aqueous phase was undetectable (i.e., < 0.03 mg/L or
<0.2 % of initial Pd). This result confirms that the synthesized catalyst could reduce Pd
leaching from the resin support because of the strong specific interaction between the
resins and Pd.
Figure 4-6(c)-(d) shows the linearized kinetic profile by fitting the pseudo-first-
order rate equation. The 𝑘obs values for runs 2, 4, 6, 8 were determined to be 1.260.01
L/g/min, 1.200.01 L/g/min, 1.160.01 L/g/min, 1.090.01 L/g/min for Pd/IRA-900, and
1.450.04 L/g/min, 1.550.06 L/g/min, 1.400.02 L/g/min, 1.400.02 L/g/min for
Pd/IRA-958, respectively. After 8 cycles of reuse, Pd/IRA-958 almost has no catalytic
activity loss. Compared to IRA-958, IRA-900 has a little higher catalytic activity
decrease after 8 exhausting runs, which may be due to organic products fouling
(Concibido et al., 2007; Yuan and Keane, 2003). Yuan and Keane (2003) used Pd/Al2O3
and Pd/AC as catalysts to HDC of dichlorophenol, and found a loss of 50% surface area
in used Pd/AC. Considering the AC is a good adsorbent for organic products, and after a
temperature programmed reduction (TPR) the surface area was almost recovered, they
suggested the organic reactant and products fouling on the AC supported catalysts is the

123
reason that cause deactivation of the catalysts. At similar situation, IRA-900 is easier to
adsorb reaction products because its high affinity to organic compounds, and thus, the
catalytic activity loss for Pd/IRA-900 may be due to products poisoning.
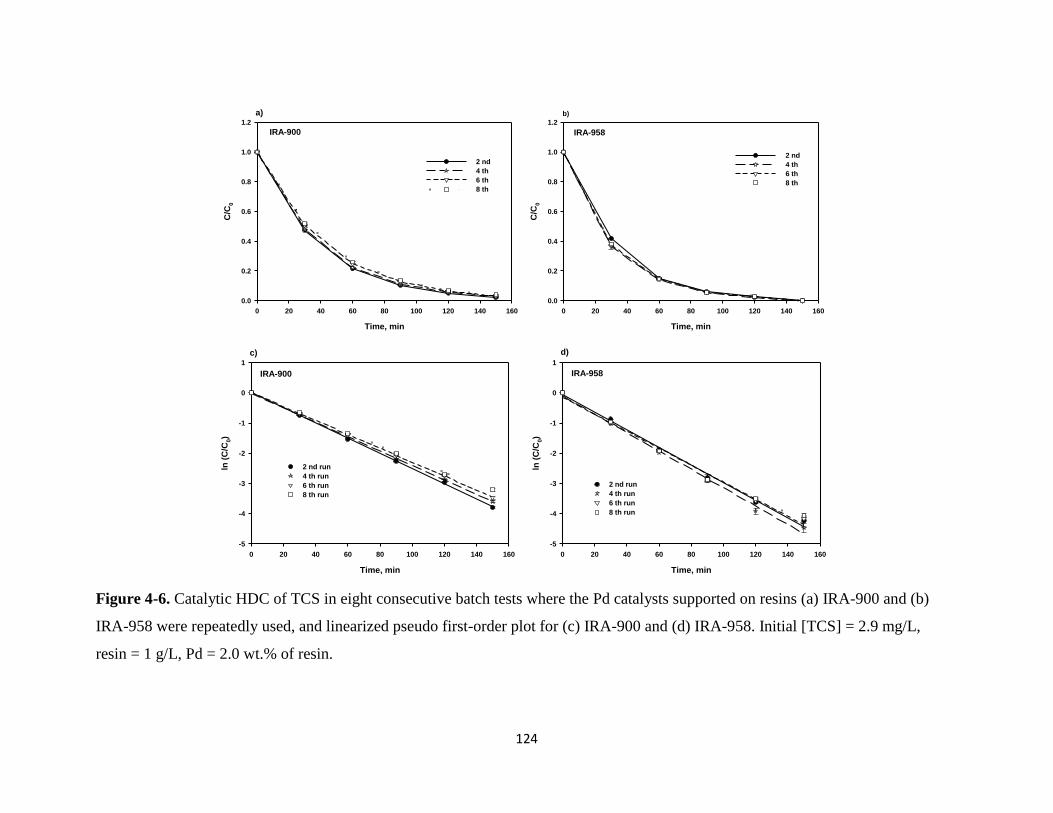
124
Figure 4-6. Catalytic HDC of TCS in eight consecutive batch tests where the Pd catalysts supported on resins (a) IRA-900 and (b)
IRA-958 were repeatedly used, and linearized pseudo first-order plot for (c) IRA-900 and (d) IRA-958. Initial [TCS] = 2.9 mg/L,
resin = 1 g/L, Pd = 2.0 wt.% of resin.
Time, min
0 20 40 60 80 100 120 140 160
C/C
0
0.0
0.2
0.4
0.6
0.8
1.0
1.2
2 nd
4 th
6 th
8 th
IRA-900
a)
Time, min
0 20 40 60 80 100 120 140 160
C/C
0
0.0
0.2
0.4
0.6
0.8
1.0
1.2
2 nd
4 th
6 th
8 th
IRA-958
b)
Time, min
0 20 40 60 80 100 120 140 160
ln (
C/C
0)
-5
-4
-3
-2
-1
0
1
2 nd run
4 th run
6 th run
8 th run
c)
IRA-900
Time, min
0 20 40 60 80 100 120 140 160
ln (
C/C
0)
-5
-4
-3
-2
-1
0
1
2 nd run
4 th run
6 th run
8 th run
d)
IRA-958
125
4.3.5 Effect of humic acid
Dissolved natural organic matter inhibition has been reported to be an issue for
Pd-based catalysts (Chaplin et al., 2006; Kopinke et al., 2010; Zhang et al. 2013). For the
amphiphilic resins, organic matter fouling of the catalysts is a concern. Humic acid (HA)
is the major natural organic matter existing in soil, surface water, and groundwater
(Stevenson, 1994). Figure 4-7(a)-(b) shows HDC kinetics of TCS with supported Pd (2.0
wt.%) catalysts at various concentrations of HA measured as TOC. At a TOC
concentration of 10 mg/L, there is no significant impact on the HDC rate of TCS. The
𝑘obs values were only reduced from 1.250.06 L/g/min to 1.180.04 L/g/min for
Pd/IAR-900, and 1.60.1 L/g/min to 1.50.2 L/g/min for IRA-958. When the TOC
concentration was increased to 20 mg/L, inhibition was exhibited, and 𝑘obs values
decreased to 0.950.04 L/g/min and 1.240.01 L/g/min for IRA-900 and IRA-958,
respectively. With the addition of 30 mg/L TOC, the 𝑘obs values further decreased to
0.90.2 L/g/min and 1.170.06 L/g/min for IRA-900 and IRA-958, respectively.
In the presence of HA, HA could compete with TCS to serve as an atomic
hydrogen (H) acceptor by carboxyl or ketone group, inhibiting the HDC rate of the
reactant (Zhu et al., 2008). In addition, HA can adsorb onto the catalyst surface sites
causing catalyst fouling (Chaplin et al., 2006). Zhang et al. (2013) investigated HDC of
trichloroethylene with alumina-supported Pd catalysts, and reported a ~88% reduction of
reaction rate constant with presence of 30 mg/L TOC. Chaplin et al. (2006), reported the
rate constants of NO3- reduction decreased 84% on addition of 3.3 mg/L TOC of HA with
the Pd-Cu/Al2O3 catalyst. However, in our case, the HDC rate constants was only
126
reduced 28 % and 25 % in the presence of 30 mg/L TOC as HA for IRA-900, and IRA-
958, respectively.
The probable reason of less inhibition by natural organic matter for resin-
supported catalysts is that HA is less adsorbed on resins compared to other supports.
Total organic carbon (TOC) analysis showed that 37% and 24% of HA was adsorbed on
the Pd/IRA-900 and Pd/IRA-958, respectively, after 2 h of reaction in the presence of 30
mg/L TOC. Zhang et al. (2013) reported the Pd/Al2O3 catalysts adsorbed 59% in 5 min
and 63% in 30 min of the 30 mg/L TOC. Our resin support adsorbed less HA than
alumina may because that the HA powder contains significant quantities of Ca (1.07
wt.%) and Fe (1.09 wt.%) (Chaplin et al., 2006), and these metal oxides are easily
adsorbed by inorganic supports such as alumina.
To further investigate the natural organic matter inhibition effect, consecutive
exhausting runs of catalytic HDC were conducted in presence of 30 mg/L TOC. Figure
4-7(c)-(d) shows kinetic profiles of HDC of TCS using Pd/IRA-900 and Pd/IRA-958
catalysts in presence of 30 mg/L TOC through six consecutive runs. The 𝑘obs values for
runs 2, 4, 6 were 0.70.2 L/g/min, 0.60.1 L/g/min, 0.570.07 L/g/min for Pd/IRA-900,
and 0.980.07 L/g/min, 0.930.01 L/g/min, 0.900.03 L/g/min for Pd/IRA-958,
respectively. After 6 exhausting runs, the observed rate constants decreased 39% and 27%
compared with the first run for Pd/IRA-900 and Pd/IRA-958, respectively. The TOC
analysis shows that after 10 h, 67% and 37% of HA (30 mg/L as TOC) was adsorbed by
Pd/IRA-900 and Pd/IRA-958 respectively. Resin IRA-900 has higher affinity to natural
organic matter, which leads to an easier organic fouling.
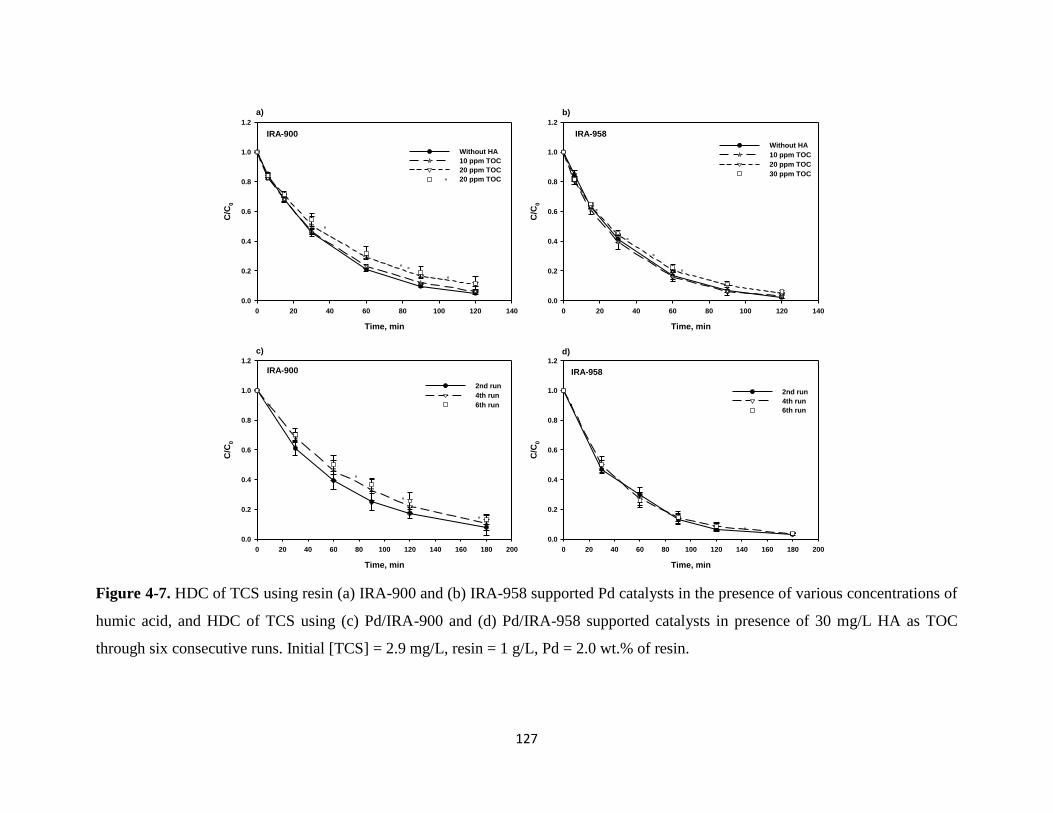
127
Figure 4-7. HDC of TCS using resin (a) IRA-900 and (b) IRA-958 supported Pd catalysts in the presence of various concentrations of
humic acid, and HDC of TCS using (c) Pd/IRA-900 and (d) Pd/IRA-958 supported catalysts in presence of 30 mg/L HA as TOC
through six consecutive runs. Initial [TCS] = 2.9 mg/L, resin = 1 g/L, Pd = 2.0 wt.% of resin.
Time, min
0 20 40 60 80 100 120 140
C/C
0
0.0
0.2
0.4
0.6
0.8
1.0
1.2
Without HA
10 ppm TOC
20 ppm TOC
20 ppm TOC
IRA-900
a)
Time, min
0 20 40 60 80 100 120 140
C/C
0
0.0
0.2
0.4
0.6
0.8
1.0
1.2
Without HA
10 ppm TOC
20 ppm TOC
30 ppm TOC
IRA-958
b)
Time, min
0 20 40 60 80 100 120 140 160 180 200
C/C
0
0.0
0.2
0.4
0.6
0.8
1.0
1.2
2nd run
4th run
6th run
IRA-900
c)
Time, min
0 20 40 60 80 100 120 140 160 180 200
C/C
00.0
0.2
0.4
0.6
0.8
1.0
1.2
2nd run
4th run
6th run
IRA-958
d)

128
4.3.6 Hydrodechlorination pathway of TCS in liquid phase
Oxidative degradation of TCS was reported to produce highly toxic byproducts,
such as chlorodioxins and chlorophenol (Kanetoshi et al. 1987; 1988). To characterize
catalytic HDC byproducts and pathway, the reaction system including liquid and solid
phases was extracted by dichloromethane in selected times and analyzed using GC/MS.
Figure 4-8 shows the GC chromatography obtained from the HDC of TCS with the resin-
supported Pd catalysts at 10 min, 30 min, 2 h, and 5h. As can be seen, TCS was rapidly
converted and lost chlorine under ambient operation conditions. Complete dechlorination
was achieved at 2 h, and after which no chlorinated organic compounds were detected by
GC/MS. In the reaction process, several chlorinated byproducts were detected as three of
the chlorines in the parent compound dechlorinated successively, and isomers of two
chlorinated byproducts were detected. The chlorinated byproducts were present at low
concentrations with the peak areas were all less than 1% of initial TCS area, which
indicated a high efficiency of the HDC process catalyzed by resin-supported Pd.
The two main byproducts obtained from this process were o-phenoxyphenol and
another byproduct. o-phenoxyphenol is also an antibiotic agent used as bacteriostats,
fungicides, and sanitizers. The other product could not be identified, but the mass spectra
shows the molecular weight of the product is 190 while the molecule contains a phenolic
group. This product is suggested to be 2-(cyclohex-1-enyloxy)phenol, a ring-opening
product of o-phenoxyphenol, but further investigation is needed to confirm this byproduct.
Sun et al. (2007) also found ring-opening products in HDC of o-chlorophenol. The HDC
pathway of TCS with resin-supported Pd as catalysts was schemed in Figure 4-9.
Based on the products analysis, the TCS HDC can be expressed as following Eqs:
129
C12H7Cl3O2+3H2 Pd→ C12H10O2+3Cl-+3H+ (4-4)
C12H7Cl3O2+5H2 Pd→ C12H14O2+3Cl-+3H+ (4-5)
Based on the two equations, hydrogen supply in the system (H2 solubility 1.6
mg/L at 20C) was more than 10 times the stoichiometric demand. The experiment
system assures abundant amount hydrogen supply for catalytic HDC, so the incompletely
cleaved benzene ring was not due to insufficient of hydrogen gas.
To further study dechlorination process, chlorine balance was investigated.
Figure 4-10 shows the rate of TCS degradation and chloride ion production with resin
IRA-958 supported Pd and in the presence of hydrogen. It was shown that dechlorination
of TCS is nearly stoichiometrically coupled with production of chloride (including in
aqueous phase and adsorbed by resins). From Figure 4-10, it is noted that a little loss of
chlorine mass occurred in the first hour of HDC, which confirms the very low
concentration of chlorinated intermediate byproducts were presence in the first hour of
HDC. This observation is consistent with GC/MS analysis. After about 1 h, no loss of
chlorine was shown, thus confirming that no other chlorinated species were present
beside TCS and chloride ions. This observation indicates that the supported Pd catalysts
were able to rapid and complete HDC of TCS.

130
Figure 4-8. GC/MS chromatogram of TCS HDC byproducts. Initial [TCS] = 2.9 mg/L, resin = 1 g/L, Pd = 2.0 wt.% of resin.
Retention Time, min
10 12 14 16 18 20 22 24 26 28 30
Inte
nsit
y
0
1e+6
2e+6
10 min
TCS
o-phenoxyphenol
open-ring pr
OOH
Cl
OOH
2Cl
Retention Time, min
10 12 14 16 18 20 22 24 26 28 30
Inte
nsi
ty
0
1e+6
2e+6
3e+6
30 min
Retention Time, min
10 12 14 16 18 20 22 24 26 28 30
Inte
nsi
ty
0
1e+6
2e+6
2 h
Retention Time, min
10 12 14 16 18 20 22 24 26 28 30
Inte
nsi
ty
0
1e+6
2e+6
3e+6
5 h

131
Figure 4-9. Schematic representation for catalytic HDC of TCS
O
Cl
Cl
OH
Cl
Pd/resin
H2
O
OH
Cl
O
OH
2Cl
O
OH Ring-opening product
O
OH
TCSo-phenoxyphenol
2-(cyclohex-1-enyloxy)phenol

132
Figure 4-10. Concentration histories of Cl- in aqueous phase, Cl- adsorbed on resins, and
TCS-Cl (i.e., TCS-bounded Cl) during HDC of TCS using IRA-958 supported Pd
catalysts. Initial TCS = 2.9 mg/L, resin = 1 g/L, Pd = 2.0 wt.% of resin.
Time, min
0 50 100 150 200 250 300
Ch
lori
de
or
TC
S-C
l, m
g
0.0
0.2
0.4
0.6
0.8
1.0
1.2
TCS-Cl
Cl in water
Cl adsorbed on resin
Total Cl

133
4.4. Conclusions
Two types of strong basic anion exchange resins supported Pd catalysts (Pd/IRA-
900 and Pd/IRA-958) were prepared by a two-step process of ion-exchange followed by a
reduction process. The ion-exchange process ensures a specific interaction between Pd
and resins. At a Pd loading of 0.2 wt.%, the resin-supported Pd catalysts were able to
effectively catalyze HDC of TCS with an observed pseudo-first-order reaction rate
constant 𝑘obs larger than 12 L/g/min. Due to different hydrophobicity of the two resins,
IRA-900 supported catalysts exhibit higher adsorption affinity to TCS, however, this
higher adsorption did not lead to a higher reaction rate. With an increase of Pd loading,
the apparent rate constant 𝑘app is increased for IRA-958 supported catalysts until an
optimal Pd loading is reached. Further increase of Pd loading will cause Pd aggregation
on the surface resulting in a blockage of the reactive sites of Pd particles. This resin-
supported Pd catalyst has a long lifetime with minimum Pd bleeding (undetectable after 8
run cycles). In addition, this resin-supported catalyst is highly resistant to organic fouling.
The observed rate constant 𝑘obs was only decreased by 28 % and 25 % in the presence of
30 mg/L TOC for Pd/IRA-900 and Pd/IRA-958, respectively. The resin prevented natural
organic matter (humic acid) fouling by being resistant to humic acid adsorption. GC/MS
analysis showed several chlorinated intermediates with very low concentration were
present in the early stage of HDC process, but complete dechlorination was achieved in
about 2 hours. A non-carcinogenic or -mutagenic antibiotic o-phenoxyphenol and its
ring-opened product were the main products of HDC of TCS. Catalytic HDC with resin-
supported Pd catalysts have proved to be a promising solution for complete

134
dechlorination of the chlorinated pollutants and diminish highly toxic byproducts
produced by other degradation methods.

135
CHAPTER 5. CONCLUSIONS AND SUGGESTIONS FOR FUTURE RESEARCH
5.1 Summary and conclusions
Application of various synthesized nanoparticles for environmental remediation
has attracted great interest in recent years. For the first time, this research demonstrates
synthesis of a new class of carboxymethyl cellulose (CMC) stabilized MnO2
nanoparticles for oxidative degradation of pollutants in groundwater. The feasibility of
using the nanoparticles for in-situ degradation of a model endocrine disrupting chemical
(EDC), 17-estradiol was investigated. This work was divided into two parts: First, we
synthesized the nanoparticles and investigated the factors that could influence the
nanoparticle reactivity. Second, we tested the nanoparticle deliverability in the
groundwater aquifer and using column tests to simulate the in-situ remediation, allowing
for investigation of operating parameters to improve degradation efficiency.
CMC was able to act as a low-cost and green stabilizer for synthesizing well-
stabilized birnessite (-MnO2) nanoparticles. A zeta potential of -342 mV for CMC-
MnO2 (MnO2 = 0.017 g/L, pH = 5.1, I 2.410-4 M) indicates good stabilization of the
nanoparticles due to electrostatic repulsion. While conventional non-stabilized MnO2
particles aggregate rapidly, CMC-stabilized nanoparticles remain well-dispersed in
aqueous suspension for one year. The most desired particles (small size and narrow size
distribution) were obtained at a CMC/MnO2 molar ratio of 1.3910-3, which yielded a
mean hydrodynamic size of 39.5 nm and a narrowest size distribution (SD=0.8 nm) with
about 90% of the particles falling between 20 and 50 nm. The TEM image confirms that

136
the CMC stabilization resulted in fully stabilized discrete nanoparticles with a mean size
of 37±10 nm.
At natural pH (6-7), CMC-stabilized MnO2 exhibited faster degradation kinetics
for oxidation of E2 than non-stabilized MnO2 in both aqueous phase and soil phase. The
high reactivity of CMC-MnO2, compared to non-stabilized MnO2 in degradation of water
soluble E2, was due to the large surface reactive sites of the nanoparticles. This reactivity
advantage becomes more evident when used for treating soil-sorbed E2 owing to the
ability of CMC to complex with metal ions and shield the reactive sites from binding
with soil metal ions that inhibit E2 oxidation. The more negative zeta potential of CMC-
stabilized MnO2 forecasts a less favorable sorption potential to the soil, i.e., less
reactivity loss. Overall, CMC-stabilized MnO2 displayed much greater resistance to soil
inhibitive effects such as soil-released metals and soil-MnO2 interactions than non-
stabilized MnO2.
The direct injection of nanoparticles into contaminated aquifers has been
suggested as a promising technology for in-situ remediation of contaminants. This work
has tested the deliverability of the nanoparticles in column transport tests using three
natural sandy loams (SL1, SL2, and SL3) as model soils. The nanoparticles can be well
delivered through the three soils of with a full breakthrough level C/C0 of 0.90, 0.93, and
0.66. The retention of the nanoparticles in the soils may influenced by several factors
concerning 1) nanoparticle surface chemistry, 2) soil surface chemistry and geochemical
heterogeneities, and 3) groundwater hydrology. MnO2 nanoparticle deposition is much
higher in soils that offer more favorable deposition sites than those are unfavorable for
deposition, which could be predicted based on the collector average surface potential.

137
Higher MnO2 nanoparticle deposition could occur in soils that offer high charge
heterogeneities which contain high clay fraction, and in low groundwater flow conditions.
This study used laboratory column degradation tests to simulate the in-situ
degradation conditions, and results showed that the degradation efficiency of the
nanoparticles may be influenced by several factors, such as soil properties, particle
injection velocity, and particle injection concentration. The combination of these factors
affects the nanoparticle degradation behavior in one key aspect, i.e., the contact time of
the nanoparticles with the contaminants. The nanoparticles are more effective for soils of
moderate or high organic contents that offer slow estradiol desorption rate and faster
MnO2 breakthrough, which allowed sufficient contact and reaction time to complete the
degradation. For the same soil, reducing injection velocity could increase particle and
contaminant contact time, but on the other hand, reducing velocity could also increase
nanoparticle retention by the soil. Therefore, choosing an optimal nanoparticle injection
velocity is important. Results obtained from this research show that it is very promising
to apply the CMC-stabilized MnO2 nanoparticles for the in-situ oxidative degradation of
estradiol in various contaminated soils.
Triclosan is a broad-spectrum antibacterial contained in personal care and
household products. For the first time, this research investigates the destruction of TCS
by dechlorination, using two types of strong basic anion exchange resin-supported Pd as
catalysts. The catalysts were prepared by a two-step process of ion-exchange and
subsequent reduction. The ionic binding between the Pd anion and resins ensures a
specific interaction between Pd and resins, thus suppressing the Pd bleeding from the
resin supports. These resin-supported Pd catalysts show a high catalytic activity. At a Pd
138
loading of 0.2 wt.%, the synthesized Pd catalysts were able to effectively catalyze HDC
of TCS with an observed pseudo-first-order reaction rate constant 𝑘obs larger than 12
L/g/min. With an increase of Pd loading, the apparent rate constant 𝑘app is increased until
an optimal Pd loading is reached. Further increase of Pd loading will cause Pd
aggregation on the surface resulting in a blockage of reactive sites of Pd particles. These
resin-supported catalysts are highly resistant to organic fouling. The observed rate
constant, 𝑘obs in presence of 30 mg/L TOC for Pd/IRA-900, and Pd/IRA-958, was only
decreased 28 % and 25 % respectively. Because of the minimum Pd bleeding and high
resistance to organic fouling, these synthesized catalysts have long lifetimes with only
1.8 % and 0.4 % reactivity loss after 8th exhausting runs for IRA-900 and IRA-958,
respectively. GC/MS analysis showed that several chlorinated intermediates with very
low concentrations were present in the early stage of HDC process, but complete
dechlorination was achieved in about 2 hours. A non-carcinogenic or -mutagenic
antibiotic o-phenoxyphenol and its ring-open product were the main products of HDC of
TCS. Catalytic HDC with resin-supported Pd catalysts has proved to be a promising
solution for complete dechlorination of the chlorinated pollutants and diminish highly
toxic byproducts produced by other degradation method.
5.2 Suggestions for future work
Injection of nanomaterial is suggested to offer a powerful strategy for remediation
of contaminants in groundwater that are not accessible by conventional technologies.
However, to the best of our knowledge, just a few pilot- or field scale studies have been
performed to investigate a full analysis of the effectiveness, practicability, capital and
operating costs of this nanomaterial remediation technology. More future field-scale
139
demonstrations need to be conducted to enable engineers to make more informed
decisions on this new technology choice and operation.
In addition to efficiency and cost consideration, it is also important that the
ultimate environmental sustainability of this technology is considered for site cleanup.
Taking long term environmental impact into consideration, two questions remain
unanswered: One being the long-term fate and transport of the nanoparticles in
environment, and the other being the environmental impacts of the applied nanoparticles.
Research on nanoparticle toxicology, and on their fate and transport have been
two common research priorities since the beginning of development of nanotechnology.
In a review discussing the toxicology of nanoparticles (Oberdorster et al., 2005), it was
demonstrated that various small nanoparticles increased toxicity due to an increase in
surface area. Stefanescu et al. (2009) examined the toxicity of Mn oxide nanomaterials in
a neuronal precursor cell model, and found that for the same material (Mn3O4
nanoparticles), the cytotoxicity was dependent on size, and larger specific surface area
nanoparticles were observed to have higher toxicity. But for different nanomaterials, the
toxicity was not proportional to particle size. Dunphy et al. (2006) also suggested particle
structure and composition may also play a role in toxicity other than particle size. When
exposed to Mn oxide nanomaterials, reactive oxygen species are generated, and cell death
occurred resulting from oxidative stress (Stefanescu et al., 2009).
The overall understanding of the environmental impact of nanoparticles is
dependent on the application of environmental conditions, such as, pressure, biochemical
reaction, solution chemistry, and aquifer properties. Also, more information is needed in
order to determine the unknown toxicity and environmental impact, which is necessary to
140
establish nanotechnology application regulations and gain the public acceptance for using
nanomaterial for in-situ remediation.
Future work on Pd-based catalytic HDC, complemented with advanced
characterization techniques and atomistic simulations is necessary in order to understand
the macroscopic reaction rate and reaction transformation from molecular-scale process.
Experimental work should also focus on the catalyst structure and its relation to the
observed catalytic activity. In addition, the relationships between contaminant structure
and reactivity of the catalytic HDC should be a primary focus in the future work. Further
efforts are needed to conduct pilot- and field scale of investigations, to identify the
catalytic HDC technology barriers and to develop the practical treatment strategies.
141
REFERENCES
Adamczyk, Z., Siwek, B., Zembala, M. and Belouschek, P., 1994. Kinetics of localized
adsorption of colloid particles. Adv. Colloid Interfac. 48, 151-280.
An, B., Liang, Q.Q. and Zhao, D.Y., 2011. Removal of arsenic(V) from spent ion
exchange brine using a new class of starch-bridged magnetite nanoparticles. Water
Res. 45(5), 1961-1972.
Andersin, J. and Honkala, K., 2011. First principles investigations of Pd-on-Au
nanostructures for trichloroethene catalytic removal from groundwater. Phys. Chem.
Chem. Phys. 13(4), 1386-1394.
Aranami, K. and Readman, J.W., 2007. Photolytic degradation of triclosan in freshwater
and seawater. Chemosphere 66(6), 1052-1056.
Arye, G., Dror, I. and Berkowitz, B., 2011. Fate and transport of carbamazepine in soil
aquifer treatment (SAT) infiltration basin soils. Chemosphere 82(2), 244-252.
Barnes, K.K., Kolpin, D.W., Furlong, E.T., Zaugg, S.D., Meyer, M.T. and Barber, L.B.,
2008. A national reconnaissance of pharmaceuticals and other organic wastewater
contaminants in the United States - I) Groundwater. Sci. Total Environ. 402(2-3),
192-200.
Basnet, M., Di Tommaso, C., Ghoshal, S. and Tufenkji, N., 2015. Reduced transport
potential of a palladium-doped zero valent iron nanoparticle in a water saturated
loamy sand. Water Res. 68, 354-363.

142
Bedoux, G., Roig, B., Thomas, O., Dupont, V. and Le Bot, B., 2012. Occurrence and
toxicity of antimicrobial triclosan and by-products in the envirnment. Environ. Sci.
Pollut. R. 19(4), 1044-1065.
Bester, K., 2003. Triclosan in a sewage treatment process - balances and monitoring data.
Water Res. 37(16), 3891-3896.
Bennett, P., He, F., Zhao, D.Y., Aiken, B. and Feldman, L, 2010. In situ testing of
metallic iron nanoparticle mobility and reactivity in a shallow granular aquifer. J.
Contam. Hydrol. 116(1-4), 35-46.
Bergendahl, J. and Grasso, D., 2000. Prediction of colloid detachment in a model porous
media: hydrodynamics. Chem. Eng. Sci. 55(9), 1523-1532.
Biffis, A., Landes, H., Jerabek, K. and Corain, B., 2000. Metal palladium dispersed inside
macroporous ion-exchange resins: the issue of the accessibility to gaseous reactants.
J. Mol. Catal. A-Chem. l 151(1-2), 283-288.
Bolster, C.H., A.L. Mills, G.M. Hornberger, and Herman, J.S., 1999. Spatial distribution
of bacteria experiments in intact cores. Water Resour. Res. 35,1797–1807.
Bouyoucos, G.J., 1962. Hydrometer method improved for making particle size analyses
of soils. Agron. J. 54, 464-465.
Chaplin, B.P., Reinhard, M., Schneider, W.F., Schueth, C., Shapley, J.R., Strathmann, T.J.
and Werth, C.J., 2012. Critical review of Pd-based catalytic treatment of priority
contaminants in water. Environ. Sci. Technol. 46(7), 3655-3670.
Chaplin, B.P., Roundy, E., Guy, K.A., Shapley, J.R. and Werth, C.J., 2006. Effects of
natural water ions and humic acid on catalytic nitrate reduction kinetics using an
alumina supported Pd-Cu catalyst. Environ. Sci. Technol. 40(9), 3075-3081.

143
Chen, N., Rioux, R.M. and Ribeiro, F.H., 2002. Investigation of reaction steps for the
hydrodechlorination of chlorine-containing organic compounds on Pd catalysts. J.
Catal. 211(1), 192-197.
Clarke, C.E. and Johnson, K.L., 2010. Oxidative breakdown of acid orange 7 by a
manganese oxide containing mine waste: Insight into sorption, kinetics and reaction
dynamics. Appl. Catal. B-Environ. 101(1-2), 13-20.
Colborn, T., Saal, F.S.V. and Soto, A.M., 1993. Developmental effects of endocrine-
disrupting chemicals in wildlife and humans. Environ. Health Persp. 101(5), 378-384.
Concibido, N.C., Okuda, T., Nishijima, W. and Okada, M., 2007. Deactivation and
reactivation of Pd/C catalyst used in repeated batch hydrodechlorination of PCE.
Appl. Catal. B-Environ. 71(1-2), 64-69.
D'Archivio, A.A., Galantini, L., Tettamanti, E., Panatta, A. and Corain, B., 2000. Metal
palladium dispersed inside macroporous ion-exchange resins: rotational and
translational mobility inside the polymer network. J. Mol. Catal. A-Chem. 157(1-2),
269-273.
Delgado, J.A., Uguina, M.A., Sotelo, J.L., Ruiz, B. and Rosario, M., 2007. Separation of
carbon dioxide/methane mixtures by adsorption on a basic resin. Adsorption 13(3-4),
373-383.
Desbrow, C., Routledge, E.J., Brighty, G.C., Sumpter, J.P. and Waldock, M., 1998.
Identification of estrogenic chemicals in STW effluent. 1. Chemical fractionation
and in vitro biological screening. Environ. Sci. Technol. 32(11), 1549-1558.
144
Diamanti-Kandarakis, E., Bourguignon, J.P., Giudice, L.C., Hauser, R., Prins, G.S., Soto,
A.M., Zoeller, R.T. and Gore, A.C., 2009. Endocrine-disrupting chemicals: An
endocrine society scientific statement. Endocr. Rev. 30(4), 293-342.
Diaz, E., Mohedano, A.F., Casas, J.A., Calvo, L., Gilarranz, M.A. and Rodriguez, J.J.,
2011. Comparison of activated carbon-supported Pd and Rh catalysts for aqueous-
phase hydrodechlorination. Appl. Catal. B-Environ. 106(3-4), 469-475.
Drewes, J.E., Heberer, T., Rauch, T. and Reddersen, K., 2003. Fate of pharmaceuticals
during ground water recharge. Ground Water Monit. Remediat. 23(3), 64-72.
Dunphy Guzman, K.A., Taylor, M.R., and Banfield, J.F., 2006. Environmental risks of
nanotechnology: national nanotechnology initiative funding, 2000-2004. Environ.
Sci. Technol., 40(5), 1401-1407.
Feng, Y., Wang, C., Liu, J., Zhang, Z., 2010. Electrochemical degradation of 17-alpha-
ethinylestradiol (EE2) and estrogenic activity changes. J. Environ. Monit. 12,404–
408.
Finlay-Moore, O., Hartel, P.G. and Cabrera, M.L., 2000. 17 beta-estradiol and
testosterone in soil and runoff from grasslands amended with broiler litter. J. Environ.
Qual. 29(5), 1604-1611.
Gasparovicova, D., Kralik, M., Hronec, M., Biffis, A., Zecca, M. and Corain, B., 2006.
Reduction of nitrates dissolved in water over palladium-copper catalysts supported
on a strong cationic resin. J. Mol. Catal. A-Chem. 244(1-2), 258-266.
Gong, Y.Y., Liu, Y.Y., Xiong, Z., Kaback, D. and Zhao, D.Y., 2012. Immobilization of
mercury in field soil and sediment using carboxymethyl cellulose stabilized iron
sulfide nanoparticles. Nanotechnology 23(29).

145
Greluk, M. and Hubicki, Z., 2010. Kinetics, isotherm and thermodynamic studies of
Reactive Black 5 removal by acid acrylic resins. Chem. Eng. J. 162(3), 919-926.
Halden, R.U., 2014. On the need and speed of regulating triclosan and triclocarban in the
United States. Environ. Sci. Technol. 48(7), 3603-3611.
Halden, R.U. and Paull, D.H., 2005. Co-occurrence of triclocarban and triclosan in US
water resources. Environ. Sci. Technol. 39(6), 1420-1426.
Han, B., Zhang, M., Zhao, D.Y. and Feng, Y.C., 2015. Degradation of aqueous and soil-
sorbed estradiol using a new class of stabilized manganese oxide nanoparticles.
Water Res. 70, 288-299.
Havlikova, L., Novakova, L., Matysova, L., Sicha, J. and Solich, P., 2006. Determination
of estradiol and its degradation products by liquid chromatography. J. Chromatogr. A
1119 (1-2), 216-223.
He, F., Zhang, M., Qian, T.W. and Zhao, D.Y., 2009. Transport of carboxymethyl
cellulose stabilized iron nanoparticles in porous media: Column experiments and
modeling. J. Colloid Interface Sci. 334(1), 96-102.
He, F. and Zhao, D.Y., 2007. Manipulating the size and dispersibility of zerovalent iron
nanoparticles by use of carboxymethyl cellulose stabilizers. Environ. Sci. Technol.
41(17), 6216-6221.
He, F., Zhao, D.Y., Liu, J.C. and Roberts, C.B., 2007. Stabilization of Fe-Pd
nanoparticles with sodium carboxymethyl cellulose for enhanced transport and
dechlorination of trichloroethylene in soil and groundwater. Ind. Eng. Chem. Res.
46(1), 29-34.

146
He, F., Zhao, D.Y. and Paul, C., 2010. Field assessment of carboxymethyl cellulose
stabilized iron nanoparticles for in situ destruction of chlorinated solvents in source
zones. Water Res. 44(7), 2360-2370.
Heidler, J. and Halden, R.U., 2007. Mass balance assessment of triclosan removal during
conventional sewage treatment. Chemosphere 66(2), 362-369.
Hildebrand, C., Londry, K.L. and Farenhorst, A., 2006. Sorption and desorption of three
endocrine disrupters in soils. Journal of Environmental Science and Health Part B-
Pesticides Food Contaminants and Agricultural Wastes 41(6), 907-921.
Hohenblum, P., Gans, O., Moche, W., Scharf, S. and Lorbeer, G., 2004. Monitoring of
selected estrogenic hormones and industrial chemicals in groundwaters and surface
waters in Austria. Sci. Total Environ. 333(1-3), 185-193.
Huber, M.M., Canonica, S., Park, G.Y. and Von Gunten, U., 2003. Oxidation of
pharmaceuticals during ozonation and advanced oxidation processes. Environ. Sci.
Technol. 37(5), 1016-1024.
Inaba, K., Doi, T., Isobe, N. and Yamamoto, T., 2006. Formation of bromo-substituted
triclosan during chlorination by chlorine in the presence of trace levels of bromide.
Water Res. 40(15), 2931-2937.
Ishibashi, H., Matsumura, N., Hirano, M., Matsuoka, M., Shiratsuchi, H., Ishibashi, Y.,
Takao, Y. and Arizono, K., 2004. Effects of triclosan on the early life stages and
reproduction of medaka Oryzias latipes and induction of hepatic vitellogenin.
Aquat.Toxicol. 67(2), 167-179.
147
Janiak, T. and Okal, J., 2009. Effectiveness and stability of commercial Pd/C catalysts in
the hydrodechlorination of meta-substituted chlorobenzenes. Appl. Catal. B-Environ.
92(3-4), 384-392.
Ji, L., Liu, F., Xu, Z., Zheng, S. and Zhu, D., 2010. Adsorption of pharmaceutical
antibiotics on template-synthesized ordered micro- and mesoporous carbons. Environ.
Sci. Technol. 44(8), 3116-3122.
Jiang, L.Y., Chen, J.M., Zhu, R.Y., Huang, C. and Ji, H., 2010. Degradation kinetics and
estrogenic activity of 17-estradiol removal by aqueous manganese dioxide. J.
Environ. Sci. Heal. A. 45(8), 938-945.
Jiang, L.Y., Huang, C., Chen, J.M. and Chen, X., 2009. Oxidative transformation of 17
beta-estradiol by MnO2 in aqueous solution. Arch. Environ. Contam. Toxicol. 57(2),
221-229.
Jiang, J.-Q., Zhou, Z. and Sharma, V.K., 2013. Occurrence, transportation, monitoring
and treatment of emerging micro-pollutants in waste water - a review from global
views. Microchem. J. 110, 292-300.
Johnson, P.R., Sun, N. and Elimelech, M., 1996. Colloid transport in geochemically
heterogeneous porous media: Modeling and measurements. Environ. Sci. Technol.
30(11), 3284-3293.
Jones, E.H. and Su, C., 2014. Transport and retention of zinc oxide nanoparticles in
porous media: Effects of natural organic matter versus natural organic ligands at
circumneutral pH. J. Hazard. Mater. 275, 79-88.
148
Joo, S.H. and Zhao, D. Y., 2008. Destruction of lindane and atrazine using stabilized iron
nanoparticles under aerobic and anaerobic conditions: Effects of catalyst and
stabilizer. Chemosphere 70(3), 418-425.
Kanetoshi, A., Ogawa, H., Katsura, E. and Kaneshima, H., 1987. Chlorination of irgasan
dp300 and formation of dioxins from its chlorinated derivatives. J. Chromatog.
389(1), 139-153.
Kanetoshi, A., Ogawa, H., Katsura, E., Kaneshima, H. and Miura, T., 1988. Formation of
polychlorinated dibenzo-para-dioxins upon combustion of commercial textile
products containing 2,4,4'-trichloro-2'-hydroxydiphenyl ether (irgasan dp300). J.
Chromatog. 442, 289-299.
Kasprzyk-Hordern, B., Dinsdale, R.M. and Guwy, A.J., 2009. Illicit drugs and
pharmaceuticals in the environment - forensic applications of environmental data.
Part 1: Estimation of the usage of drugs in local communities. Environ. Pollut.
157(6), 1773-1777.
Khanal, S.K., Xie, B., Thompson, M.L., Sung, S.W., Ong, S.K. and Van Leeuwen, J.,
2006. Fate, transport, and biodegradation of natural estrogens in the environment and
engineered systems. Environ. Sci. Technol. 40(21), 6537-6546.
Kirsten, W.J., 1979. Automated methods for the simultaneous determination of carbon,
hydrogen, nitrogen, and sulfur, and sufur alone in organic and inorganic materials.
Anal. Chem. 51, 1173-1179.
Klamerth, N., Malato, S., Maldonado, M.I., Aguera, A. and Fernandez-Alba, A.R., 2010.
Application of Photo-Fenton as a Tertiary Treatment of Emerging Contaminants in
Municipal Wastewater. Environ. Sci. Technol. 44(5), 1792-1798.

149
Ko, C.H. and Elimelech, M., 2000. The "shadow effect" in colloid transport and
deposition dynamics in granular porous media: Measurements and mechanisms.
Environ. Sci. Technol. 34(17), 3681-3689.
Kolodynska, D., 2010. Cu(II), Zn(II), Ni(II), and Cd(II) Complexes with Hedp removal
from industrial effluents on different ion exchangers. Ind. Eng.Chem. Res. 49(5),
2388-2400.
Kolodziej, E.P., Harter, T. and Sedlak, D.L., 2004. Dairy wastewater, aquaculture, and
spawning fish as sources of steroid hormones in the aquatic environment. Environ.
Sci. Technol. 38(23), 6377-6384.
Kolpin, D.W., Furlong, E.T., Meyer, M.T., Thurman, E.M., Zaugg, S.D., Barber, L.B.
and Buxton, H.T., 2002. Pharmaceuticals, hormones, and other organic wastewater
contaminants in us streams, 1999-2000: A national reconnaissance. Environ. Sci.
Technol. 36(6), 1202-1211.
Kopinke, F.-D., Angeles-Wedler, D., Fritsch, D. and Mackenzie, K., 2010. Pd-catalyzed
hydrodechlorination of chlorinated aromatics in contaminated waters-Effects of
surfactants, organic matter and catalyst protection by silicone coating. Appl. Catal.
B-Environ. 96(3-4), 323-328.
Kummerer K, Al-Ahmad A., 1997. Biodegradability of the anti-tumour agents 5-
fluorouracil, cytarabine, and gemcitabine: impact of the chemical structure and
synergistic toxicity with hospital effluent. Acta Hydrochim. Hydrobiol. 25,166–172.
Latch, D.E., Packer, J.L., Stender, B.L., VanOverbeke, J., Arnold, W.A. and McNeill, K.,
2005. Aqueous photochemistry of triclosan: Formation of 2,4-dichlorophenol, 2,8-
150
dichlorodibenzo-p-dioxin, and oligomerization products. Environ. Toxicol. Chem.
24(3), 517-525.
Laws, B.V., Dickenson, E.R.V., Johnson, T.A., Snyder, S.A. and Drewes, J.E., 2011.
Attenuation of contaminants of emerging concern during surface-spreading aquifer
recharge. Sci. Total Environ. 409(6), 1087-1094.
Lee, L.S., Strock, T.J., Sarmah, A.K. and Rao, P.S.C., 2003. Sorption and dissipation of
testosterone, estrogens, and their primary transformation products in soils and
sediment. Environ. Sci. Technol. 37(18), 4098-4105.
Li, W.C., 2014. Occurrence, sources, and fate of pharmaceuticals in aquatic environment
and soil. Environ. Pollut. 187, 193-201.
Li, Y., Wang, Y., Pennell, K.D. and Abriola, L.M., 2008. Investigation of the transport
and deposition of fullerene (C60) nanoparticles in quartz sands under varying flow
conditions. Environ. Sci. Technol. 42(19), 7174-7180.
Lin, K.D., Liu, W.P. and Gan, J., 2009a. Reaction of tetrabromobisphenol a (TBBPA)
with manganese dioxide: Kinetics, products, and pathways. Environ. Sci. Technol.
43(12), 4480-4486.
Lin, K.D., Liu, W.P. and Gan, J., 2009b. Oxidative removal of bisphenol A by
manganese dioxide: efficacy, products, and pathways. Environ. Sci. Technol. 43(10),
3860-3864.
Lin, A.Y.C. and Reinhard, M., 2005. Photodegradation of common environmental
pharmaceuticals and estrogens in river water. Environ. Toxicol. Chem. 24(6), 1303-
1309.
151
Lindstrom, A., Buerge, I.J., Poiger, T., Bergqvist, P.A., Muller, M.D. and Buser, H.R.,
2002. Occurrence and environmental behavior of the bactericide triclosan and its
methyl derivative in surface waters and in wastewater. Environ. Sci. Technol.
36(11), 2322-2329.
Lowry, G.V. and Reinhard, M., 1999. Hydrodehalogenation of 1-to 3-carbon halogenated
organic compounds in water using a palladium catalyst and hydrogen gas. Environ.
Sci. Technol. 33(11), 1905-1910.
Lowry, G.V. and Reinhard, M., 2001. Pd-catalyzed TCE dechlorination in water: Effect
of H-2 (aq) and H-2-utilizing competitive solutes on the TCE dechlorination rate and
product distribution. Environ. Sci. Technol. 35(4), 696-702.
Lozano, N., Rice, C.P., Ramirez, M. and Torrents, A., 2010. Fate of triclosan in
agricultural soils after biosolid applications. Chemosphere 78(6), 760-766.
Mansell, B.L. and Drewes, J.E., 2004. Fate of steroidal hormones during soil-aquifer
treatment. Ground Water Monit. Remediat. 24(2), 94-101.
Marcano-Martinez, E. and McBride, M.B., 1989. Comparison of the titration and ion
adsorption methods for surface charge measurement in oxisols. Soil Sci. Am. J. 1989,
53, 1040-1045.
Mashtare, M.L., Khan, B. and Lee, L.S., 2011. Evaluating stereoselective sorption by
soils of 17 alpha-estradiol and 17 beta-estradiol. Chemosphere 82(6), 847-852.
McClellan, K. and Halden, R.U., 2010. Pharmaceuticals and personal care products in
archived us biosolids from the 2001 EPA national sewage sludge survey. Water Res.
44(2), 658-668.
152
McMurry, L.M., Oethinger, M. and Levy, S.B., 1998. Triclosan targets lipid synthesis.
Nature 394(6693), 531-532.
Mendez-Diaz, J.D., Prados-Joya, G., Rivera-Utrilla, J., Leyva-Ramos, R., Sanchez-Polo,
M., Ferro-Garcia, M.A. and Medellin-Castillo, N.A., 2010. Kinetic study of the
adsorption of nitroimidazole antibiotics on activated carbons in aqueous phase. J.
Colloid Interface Sci. 345(2), 481-490.
Mestre, A.S., Pires, R.A., Aroso, I., Fernandes, E.M., Pinto, M.L., Reis, R.L., Andrade,
M.A., Pires, J., Silva, S.P. and Carvalho, A.P., 2014. Activated carbons prepared
from industrial pre-treated cork: Sustainable adsorbents for pharmaceutical
compounds removal. Chem. Eng. J. 253, 408-417.
Murray, J.W., 1974. Surface chemistry of hydrous manganese-dioxide. J. Colloid
Interface Sci. 46(3), 357-371.
Nichols, D.J., Daniel, T.C., Edwards, D.R., Mooe, P.A. and Pote, D.H., 1998. Use of
grass filter strips to reduce 17 beta-estradiol in runoff from fescue-applied poultry
litter. J. Soil Water Conserv. 53(1), 74-77.
Nutt, M.O., Hughes, J.B. and Wong, M.S., 2005. Designing Pd-on-Au bimetallic
nanoparticle catalysts for trichloroethene hydrodechlorination. Environ. Sci. Technol.
39(5), 1346-1353.
Oberdorster, G., Oberdorster, E., and Oberdorster, J., 2005. Nanotoxicology: an emerging
discipline evolving from studies of ultrafine particles, Environ. Health Persp. 113(7),
823-839.

153
Onesios, K.M., Yu, J.T. and Bouwer, E.J., 2009. Biodegradation and removal of
pharmaceuticals and personal care products in treatment systems: a review.
Biodegradation 20, 441-466.
Orvos, D.R., Versteeg, D.J., Inauen, J., Capdevielle, M., Rothenstein, A. and
Cunningham, V., 2002. Aquatic toxicity of triclosan. Environmen. Toxicol. Chem.
21(7), 1338-1349.
Pal, A., Gin, K.Y.-H., Lin, A.Y.-C. and Reinhard, M., 2010. Impacts of emerging organic
contaminants on freshwater resources: Review of recent occurrences, sources, fate
and effects. Sci. Total Environ. 408(24), 6062-6069.
Puma, G.L., Puddu, V., Tsang, H.K., Gora, A. and Toepfer, B., 2010. Photocatalytic
oxidation of multicomponent mixtures of estrogens (estrone (El), 17 beta-estradiol
(E2), 17 alpha-ethynylestradiol (EE2) and estriol (E3)) under UVA and UVC
radiation: Photon absorption, quantum yields and rate constants independent of
photon absorption. Appl. Catal. B-Environ. 99(3-4), 388-397.
Quevedo, I.R. and Tufenkji, N., 2012. Mobility of functionalized quantum dots and a
model polystyrene nanoparticle in saturated quartz sand and loamy sand. Environ.
Sci. Technol. 46(8), 4449-4457.
Rao, P.S.C., Lee, L.S. and Pinal, R., 1990. Cosolvency and sorption of hydrophobic
organic-chemicals. Environ. Sci. Technol. 24(5), 647-654.
Rivera-Utrilla, J., Sanchez-Polo, M., Angeles Ferro-Garcia, M., Prados-Joya, G. and
Ocampo-Perez, R., 2013. Pharmaceuticals as emerging contaminants and their
removal from water. A review. Chemosphere 93(7), 1268-1287.
154
Pizarro, A.H., Molina, C.B., Casas, J.A. and Rodriguez, J.J., 2014. Catalytic HDC/HDN
of 4-chloronitrobenzene in water under ambient-like conditions with Pd supported on
pillared clay. Appl. Catal. B-Environ. 158, 175-181.
Rizwan, T. and Bhattacharjee, S., 2009. Particle deposition onto charge-heterogeneous
substrates. Langmuir 25(9), 4907-4918.
Rosal, R., Rodriguez, A., Perdigon-Melon, J.A., Mezcua, M., Hernando, M.D., Leton, P.,
Garcia-Calvo, E., Aguera, A. and Fernandez-Alba, A.R., 2008. Removal of
pharmaceuticals and kinetics of mineralization by O(3)/H(2)O(2) in a biotreated
municipal wastewater. Water Res. 42(14), 3719-3728.
Rosenfeldt, E.J. and Linden, K.G., 2004. Degradation of endocrine disrupting chemicals
bisphenol a, ethinyl estradiol, and estradiol during UV photolysis and advanced
oxidation processes. Environ. Sci. Technol. 38(20), 5476-5483.
Rubert, K.F. and Pedersen, J.A., 2006. Kinetics of oxytetracycline reaction with a
hydrous manganese oxide. Environ. Sci. Technol. 40(23), 7216-7221.
Rule, K.L., Ebbett, V.R. and Vikesland, P.J., 2005. Formation of chloroform and
chlorinated organics by free-chlorine-mediated oxidation of triclosan. Environ. Sci.
Technol. 39(9), 3176-3185.
Ryan, C.C., Tan, D.T. and Arnold, W.A., 2011. Direct and indirect photolysis of
sulfamethoxazole and trimethoprim in wastewater treatment plant effluent. Water
Res. 45(3), 1280-1286.
Sakulchaicharoen, N., O'Carroll, D.M. and Herrera, J.E., 2010. Enhanced stability and
dechlorination activity of pre-synthesis stabilized nanoscale fepd particles. J. Contam.
Hydrol. 118(3-4), 117-127.

155
Sasidharan, S., Torkzaban, S., Bradford, S.A., Dillon, P.J. and Cook, P.G., 2014. Coupled
effects of hydrodynamic and solution chemistry on long-term nanoparticle transport
and deposition in saturated porous media. Colloid. Surface. A 457, 169-179.
SCCS Scientific Committee on Consumer Safety, 2010. Opinion on: Triclosan
antimicrobial, resistance (SCCP/1251/09). Adopted by the SCCP during the 7th
plenary on 22 June 2010.
Schouten, N., van der Ham, L.G.J., Euverink, G.-J.W. and de Haan, A.B., 2007. Selection
and evaluation of adsorbents for the removal of anionic surfactants from laundry
rinsing water. Water Res. 41(18), 4233-4241.
Schuth, C. and Reinhard, M., 1998. Hydrodechlorination and hydrogenation of aromatic
compounds over palladium on alumina in hydrogen-saturated water. Appl. Catal. B-
Environ. 18(3-4), 215-221.
Sheng, G.D., Xu, C., Xu, L., Qiu, Y.P. and Zhou, H.Y., 2009. Abiotic oxidation of 17
beta-estradiol by soil manganese oxides. Environ. Pollut. 157(10), 2710-2715.
Shore, L.S. and Shemesh, M., 2003. Naturally produced steroid hormones and their
release into the environment. Pure Appl. Chem. 75(11-12), 1859-1871.
Simunek, J., and van Genuchten, M. Th., 1995. Numerical model for simulating multiple
solute transport in variably-saturated soils, Proc. Water Pollution III: Modelling,
Measurement, and Prediction, Ed. L. C. Wrobel and P. Latinopoulos, Computation
Mechanics Publication, Ashurst Lodge, Ashurst, Southampton, UK, 21-30.
Simunek, J., van Genuchten, M.Th. and Sejna, M., 2005. The HYDRUS-1D software
package for simulating the one-dimensional movement of water, heat, and multiple
solutes in variably-saturated media-version 3.0, HYDRUS software series,

156
Department of Environmental Sciences, University of California Riverside,
Riverside, CA. 240 pp.
Srebowata, A., Baran, R., Casale, S., Kaminska, I.I., Lomot, D., Lisovytskiy, D. and
Dzwigaj, S., 2014. Catalytic conversion of 1,2-dichloroethane over bimetallic Cu-Ni
loaded BEA zeolites. Appl. Catal. B-Environ. 152, 317-327.
Stefanescu, D.M., Khoshnan, A., Patterson, P.H. and Hering, J.G., 2009. Manganese
Oxide nanoparticles are toxic to neuronal precursor cells. J. Nanopart. Res. 11,1957-
1969.
Stevenson, F.J., 1994. Humus chemistry: Genesis, composition, reactions. Wiley: New
York, New York.
Stuart, M., Lapworth, D., Crane, E. and Hart, A., 2012. Review of risk from potential
emerging contaminants in UK groundwater. Sci. Total Environ. 416, 1-21.
Stumn, W. and Morgan, J.J., 1996. Aquatic chemistry, 3rd ed., Wiley: New York, New
York.
Su, C., Puls, R.W., Krug, T.A., Watling, M.T., O'Hara, S.K., Quinn, J.W. and Ruiz, N.E.,
2012. A two and half-year-performance evaluation of a field test on treatment of
source zone tetrachloroethene and its chlorinated daughter products using emulsified
zero valent iron nanoparticles. Water Res. 46(16), 5071-5084.
Sun, Z., Takahashi, F., Odaka, Y., Fukushi, K., Oshima, Y. and Yamamoto, K., 2007.
Effects of potassium alkalis and sodium alkalis on the dechlorination of o-
chlorophenol in supercritical water. Chemosphere 66(1), 151-157.
Tabata, A., Kashiwada, S., Ohnishi, Y., Ishikawa, H., Miyamoto, N., Itoh, M. and
Magara, Y., 2001. Estrogenic influences of estradiol-17 beta, p-nonylphenol and bis-

157
phenol-A on japanese medaka (oryzias latipes) at detected environmental
concentrations. Water Sci. Technol. 43(2), 109-116.
Ternes, T.A., Stumpf, M., Mueller, J., Haberer, K., Wilken, R.D. and Servos, M., 1999.
Behavior and occurrence of estrogens in municipal sewage treatment plants - i.
Investigations in germany, canada and brazil. Sci. Total Environ. 225(1-2), 81-90.
Torkzaban, S., Kim, Y., Mulvihill, M., Wan, J. and Tokunaga, T.K., 2010. Transport and
deposition of functionalized CdTe nanoparticles in saturated porous media. J.
Contam. Hydrol. 118(3-4), 208-217.
Veldhoen, N., Skirrow, R.C., Osachoff, H., Wigmore, H., Clapson, D.J., Gunderson,
M.P., Van Aggelen, G. and Helbing, C.C., 2006. The bactericidal agent triclosan
modulates thyroid hormone-associated gene expression and disrupts postembryonic
anuran development. Aquat. Toxicol. 80(3), 217-227.
Wang, Y.G., Li, Y.S., Costanza, J., Abriola, L.M. and Pennell, K.D, 2012. Enhanced
mobility of fullerene (C-60) nanoparticles in the presence of stabilizing agents.
Environ. Sci. Technol. 46(21), 11761-11769.
Wang, Y.G., Li, Y.S., Fortner, J.D., Hughes, J.B., Abriola, L.M. and Pennell, K.D., 2008.
Transport and retention of nanoscale C60 aggregates in water-saturated porous
media. Environ. Sci. Technol. 42(10), 3588-3594.
Weber, W.J., Jr.2001. Environmental systems and processes: Principles, modeling, and
design, Wiley-Interscience, New York.
Wei, Y.T., Wu, S.C., Chou, C.M., Che, C.H., Tsai, S.M. and Lien, H.L., 2010. Influence
of nanoscale zero-valent iron on geochemical properties of groundwater and vinyl
chloride degradation: A field case study. Water Res. 44(1), 131-140.
158
Winkler, G., Fischer, R., Krebs, P., Thompson, A. and Cartmell, E., 2007. Mass flow
balances of triclosan in rural wastewater treatment plants and the impact of biomass
parameters on the removal. Eng. Life Sci. 7(1), 42-51.
Xiong, Z., He, F., Zhao, D.Y. and Barnett, M.O., 2009. Immobilization of mercury in
sediment using stabilized iron sulfide nanoparticles. Water Res. 43(20), 5171-5179.
Xiong, Z., Zhao, D. and Harper, W.F., Jr., 2007. Sorption and desorption of perchlorate
with various classes of ion exchangers: A comparative study. Ind. Eng. Chem. Res.
46(26), 9213-9222.
Xu, L., Xu, C., Zhao, M.R., Qiu, Y.P. and Sheng, G.D., 2008. Oxidative removal of
aqueous steroid estrogens by manganese oxides. Water Res. 42(20), 5038-5044.
Yoshihara, S., Murugananthan, M., 2009. Decomposition of various endocrine disrupting
chemicals at boron-doped diamond electrode. Electrochim. Acta 54, 2031–2038.
Yu ,J.T., Bouwer, E.J. and Coelhan, M., 2006. Occurrence and biodegradability studies
of selected pharmaceuticals and personal care products in sewage effluent. Agric.
Water Manag. 86,72–80.
Yuan, G. and Keane, M.A., 2003. Catalyst deactivation during the liquid phase
hydrodechlorination of 2,4-dichlorophenol over supported Pd: influence of the
support. Catal. Today 88(1-2), 27-36.
Yuan, G. and Keane, M.A., 2004. Liquid phase hydrodechlorination of chlorophenols
over Pd/C and Pd/Al2O3: a consideration of HC1/catalyst interactions and solution
pH effects. Appl. Catal. B-Environ. 52(4), 301-314.
Zecca, M., Kralik, M., Boaro, M., Palma, G., Lora, S., Zancato, M. and Corain, B., 1998.
Metal palladium supported on amphiphilic microporous synthetic organic supports.
159
Part I. Material preparation and textural characterization. J. Mol. Catal. A-Chem.
129(1), 27-34.
Zhang, M., Bacik, D.B., Roberts, C.B. and Zhao, D.Y., 2013. Catalytic
hydrodechlorination of trichloroethylene in water with supported CMC-stabilized
palladium nanoparticles. Water Res. 47(11), 3706-3715.
Zhang, H.C. and Huang, C.H., 2003. Oxidative transformation of triclosan and
chlorophene by manganese oxides. Environ. Sci. Technol. 37(11), 2421-2430.
Zhang, M., He, F., Zhao, D.Y. and Hao, X.D., 2011. Degradation of soil-sorbed
trichloroethylene by stabilized zero valent iron nanoparticles: Effects of sorption,
surfactants, and natural organic matter. Water Res. 45(7), 2401-2414.
Zhang, M. and Zhao D.Y., 2013. In situ dechlorination in soil and groundwater using
stabilized zero-valent iron nanoparticles: Some field experience on effectiveness and
limitations. Novel Solutions to Water Pollution, Chapter 6, ACS Symposium Series,
1123, 79-96.
Zhou, J., Han, Y., Wang, W., Xu, Z., Wan, H., Yin, D., Zheng, S. and Zhu, D., 2013.
Reductive removal of chloroacetic acids by catalytic hydrodechlorination over
Pd/ZrO2 catalysts. Appl. Catal. B-Environ. 134, 222-230.
Zhu, B.W., Lim, T.T. and Feng, J., 2008. Influences of amphiphiles on dechlorination of
a trichlorobenzene by nanoscale Pd/Fe: Adsorption, reaction kinetics, and interfacial
interactions. Environ. Sci. Technol. 42(12), 4513-4519.
160
APPENDIX A. HYDRUS-1D model for nanoparticle transport simulation
For the nonequilibrium transport of solutes involved problem, there are two key
modules need to be set up by users in HYDRUS-1D. The first one is the water flow
module, and the second one which is also the most important is the solute transport
module.
The water flow module requires the porous media properties parameters (such as
porosity and hydraulic conductivity), water flow condition of the experiment (such as
boundary flow condition and flow velocity), and the numerical calculation parameters
(such as iteration criteria and time step control). The default values of numerical
calculation parameters were used in this work, and porosity and hydraulic conductivity
was measured and entered by user. The boundary conditions were chosen according to
experiment conditions, and in this work constant flux was set for both upper and lower
boundary conditions.
In the solute transport module, there are one equilibrium model and five non-
equilibrium models were given in this software. In this work two kinetic sites model for
particle transport using attachment/detachment was being used. The two kinetic sites of
convection-dispersion equation was as below (Wang et al., 2008; Simunek et al., 2005;):
∂𝐶
∂𝑡= λ𝑣𝑝
∂2𝐶
∂𝑧2− 𝑣𝑝
∂𝐶
∂𝑧−ρ𝑏
𝜃𝑤(𝜕𝑆1
𝜕𝑡+𝜕𝑆2
𝜕𝑡) − 𝜇𝑤𝜃𝑐 − 𝜇𝑠𝜌(𝑆1 + 𝑆2) (A-1)
where C is the particle concentration in the aqueous phase (NcL-3), S is the particle
concentration in the solid phase (NcM-1), subscripts 1 and 2 represent two kinetic sorption
sites, respectively, Nc is the number of particles, M is the mass of solid phase, z (L-1) is
161
the distance along the column from the inlet, t is the time (T), λ is the dispersivity (L), 𝑣𝑝
is the average pore velocity (LT-1), ρb is the porous media bulk density (ML-3), 𝜃𝑤 is the
water content, which is equal to porosity under saturation condition, and 𝜇𝑤 (T-1) and 𝜇𝑠
(T-1) are first-order degradation coefficients in the liquid and solid phases, respectively
(Simunek et al., 2005).
For this work, as MnO2 nanoparticle could not diminish due to inactivation and
degradation, thus 𝜇𝑤 and 𝜇𝑠 are equal to zero. Note there is much fewer sites of soil could
be instantaneous sorption (site 1) by MnO2 nanoparticles compared to a kinetic sorption
(site 2), the two kinetic sites model was reduced to one site model. Thus, the Eqn A-1 is
reduced to Eqn A-2:
∂𝐶
∂𝑡= λ𝑣𝑝
∂2𝐶
∂𝑧2− 𝑣𝑝
∂𝐶
∂𝑧−ρ𝑏
𝜃𝑤
𝜕𝑆
𝜕𝑡 (A-2)
Set “Frac”=0 in the solute transport and reaction parameter to turn off the instantaneous
sorption site, and set “SinkWater”=0 and “SinkSolid”=0 to turn off the inactivation and
degradation term.
Particle mass transfer between the aqueous and solid phases can be described as
(Bolster et al., 1999):
ρ𝑏
𝜃𝑤
𝜕𝑆
𝜕𝑡= 𝑘𝑑𝑒𝑝𝜓𝐶 −
ρ𝑏
𝜃𝑤𝑘𝑑𝑒𝑡𝑆 (A-3)
where 𝑘𝑑𝑒𝑝 is the first-order deposition coefficient of CMC-MnO2 [T-1], 𝑘𝑑𝑒𝑡 is first-
order detachment coefficient [T-1], and 𝜓 is a dimensionless blocking function to describe
the change of the available fraction of deposition surface sites.
In this work, as the BTCs are showed almost no tailing, which indicate a
negligible detachment of the particle from the soil. As a result, 𝑘𝑑𝑒𝑡 was set to zero.

162
A simple Langmuirian blocking function, which was derived from the Langmuir
adsorption model, was used to account for the dynamic blocking (Adamczyk et al.,
1994):
𝜓 =𝑆𝑚𝑎𝑥−𝑆
𝑆𝑚𝑎𝑥 (A-4)
where 𝑆𝑚𝑎𝑥 is the maximum MnO2 deposition capacity [NcM-1].
Substitute Eqn. A-4 to A-3, we get:
ρ𝑏
𝜃𝑤
𝜕𝑆
𝜕𝑡= 𝑘𝑑𝑒𝑝(
𝑆𝑚𝑎𝑥−𝑆
𝑆𝑚𝑎𝑥)𝐶 −
ρ𝑏
𝜃𝑤𝑘𝑑𝑒𝑡𝑆 (A-5)
The HYDRUS-1D code was used to solve Eqs. (A-2) and (A-5). In these two
equations, dispersivity λ was obtained by fitting tracer BTCs using an equilibrium
model. Therefore, there are only two parameters, deposition coefficient 𝑘𝑑𝑒𝑝 and
maximum MnO2 deposition capacity 𝑆𝑚𝑎𝑥, which need to be predict by model fitting. In
the software, the two parameters are “DetachSolid” and “SMax” shown in solute
transport and reaction parameters. Upon choosing fitting these two parameters,
HYDRUS-1D would predict the two parameters by fitting the experiment data to this
model.