dehydration of forward osmosis membrane in treating high
TRANSCRIPT

1
Dehydration of forward osmosis membrane in treating high salinity
wastewaters: performances and implications
Baolong Zhao1, Mengxi Zhang
1, 2, Zhouwei Wang
1, Jianfeng Song
1,2, Myoung Jun Park
4, Ho
Kyong Shon4, Xue-Mei Li
1*, Tao He
1,3*
1 Laboratory for Membrane Materials and Separation Technology, Shanghai Advanced Research
Institute, Chinese Academy of Sciences, Shanghai 201203, China
2University of Chinese Academy of Sciences, Beijing, 100049, China
3School of Physical Science and Technology, ShanghaiTech University, Shanghai, 201210,
China
4Centre for Technology in Water and Wastewater, School of Civil and Environmental
Engineering, University of Technology, Sydney (UTS), P.O. Box 123, 15 Broadway, NSW 2007,
Australia
2
ABSTRACT
Forward osmosis (FO) has shown advantages for desalinating high saline wastewater.
Dehydration of FO membrane was demonstrated for both commercial cellulose triacetate and
tailor-made thin-film composite membranes. A significant loss of FO flux was observed after
membrane dehydration, but the pure water permeability and rejection properties remained about
the same. Visual observation of the membrane dehydration was illustrated by appearance of
opaque/white spots on the initially homogeneous membrane. It was shown that when the active
skin layer was in contact with the saline solution before the support layer was brought into
contact with an aqueous solution, membrane dehydration took place. The dehydration was
ascribed to osmosis gradient across the active layer that caused water flow from membrane
support layer to the active layer, resulting in support dehydration. The dehydrated membrane
could be rewetted again by RO, illustrating that membrane dehydration is reversible. However,
once dehydrated, a membrane with a much lower water flux will be resulting in.
KEYWORDS
Forward osmosis; dehydration; desalination; hollow fiber; thin-film composite; reverse osmosis
3
1. Introduction
Forward osmosis (FO) is an osmotically driven membrane process without utilization of
external hydraulic pressure1. FO has been experimentally proven as an intrinsically low fouling
process1-4
. However, thermodynamically, FO would be more energy intensive than conventional
reverse osmosis (RO), when the recovery of the draw solution is required4. Therefore, the FO
process may find applications mainly in special areas where either RO is not suitable due to high
fouling tendency, high salinity, or the diluted draw solution can be directly used. For example,
osmotic dilution (OD) of the shale gas drilling mud5 and fertilizers
6, 7, and concentration of fruit
juice using sugar8, 9
are the most prosperous areas where FO is highly competitive to other
membrane processes.
In OD of the produced water from oil/gas exploitation, the feed is highly saline and turbid,
with TDS up to 70,000 mg/L or higher4, 5, 10, 11
. When treating such water, a draw solution of
even higher salinity is needed. Therefore, the FO membrane is under a constant stress caused by
osmotic pressure. Frequently, the membrane flux is much lower than expected because of the
severe internal concentration polarization (ICP)1, 12-15
, membrane fouling and/or scaling3, 16, 17
.
Optimization of the membrane support structure could effectively reduce the ICP12, 14, 15, 18-23
. By
modification of membrane surface, decrease in membrane fouling or scaling was also reported24
.
Pre-treatment was used to reduce the fouling propensity in FO process10
. However, when treating
high salinity water streams, one of the often disregarded factors causing low FO water flux is the
FO membrane dehydration.
Membrane dehydration often leads to a significant loss of FO flux along with the FO process.
The dehydration can also be visualized by the appearance of white spots on the membrane

4
surface. However, so far, the origin of membrane dehydration is not clearly understood, and
there has not been a systematic investigation on the membrane dehydration. Characteristics of
dehydrated membranes are not clearly addressed in literature, neither membrane performance
recovery after dehydration. This paper presents the first investigation on the FO membrane
dehydration especially for treating high salinity water. Effects of membrane materials and
operation mode on the dehydration are explored. The performance of the FO membrane after
dehydration is evaluated and a mechanism for the dehydration of FO membrane is proposed. The
solutions to avoid dehydration and performance recovery of dehydrated FO membrane are
discussed, which will contribute to some guidelines for the application of FO in treating high
salinity waters.
2. Experimental
2.1 Materials and chemicals
Polysulfone (PSf P-3500, Solvay) was dried at 100oC for at least one week before use.
Analytical grade (AR) N,N-dimethylacetamide (DMAc), polyethylene glycol (PEG400),
n-hexane, alcohol, N-methyl-2-pyrrolidone (NMP) n-hexane, and sodium chloride (NaCl) were
provided by Sinopharm Groups. 1,2-Phenylenediamine (MPD, 99%) and trimesoyl chloride
(TMC, 98%) were purchased from Sigma-Aldrich. Polyethersulfone (PES) hollow fiber
membranes were supplied by Nanjing Altrateck Co. Ltd. Underground brine (UGB) was
supplied by Shangdong Haihua Chemical Industry. Commercial cellulose triacetate (CTA)
membrane was supplied by Hydration Technology Innovations (HTI).
2.2 Preparation and characterization of the TFC membranes

5
2.2.1 PSf flat-sheet TFC membrane
Flat-sheet TFC membrane was prepared by following a previously reported procedures 23
.
PSf support membrane was initially made and PSf/PEG-400/DMAc (18/8/74 wt.%) was mixed
in a three-neck flask at 65oC overnight till a clear solution was obtained. The polymer solution
was filtered and then de-gassed in an oven at 60oC overnight. The solution was cast on a dry
glass plate using an automatic casting apparatus (Elcometer 4340, Elcometer Asia Pte. Ltd)
pre-set with 150 µm gap. The nascent film was then immersed into a water bath (30 oC) for
precipitation. Subsequently, PSf membranes were washed thoroughly and stored in DI water
before further usage. A polyamide selective layer was formed on top surface of the PSf
membrane via interfacial polymerization as follows. The wet PSf support was initially dried with
an air knife and brought into contact with water phase for 2 min. The composition of water phase
was adopted from the report of Kim et al 25
at a pH of 11.2. The excessive aqueous solution was
decanted and the membrane surface was blown dry under a stream of nitrogen gas. Afterwards,
the membrane was brought into contact with the organic phase (TMC hexane solution, 0.15 wt
%) for 1 min. The membrane was then air-dried for 2 min and cured in an oven at 100 oC for 3
min. The fresh membranes were stored in DI water before further test.
2.2.2 PES hollow fiber TFC membranes
Preparation of hollow fiber (HF) TFC FO membranes followed the previously reported
procedure18-21, 26
. Ten pieces of PES HF membranes were potted in a nylon tube (with an
effective fiber length of 25 cm and effective membrane surface area of 85 cm2). A fresh water
phase as above was introduced to the bore side of the fibers with a resident time of 2 min before
discharged. After blowing dry by nitrogen gas, organic phase was led to the bore for contact

6
time of 1 min. The membrane was cured with hot water (85 oC) for 5 min. Finally, the membrane
module was immersed in DI water before further characterization.
2.2.3 Characterization of FO membranes
The standard characterization protocol for flat-sheet FO membranes was adopted in this test 27
.
The intrinsic pure water permeability (A) and solute permeability coefficient (B) of the
membranes were determined using a cross-flow RO filtration system (Sterlitech Corporation).
Detailed procedures are provided as Supplementary Information (S1 Preparation and
characterization of forward osmosis membranes).
2.3 Dehydration experiment
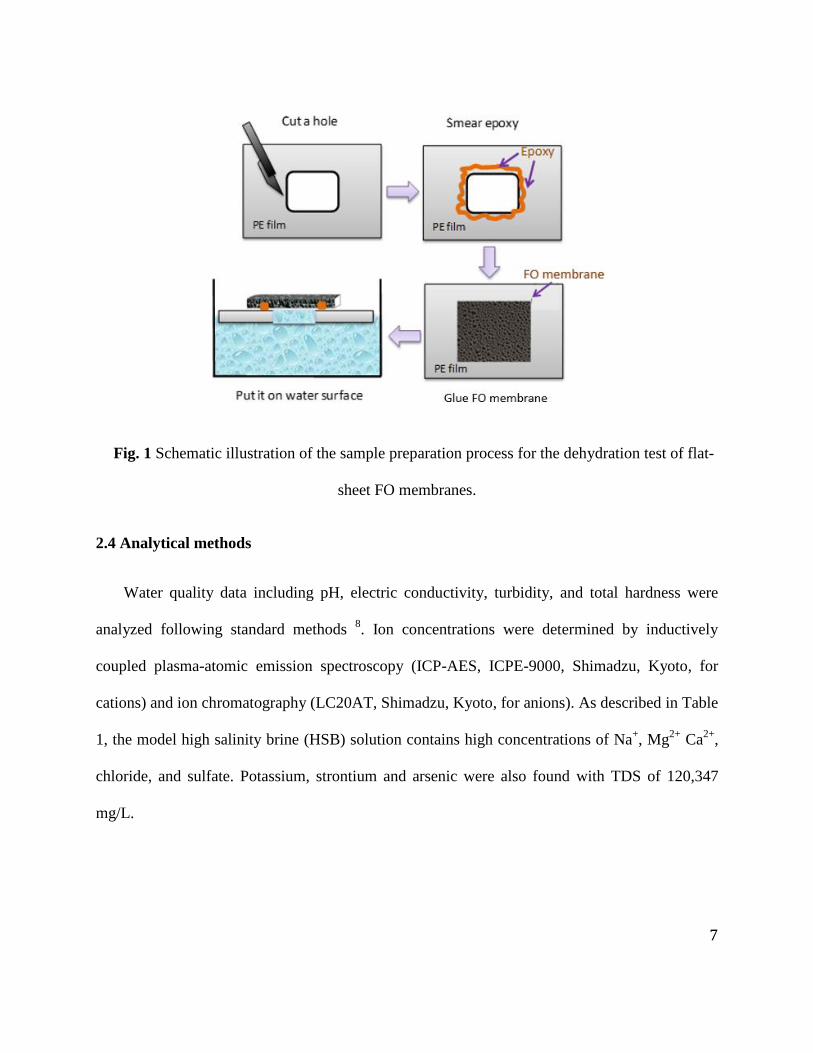
The dehydration test is schematically shown in Fig.1. A flat-sheet FO membrane sample (40
mm × 40 mm) was glued to the pre-cut opening (30 mm ×30 mm) in a polyethylene (PE) film
(25 μm thickness). This ensures that only one side of the membrane was in contact with the
liquid when being placed above a sample solution (Fig. 1). Dehydration of the membranes was
then observed visually. For HF TFC FO membrane, the high salinity solution was fed to the bore
(flow rate of 0.66 m/s) or shell side (0.25 m/s) of the membrane using a calibrated gear pump for
a certain period of time. Afterwards, the membrane module was rinsed using 2 L DI water for 30
min for at least 3 times to completely rinse out any remaining salt. The cleaned HF membrane
was then tested in the AL-FS mode, i.e. the membrane active layer facing the feed solution
(Supplementary Information S1).
7
Fig. 1 Schematic illustration of the sample preparation process for the dehydration test of flat-
sheet FO membranes.
2.4 Analytical methods
Water quality data including pH, electric conductivity, turbidity, and total hardness were
analyzed following standard methods 8. Ion concentrations were determined by inductively
coupled plasma-atomic emission spectroscopy (ICP-AES, ICPE-9000, Shimadzu, Kyoto, for
cations) and ion chromatography (LC20AT, Shimadzu, Kyoto, for anions). As described in Table
1, the model high salinity brine (HSB) solution contains high concentrations of Na+, Mg
2+ Ca
2+,
chloride, and sulfate. Potassium, strontium and arsenic were also found with TDS of 120,347
mg/L.

8
Table 1 Water quality data of the underground brine used in this study
Analytes Concentration
Sodium (mg/L) 13,968
Calcium (mg/L) 7,230
Potassium (mg/L) 1,862
Magnesium (mg/L) 10,864
Strontium (mg/L) 73
Arsenic (mg/L) 71
Chloride (mg/L) 62,137
Sulfate (mg/L) 11,986
Bicarbonate (mg/L) 247
TDS (mg/L) 120,347
3. Results and discussion
3.1 Dehydration of FO membranes
9
The high salinity underground brine (UGB) is a raw material for the production of Na2CO3.
The production process involves evaporation of UGB, which requires a large area of land and is
time-consuming. In order to minimize the footprint of the production process and improve the
process efficiency, we have proposed the use of FO to concentrate the brine. Because of the high
salinity of the UGB (Table 1), saturated NaCl draw solutions were used for the FO concentration
of the UGB.
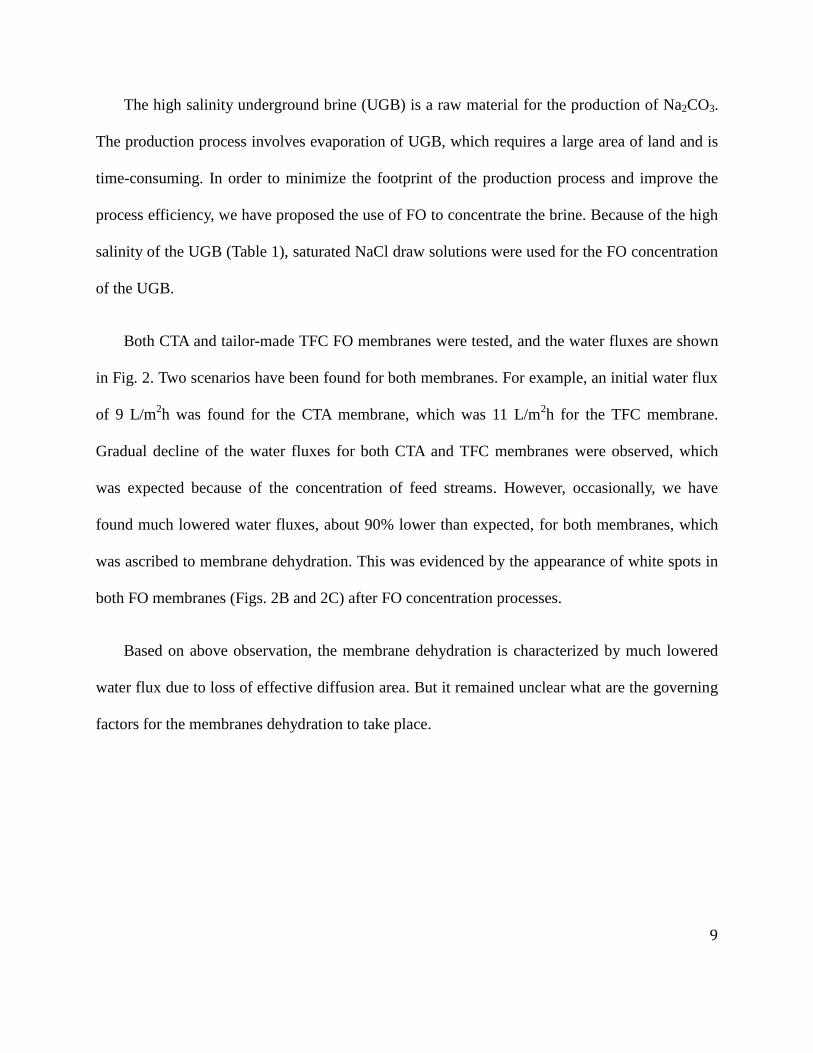
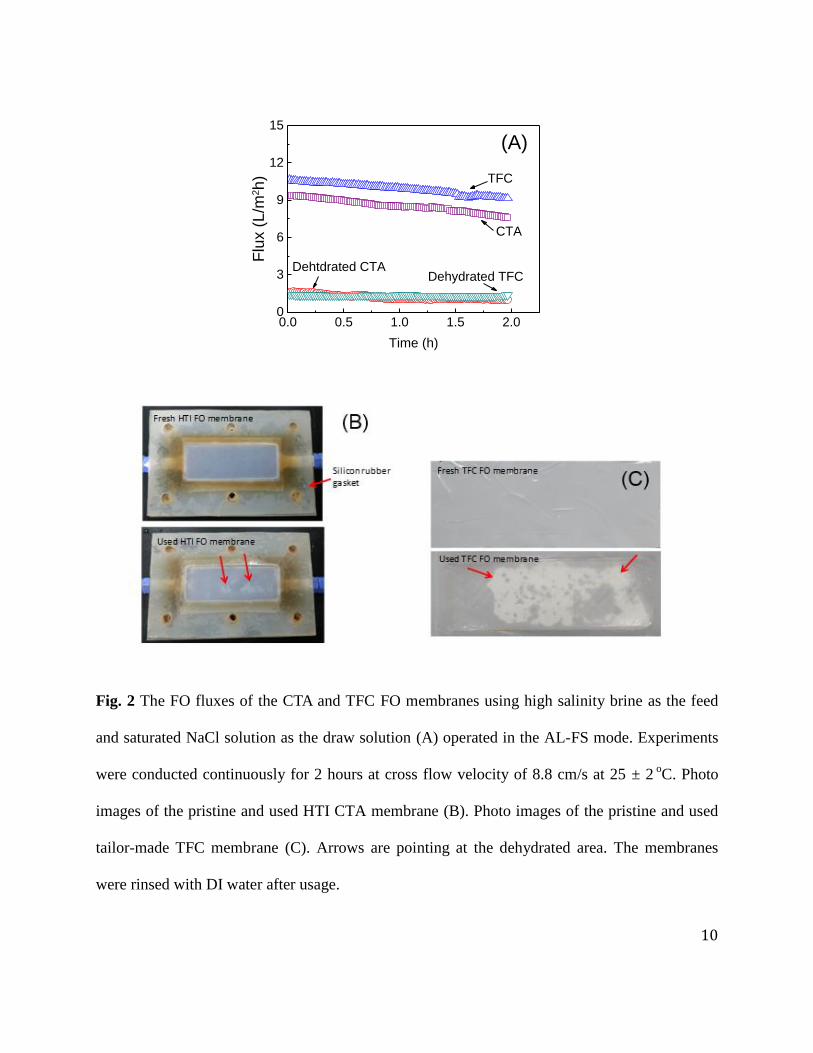
Both CTA and tailor-made TFC FO membranes were tested, and the water fluxes are shown
in Fig. 2. Two scenarios have been found for both membranes. For example, an initial water flux
of 9 L/m2h was found for the CTA membrane, which was 11 L/m
2h for the TFC membrane.
Gradual decline of the water fluxes for both CTA and TFC membranes were observed, which
was expected because of the concentration of feed streams. However, occasionally, we have
found much lowered water fluxes, about 90% lower than expected, for both membranes, which
was ascribed to membrane dehydration. This was evidenced by the appearance of white spots in
both FO membranes (Figs. 2B and 2C) after FO concentration processes.
Based on above observation, the membrane dehydration is characterized by much lowered
water flux due to loss of effective diffusion area. But it remained unclear what are the governing
factors for the membranes dehydration to take place.
10
0.0 0.5 1.0 1.5 2.00
3
6
9
12
15
Flu
x (
L/m
2h
)
Time (h)
TFC
CTA
Dehydrated TFCDehtdrated CTA
(A)
Fig. 2 The FO fluxes of the CTA and TFC FO membranes using high salinity brine as the feed
and saturated NaCl solution as the draw solution (A) operated in the AL-FS mode. Experiments
were conducted continuously for 2 hours at cross flow velocity of 8.8 cm/s at 25 ± 2 oC. Photo
images of the pristine and used HTI CTA membrane (B). Photo images of the pristine and used
tailor-made TFC membrane (C). Arrows are pointing at the dehydrated area. The membranes
were rinsed with DI water after usage.

11
3.2 Controlled dehydration of CTA and TFC membranes
In order to understand the membrane dehydration, a controlled dehydration process was
designed. As shown schematically in Fig. 1, a precut membrane coupon was glued onto a piece
of PE film, which allowed the membrane to float above the aqueous streams. Moreover, only one
side (active layer facing the feed or support layer facing the feed solution) of the membrane may
be in contact with the feed at a time. The saline feed solution with composition listed in Table 1
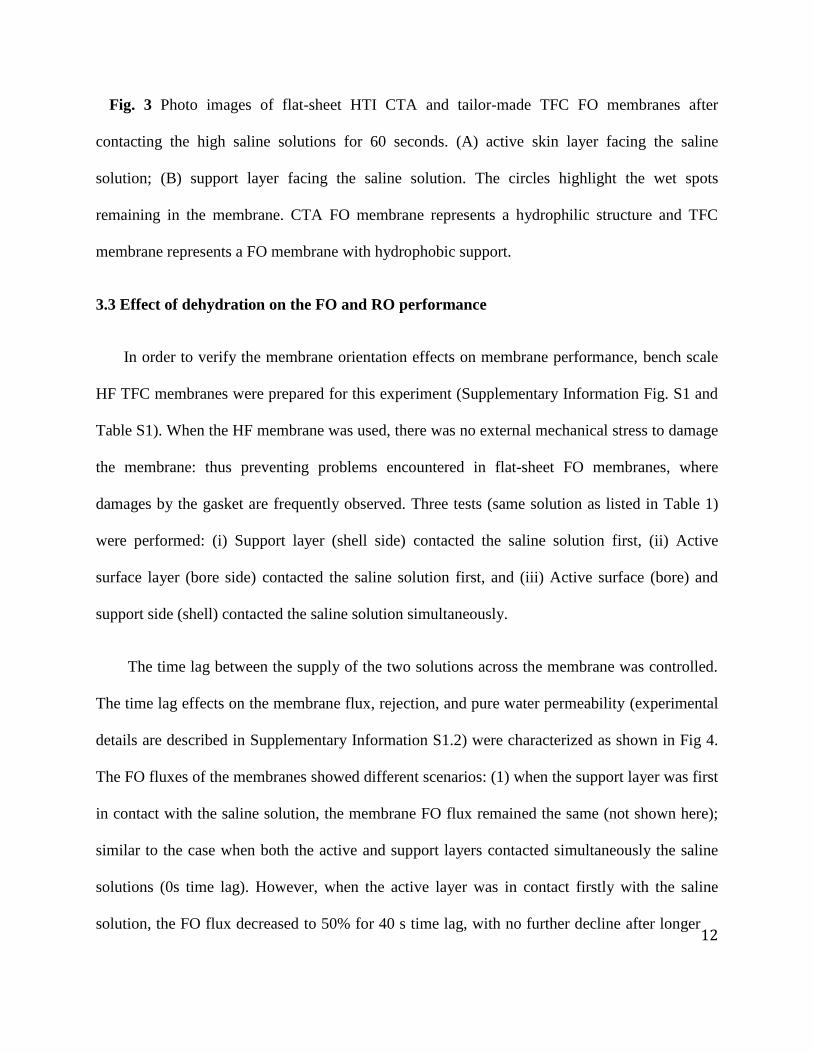
was used. Fig. 3 shows the photo images of both CTA and TFC FO membranes after in contact
with the saline solution. When the active layer contacted the solution, dehydration of the
membrane was observed as indicated by the appearance of white spots, which grew larger with
time in both membranes (Fig 3A). When the support layer was in direct contact with the solution,
both membranes remained in wet state (Fig 3B). This observation suggests that, regardless of the
membrane material, dehydration is more affected by the orientation of the membrane with
reference to which of its side is in contact with the high salinity water and the supply of the other
solution.
12
Fig. 3 Photo images of flat-sheet HTI CTA and tailor-made TFC FO membranes after
contacting the high saline solutions for 60 seconds. (A) active skin layer facing the saline
solution; (B) support layer facing the saline solution. The circles highlight the wet spots
remaining in the membrane. CTA FO membrane represents a hydrophilic structure and TFC
membrane represents a FO membrane with hydrophobic support.
3.3 Effect of dehydration on the FO and RO performance
In order to verify the membrane orientation effects on membrane performance, bench scale
HF TFC membranes were prepared for this experiment (Supplementary Information Fig. S1 and
Table S1). When the HF membrane was used, there was no external mechanical stress to damage
the membrane: thus preventing problems encountered in flat-sheet FO membranes, where
damages by the gasket are frequently observed. Three tests (same solution as listed in Table 1)
were performed: (i) Support layer (shell side) contacted the saline solution first, (ii) Active
surface layer (bore side) contacted the saline solution first, and (iii) Active surface (bore) and
support side (shell) contacted the saline solution simultaneously.
The time lag between the supply of the two solutions across the membrane was controlled.
The time lag effects on the membrane flux, rejection, and pure water permeability (experimental
details are described in Supplementary Information S1.2) were characterized as shown in Fig 4.
The FO fluxes of the membranes showed different scenarios: (1) when the support layer was first
in contact with the saline solution, the membrane FO flux remained the same (not shown here);
similar to the case when both the active and support layers contacted simultaneously the saline
solutions (0s time lag). However, when the active layer was in contact firstly with the saline
solution, the FO flux decreased to 50% for 40 s time lag, with no further decline after longer

13
time lag (120 s). It probably means that the FO membrane occurred nearly instantaneously;
reaching a maximum extent within a very short time. On the other hand, both the pure water
permeability (A value) and the rejection of membranes were about nearly the same (Fig. 4B).
These results appear to confirm that the membrane active layer remained intact even when the
membrane was dehydrated. Moreover, it appeared that the RO operation was able to hydrate the
dehydrated membrane.
0 40 12030
60
90
120
Time (s)
SL-Saline water first
AL-Saline water first(A)
Jv/J
v-o
rigin
al (%
)
1.5
2.0
2.5
3.0
3.5
A value Rejection
A (
L/m
2h
)
90
92
94
96
98
Re
jectio
n (
%)
Original Dehydrated
(B)
Fig. 4 (A) Effects of different time interval supplying the saline solution to between the active
layer (AL) and the support layer (SL) on the FO flux. The Y axis is presented as the ratio of the
FO flux to the original flux. The FO test was carried out at AL-FS mode using 0.5 M NaCl
solution as the draw solution and DI water as the feed at 25 oC. Before the FO test, the
membranes were thoroughly cleaned with DI water to remove any salt left in the membrane
structure. (B) The water permeability and rejection of the hollow fiber TFC membranes before
and after dehydration. A value was determined using pure water as feed. The test conditions of
RO: operation pressure = 2 bar, feed solution= 100 mg/L NaCl solution at 25 oC.
3.4 Proposed mechanism of dehydration
14
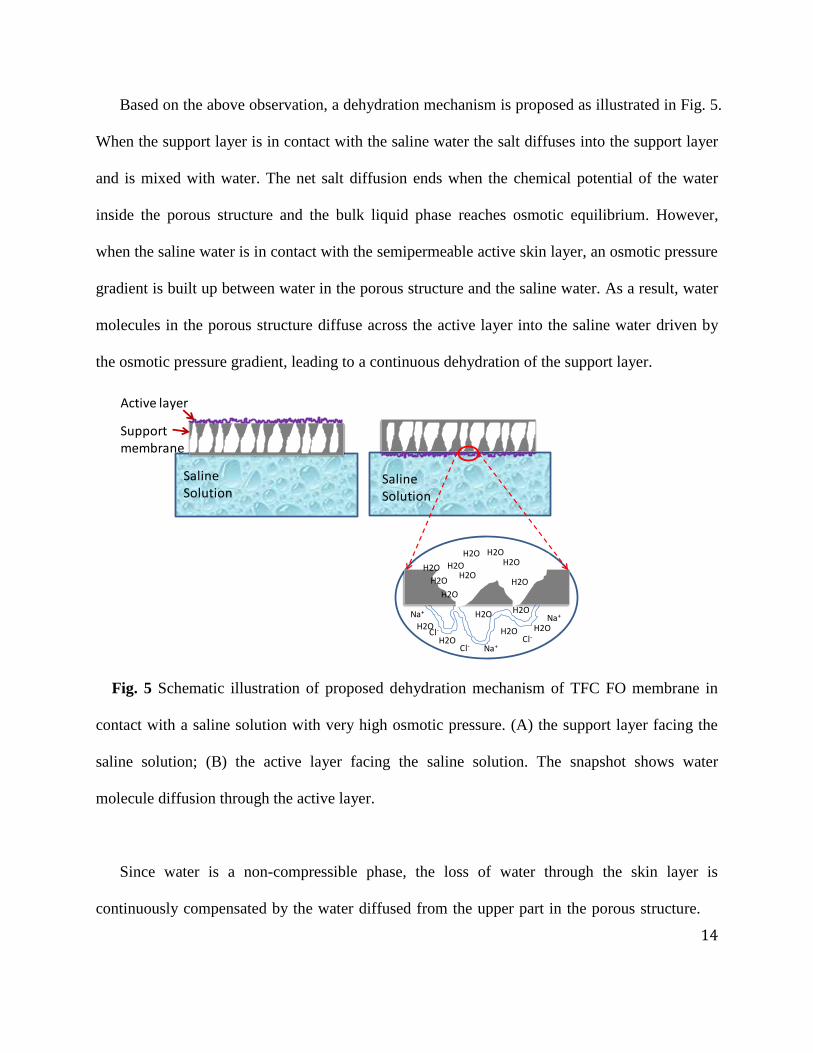
Based on the above observation, a dehydration mechanism is proposed as illustrated in Fig. 5.
When the support layer is in contact with the saline water the salt diffuses into the support layer
and is mixed with water. The net salt diffusion ends when the chemical potential of the water
inside the porous structure and the bulk liquid phase reaches osmotic equilibrium. However,
when the saline water is in contact with the semipermeable active skin layer, an osmotic pressure
gradient is built up between water in the porous structure and the saline water. As a result, water
molecules in the porous structure diffuse across the active layer into the saline water driven by
the osmotic pressure gradient, leading to a continuous dehydration of the support layer.
Saline Solution
Saline Solution
Supportmembrane
Active layer
H2O
H2OH2O
H2O
Na+
Na+Cl-
Na+
Cl-
Cl-
H2O
H2O
H2O
H2O
H2O
H2O
H2O
H2O H2O
H2O
H2O
Fig. 5 Schematic illustration of proposed dehydration mechanism of TFC FO membrane in
contact with a saline solution with very high osmotic pressure. (A) the support layer facing the
saline solution; (B) the active layer facing the saline solution. The snapshot shows water
molecule diffusion through the active layer.
Since water is a non-compressible phase, the loss of water through the skin layer is
continuously compensated by the water diffused from the upper part in the porous structure.
15
The accurate starting point of dehydration is unknown, but most probably from the far side of the
support layer to the active skin. Based on this mechanism, the dehydration process is
independent of membrane materials for both the active layer and support layer. Therefore, both
HTI CTA and TFC (PSf support and PES support) membranes showed the same dehydration
phenomenon (Fig. 2 and 3). The osmotic pressure of the saline solution gives impact on the rate
of dehydration. At a lower osmotic pressure, the process for dehydration is slower; when 0.5 M
NaCl solution was utilized as a test saline solution for both CTA and TFC FO membranes,
dehydration was also observed at a slower rate when the active layer was in direct contact with
the saline solution. Moreover, because dehydration occurred mostly in the support layer, pure
water permeability and rejection properties remain the same, as confirmed by the RO test.
4. Conclusions
The dehydration of FO membrane has been investigated using commercial CTA and
home-made TFC membranes. Results showed that membrane dehydration is characterized by the
loss of FO flux up to 50%, but the A value and rejection properties remain unchanged. Visual
observation of the membrane dehydration is demonstrated by the appearance of opaque or white
spots on the membrane surface. Careful designed experiments illustrated that the membrane
dehydration was caused by an osmotic pressure gradient that draws water flow from the support
to the active layer and lack of water supply in the membrane support. Especially for the
treatment of high salinity waste streams, the membrane dehydration may become serious because
the dehydration occurs within a short time of less than 1 min. We have shown that RO could be
used to rehydrate the FO membranes. However, sufficient water supply in the support layer is

16
critical to avoid membrane dehydrations. Results reported here have provided some insights on
membrane dehydration mechanism, which will be critical for FO applications where high salinity
feed streams are concerned.
AUTHOR INFORMATION
Corresponding Author
*Phone: 0086-21-20325162, Fax: 0086-21-20325034, email: [email protected], [email protected].
Notes
The authors declare no competing financial interest.
ACKNOWLEDGMENT
We acknowledge the financial support from Natural Science Foundation of China (21176119),
National Key Basic Research Program (973 Program, No. 2009CB623402, 2012CB932800),
TMSR from Chinese Academy of Sciences (Project No. XDA02020100) and ARC Future
Fellowship.
REFERENCES
1. Cath, T.; Childress, A.; Elimelech, M., Forward osmosis: Principles, applications, and recent
developments. Journal of Membrane Science 2006, 281, (1-2), 70-87.
2. Chung, T.-S.; Zhang, S.; Wang, K. Y.; Su, J.; Ling, M. M., Forward osmosis processes:
Yesterday, today and tomorrow. Desalination 2012, 287, 78-81.
3. Mi, B.; Elimelech, M., Organic fouling of forward osmosis membranes: Fouling

17
reversibility and cleaning without chemical reagents. Journal of Membrane Science 2010, 348,
(1-2), 337-345.
4. Shaffer, D. L.; Werber, J. R.; Jaramillo, H.; Lin, S.; Elimelech, M., Forward osmosis: Where
are we now? Desalination 356, (0), 271-284.
5. Hickenbottom, K. L.; Hancock, N. T.; Hutchings, N. R.; Appleton, E. W.; Beaudry, E. G.;
Xu, P.; Cath, T. Y., Forward osmosis treatment of drilling mud and fracturing wastewater from
oil and gas operations. Desalination 2013, 312, 60-66.
6. Phuntsho, S.; Shon, H. K.; Hong, S.; Lee, S.; Vigneswaran, S., A novel low energy fertilizer
driven forward osmosis desalination for direct fertigation: Evaluating the performance of
fertilizer draw solutions. Journal of Membrane Science 2011, 375, (1-2), 172-181.
7. Phuntsho, S.; Shon, H. K.; Majeed, T.; El Saliby, I.; Vigneswaran, S.; Kandasamy, J.; Hong,
S.; Lee, S., Blended Fertilizers as Draw Solutions for Fertilizer-Drawn Forward Osmosis
Desalination. Environmental Science & Technology 2012, 46, (8), 4567-4575.
8. Clesceri, L. S., Greenberg, A.E. & Eaton, A.D. (eds), Standard Methods for the Examination
of Water and Wastewater, 20th edn. American Public Health Association/American Water
Works Association/Water Environment Federation: Washington, DC, USA, 1999.
9. Garcia-Castello, E. M.; McCutcheon, J. R.; Elimelech, M., Performance evaluation of
sucrose concentration using forward osmosis. Journal of Membrane Science 2009, 338, (1-2),
61-66.
10. Li, X.-M.; Zhao, B.; Wang, Z.; Xie, M.; Song, J.; Nghiem, L. D.; He, T.; Yang, C.; Li, C.;
Chen, G., Water reclamation from shale gas drilling flow-back fluid using a novel forward
osmosis-vacuum membrane distillation hybrid system. Water Science Technology 2014, 69, (5),
1036-1044.
18
11. Shaffer, D. L.; Arias Chavez, L. H.; Ben-Sasson, M.; Romero-Vargas Castrillon, S.; Yip, N.
Y.; Elimelech, M., Desalination and reuse of high-salinity shale gas produced water: drivers,
technologies, and future directions. Environ Sci Technol 2013, 47, (17), 9569-83.
12. Gray, G. T.; McCutcheon, J. R.; Elimelech, M., Internal concentration polarization in
forward osmosis: role of membrane orientation. Desalination 2006, 197, (1–3), 1-8.
13. Park, M.; Lee, J. J.; Lee, S.; Kim, J. H., Determination of a constant membrane structure
parameter in forward osmosis processes. Journal of Membrane Science 2011, 375, (1–2),
241-248.
14. Tang, C. Y.; She, Q.; Lay, W. C. L.; Wang, R.; Fane, A. G., Coupled effects of internal
concentration polarization and fouling on flux behavior of forward osmosis membranes during
humic acid filtration. Journal of Membrane Science 2010, 354, (1-2), 123-133.
15. Wang, K. Y.; Ong, R. C.; Chung, T.-S., Double-Skinned Forward Osmosis Membranes for
Reducing Internal Concentration Polarization within the Porous Sublayer. Industrial and
Engineering Chemistry Research 2010, 49, (10), 4824-4831.
16. Liu, P.; Gao, B.; Shon, H. K.; Ma, D.; Rong, H.; Zhao, P.; Zhao, S.; Yue, Q.; Li, Q., Water
flux behavior of blended solutions of ammonium bicarbonate mixed with eight salts respectively
as draw solutions in forward osmosis. Desalination 2014, 353, (0), 39-47.
17. Xie, M.; Nghiem, L. D.; Price, W. E.; Elimelech, M., Impact of humic acid fouling on
membrane performance and transport of pharmaceutically active compounds in forward osmosis.
Water Research 2013, 47, (13), 4567-4575.
18. Li, G.; Wang, Z.; Li, C.; Li, X.-M.; He, T.; Gao, C., Preparation and characterization of
hollow fiber forward osmosis membrane by interfacial polymerization. CIESC Journal 2014, 65,
(8), 3082-3088.
19
19. Setiawan, L.; Wang, R.; Li, K.; Fane, A. G., Fabrication of novel poly(amide-imide) forward
osmosis hollow fiber membranes with a positively charged nanofiltration-like selective layer.
Journal of Membrane Science 2011, 369, (1-2), 196-205.
20. Setiawan, L.; Wang, R.; Li, K.; Fane, A. G., Fabrication and characterization of forward
osmosis hollow fiber membranes with antifouling NF-like selective layer. Journal of Membrane
Science 2012, 394–395, (0), 80-88.
21. Shi, L.; Chou, S. R.; Wang, R.; Fang, W. X.; Tang, C. Y.; Fane, A. G., Effect of substrate
structure on the performance of thin-film composite forward osmosis hollow fiber membranes.
Journal of Membrane Science 2011, 382, (1-2), 116-123.
22. Wang, K. Y.; Chung, T.-S.; Amy, G., Developing thin-film-composite forward osmosis
membranes on the PES/SPSf substrate through interfacial polymerization. AIChE Journal 2012,
58, (3), 770-781.
23. Xiao, P.; L, N.; Yin, Y.; Li, X.-M.; Zhang, M.; Chen, G.; Song, J.; He, T., A Sacrificial-layer
Approach to Fabricate Polysulfone Support for Forward Osmosis Thin-film Composite
Membranes with Reduced Internal Concentration Polarisation. Journal of Membrane Science
2015, 481, 106-114.
24. Lu, X. L.; Castrillon, S. R.-V.; Shaffer, D. L.; Ma, J.; Elimelech, M., In situ surface chemical
modification of thin-film composite forward osmosis membranes for enhanced organic fouling
resistance. Environmental Science & Technology 2013, 47, (21), 12219-12228.
25. Kim, S. H., Kwak, S.Y., Suzuki, T., Positron annihilation spectroscopic evidence to
demonstrate the flux-enhancement mechanism in morphology-controlled thin-film-composite
(TFC) membrane. Environmental Science & Technology 2005, 39, (6), 1764-1770.
26. Wang, R.; Shi, L.; Tang, C. Y.; Chou, S.; Qiu, C.; Fane, A. G., Characterization of novel
20
forward osmosis hollow fiber membranes. Journal of Membrane Science 2010, 355, (1-2),
158-167.
27. Cath, T. Y.; Elimelech, M.; McCutcheon, J. R.; McGinnis, R. L.; Achilli, A.; Anastasio, D.;
Brady, A. R.; Childress, A. E.; Farr, I. V.; Hancock, N. T.; Lampi, J.; Nghiem, L. D.; Xie, M.;
Yip, N. Y., Standard Methodology for Evaluating Membrane Performance in Osmotically
Driven Membrane Processes. Desalination 2013, 312, 31-38.