dekalb chamber of commerce february 11, 2013 1examine the data for education in georgia 2economic...
TRANSCRIPT

DeKalb Chamber of CommerceFebruary 11, 2013
1 Examine the Data for Education in Georgia
2 Economic Impact of Georgia Non-Graduates
3 Strengthening the Birth to Work Pipeline
4 What Can We Do?

Examine the Data for Education in Georgia

Academic Achievement Milestones
School Readiness
Literacy by 3rd Grade
Numeracy by 8th Grade
High School Graduation
Workforce and/or College Ready
0%
20%
40%
60%
80%
100%
New
Jer
sey
Con
nect
icut
Mas
sach
uset
tsN
ew Y
ork
Haw
aii
Pue
rto R
ico
Del
awar
eIll
inoi
sLo
uisi
ana
Mar
ylan
dG
eorg
iaN
ew H
amps
hire
Ark
ansa
sFl
orid
aC
alifo
rnia
Mis
siss
ippi
Neb
rask
aS
outh
Car
olin
aC
olor
ado
Iow
aP
enns
ylva
nia
Virg
inia
Kan
sas
Mic
higa
nU
nite
d S
tate
sM
aine
Min
neso
taO
klah
oma
Ver
mon
tW
isco
nsin
Texa
sA
laba
ma
Mis
sour
iN
orth
Car
olin
aO
hio
Idah
oK
entu
cky
Tenn
esse
eU
tah
Indi
ana
Mon
tana
Ore
gon
Was
hing
ton
Sou
th D
akot
aA
lask
aN
ew M
exic
oN
orth
Dak
ota
Wes
t Virg
inia
Ariz
ona
Nev
ada
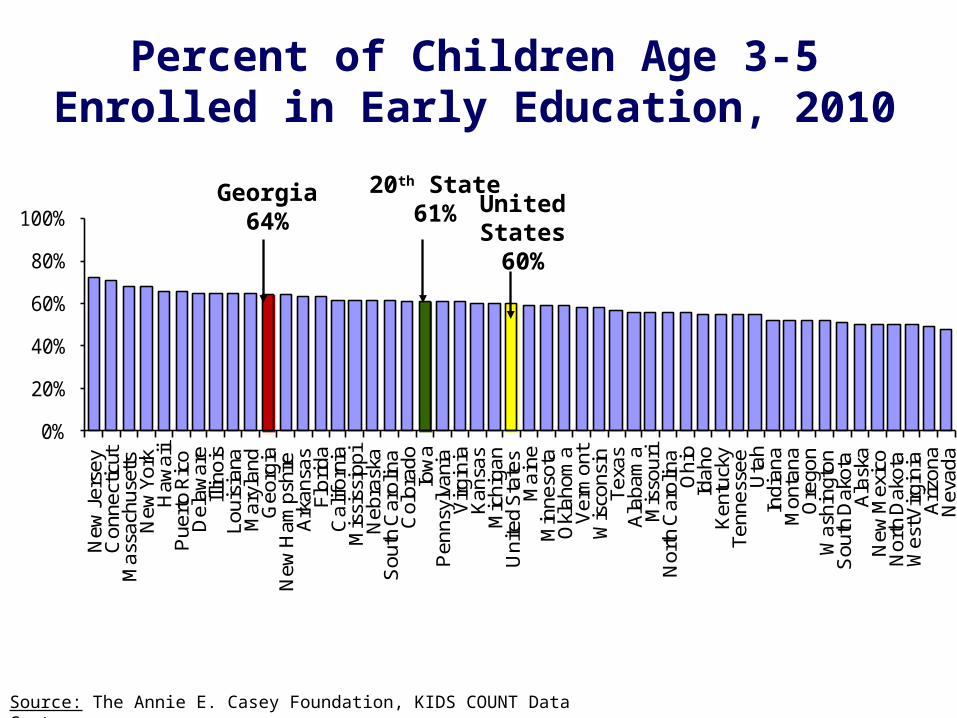
Percent of Children Age 3-5 Enrolled in Early Education, 2010
Source: The Annie E. Casey Foundation, KIDS COUNT Data Center.
20th State61% United
States60%
Georgia64%
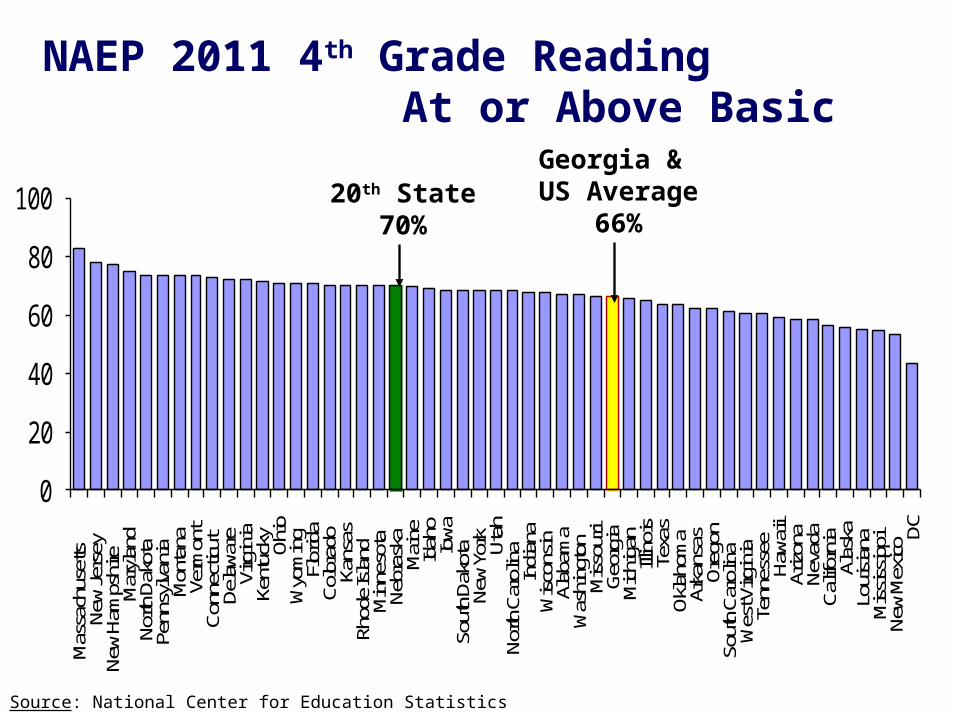
NAEP 2011 4th Grade Reading At or Above Basic
Source: National Center for Education Statistics
0
20
40
60
80
100
Mas
sach
uset
tsNe
w Je
rsey
New
Ham
pshi
reM
aryla
ndNo
rth D
akot
aPe
nnsy
lvani
aM
onta
naVe
rmon
tCo
nnec
ticut
Dela
ware
Virg
inia
Kent
ucky Oh
ioW
yom
ing
Flor
ida
Colo
rado
Kans
asRh
ode I
sland
Min
neso
taNe
bras
kaM
aine
Idah
oIo
waSo
uth D
akot
aNe
w Yo
rk Utah
North
Car
olin
aIn
dian
aW
iscon
sinAl
abam
aW
ashi
ngto
nM
issou
riGe
orgi
aM
ichig
anIlli
nois
Texa
sOk
laho
ma
Arka
nsas
Oreg
onSo
uth C
arol
ina
Wes
t Virg
inia
Tenn
esse
eHa
waii
Arizo
naNe
vada
Calif
orni
aAl
aska
Loui
siana
Miss
issip
piNe
w M
exico
DC
Georgia & US Average
66%20th State
70%

NAEP 2011 8th Grade Math At or Above Basic
Source: National Center for Education Statistics
0
20
40
60
80
100
Mas
sach
uset
tsNo
rth D
akot
aM
inne
sota
Mon
tana
New
Jers
eySo
uth
Dako
taVe
rmon
tNe
w Ha
mps
hire Te
xas
Wyo
min
gCo
lora
doKa
nsas
Ohi
oW
isco
nsin
Mai
neVi
rgin
iaId
aho
Indi
ana
Was
hing
ton Iowa
Conn
ectic
utNo
rth C
arol
inaNe
bras
kaAl
aska
Mar
ylan
dPe
nnsy
lvani
aDe
lawa
reRh
ode I
slan
d Utah
Illin
oisM
isso
uri
Ore
gon
Okl
ahom
aKe
ntuc
kyNa
tiona
l Ave
rage
Mic
higa
nNe
w Yo
rkSo
uth
Caro
lina
Arka
nsas
Geo
rgia
Arizo
naFl
orid
aHa
waii
Neva
daW
est V
irgin
iaTe
nnes
see
New
Mex
ico
Loui
sian
aCa
lifor
niaAl
abam
aM
issi
ssipp
i DC
United States72% Georgia
68%
20th State77%

Iowa
Wisc
onsin
Nebra
ska
North
Dak
ota
Texas
Main
e
Kansa
s
Mas
sach
uset
ts
Penns
ylvan
ia
Mon
tana
Arkan
sas
Hawaii
Wyo
ming
Delawar
e
Minn
esot
a
Rhode
Islan
dUta
h
Wes
t Virg
inia
Colora
do
South
Car
olina
Florida
Alaska
Georg
ia
Nevad
a0%
10%
20%
30%
40%
50%
60%
70%
80%
90%
100%
Source: Ed.gov (2012). Regulatory Adjusted 4-year Cohort Graduation Rate, All Students: 2010-11.
20th State82% Georgia
67%
High School Graduation Rates: State-by-State Rankings

Georgia High School Graduation Rates
Source: The Governor’s Office of Student Achievement, State Report Cards.
YearHigh School
Graduation RateNumber of High
School Non-Grads
2009 58.6%* 62,172
2010 64.0%* 51,503
2011 67.5% 44,661
Total 158,337
* Approximations from Georgia Department of Education

Economic Impact ofGeorgia Non-Graduates
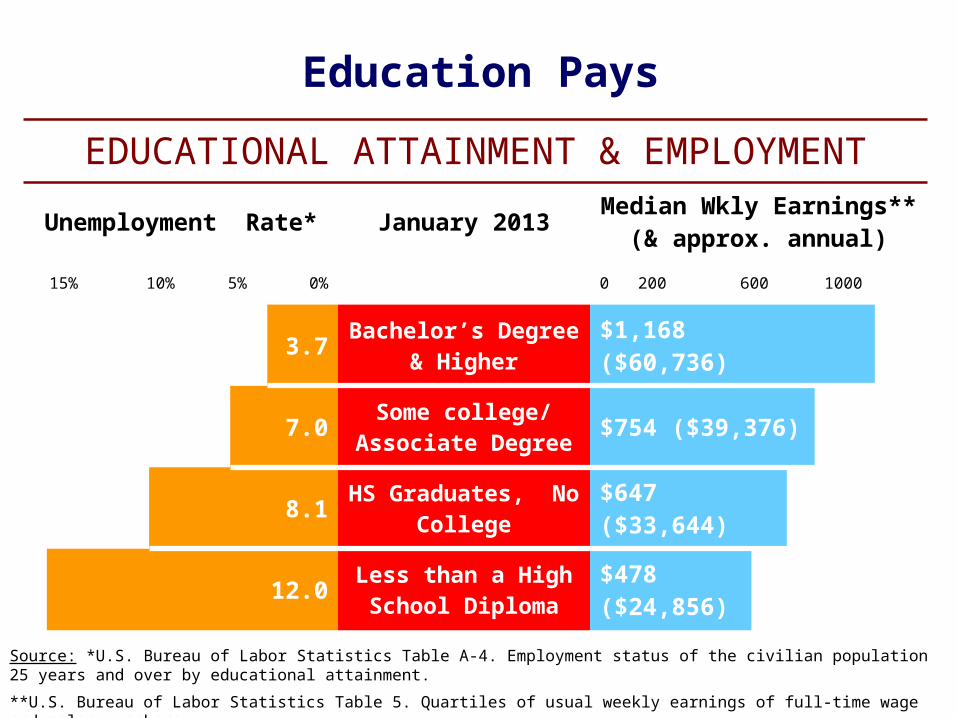
Education Pays
Source: *U.S. Bureau of Labor Statistics Table A-4. Employment status of the civilian population 25 years and over by educational attainment.
**U.S. Bureau of Labor Statistics Table 5. Quartiles of usual weekly earnings of full-time wage and salary workers.
EDUCATIONAL ATTAINMENT & EMPLOYMENT
Unemployment Rate* January 2013
Median Wkly Earnings** (& approx.
annual)
15% 10% 5% 0% 0 200 600 1000
3.7 Bachelor’s Degree & Higher $1,168 ($60,736)
7.0 Some college/ Associate Degree $754 ($39,376)
8.1 HS Graduates, No College
$647 ($33,644)
12.0 Less than a High School Diploma
$478 ($24,856)
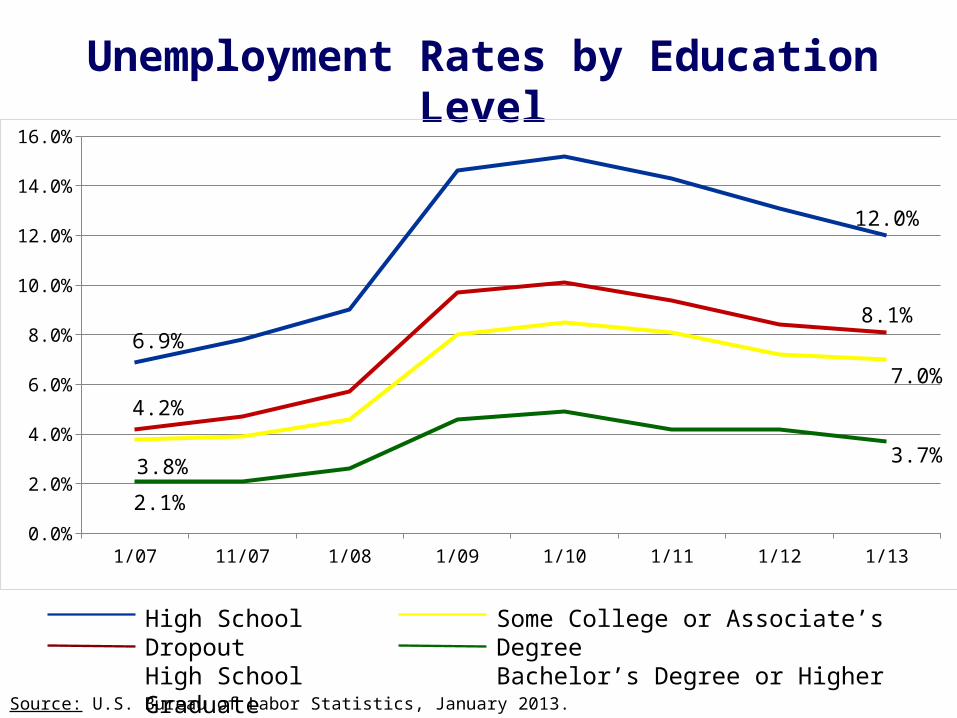
Unemployment Rates by Education Level
Source: U.S. Bureau of Labor Statistics, January 2013.
1/07 1/08 1/09 1/10 1/11 1/12 1/130.0%
2.0%
4.0%
6.0%
8.0%
10.0%
12.0%
14.0%
16.0%
6.9%
12.0%
4.2%
8.1%
3.8%
7.0%
2.1%
3.7%
High School DropoutHigh School Graduate
Some College or Associate’s DegreeBachelor’s Degree or Higher

Unemployment Rates by County: December 2012
Source: Georgia Department of Labor; State average = 8.8% (not seasonally adjusted)

State Service Delivery Regions
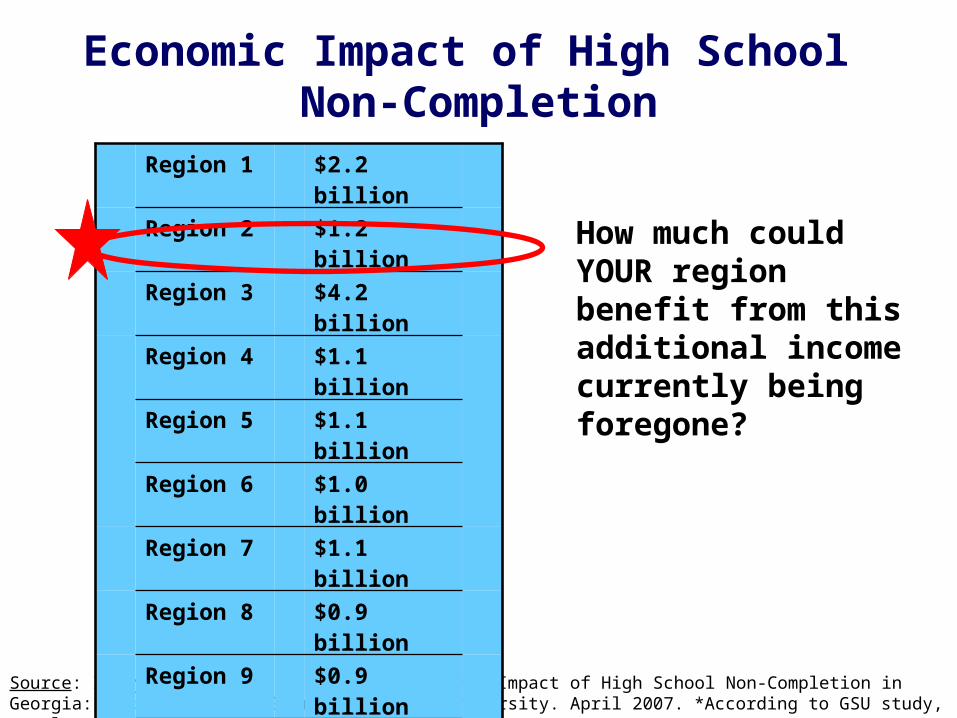
Economic Impact of High School Non-Completion
How much could YOUR region benefit from this additional income currently being foregone?
Source: Isley, P. & Hill, J. “Updated Economic Impact of High School Non-Completion in Georgia: 2005 Estimate,” Georgia Southern University. April 2007. *According to GSU study, totals may not add due to rounding.
Region 1 $2.2 billion
Region 2 $1.2 billion
Region 3 $4.2 billion
Region 4 $1.1 billion
Region 5 $1.1 billion
Region 6 $1.0 billion
Region 7 $1.1 billion
Region 8 $0.9 billion
Region 9 $0.9 billion
Region 10 $2.0 billion
Region 11 $1.0 billion
Region 12 $1.1 billion
TOTAL $18 billion*
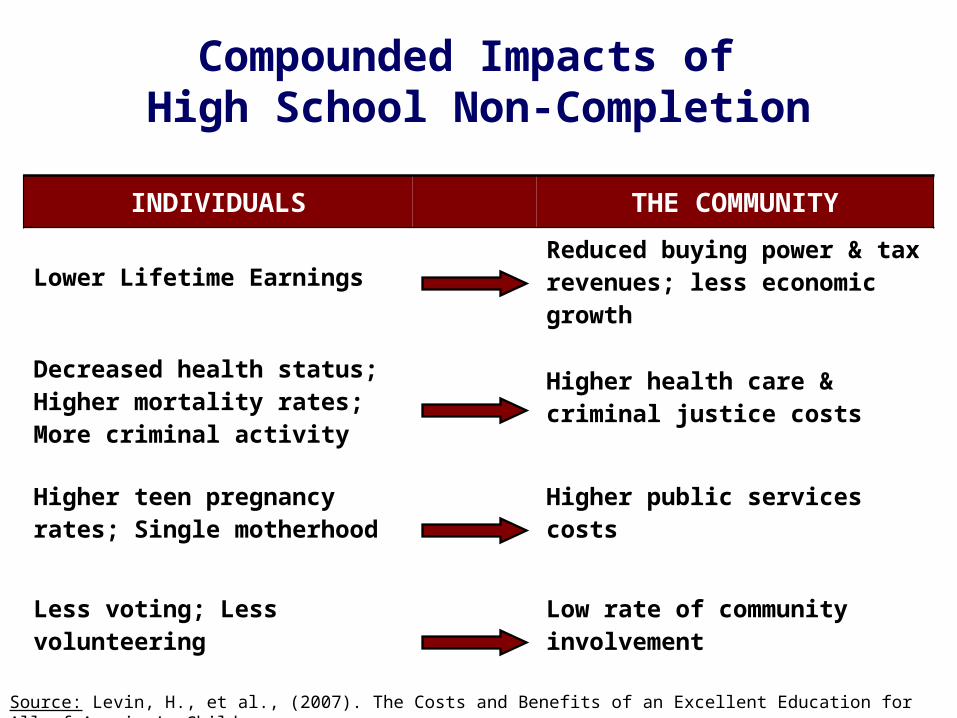
Compounded Impacts of High School Non-Completion
Source: Levin, H., et al., (2007). The Costs and Benefits of an Excellent Education for All of America’s Children.
INDIVIDUALS THE COMMUNITY
Lower Lifetime Earnings Reduced buying power & tax revenues; less economic growth
Decreased health status; Higher mortality rates; More criminal activity
Higher health care & criminal justice costs
Higher teen pregnancy rates; Single motherhood
Higher public services costs
Less voting; Less volunteeringLow rate of community involvement

Strengthening the Birth to Work Pipeline

Strengthening the Birth to Work Pipeline
KEY ISSUE
#1Early Life Experiences
KEY ISSUE
#2Academic Achievement K-12
KEY ISSUE
#3Transitions to Work or College
0
200
400
600
800
1000
1200
9 12 15 18 21 24 27 30 33 36
Age of child in months
Voc
abu
lary
Siz
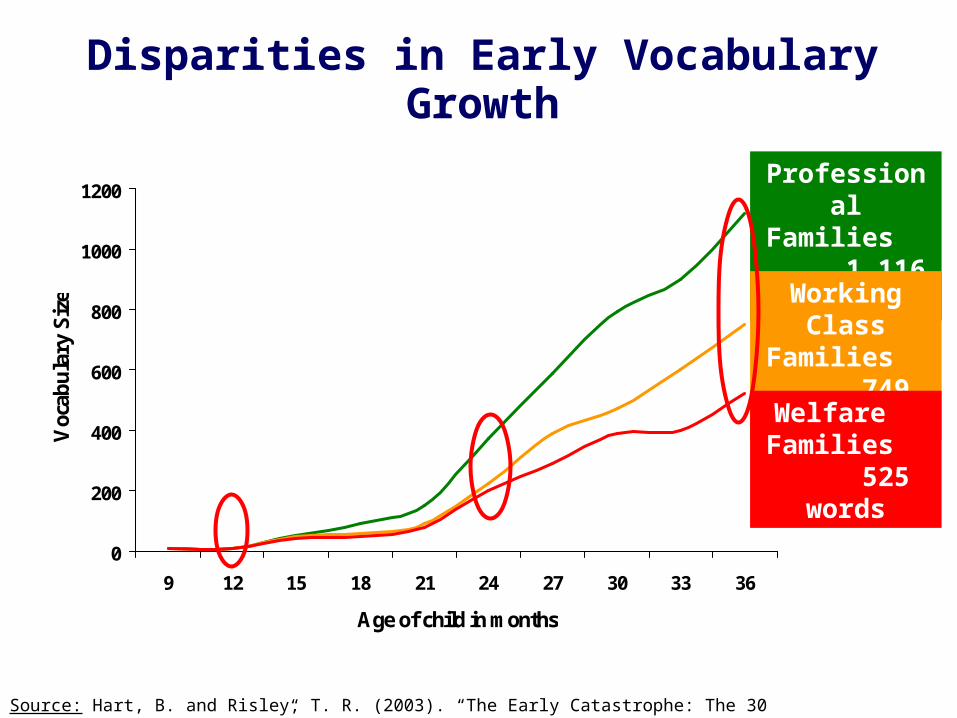
eDisparities in Early Vocabulary Growth
Source: Hart, B. and Risley, T. R. (2003). “The Early Catastrophe: The 30 Million Word Gap by Age 3.”
Professional Families 1,116 words
Working Class Families 749 words
Welfare Families 525 words

Economic Benefits of Early Education:Perry Preschool Study
41%
66%
29%
20%
45%
7%
0% 20% 40% 60% 80%
Never on welfare as adult
Graduated HS on time
Earn $2,000+ monthly
No-Program group Program group
Source: Schweinhart, L.J., et al. (2005). Lifetime effects: The High/Scope Perry Preschool study through age 40.

Strengthening the Birth to Work Pipeline
KEY ISSUE
#1Early Life Experiences
KEY ISSUE
#2Academic Achievement K-12
KEY ISSUE
#3Transitions to Work or College
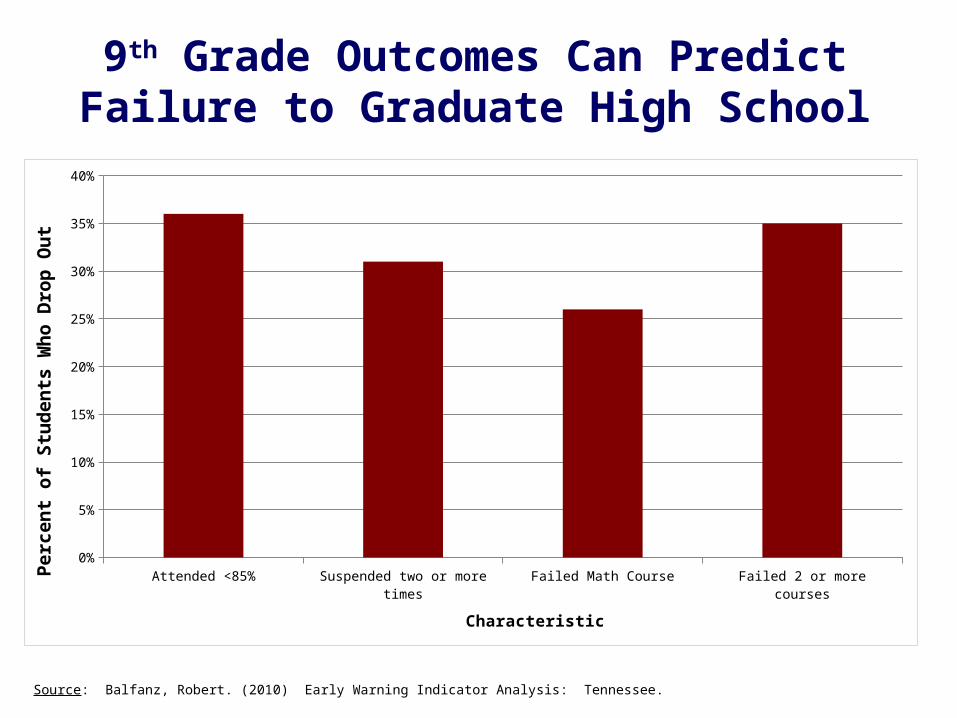
9th Grade Outcomes Can Predict Failure to Graduate High School
Attended <85% Suspended two or more times Failed Math Course Failed 2 or more courses0%
5%
10%
15%
20%
25%
30%
35%
40%
Characteristic
Pe
rce
nt
of
Stu
de
nts
Wh
o D
rop
Ou
t
Source: Balfanz, Robert. (2010) Early Warning Indicator Analysis: Tennessee.
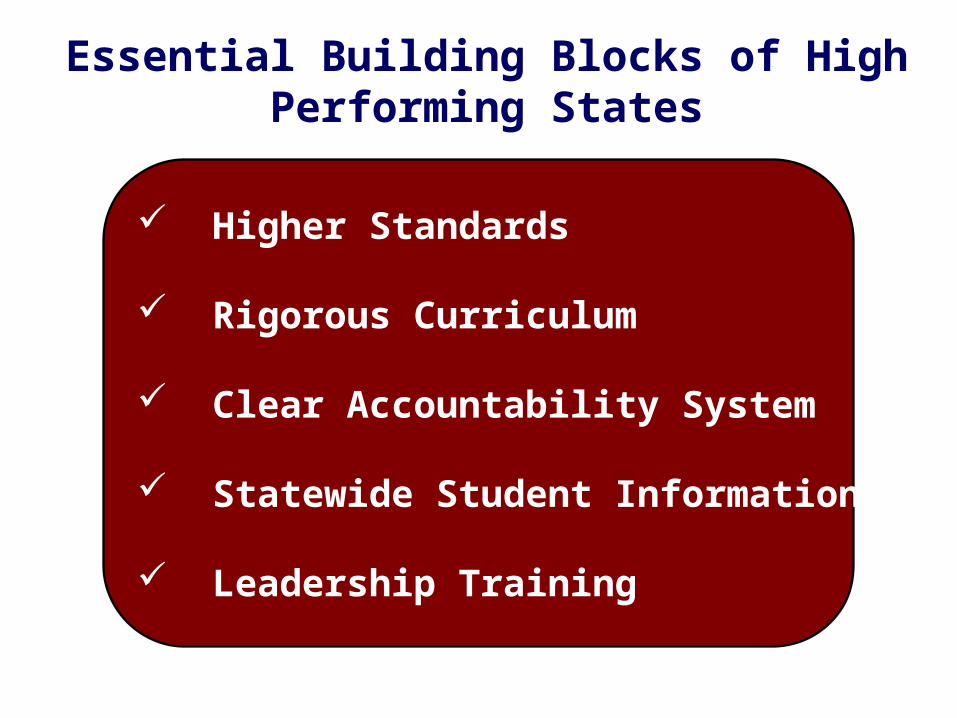
Essential Building Blocks of High Performing States
Higher Standards
Rigorous Curriculum
Clear Accountability System
Statewide Student Information System
Leadership Training
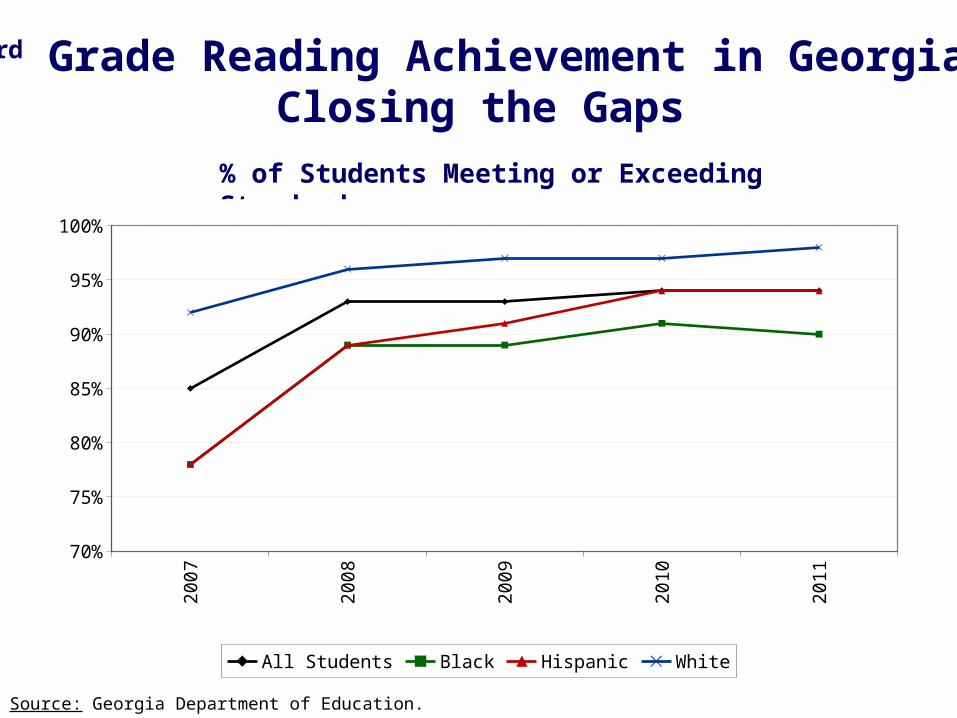
3rd Grade Reading Achievement in Georgia:Closing the Gaps
Source: Georgia Department of Education.
% of Students Meeting or Exceeding Standards2
00
7
20
08
20
09
20
10
20
11
70%
75%
80%
85%
90%
95%
100%
All Students Black Hispanic White

2007 2008 2009 2010 201150%
60%
70%
80%
90%
100%
All Students Black Hispanic White
8th Grade Math Achievement in Georgia:Closing the Gaps
Source: Georgia Department of Education.
% of Students Meeting or Exceeding Standards
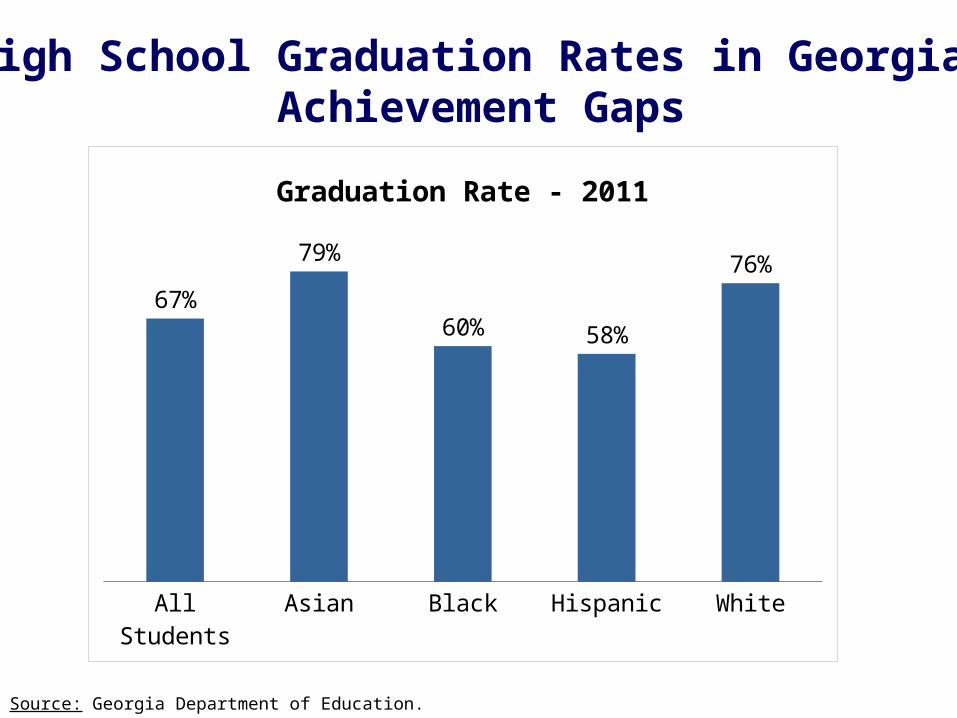
High School Graduation Rates in Georgia:Achievement Gaps
Source: Georgia Department of Education.
All Students Asian Black Hispanic White
67%
79%
60% 58%
76%
Graduation Rate - 2011
Strengthening the Birth to Work Pipeline
KEY ISSUE
#1Early Life Experiences
KEY ISSUE
#2Academic Achievement K-12
KEY ISSUE
#3Transitions to Work or College

Complete College Georgia100 students enroll in a Georgia public college or university
100
Graduate in 4 years
37
20
4
3
2
9
17
6
1
1
0
2
44
36
11
14
3
28
2
1
0
0
0
0
11 28
2-Year Public College 4-Year Public College
Full-Time Part-Time Full-Time Part-Time
Enroll
Return as sophomores
Graduate on time (100% time)
Additional graduates (150% time)
200% time
Total graduates
Graduate in 8 yearsKey - Measuring time
100% time150% time200% time
Associate2 years3 years4 years
Bachelor’s4 years6 years8 years

Demand for postsecondary education has increased, and will continue to increase during and after the recovery.
Source: Anthony Carnevale’s analysis of March CPS data, various years; Center on Education and the Workforce forecast of educational demand to 2018, presented in The Recession: Accelerating the New Economy, September 2011.
1973 1992 2007 20180%
10%
20%
30%
40%
50%
60%
70%
80%
90%
100%
32%
10% 11% 10%
40%
34% 30% 28%
12%
8%10% 12%
9%
19% 21% 23%
7% 10% 11% 10%
19%17%
17%
Master's Degree or Better
Bachelor's Degree
Associate's Degree
Some College, No Degree
High School Graduates
High School Dropouts
Pe
rce
nta
ge
of W
ork
forc
eB
y e
du
catio
na
l le
vel
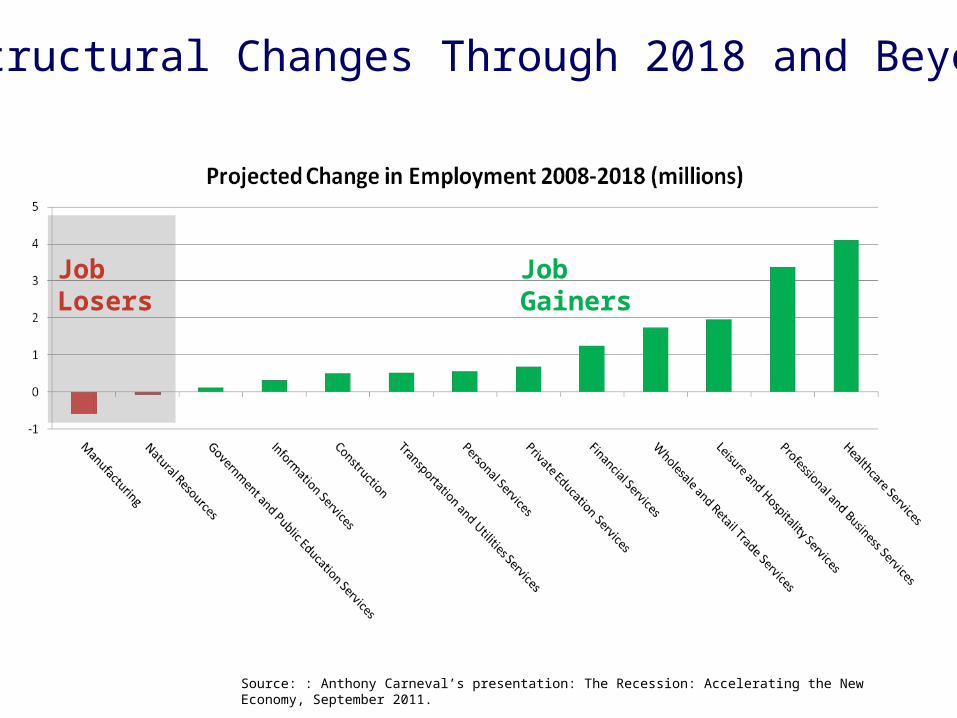
Job Losers Job Gainers
Structural Changes Through 2018 and Beyond
Source: : Anthony Carneval’s presentation: The Recession: Accelerating the New Economy, September 2011.

What Can We Do?
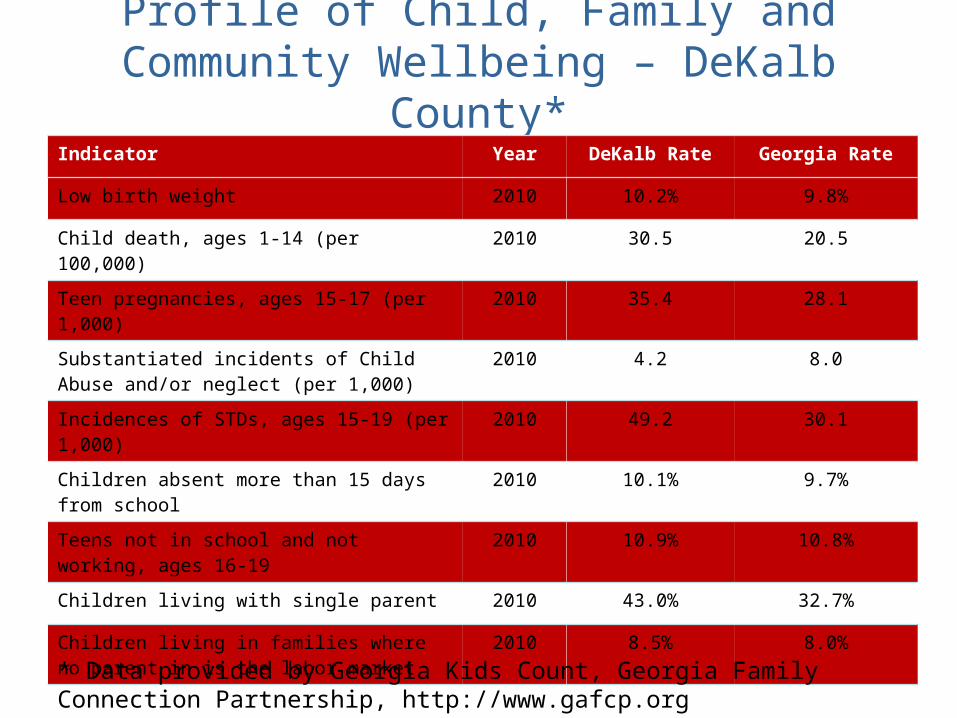
Profile of Child, Family and Community Wellbeing – DeKalb County*
Indicator Year DeKalb Rate Georgia Rate
Low birth weight 2010 10.2% 9.8%
Child death, ages 1-14 (per 100,000) 2010 30.5 20.5
Teen pregnancies, ages 15-17 (per 1,000) 2010 35.4 28.1
Substantiated incidents of Child Abuse and/or neglect (per 1,000)
2010 4.2 8.0
Incidences of STDs, ages 15-19 (per 1,000) 2010 49.2 30.1
Children absent more than 15 days from school 2010 10.1% 9.7%
Teens not in school and not working, ages 16-19
2010 10.9% 10.8%
Children living with single parent 2010 43.0% 32.7%
Children living in families where no parent in is the labor market
2010 8.5% 8.0%
* Data provided by Georgia Kids Count, Georgia Family Connection Partnership, http://www.gafcp.org
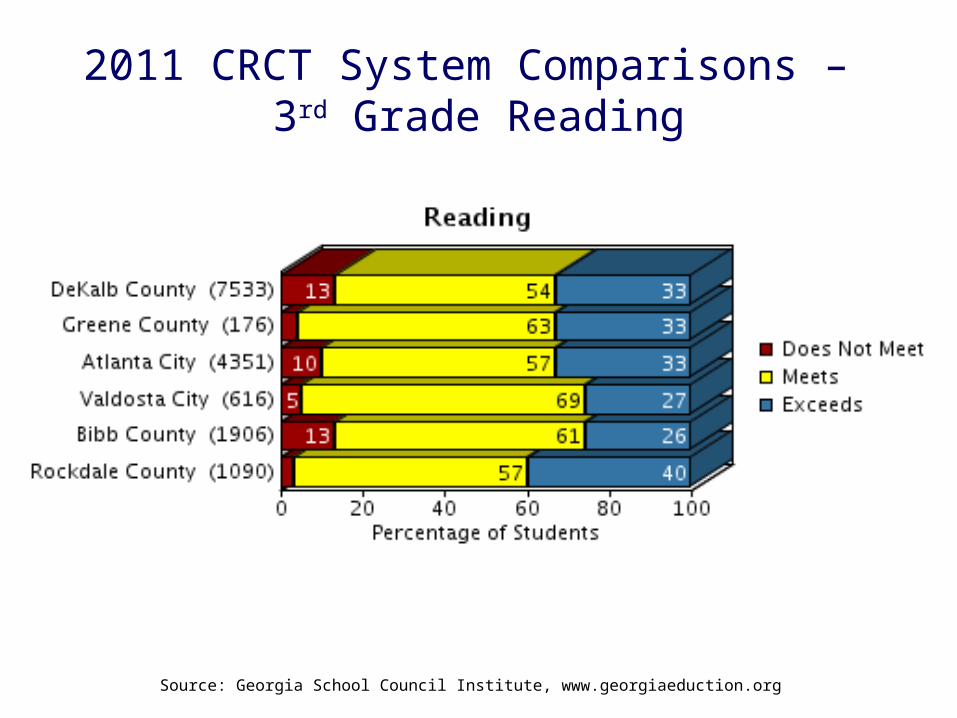
2011 CRCT System Comparisons – 3rd Grade Reading
Source: Georgia School Council Institute, www.georgiaeduction.org
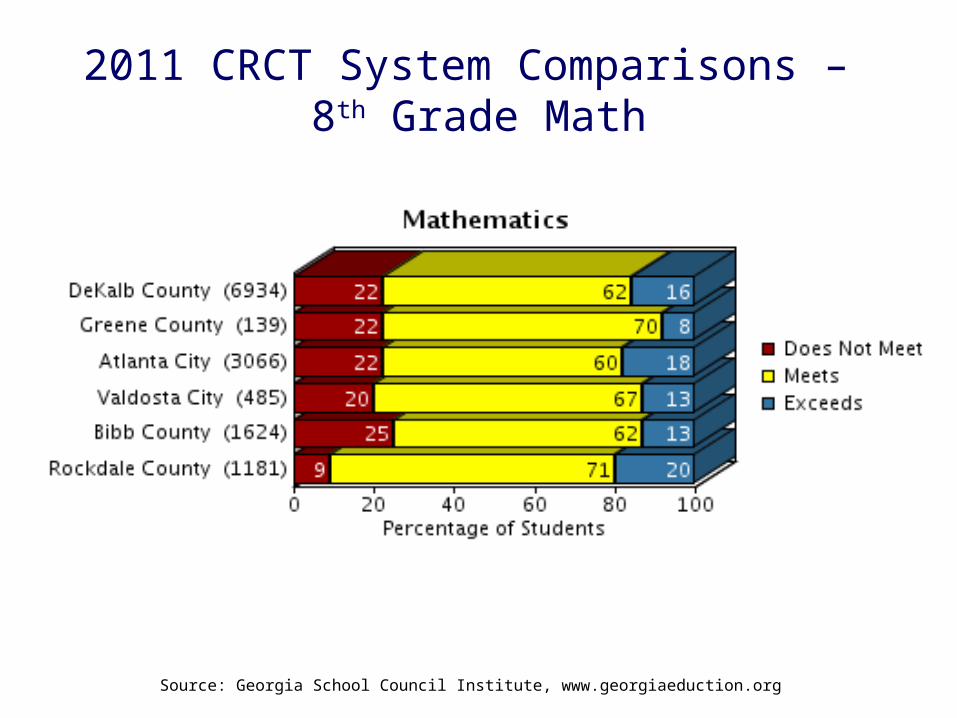
2011 CRCT System Comparisons – 8th Grade Math
Source: Georgia School Council Institute, www.georgiaeduction.org

2011 SAT System Comparisons
Source: Georgia School Council Institute, www.georgiaeduction.org
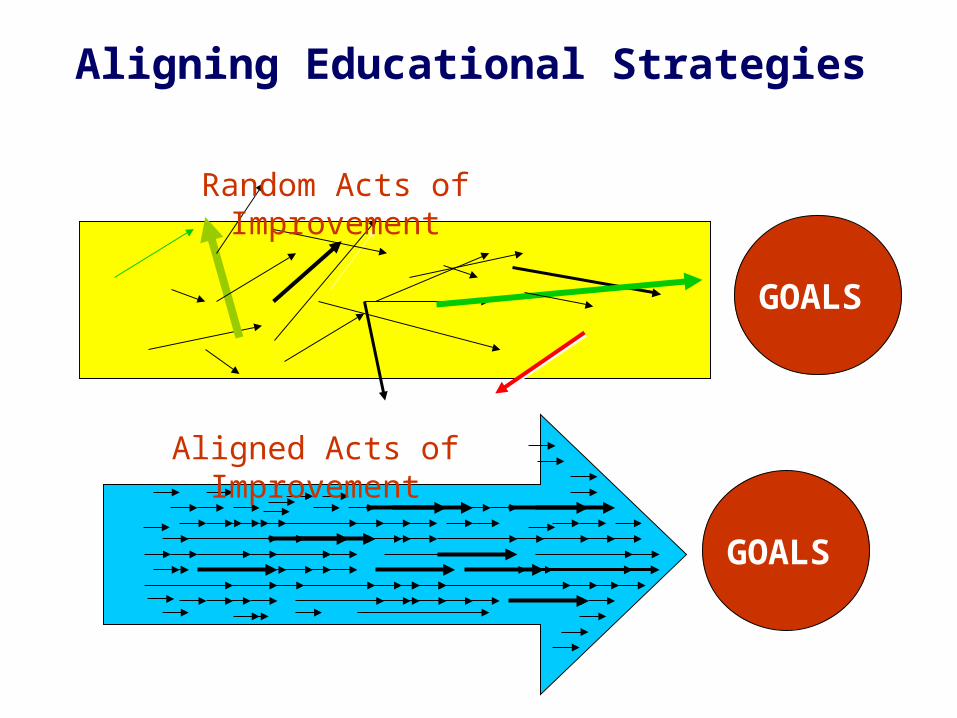
Aligning Educational Strategies
Aligned Acts of Improvement
Random Acts of Improvement
GOALS
GOALS
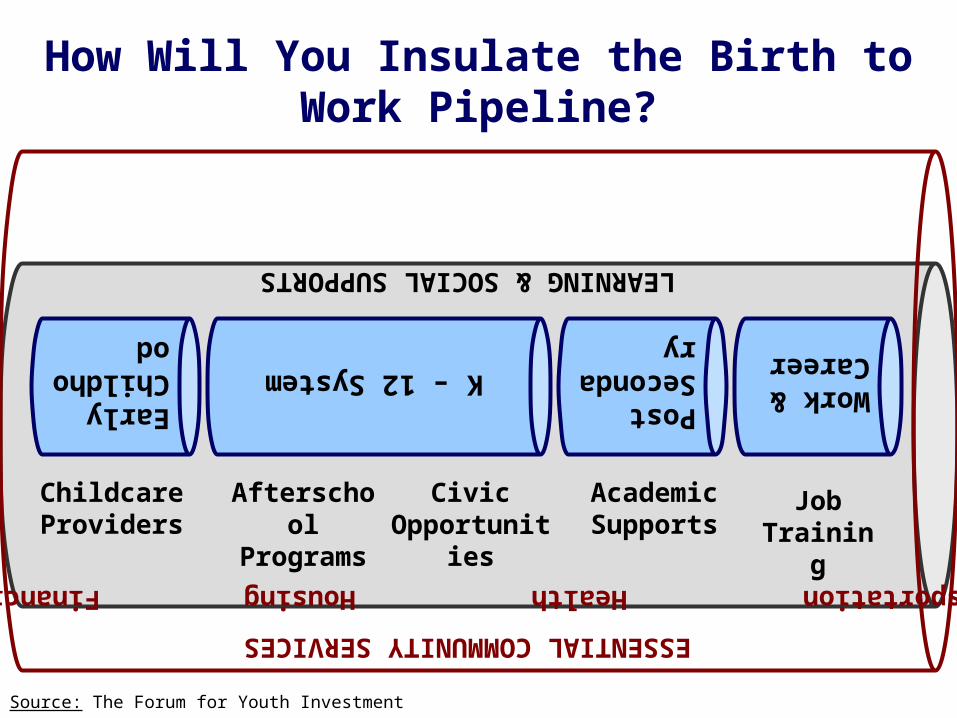
How Will You Insulate the Birth to Work Pipeline?
LEARNING & SOCIAL SUPPORTS
Childcare Providers
Afterschool Programs
Academic Supports
Job Training
Civic Opportunities
Early Childhood
K – 12 SystemPost Secondary
Work & Career
ESSENTIAL COMMUNITY SERVICES
Transportation Health Housing Financial
Source: The Forum for Youth Investment

Help Insulate the Pipeline
Post Secondary
Read to children everyday
Quality Rated: Encourage participation of your early learning centers
Read and mentor students
Volunteer with Junior Achievement
Participate in Friday Night /College Lights and/ or Apply to College Month
Support joint enrollment programs
Provide internships/ apprenticeships
Highlight need for certifications, 2-year degrees, and 4-year degrees
Early Childhood
K – 12 System

Georgia Partnership for Excellence In Education270 Peachtree Street, NW
Suite 2200Atlanta, GA 30303
404.223.2280www.gpee.org