delaware 2004 election resultselectionsncc.delaware.gov/2004g/2004_results_book.pdfnovember 2, 2004...
TRANSCRIPT

DELAWARE
2004 ELECTION RESULTS
November 2, 2004 2004 General Election Official Results 2
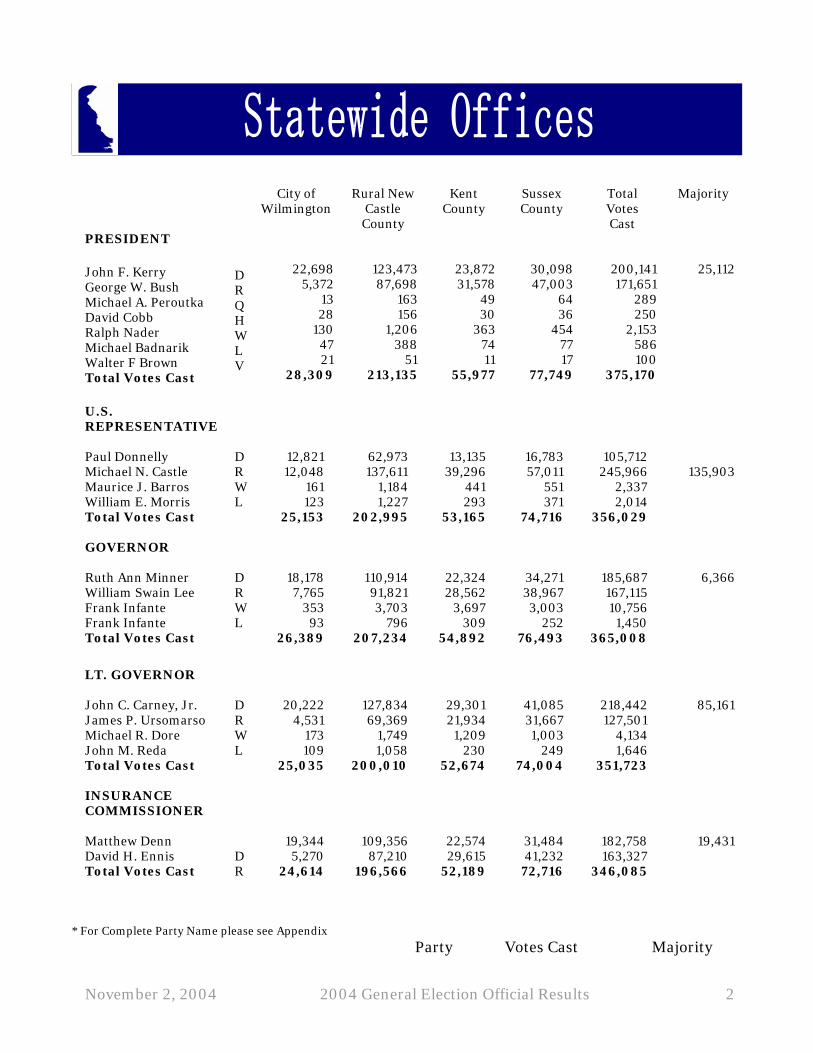
City of
Wilmington Rural New
Castle County
Kent County
Sussex County
Total Votes Cast
Majority
PRESIDENT John F. Kerry George W. Bush Michael A. Peroutka David Cobb Ralph Nader Michael Badnarik Walter F Brown Total Votes Cast U.S. REPRESENTATIVE
D R Q H W L V
22,698 5,372
13 28
130 47 21
28,309
123,473 87,698
163 156
1,206 388
51 213,135
23,872 31,578
49 30
363 74 11
55,977
30,098 47,003
64 36
454 77 17
77,749
200,141 171,651
289 250
2,153 586 100
375,170
25,112
Paul Donnelly D 12,821 62,973 13,135 16,783 105,712 Michael N. Castle R 12,048 137,611 39,296 57,011 245,966 135,903 Maurice J. Barros W 161 1,184 441 551 2,337 William E. Morris L 123 1,227 293 371 2,014 Total Votes Cast 25,153 202,995 53,165 74,716 356,029 GOVERNOR Ruth Ann Minner William Swain Lee Frank Infante Frank Infante Total Votes Cast
D R W L
18,178 7,765
353 93
26,389
110,914 91,821 3,703
796 207,234
22,324 28,562
3,697 309
54,892
34,271 38,967 3,003
252 76,493
185,687 167,115 10,756
1,450 365,008
6,366
LT. GOVERNOR John C. Carney, Jr. James P. Ursomarso Michael R. Dore John M. Reda Total Votes Cast INSURANCE COMMISSIONER Matthew Denn David H. Ennis Total Votes Cast
D R W L D R
20,222 4,531
173 109
25,035
19,344 5,270
24,614
127,834 69,369
1,749 1,058
200,010
109,356 87,210
196,566
29,301 21,934
1,209 230
52,674
22,574 29,615
52,189
41,085 31,667 1,003
249 74,004
31,484 41,232
72,716
218,442 127,501
4,134 1,646
351,723
182,758 163,327
346,085
85,161
19,431
* For Complete Party Name please see Appendix
Party Votes Cast Majority
November 2, 2004 2004 General Election Official Results 3
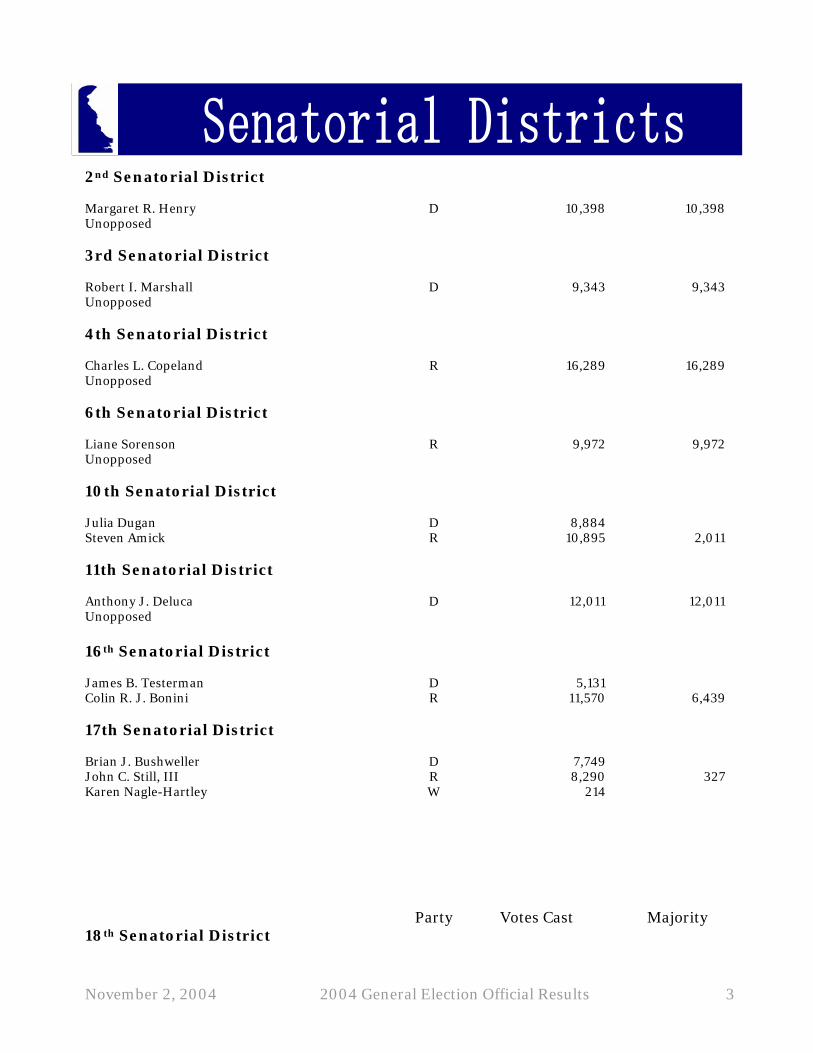
2nd Senatorial District
Margaret R. Henry D 10,398 10,398 Unopposed 3rd Senatorial District Robert I. Marshall D 9,343 9,343 Unopposed 4th Senatorial District Charles L. Copeland R 16,289 16,289 Unopposed 6th Senatorial District Liane Sorenson R 9,972 9,972 Unopposed 10th Senatorial District Julia Dugan D 8,884 Steven Amick R 10,895 2,011 11th Senatorial District Anthony J. Deluca D 12,011 12,011 Unopposed
16th Senatorial District
James B. Testerman D 5,131 Colin R. J. Bonini R 11,570 6,439 17th Senatorial District Brian J. Bushweller John C. Still, III
D R
7,749 8,290
327
Karen Nagle-Hartley W 214
Party Votes Cast Majority 18th Senatorial District

November 2, 2004 2004 General Election Official Results 4
Thomas F. Savage D 8,349 F. Gary Simpson R 14,392 6,043 21st Senatorial District Robert L. Venables, Sr. D 9,344 3,023 Daniel B. Short R 6,321

November 2, 2004 2004 General Election Official Results 5
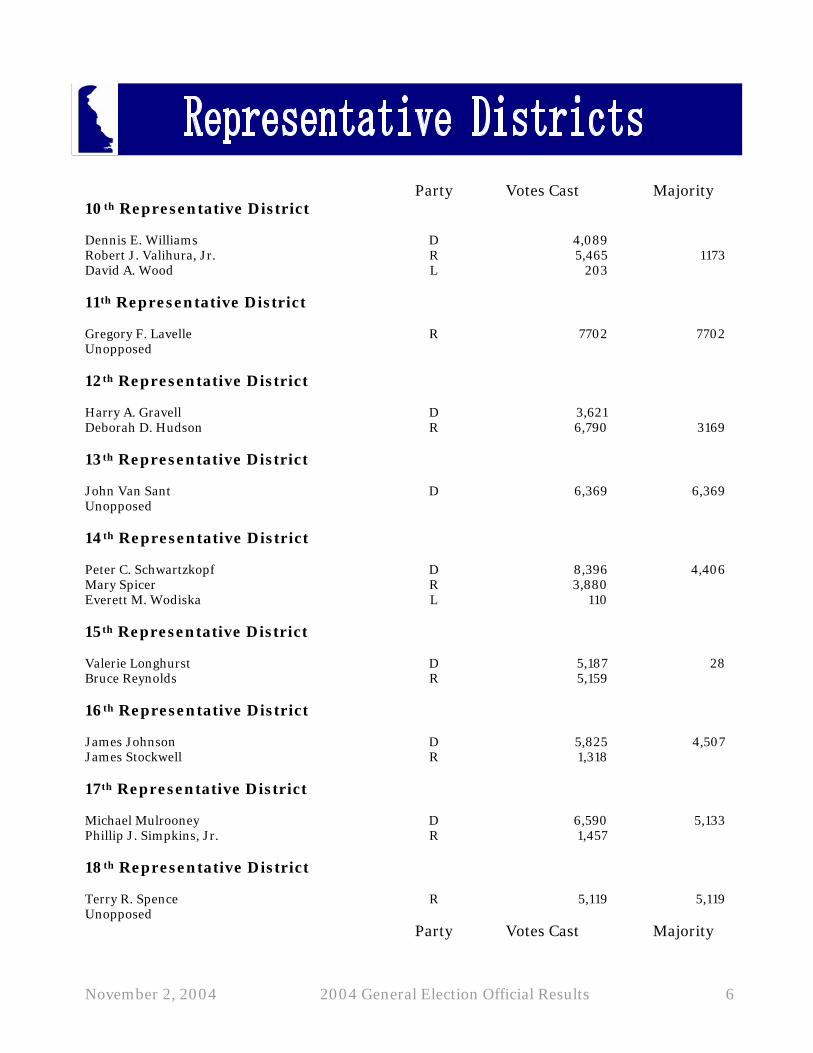
Party Votes Cast Majority 1st Representative District
Dennis P. Williams D 6,934 6,934 Unopposed 2nd Representative District Hazel D. Plant D 4,945 4,945 Unopposed 3rd Representative District Helene M. Keeley D 4,825 4,825 Unopposed 4th Representative District Campbell Hay D 4,026 Joseph G. Dipinto R 5,516 1,490 5th Representative District Melanie George D 6,102 6,102 Unopposed 6th Representative District Diana McWilliams D 5,377 510 Stacy Griggss R 4,867 7th Representative District Stephen P. Tanzer D 4,176 Wayne A. Smith R 6,539 2,277 James E. Larsen L 86 8th Representative District Bethany Hall-Long D 8,228 8,228 Unopposed 9th Representative District Vincent J. Ascione, Jr. D 4,154 Richard C. Cathcart R 7,500 3,346
November 2, 2004 2004 General Election Official Results 6
Party Votes Cast Majority 10th Representative District Dennis E. Williams D 4,089 Robert J. Valihura, Jr. R 5,465 1173 David A. Wood L 203 11th Representative District Gregory F. Lavelle R 7702 7702 Unopposed 12th Representative District Harry A. Gravell D 3,621 Deborah D. Hudson R 6,790 3169 13th Representative District John Van Sant D 6,369 6,369 Unopposed 14th Representative District Peter C. Schwartzkopf D 8,396 4,406 Mary Spicer R 3,880 Everett M. Wodiska L 110 15th Representative District Valerie Longhurst D 5,187 28 Bruce Reynolds R 5,159 16th Representative District James Johnson D 5,825 4,507 James Stockwell R 1,318 17th Representative District Michael Mulrooney D 6,590 5,133 Phillip J. Simpkins, Jr. R 1,457 18th Representative District Terry R. Spence R 5,119 5,119 Unopposed
Party Votes Cast Majority

November 2, 2004 2004 General Election Official Results 7
19th Representative District Robert F. Gilligan D 6,927 6,927 Unopposed 20th Representative District Roger P. Roy R 8,415 8,415 Unopposed 21st Representative District Elton Brewer D 2,994 Pamela S. Maier R 6,663 3,669 22nd Representative District Joseph E. Miro R 8,031 8,031 Unopposed 23rd Representative District Teresa Schooley D 4,531 Paul J. Pomeroy R 3,929 602 24th Representative District William A. Oberle, Jr. R 5,096 5,096 Unopposed 25th Representative District John Kowalko D 2,802 Stephanie A. Ulbrich R 3,914 1,112 26th Representative District John Viola D 6,255 6,255 Unopposed 27th Representative District Vincent A. LoFink R 6,216 6,216 Unopposed

November 2, 2004 2004 General Election Official Results 8
Party Votes Cast Majority
28th Representative District Bruce C. Ennis D 6,020 6,020 Unopposed 29th Representative District Rafael A. Zaragoza D 3,477 Pamela Thornburg R 5,086 1,609 30th Representative District Kimberly Zeitler Robbins D 3,192 William Robert Outten R 4,644 1,452 31st Representative District Nancy H. Wagner R 5,302 5,302 Unopposed 32nd Representative District John McNeal Jr. D 2,274 Donna Stone R 3,686 1,412 33rd Representative District G. Wallace Caulk, Jr. R 6,567 6,567 Unopposed 34th Representative District Gerald A. Buckworth R 6,677 6,677 Unopposed 35th Representative District Benjamin J. Ewing R 5,295 4,820 John T. Elliott L 475 36th Representative District Brian F. Dolan D 3,721 George V. Carey R 5,640 1,919

November 2, 2004 2004 General Election Official Results 9
Party Votes Cast Majority 37th Representative District
Nicholas J. Mirro D 2,352 Joseph W. Booth R 6,446 4,094 38th Representative District Shirley A. Price D 4,802 Gerald W. Hocker R 7,653 2,851 39th Representative District Thomas Joel Chapman D 2,926 Tina Fallon R 4,082 1,156 40th Representative District Clifford G. Lee R 6,500 6,500 Unopposed 41st Representative District Barbara A. Lifflander D 2,776 John C. Atkins R 6,444 3,668
November 2, 2004 2004 General Election Official Results 10
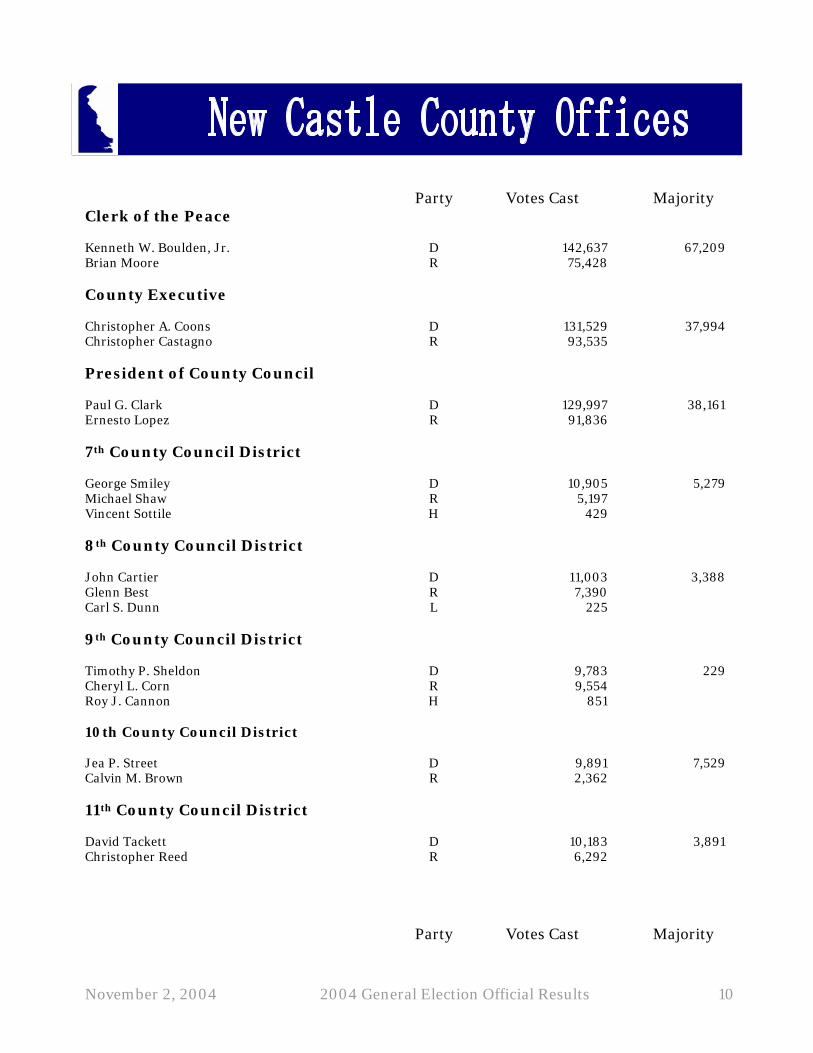
Party Votes Cast Majority
Clerk of the Peace
Kenneth W. Boulden, Jr. D 142,637 67,209 Brian Moore R 75,428 County Executive Christopher A. Coons D 131,529 37,994 Christopher Castagno R 93,535 President of County Council Paul G. Clark D 129,997 38,161 Ernesto Lopez R 91,836 7th County Council District George Smiley D 10,905 5,279 Michael Shaw R 5,197 Vincent Sottile H 429 8th County Council District John Cartier D 11,003 3,388 Glenn Best R 7,390 Carl S. Dunn L 225 9th County Council District Timothy P. Sheldon D 9,783 229 Cheryl L. Corn R 9,554 Roy J. Cannon H 851 10th County Council District Jea P. Street D 9,891 7,529 Calvin M. Brown R 2,362 11th County Council District David Tackett D 10,183 3,891 Christopher Reed R 6,292 Party Votes Cast Majority
November 2, 2004 2004 General Election Official Results 11
12th County Council District
William Bell D 13,654 4,839 Frederick W. Fitgerald R 8,815

November 2, 2004 2004 General Election Official Results 12
Party Votes Cast Majority
Mayor
James M. Baker D 19,091 11,894 Robert Bovell R 7,197 City Treasurer Henry W. Supinski D 21,411 21,411 Unopposed President of City Council Theodore Blunt D 22,299 22,299 Unopposed 1st City Council District Charles Potter, Jr. D 3,435 3,435 Unopposed 2nd City Council District Norman D. Griffiths D 3,267 3,016 Devon Hynson I 251 3rd City Council District Stephanie T. Bolden D 1,817 1,817 Unopposed 4th City Council District Hanifa Shabazz D 2,371 2,371 Unopposed
5th City Council District
Samuel Prado D 2,025 1,657 Dwight L. Davis R 368 6th City Council District Kevin F. Kelley, Sr. D 2,702 2,702 Unopposed

November 2, 2004 2004 General Election Official Results 13
* For Complete Party Name please see Appendix 1
Party Votes Cast Majority 7th City Council District Paul F. Ignudo, Jr. D 1,892 634 Daniel A. Burroughs R 1,258 8th City Council District Gerald L. Brady D 4,015 4,015 Unopposed City Council at Large * Top four are selected Charles Freel D 16,950 * Theopalis K. Gregory D 16,956 * Loretta Walsh D 18,906 * Michael A. Brown R 6,252 * Gary Linarducci R 5,769 John Atkeison H 1,428
Party Votes Cast Majority

November 2, 2004 2004 General Election Official Results 14
Clerk of the Peace Loretta M. Wootten D 26,500 651 Donald M. Dean R 25,849 Register of Wills Thomas E. Weyant D 28,272 4,534 Joan L. Bestpitch R 23,738 1st Levy Court District Brooks P. Banta D 6,233 2,187 Patrick W. Murray R 4,046 3rd Levy Court District Allan F. Angel D 5,291 5,291 Unopposed 5th Levy Court District Donald A. Blakey R 6,085 6,085 Unopposed Comptroller Margaret Ann Talley D 40,152 40,152 Unopposed

November 2, 2004 2004 General Election Official Results 15
Party Votes Cast Majority
Clerk of the Peace
Thelma D. Monroe D 32,093 George S. Parish R 40,099 7,286 John F. Potter L 720 1st County Council District Dale R. Dukes D 5,836 161 Michael H. Vincent R 5,549 Quentin A. Wilkerson W 126 2nd County Council District Finley B. Jones, Jr. D 16,888 1,989 Stella R. Reed R 4,899 3rd County Council District Lynn J. Rogers D 8,743 3 Judson A. Bennett R 8,740

November 2, 2004 2004 General Election Official Results 16
Rep.
District Kerry (D) Bush (R) Peroutka
(V) Cobb (H)
Nader (W)
Badnarik (L)
Brown (V)
01 7091 1121 2 12 27 12 4 02 5371 939 8 3 28 8 7 03 5239 847 1 5 35 5 5 04 6306 4055 5 10 58 27 5 05 5617 1890 9 2 24 11 2 06 6403 4281 9 6 75 22 4 07 6053 5014 8 11 82 39 3 08 5554 5205 9 5 43 26 2 09 6140 6121 4 10 43 15 2 10 5913 4460 7 8 45 24 2 11 6073 5152 8 13 65 31 1 12 5672 5371 8 6 66 21 2 13 5343 2680 9 8 60 11 2 14 5899 6750 4 2 55 13 4 15 6665 4142 4 7 43 16 6 16 6185 1402 11 5 39 5 6 17 5617 2839 6 6 62 8 3 18 5005 3016 5 3 52 13 2 19 5421 3478 13 2 62 7 20 5672 5762 5 13 53 17 3 21 5456 4626 10 11 69 18 1 22 5246 5543 6 14 53 16 23 5181 3538 8 10 74 16 3 24 4856 2781 2 5 35 13 4 25 4131 2785 7 5 73 28 26 5319 2563 3 1 35 13 2 27 5228 4093 9 3 49 14 1 28 3929 3662 4 3 38 12 1 29 3405 5326 5 1 61 14 1 30 2683 5267 11 3 59 17 4 31 4218 3702 7 7 48 9 4 32 2895 3243 6 6 50 7 1 33 3321 5372 9 3 59 8 34 3292 5437 10 7 48 9 35 2440 4581 18 4 49 14 4 36 3794 5763 5 3 59 8 3 37 3656 5396 5 8 64 5 3 38 4663 7876 5 8 50 12 2 39 2697 4454 6 1 44 7 40 2770 5333 6 8 54 11 1 41 3722 5785 12 2 65 4
TOTAL 200,141 171,651 289 250 2,153 586 100

November 2, 2004 2004 General Election Official Results 17
Representative District
Donnelly (D)
Castle (R)
Barros (W)
Morris (L)
01 4,171 3,098 57 33 02 3,275 2,194 27 20 03 3,154 2,007 40 26 04 2,719 7,070 53 68 05 3,724 3,263 48 45 06 3,081 7,114 55 71 07 2,613 8,009 61 92 08 3,056 7,140 52 64 09 3,095 8,566 66 49 10 3,013 6,806 44 73 11 2,587 8,187 46 91 12 2,302 8,334 39 67 13 2,806 4,818 48 28 14 3,195 8,862 66 42 15 3,927 6,297 53 33 16 4,164 2,771 49 16 17 3,137 4,849 43 37 18 2,862 4,699 55 55 19 2,780 5,681 41 43 20 2,184 8,830 59 62 21 2,324 7,344 61 66 22 2,092 8,304 56 60 23 2,302 6,036 78 66 24 2,603 4,495 53 51 25 2,199 4,353 44 58 26 3,204 4,144 51 39 27 2,735 6,080 78 47 28 2,275 4,827 56 42 29 1,909 6,404 77 49 30 1,571 6,027 67 44 31 2,179 5,236 48 31 32 1,631 4,152 51 25 33 1,780 6,490 78 55 34 1,709 6,570 67 54 35 1,491 5,179 73 49 36 2,077 7,089 67 52 37 1,879 6,852 62 50 38 2,823 9,056 89 47 39 1,334 5,539 41 37 40 1,615 6,227 52 36 41 2,135 6,967 86 41
TOTAL 105,712 245,966 2,337 2,014

November 2, 2004 2004 General Election Official Results 18
Representative District
Minner (D) Lee (R) Infante (W) Infante (L)
01 5,809 1,839 91 28 02 4,082 1,535 86 20 03 4,030 1,393 95 12 04 5,468 4,510 107 47 05 4,587 2,485 158 33 06 5,716 4,576 191 53 07 5,862 4,922 136 51 08 4,631 5,395 510 59 09 5,668 6,097 277 38 10 5,487 4,500 120 49 11 5,747 5,160 154 54 12 5,340 5,411 135 41 13 4,270 3,346 194 27 14 6,115 6,073 320 43 15 5,959 4,425 174 26 16 4,896 2,130 155 16 17 4,715 3,309 200 23 18 4,294 3,348 164 32 19 4,580 3,916 172 31 20 5,721 5,447 110 31 21 5,141 4,628 176 41 22 5,547 5,008 88 26 23 4,942 3,502 114 44 24 4,056 3,183 153 30 25 3,753 2,890 140 34 26 4,373 3,085 178 36 27 4,837 4,134 159 23 28 3,277 3,557 614 43 29 3,103 4,711 812 68 30 2,963 4,293 642 45 31 3,745 3,703 269 32 32 2,552 3,115 342 34 33 3,627 4,500 477 42 34 3,260 4,928 423 38 35 2,741 3,804 415 29 36 4,325 4,700 419 35 37 3,919 4,782 302 19 38 5,877 6,174 310 35 39 3,061 3,742 276 24 40 3,608 4,012 415 31 41 4,003 4,847 483 27
TOTAL 185,687 167,115 10,756 1,450

November 2, 2004 2004 General Election Official Results 19
Representative District
Carney (D) Ursomarso (R) Dore (W) Reda (L)
01 6,369 931 55 26 02 4,624 698 40 25 03 6,510 650 37 16 04 6,009 3,644 59 66 05 5,394 1,503 72 32 06 6,522 3,510 100 59 07 6,375 4,104 76 71 08 5,956 3,943 162 52 09 6,873 4,558 101 37 10 6,153 3,526 70 57 11 6,388 4,256 87 74 12 5,949 4,563 58 52 13 5,295 2,100 71 81 14 6,893 5,064 107 45 15 6,921 3,165 84 39 16 5,860 1,003 53 20 17 5,807 2,037 90 32 18 5,098 2,373 72 44 19 5,686 2,612 76 48 20 6,300 4,578 52 48 21 5,932 3,603 88 35 22 5,889 4,314 57 29 23 5,302 2,839 87 60 24 4,852 2,145 81 30 25 4,143 2,267 75 53 26 5,105 2,102 89 46 27 5,432 3,278 80 39 28 4,433 2,444 214 43 29 4,333 3,727 251 33 30 3,952 3,388 217 38 31 4,492 2,794 103 29 32 3,402 2,318 102 27 33 4,561 3,565 177 33 34 4,173 4,009 129 33 35 3,588 2,973 149 28 36 5,268 3,797 143 29 37 4,813 3,838 98 31 38 6,431 5,316 94 31 39 3,835 2,924 83 18 40 4,493 3,194 131 27 41 5,031 3,848 164 30
TOTAL 218,442 127,501 4,134 1,646

November 2, 2004 2004 General Election Official Results 20
Representative District
Denn (D) Ennis (R)
01 6,071 1,223 02 4,470 818 03 4,363 748 04 5,503 4,032 05 5,157 1,760 06 4,852 5,319 07 5,000 5,450 08 5,019 5,007 09 5,666 5,734 10 5,032 4,621 11 5,018 5,562 12 4,903 5,511 13 5,013 2,430 14 5,539 6,350 15 6,264 3,811 16 5,586 1,277 17 5,390 2,451 18 4,593 2,872 19 5,031 3,198 20 4,999 5,697 21 4,858 4,587 22 4,546 5,528 23 4,347 3,761 24 4,309 2,645 25 3,675 2,758 26 4,824 2,399 27 4,719 3,932 28 3,432 3,679 29 3,226 5,074 30 3,100 4,467 31 3,644 3,657 32 2,640 3,121 33 3,397 4,785 34 3,182 5,070 35 2,771 3,848 36 4,150 4,950 37 3,721 4,949 38 4,752 6,854 39 2,715 3,994 40 3,460 4,255 41 3,821 5,143
Total 182,758 163,327

November 2, 2004 2004 General Election Official Results 21
New Castle County Rep. District Election Districts Democrats Republicans Others Total
01 11 9,048 1,776 2,334 13,158 02 15 7,916 1,251 1,999 11,166 03 12 8,325 1,393 2,251 11,969 04 19 7,142 5,669 3,722 16,533 05 11 7,262 2,839 2,820 12,921 06 12 6,703 5,391 4,053 16,147 07 14 5,451 6,392 3,560 15,403 08 8 5,760 4,205 3,113 13,078 09 10 6,402 5,704 3,823 15,929 10 12 6,199 6,221 3,693 16,113 11 14 5,701 6,336 3,943 15,980 12 12 5,169 6,316 3,790 15,275 13 12 6,489 2,583 3,315 12,387 15 09 7,359 4,428 3,402 15,189 16 11 8,266 1,622 2,281 12,169 17 12 6,849 3,124 3,064 13,037 18 11 6,214 3,724 3,253 13,191 19 11 5,846 3,557 3,524 12,927 20 13 5,141 6,445 4,126 15,712 21 14 5,537 5,551 3,913 15,001 22 14 4,780 6,632 3,893 15,305 23 10 5,155 4,607 3,738 13,500 24 09 5,652 3,353 3,124 12,129 25 09 4,685 3,497 3,038 11,220 26 09 6,504 3,456 3,105 13,065 27 10 5,776 4,660 3,427 13,863
Total 304 165,331 110,732 86,304 362,367
Kent County 08 4 727 507 505 1,739 28 13 5,443 3,312 2,822 11,577 29 07 4,697 4,540 3,077 12,314 30 07 4,391 4,211 2,833 11,435 31 07 5,418 3,884 2,842 12,144 32 10 4,539 3,508 2,692 10,739 33 08 4,172 3,955 2,855 10,982 34 10 4,810 4,947 3,109 12,866
Total 66 34,197 28,864 20,735 83,796
Sussex County 14 07 6,559 6,752 3,599 16,910 30 01 98 156 81 335 33 02 576 704 440 1,720 35 07 4,445 3,961 2,298 10,704 36 08 5,399 4,832 3,020 13,251 37 08 4,706 4,859 2,728 12,293 38 08 6,371 7,203 3,045 16,619 39 07 4,159 4,179 2,149 10,487 40 07 5,171 4,573 2,418 12,162 41 10 5,714 5,229 2,605 13,548
Total 64 43,198 42,448 22,383 108,029 State Total 434 242,726 182,044 129,422 554,194

November 2, 2004 2004 General Election Official Results 22
Democrats Republicans Others Total Registered Voted % Registered Voted % Registered Voted % Registered Voted %
Under 21 7,849 4,909 63 4,558 3,095 68 4,770 2,978 62 17,177 10,982 64 21 & Over 233,150 159,590 68 176,952 123,321 70 123,705 75,684 61 533,807 358,595 67 21-29 31,704 17,448 55 20,678 11,361 55 23,858 11,815 50 76,240 40,624 53 30-39 44,451 26,285 59 37,201 21,746 58 27,440 12,849 50 109,092 61,880 57 40-49 51,579 35,732 69 40,497 28,616 71 25,461 15,847 62 117,537 80,195 68 50-59 43,934 33,667 77 30,069 23,473 78 21,049 15,154 72 95,052 72,294 76 60-65 16,203 12,805 79 12,536 10,221 82 7,251 5,523 76 35,990 28,549 79 65 & Over 45,279 33,653 74 35,971 27,904 78 18,646 13,496 72 99,896 75,053 75
County Eligible to Register
Actually Registered
Percent Registered
Actually Voted
Percent Eligible Voted
Percent Registered
Voted New Castle 386,457 362,367 94 % 241,444 62 % 66 %
Kent 98,154 83,796 85 % 55,977 57 % 67 % Sussex 117,955 108,031 91 % 77,749 66 % 72 % Totals 602,567 554,194 92% 375,170 62 % 68 %
1992 1994 1996 1998 2000 2002 2004 Democrats 148,453 150,559 177,759 196,131 214,515 224,042 242,726
Republicans 125,837 126,611 148,877 161,434 171,447 175,304 182,044 Others 67,658 70,952 93,088 109,790 117,710 120,318 129,422 Total 341,948 348,122 419,724 467,355 503,672 519,664 554,194
1992 1994 1996 1998 2000 2002 2004 Democrats 7,012 2,791 5,949 1,974 8,538 2,669 7,048
Republicans 2,173 899 1,739 903 2,743 3,240 7,602 Others 2,956 1,322 2,611 1,302 4,261 977 3,783 Total 12,141 5,012 10,299 4,179 15,548 6,886 18,433

November 2, 2004 2004 General Election Official Results 23
City of Wilmington
Rural New Castle
County
Kent County
Sussex County
Total Votes Cast
Majority
Governor David Charles Graham R 103 855 162 172 1,292 William Swain Lee R 596 8,071 1,892 4,711 15,270 8,870 Michael D. Protack R 115 2,597 1,140 1,256 5,108 Total Votes Cast 814 11,523 3,194 6,139 21,670 Insurance Commissioner
Matthew P. Denn D 4,346 10,908 1,549 1,633 18,436 5,073 Karen Weldin Stewart D 2,497 7,922 1,376 1,568 13,363 Total Votes Cast 6,843 18,830 2,925 3,201 31,799

November 2, 2004 2004 General Election Official Results 24
Votes Cast Majority 30th Representative District Robert E. Price Jr. D 477 Kimberly Zeitler Robbins D 504 27 36th Representative District Brian F. Dolan D 549 Deneen Louise Smith D 80 469 39th Representative District Thomas Joel Chapman D 239 Michael F. McGroerty D 153 86

November 2, 2004 2004 General Election Official Results 25
Votes Cast Majority County Executive
Christopher A. Coons D 17,584 8,752 Sherry Freebery D 4,702 Richard Korn D 4,130 President of County Council Paul G. Clark D 10,092 154 Penrose Hollins D 9,938 Dianne M. Kempski D 5,712 Gary Bowman R 4,686 Ernesto Lopez R 7,320 7th County Council District George Smiley D 1,387 Marlene Murphy White D 622 765 8th County Council District
John Cartier D 1,233 532 George Losse D 701 Glenn Best R 558 32 Robert J. Riley R 185 William Smith R 526 9th County Council District John D. Beidelman R 350 Cheryl L. Corn R 1,057 707 10th County Council District Mark A. Murowany D 1,081 Jea P. Street D 1,913 388 Gervasio Velazquez D 444 11th County Council District Richard Seefried D 260 David Tackett D 963 703

November 2, 2004 2004 General Election Official Results 26
Votes Cast Majority 12th County Council District William Bell D 1,660 James Buron D 661 623 Paul Morrill D 47 Laura Brown R 463 39 Frederick W. Fitzgerald R 502

November 2, 2004 2004 General Election Official Results 27
Votes Cast Majority City Council District 1 Charles Potter Jr. D 938 564 Marcus Wilson D 374 City Council District 3 Stephanie T. Bolden D 387 111 Robert E. Brown D 276 City Council District 4 Samuel L. Guy D 250 James Raymond Rhodes D 160 Hanifa Shabazz D 435 City Council District 5 Jerome Brown D 238 Samuel Prado D 487 249 City Council At Large Charles Freel D 3,598 Theopalis K. Gregory D 3,795 2 Michael J. Hare D 3,314 Loretta Walsh D 3,793 Daniel Young D 1,415

November 2, 2004 2004 General Election Official Results 28
Rep. District Dorsey (D) Finger (D) 1 2328 1658 2 1997 673 3 2083 714 4 1477 3106 5 1507 1042 6 1367 3357 7 1345 2669 8 1292 2579 9 1617 3456 10 1171 3935 11 1071 5213 12 1348 4817 13 1321 2183 14 1091 2536 15 1490 1817 16 1476 1669 17 1686 2729 18 1273 1847 19 1508 2769 20 1257 4042 21 1020 2990 22 1114 4233 23 1117 2786 24 1061 1703 25 978 2017 26 1523 2113 27 1694 3447 28 1220 2233 29 1150 2568 30 1103 2833 31 1271 2960 32 1174 2682 33 1261 3173 34 849 2674 35 1180 2926 36 1425 3684 37 2295 6133 38 2728 5800 39 991 3161 40 1186 3187 41 1401 3697
Total 57,446 119,811

November 2, 2004 2004 General Election Official Results 29
U.S. PRESIDENT NEW CASTLE COUNTY
ELECTION DISTRICT
NAME
TOTAL NUMBER OF
VOTES 01-10 No Entry 1 02-17 John McCain 1 03-01 John McCain 1 03-01 No Name 1 04-07 John McCain 1 04-11 Jareth 1 05-05 Nels Nelson 1 05-09 Jesus Christ 1 06-04 Dennis Kucinich 1 06-11 Jesse Jackson 1 06-11 Bob Dole 1 07-03 John McCain and Elizabeth Dole 1 07-12 Charcoal Poland 1 08-02 John McCain & Joseph R. Biden, Jr. 1 08-08 No Name 1 08-08 Al Gore 1 09-03 John McCain 2 09-06 Douglas S. Drews 1 09-07 Jeremy Andrew Hill & Amanda
Louise Vawter 1
09-08 Tom Samper 1 10-02 Ellen Bernhardt 1 10-02 Michael A. Peroutka 1 10-07 John McCain 1 11-04 Ingrid Luongo 1 12-05 No Name 1 12-06 John Cain 1 12-12 Colin Powell 1 13-08 Roger Claero 1 13-08 Roger Claero Aaron Hawkins 1 13-10 Rudy Giulliani 1 13-12 Blank 1 15-05 Hilary Clinton/ Joe Biden 1

November 2, 2004 2004 General Election Official Results 30
ELECTION DISTRICT
NAME
TOTAL
NUMBER OF VOTES
13-12 Blank 1 15-05 Hilary Clinton/ Joe Biden 1 15-09 Stephen Layton 1 17-04 John McCain 1 17-04 Smokey Robinson 1 17-09 Senator John McCain 1 18-01 No Name 1 18-04 James Dobson 1 18-04 Alan Keye’s 1 19-01 Wil(fuzbutt) Cat 1 19-01 Adolph Hitler 1 20-06 Kevin P. Birney 1 20-06 John McCain Senator- AZ 1 20-09 John McCain 1 20-10 None of the Above 1 21-01 Doug Narvel 1 21-03 Jason J. Gwynn 1 21-03 Blank 1 21-05 John McCain 1 21-08 Alfred E. Neuman 1 21-10 Senator Joseph Biden 1 22-09 John McCain 1 22-11 John McCain 1 23-01 Chanan Pinopusarek
Donovan McNabb 1
23-04 Jos. Lieberman 1 23-04 Roger Calero & Aaron Hankins 1 23-06 Jessy Ventura 1 23-08 Colin Powell 1 23-09 Herbert Weidinger 1 24-05 Arnold Schwarzenegger 1 25-01 Colin Powell 1 25-04 J. Hardwick 1

November 2, 2004 2004 General Election Official Results 31
ELECTION DISTRICT
NAME
TOTAL NUMBER OF
VOTES 25-07 No Entry 1 27-05 Giant Douche 1 27-06 Jesus Christ 1

November 2, 2004 2004 General Election Official Results 32
U.S. PRESIDENT KENT COUNTY
PRESIDENT SUSSEX COUNTY
ELECTION DISTRICT
NAME
TOTAL
NUMBER OF VOTES
09-08 Joe Biden 1 08-28 John Kerry 1 03-29 Joe Schrenec 1 06-30 Hillary Clinton 1 02-31 Jesus Christ 1 05-31 George W. Bush 1 01-32 Rush Limbaugh 1 01-32 Jibrael Garfield 1 01-32 Dr. Samuel Hoff 1 02-32 John McCain 1 04-34 Carlet Ward 1
ELECTION DISTRICT
NAME
TOTAL NUMBER OF
VOTES 02-41 Robert Hunter Orr 1 03-41 Turlington 1 04-41 Colin Powell 1

November 2, 2004 2004 General Election Official Results 33
Governor New Castle County
ELECTION DISTRICT
NAME
TOTAL NUMBER OF
VOTES
01-11 Pamela Swain 1 02-16 Karen Peterson 2 04-01 True Libertarian 1 04-04 James Nelson 1 04-04 Bush Chaney 1 05-01 Karen Peterson 1 06-11 Haneef Shabazz 1 07-03 Karen Peterson 1 08-08 William Kidwell 1 08-08 Henry Ridgely 1 09-09 William Kidwell 1 12-10 Larry Gropp 1 13-01 Paul J. Kania 1 13-10 Terry Spence 1 18-04 John C. Carney 1 18-04 Blank 1 18-07 Sharon Kaczowski 1 19-02 Karen E. Peterson 4 19-02 Shawn Yeisley 1 19-08 Jeffrey Seemans 1 20-10 Karen E. Peterson 2 21-05 Karen E. Peterson 1 22-07 Sharon Marson
Kaczolowski 1
23-04 MIF 1 26-07 Karen Peterson 1 27-07 Karen Peterson 1

November 2, 2004 2004 General Election Official Results 34
Governor
Kent County
ELECTION DISTRICT
NAME
TOTAL NUMBER OF
VOTES
02-28 Alan Mueller 1 05-28 Dave Beaver 1 03-29 Mike Proteck 1 06-30 Matthew Kersteter 1 02-31 Jesus Christ 1 04-31 Cheryl A. Biddle 1 05-31 Lee 1 07-31 David B. Carter 1 08-34 Eddy Seger 1
Lt. Governor New Castle County
ELECTION DISTRICT
NAME
TOTAL NUMBER OF
VOTES
02-02 Cary 1 04-04 Chris Martin 1 06-11 Todd Townsend 1 13-01 Maureen E. Kania 1 16-08 Rob Bowers 1 23-05 Timothy Conrad 1 23-07 Kyla Rafert 1 25-02 Christine Hermes 1 26-07 Rick Davis 1
November 2, 2004 2004 General Election Official Results 35
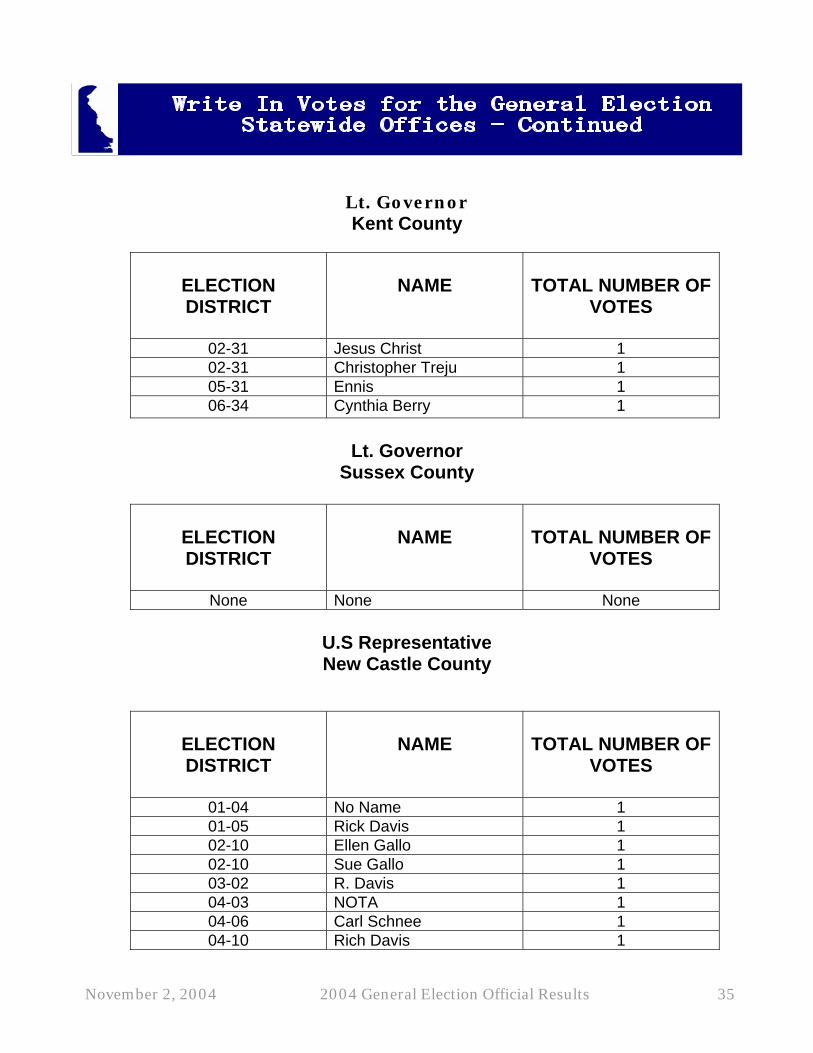
Lt. Governor Kent County
ELECTION DISTRICT
NAME
TOTAL NUMBER OF
VOTES
02-31 Jesus Christ 1 02-31 Christopher Treju 1 05-31 Ennis 1 06-34 Cynthia Berry 1
Lt. Governor
Sussex County
ELECTION DISTRICT
NAME
TOTAL NUMBER OF
VOTES
None None None
U.S Representative New Castle County
ELECTION DISTRICT
NAME
TOTAL NUMBER OF
VOTES
01-04 No Name 1 01-05 Rick Davis 1 02-10 Ellen Gallo 1 02-10 Sue Gallo 1 03-02 R. Davis 1 04-03 NOTA 1 04-06 Carl Schnee 1 04-10 Rich Davis 1

November 2, 2004 2004 General Election Official Results 36
ELECTION DISTRICT
NAME
TOTAL NUMBER OF
VOTES
05-06 Ray Clatworthy 1 06-04 Paul Soper 1 06-07 Ellen Gallo 2 06-11 Cr. Chris Bullock 1 06-11 Ellen Gallo 1 07-02 Ellen Gallo 1 07-14 Ellen Gallo for Life 1 08-02 Robert Biscaro 1 08-08 Bruce Ennis 1 09-02 No Name 1 09-04 W. Andrew Wessells 1 10-04 Glenn Beck 1 10-07 Rich Davis 1 11-03 Ellen Gallo 2 11-04 Ellen Gallo 4 11-06 Ellen Gallo 1 11-08 Ellen Gallo 2 11-08 Pro Life Party 1 11-09 Ellen Gallo 1 11-10 Ellen Gallo 2 11-12 Richard Davis 1 12-02 Ellen Gallo 2 12-04 Ellen Gallo 2 12-05 Ellen Gallo 1 16-05 Rich Davis 1 16-10 Newer 1 17-03 Rich Davis 2 18-01 No Name 1 18-01 Rick Davis 2 18-02 No Name 1 18-02 Rich Davis 3 18-09 Gallo Ellen? 1 19-01 Ellen Gallo 5 19-01 Ellen Shelley 1 19-03 Blank 1

November 2, 2004 2004 General Election Official Results 37
ELECTION DISTRICT
NAME
TOTAL NUMBER OF
VOTES
19-03 Ellen Gallo 2 19-04 R. Davis 1 19-07 Ellen Gallo 2 20-10 Rich Davis 1 20-13 Sean C. Kelly 1 21-02 Rich Davis 1 21-03 US Rep. Rich Davis 1 21-05 Steve Biener 1 21-05 Rich Davis 1 21-06 Richard Davis 1 21-06 Rich Davis 4 22-04 Ellen Gallo 1 22-05 Rich Davis 2 22-09 Rich Davis 1 22-11 Rich Davis 1 23-02 Rich Davis 1 23-08 Mike Keating 2 25-07 Charles Oberly 1 25-08 Richard Davis 1 25-08 Rich Davis 1 25-08 Mike Keating 1 25-09 Walt Janocha 1 27-07 Thomas Eichler 1 27-09 Mike Keating 1

November 2, 2004 2004 General Election Official Results 38
U.S. Representative Kent County
ELECTION DISTRICT
NAME
TOTAL NUMBER OF
VOTES
02-31 Jesus Christ 1 05-31 Castle 1 05-32 P. William Urth 1 05-33 Ulysses S. Grant 1 03-34 Skip Venable 1 06-34 Curtis A. Dotson 1 06-34 Mike Castle 1 06-34 Judas Russomano 1

November 2, 2004 2004 General Election Official Results 39
U.S Representative Sussex County
ELECTION DISTRICT
NAME
TOTAL NUMBER OF
VOTES
None None None
Insurance Commissioner
New Castle County
ELECTION DISTRICT
NAME
TOTAL NUMBER OF
VOTES
04-01 Libertarian 1 04-04 Mike Score 1 04-04 Carol Hunt 1 04-06 Adam Levine 1 06-04 Brian Levine 1 06-11 Diana L. McCoon 1 06-11 D. Jones Sutton 1 07-05 NOTA 1 11-10 Darryl K. Jones 1 13-01 Richard B. Davis 1 13-06 Blank 1 27-02 Sonrisa Lewis 1

November 2, 2004 2004 General Election Official Results 40
Insurance Commissioner Kent County
Insurance Commissioner Sussex County
ELECTION DISTRICT
NAME
TOTAL NUMBER OF
VOTES
05-28 Larry Sullivan 1 03-30 David Elliott 1 02-31 Jesus Christ 1 05-30 George Teague 1 05-31 Still 1 06-34 Kvn. Russomano 1
ELECTION DISTRICT
NAME
TOTAL NUMBER OF
VOTES
06-41 David Levinson 1

November 2, 2004 2004 General Election Official Results 41
Governor - Must be 30 years of age and a citizen and resident of the U.S. for 12 years; must have been a resident of Delaware six years prior to election, unless absent on public business of the U.S. or of the State. (Art. III, § 6 State Constitution) Lt. Governor - Same as above. (Art. III, § 19 State Constitution) U.S. Senator - Must have attained the age of 30; 9 years as a citizen of the U.S.; and a resident when chosen of the State he represents. (Art I, § 3 U.S. Constitution) U.S. House of Representatives - Must be at least 25 years of age; 7 years a citizen of the U.S.; and at the time of election an inhabitant of the State he represents. (Art I, § 3 U.S. Constitution) Attorney General - Must be a qualified elector at the time of his election. Insurance Commissioner - Must be a qualified elector at the time of his election. Auditor of Accounts - Must be a qualified elector at the time of his election. State Treasurer - Must be a qualified elector at the time of his election. State Senator - Must be 27 years of age and must have been a citizen and inhabitant of the State three years next preceding the day of his election and the last year of that term an inhabitant of the Senatorial District in which he shall be chosen, unless he shall have been absent on the public business of the U.S. or of this State. (Art. II, § 3 State Constitution) State Representative - Must be 24 years of age and must have been a citizen and inhabitant of the State three years next preceding the day of his election and the last year of that term an inhabitant of the Representative District in which he shall be chosen, unless he shall have been absent on the public business of the U.S. or of this State. (Art. II, § 3 State Constitution)

November 2, 2004 2004 General Election Official Results 42
New Castle County Executive - Shall be a citizen of the U.S. ; a qualified elector of New Castle county, and shall have been a resident of New Castle County for at least five years immediately preceding election; shall be no less than 27 years of age when elected to office. (9 Del. C. § 1112.) President of County Council - Shall be a citizen of the U.S. ; a qualified elector of New Castle County; shall be no less than 24 years of age when elected to office. (9 Del. C. § 1142, 1145.) County Councilman - Shall be a citizen of the U.S.; qualified elector of New Castle County; shall be a resident of the district from which he is elected for at least 1 year prior to election, and shall be no less than 24 years of age when elected to office. (9 Del. C. § 1142) Clerk of the Peace - Must be qualified to vote for a Representative in the General Assembly, and have been a resident of the County 1 year prior to election. (Art. III § 11 State Constitution) Register of Wills - Same as above. Recorder of Deeds - Same as above. Register of Chancery - Same as above. Sheriff - Same as above.

November 2, 2004 2004 General Election Official Results 43
Levy Court Commissioner - Must be a resident and freeholder of the Representative District in which he resides and a qualified elector. (9 Del. C. § 4103.) Clerk of the Peace - Must be qualified to vote for a Representative in the General Assembly, and have been a resident of the County 1 year prior to election. (Art. III, § 11 State Constitution) Register of Wills - Same as above. Recorder of Deeds - Same as above. Register of Chancery - Same as above. Receiver of Taxes and County Treasurer - Must be qualified to vote for a Representative in the General Assembly, and have been a resident of the County 1 year prior to election. (Art. III, § 11 State Constitution, 9 Del. C. § 8401.) County Comptroller - Must be qualified to vote for a Representative in the General Assembly, and be a resident and freeholder in the County for which he is comptroller. (Art. III, § 11 State Constitution, 9 Del. C. § 9301.) Sheriff - Must be qualified to vote for a Representative in the General Assembly, and have been a resident of the County 1 year prior to election. (Art. III, § 11 State Constitution)

November 2, 2004 2004 General Election Official Results 44
County Councilman - Must be a citizen of the U.S.; a qualified elector of Sussex County and a resident of the district from which he is elected 1 year prior to election. (9 Del. C. § 7002.) Clerk of the Peace - Must be qualified to vote for a Representative in the General Assembly, and have been a resident of the County 1 year prior to election. (Art III, § 11 State Constitution) Register of Wills - Same as above. Recorder of Deeds - Same as above. Register of Chancery - Same as above. Sheriff - Same as above.

November 2, 2004 2004 General Election Official Results 45
Mayor - Must be a resident of the city for at least 2 years preceding election and shall be at least 30 years of age at the time of election, and remain a resident during term of office. (Section 3-300, City of Wilmington Charter) City Councilman - Must be a citizen of the U.S. and shall be a qualified elector of the city a least 1 year prior to election; shall hold no other city office or employment while elected to City Council; shall no be less than 25 years of age when elected to office; shall remain a resident of the district during term of office. (Section 2-103, City of Wilmington Charter) City Councilman At Large - Must be a citizen of the U.S. and shall be a qualified elector of the city at least 1 year prior to election; shall hold no other office or employment while elected to City Council; shall not be less than 25 years of age when elected to office. (Section 2-103, City of Wilmington Charter) President of City Council - Same as above. City Treasurer - Must be a citizen of the U.S. and resident of the city at the time of election and remain such during term of office. (Section 2-103, City of Wilmington Charter)

November 2, 2004 2004 General Election Official Results 46
Party Name Code Democrat D Libertarian Party L Republican Party R US Taxpayers Party U Natural Law Party V