delay-based congestion avoidance for tcp - networking, ieee/acm
TRANSCRIPT
356 IEEE/ACM TRANSACTIONS ON NETWORKING, VOL. 11, NO. 3, JUNE 2003
Delay-Based Congestion Avoidance for TCPJim Martin, Member, IEEE, Arne Nilsson, Member, IEEE, and Injong Rhee, Senior Member, IEEE
Abstract—The set of TCP congestion control algorithmsassociated with TCP/Reno (e.g., slow-start and congestion avoid-ance) have been crucial to ensuring the stability of the Internet.Algorithms such as TCP/NewReno (which has been deployed)and TCP/Vegas (which has not been deployed) represent incre-mentally deployable enhancements to TCP as they have beenshown to improve a TCP connection’s throughput without de-grading performance to competing flows. Our research focuseson delay-based congestion avoidance algorithms (DCA), likeTCP/Vegas, which attempt to utilize the congestion informationcontained in packet round-trip time (RTT) samples. Throughmeasurement and simulation, we show evidence suggesting thata single deployment of DCA (i.e., a TCP connection enhancedwith a DCA algorithm) is not a viable enhancement to TCP overhigh-speed paths. We define several performance metrics thatquantify the level of correlation between packet loss and RTT.Based on our measurement analysis we find that although there isuseful congestion information contained within RTT samples, thelevel of correlation between an increase in RTT and packet lossis not strong enough to allow a TCP/Sender to reliably improvethroughput. While DCA is able to reduce the packet loss rateexperienced by a connection, in its attempts to avoid packet loss,the algorithm will react unnecessarily to RTT variation that is notassociated with packet loss. The result is degraded throughput ascompared to a similar flow that does not support DCA.
Index Terms—TCP congestion control, delay-based congestionavoidance (DCA), TCP/Vegas, loss and round-trip time (RTT) cor-relation patterns.
I. INTRODUCTION
T HE foundation of TCP’s congestion control is the principleof conservation of packets [1]. New packets are admitted
into the network as packets are confirmed to be removedfrom the network via the arrival of acknowledgments (ACKs).Other aspects of TCP’s congestion control include the slow-startand the congestion avoidance algorithms which utilize packetloss as an indicator of network congestion [2], [3]. As TCPwas designed for a best-effort packet switched network, evenmoderate levels of packet loss are acceptable. However, pathsover the Internet can experience very high packet loss rates,well beyond the optimal operating range of TCP. Improvementssuch as TCP/NewReno and TCP/SACK have been deployedto enhance the efficiency of TCP’s loss recovery [4], [5]. Thelimited transmit enhancement is a further proposed incremental
Manuscript received February 6, 2000; revised October 15, 2002; approvedby IEEE/ACM TRANSACTIONS ONNETWORKING Editor C. Diot.
J. Martin is with the Department of Computer Science, Clemson University,Clemson, SC 29634-0974 USA (e-mail: [email protected]).
A. A. Nilsson is with the Department of Electrical and Computer Engi-neering, North Carolina State University, Raleigh, NC 27695-7914 USA(e-mail: [email protected]).
I. Rhee is with the Department of Computer Science, North Carolina StateUniversity, Raleigh, NC 27695-7534 USA (e-mail: [email protected]).
Digital Object Identifier 10.1109/TNET.2003.813038
enhancement for TCP [6]. While these algorithms can improveTCP throughput by reducing the frequency of TCP timeouts,they still rely on packet loss as an implicit congestion signal.
An alternative congestion control technique for TCP,one which is preventive rather than reactive, is end-to-enddelay-based congestion avoidance algorithms (DCA). Orig-inally described by Jain [7], DCA is best represented byTCP/Vegas and Dual [8], [9]. DCA algorithms monitor packetround-trip times (RTTs) and react to increases in RTT inan attempt to avoid network congestion before it becomessignificant. Previous studies of TCP/Vegas have shown that thealgorithm increases TCP throughput by reducing the frequencyof packet loss and timeouts. Furthermore, the improvementdoes not come at the expense of competing TCP flows. BecauseVegas provides a benefit with a single deployment and becausethe algorithm operates at the TCP/Sender, one can argue thatVegas is a viable incrementally deployable improvement toTCP.
Previous studies of DCA have concentrated either on low-speed networks or on networks where DCA flows consume asignificant percentage of the total traffic [10]–[12]. In this paper,we focus on the performance of DCA algorithms in a high-speed network where DCA flows constitute only a fraction ofthe total traffic. Further, our goal is to utilize a methodologysuch that the conclusions we derive can be generalized to anyDCA algorithm.
Any change proposed for a mature and widely deployed pro-tocol such as TCP will be met with much resistance. Alternativecongestion control algorithms must be TCP-compatible, whichmeans that they must result in the same throughput as achievedby a similarly situated host (i.e., over the same path with thesame TCP parameters) [13]. An incremental enhancement toTCP that meets the following requirements will have the bestchance for deployment.
• It must improve the throughput of the TCP connection thatemploys the enhancement.
• It must not reduce the performance of other competingTCP flows on the same path where the “enhanced” TCPflow travels. The objective is to make better use of avail-able bandwidth without penalizing other TCP flows.
• Ideally, it requires changes only to a TCP sender.Furthermore, the above properties must hold regardless of the
number of “enhanced” TCP flows on the same end-to-end path.This implies that the properties must hold even if there is onlyone “enhanced” flow in the path. In today’s Internet, to sup-port a wide deployment of TCP enhancements, there must existsufficient economic incentives for adopting them. When theseincentives are weak or even if they result in temporary sacri-fice of resources for users at least for a while before its widerdeployment, the eventual wide deployment of such protocols
1063-6692/03$17.00 © 2003 IEEE
MARTIN et al.: DELAY-BASED CONGESTION AVOIDANCE FOR TCP 357
becomes unlikely. Therefore, our research assesses the benefitsassociated with the incremental deployment of DCA where the“enhanced” flows constitute only a fraction of the total traffic inthe bottleneck link.
The following describes the attributes of DCA.
• DCA augments the TCP/Reno protocol.• DCA monitors TCP packet RTTs, allowing the algorithm
to reside entirely within the TCP sender.• RTT variations are assumed to be caused by changes in
queueing delays experienced by packets being timed.• Based on RTT variations, DCA makes congestion deci-
sions that reduce the transmission rate by some percentageby adjusting the TCP congestion window (cwnd).
We limit the scope of our study of DCA to Internet environ-ments where the lowest link capacity along the path is 10 Mb/s.Measurement studies have shown that Internet backboneswitches, many of which now support multigigabit link speeds,are subject to tens or even hundreds of thousands of low-band-width ON/OFF TCP flows [14]–[16]. One recent measurementstudy of a tier one provider’s backbone network found thatin the worst case, there are on the order of 30 000 flows per100 Mb/s of traffic [17]. Thus, we study the performance ofDCA under realistic Internet environments where thousands ofTCP flows may come and go over short time periods.
In this paper, we present evidence suggesting that RTT-basedcongestion avoidance may not be reliably incrementallydeployed over high-speed Internet paths. Based on a measure-ment study conducted in 1999 over seven high-speed Internetpaths, we find that congestion information contained in TCPRTT samples cannot be reliably used to predict packet loss.1
The success of DCA highly depends on a strong correlationbetween packet loss events and increases in RTT prior to theloss. By tracing TCP connections along each path, we are ableto extract a time series of packet RTTs along with an indicationof packet loss events. Depending on the path, we find that only7%–18% (on average) of observed loss events were precededby a significant increase in RTT. With the data, we are ableto evaluate the ability of a DCA algorithm to “predict” a lossevent based on an observed increase in packet RTT. Even ifwe assume that every loss predicted by DCA is avoided, ouranalysis indicates that noise in RTT samples leads to degradedthroughput by guiding TCP to reduce at wrong times (whenthere is no loss). We modify an analytic TCP throughput modelgiven by Padhyeet al. [18] to assess the impact of DCA’scongestion reactions (both right and wrong ones) [19]. Basedon measured data, the throughput model predicts that DCAwould degrade TCP throughput in the range of 7%–58%.
We conjecture that the level of correlation between packetloss and TCP RTT samples is weak due to the following reasons.
1) A TCP constrained RTT congestion probe is too coarseto accurately track the bursty congestion associated withpacket loss over high-speed paths.
2) A DCA algorithm cannot reliably assess the conges-tion level at the router. Short-term queue fluctuationswhich are not associated with loss at a router, persis-
1Even though the measurement data was collected in 1999, we believe that theobserved dynamics are still representative of current public Internet behavior.
tent queueing, and congestion at multiple bottlenecks(especially when the congested routers are provisioneddifferently) make it difficult for a DCA algorithm tomake accurate congestion decisions.
To verify this conjecture, we must be able to observe thequeue levels at the bottleneck links over the path. We resort tosimulation using the ns simulation tool [20]. We construct twons models that emulate the end-to-end traffic characteristics oftwo of the seven Internet paths being measured. These modelsclosely match the loss behaviors and burstiness of RTT varia-tions of the two paths. Under these models, we confirm the re-sult we found from the Internet measurement data: a DCA flowsuffers from throughput degradation.
This paper is organized as follows. First, we overview relatedwork in Section II. Then we present the measurement analysisand throughput analysis followed by the simulation analysis inSections III and IV. We end the paper with conclusions and adiscussion of future work in Sections V and VI.
II. RELATED WORK
Jain first coined the termdelay-based congestion avoidancein [7]. While Jain admits that his proposed algorithm was notsufficient for a practical network, his work provided the foun-dation for future research of DCA. The work described in [8]and [21] shows that TCP/Vegas can improve TCP throughputover the Internet by avoiding packet loss. However, these studieswere based on Internet paths that existed in the early 1990swhich generally involved at least one T1 speed link and con-sequently allows any given flow to consume a significant frac-tion of available bandwidth. These studies also did not isolatethe impact of the congestion avoidance algorithm (i.e., CAM)from the non-DCA aspects of Vegas (i.e., the loss recovery en-hancement). More recent studies, however, have recognized thatVegas has several very different algorithms and that the conges-tion avoidance algorithm must be studied independently [11],[10]. The work in [10] correctly points out that the benefit asso-ciated with the original Vegas algorithm is in fact due to the en-hanced loss recovery algorithms rather than the Vegas DCA al-gorithm. However, [11] also points out that the Vegas enhancedrecovery algorithm was designed to be more aggressive thanReno and that the congestion avoidance algorithm was designedto compensate to reduce loss (by being less aggressive in thesending rate increase) to provide a balance. While the work of[11] is an interesting analysis of the Vegas DCA algorithm froma “global network” perspective, it is very different from our “in-cremental enhancement” analysis of DCA.
A key aspect of our research focuses on assessing the abilityof a TCP constrained RTT-based congestion sampling algo-rithm in predicting future packet loss events. Several previousstudies are relevant [22]–[25]. End-to-end packet delay andloss behavior over the Internet was studied in [22] and [24]. Acommon result was that packet loss events were observed to becorrelated over timescales of up to 200 ms. The work in [25]found loss correlation up to timescales of 1 s. However, theauthors did not focus on the correlation between an increase inRTT with packet loss. Moonet al. did look at the correlationthat exists between a loss conditioned delay (i.e., a packetdelay immediately preceding a loss event) and packet loss.Their motivations were similar to ours in that they wanted
358 IEEE/ACM TRANSACTIONS ON NETWORKING, VOL. 11, NO. 3, JUNE 2003
to see if an endpoint could predict loss. They found a higherlevel of correlation than we did. There are several differences.First, the method used by [23] utilized a finer-grained one-waydelay-based UDP-based probe technique as opposed to a TCPconstrained probe process. Second, and more significantly, wewere interested in the “usable” level of correlation. In otherwords, we measured the relative increase in RTT that occursprior to the transmission of the segment that is eventuallydropped. If we were to consider the increase in RTT associatedwith segments that surround the segment that gets dropped,we would see a moderate increase in the observed correlation.However, this implicit congestion signal would not arrive intime to prevent the TCP sender from transmitting the soon-to-bedropped segment. Paxson [26] also looked at the correlationbetween one-way packet delay variation and loss. He con-cluded that loss is weakly correlated to rises in packet delayand conjectured that the linkage between the two is weakenedby routers with large buffer space and because the end-to-enddelay reflects the accruing of a number of smaller variationsinto a single, considerably larger, variation. Our measurementresults support this conjecture, but we believe that anotherfactor is that the delay variation associated with loss is bursty(in the milliseconds to several hundreds of milliseconds range)which makes it difficult to accurately assess the fine-grainedcorrelation that exists between latency and loss events.
More recent work based on measurements from the NIMIinfrastructure focuses on assessing the “constancy” of lossand delay over a variety of paths [27]. The authors extendthe findings of [22] and [25] by observing that much of thecorrelation in the loss process comes from back-to-back lossepisodes as opposed to a series of nearby losses. The authorsconclude that congestion epochs associated with loss are actuallyspikes with of timescales of roughly 200 ms or shorter. Arecent measurement study of low-speed streaming flows overthe Internet led the authors to conjecture that the loss processassociated with congested Internet routers might be less than3 ms [28]. This was based on a relatively large number ofobserved single loss events (as opposed to bursts) for traffic witha peak burst rate metered by a T1 speed link. Our data shows thatthe congestion epochs are complex processes that incorporatetimescales spanning very long (hours), medium (minutes), andvery brief (milliseconds) amounts of time. Further, we saw thatmore than one congestion process might be active at any giventime. This behavior is nicely described in [29], postulating thattraffic arrival processes have “spikes (that) ride on ripples thatride on still longer term swells .” Based on our measurements,we observed that the magnitude of congestion epochs variestremendously and, further, that loss is almost equally as likelyduring any level of congestion epoch. This can be explained ifwe assume that over the observation period (one week), a pathexperienced congestion at more than one location and, further,if we assume that a path might periodically experience multiplebottlenecks at a given time. However, if we examine specificloss events, we find that the RTT increase surrounding loss isusually short lived, which confirms the findings of [27] whichstate that “loss processes are better thought of as spikes duringwhich there is a short-term outage, rather than epochs overwhich congested router’s buffer remains perilously full.” Thisresult is in fact fundamental to our analysis and subsequent
conclusion that DCA is not able to improve TCP performanceand is therefore not incrementally deployable.
In addition to TCP congestion control issues, the Internetresearch community has also been vigorously exploring thedevelopment and deployment of TCP-friendly algorithmsfor real-time streaming applications. Such algorithms canbe TCP equivalent if they use additive-increase/multiplica-tive-decrease (AIMD) behavior with the same parameters asTCP [13]. TCP-friendly algorithms can be further classifiedbased on steady-state or dynamic behavior. For example, theTCP-friendly rate control (TFRC) algorithm is an example of aslowly responsivealgorithm that reacts to a single packet losswith a send rate reduction smaller than TCP [30]. TCP-friendlyalgorithms strive to beTCP compatibleby emulating TCP’sbehavior (i.e., slow start, congestion avoidance, exponentialtimeout backoff, and even self-clocking). Rate-based protocolsthat adjust their rates based on a computation will generallyinclude a measured RTT primarily to add an element ofdelay-based congestion avoidance to the algorithm [30]–[32].Although different from our notion of DCA (i.e., as an incre-mental enhancement to TCP) and while primarily an artifact ofbeing TCP compatible, these algorithms assume that implicitcongestion feedback based on delay rather than packet loss (orrather, supplemental to packet loss) can offer global networkimprovements as long as the majority of traffic performs thesame algorithm. The benefit is the same as what drives thealternative best effort (ABE) initiative, namely a network thatprovides a service that strives for lower delay possibly at thecost of reduced throughput [33]. This service would be usefulfor multimedia applications with strict delay requirements.
III. M EASUREMENTANALYSIS
The objective of the measurement analysis is to show that anincrease in a per packet RTT sample (i.e., thetcpRTTsamples) isnot a reliable indicator of future packet loss events and cannot beused to improve TCP throughput. To show this, we trace manyTCP connections over different paths. We then post-process thetrace files to extract thetcpRTTtime series (along with the lossindication) associated with each traced connection. This data isthe basis of our analysis presented below.
A. Data Collection Methodology
We selected seven high-speed Internet paths. Each path con-sists of many hops (at least 11) with a minimum link capacityof 10 Mb/s. The sender of each TCP connection is a host lo-cated on the campus of North Carolina State University; eachof the seven receivers is located over the Internet. We run a bulkmode TCP application between the host and each destination.The TCP sender in our experiments as well as the trace point(we usetcpdump[2] to trace the TCP connection) is a 333-MHzPC running freeBSD. The machine is equipped with a 3COMPCI Ethernet adapter and is attached to a campus network via a10-Mb/s ethernet connection.
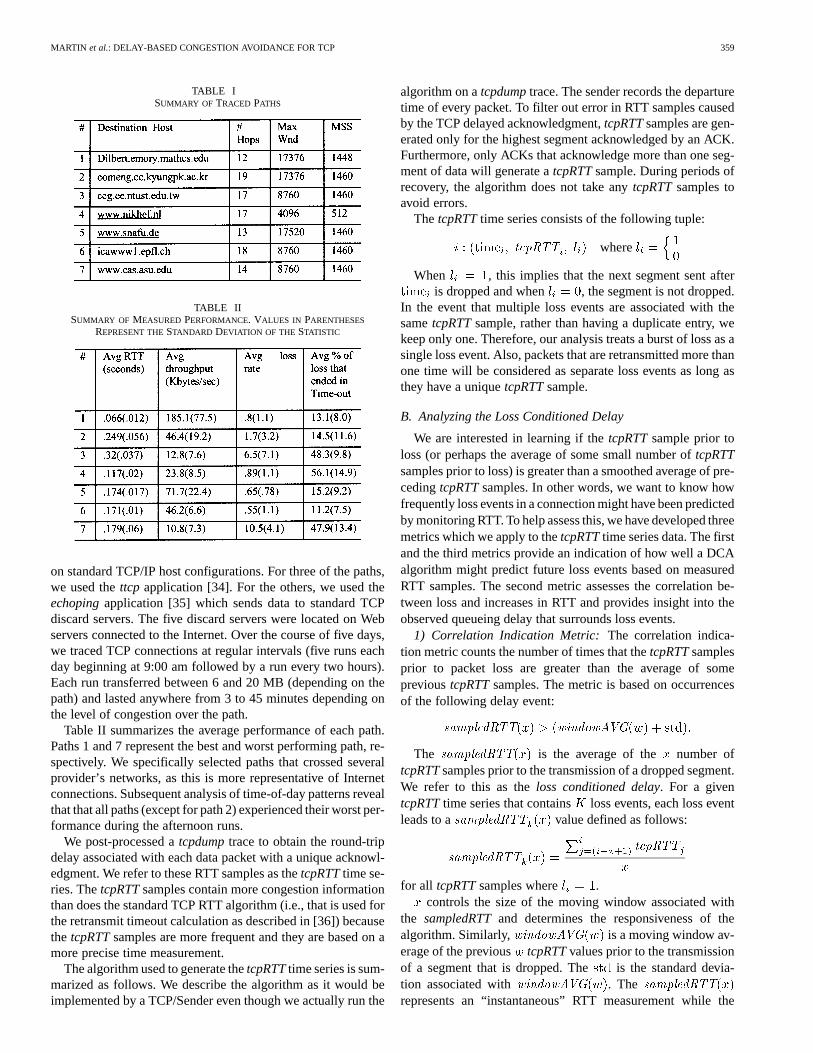
Table I describes each of the seven paths. Of the seven paths,five are located outside of North America. We did not modifythe window size associated with each receiver as we want toevaluate the feasibility of an incremental deployment of DCA
MARTIN et al.: DELAY-BASED CONGESTION AVOIDANCE FOR TCP 359
TABLE ISUMMARY OF TRACED PATHS
TABLE IISUMMARY OF MEASURED PERFORMANCE. VALUES IN PARENTHESES
REPRESENT THESTANDARD DEVIATION OF THE STATISTIC
on standard TCP/IP host configurations. For three of the paths,we used thettcp application [34]. For the others, we used theechopingapplication [35] which sends data to standard TCPdiscard servers. The five discard servers were located on Webservers connected to the Internet. Over the course of five days,we traced TCP connections at regular intervals (five runs eachday beginning at 9:00 am followed by a run every two hours).Each run transferred between 6 and 20 MB (depending on thepath) and lasted anywhere from 3 to 45 minutes depending onthe level of congestion over the path.
Table II summarizes the average performance of each path.Paths 1 and 7 represent the best and worst performing path, re-spectively. We specifically selected paths that crossed severalprovider’s networks, as this is more representative of Internetconnections. Subsequent analysis of time-of-day patterns revealthat that all paths (except for path 2) experienced their worst per-formance during the afternoon runs.
We post-processed atcpdumptrace to obtain the round-tripdelay associated with each data packet with a unique acknowl-edgment. We refer to these RTT samples as thetcpRTTtime se-ries. ThetcpRTTsamples contain more congestion informationthan does the standard TCP RTT algorithm (i.e., that is used forthe retransmit timeout calculation as described in [36]) becausethe tcpRTTsamples are more frequent and they are based on amore precise time measurement.
The algorithm used to generate thetcpRTTtime series is sum-marized as follows. We describe the algorithm as it would beimplemented by a TCP/Sender even though we actually run the
algorithm on atcpdumptrace. The sender records the departuretime of every packet. To filter out error in RTT samples causedby the TCP delayed acknowledgment,tcpRTTsamples are gen-erated only for the highest segment acknowledged by an ACK.Furthermore, only ACKs that acknowledge more than one seg-ment of data will generate atcpRTTsample. During periods ofrecovery, the algorithm does not take anytcpRTTsamples toavoid errors.
The tcpRTTtime series consists of the following tuple:
tcpRTT where
When , this implies that the next segment sent afteris dropped and when , the segment is not dropped.
In the event that multiple loss events are associated with thesametcpRTTsample, rather than having a duplicate entry, wekeep only one. Therefore, our analysis treats a burst of loss as asingle loss event. Also, packets that are retransmitted more thanone time will be considered as separate loss events as long asthey have a uniquetcpRTTsample.
B. Analyzing the Loss Conditioned Delay
We are interested in learning if thetcpRTTsample prior toloss (or perhaps the average of some small number oftcpRTTsamples prior to loss) is greater than a smoothed average of pre-cedingtcpRTTsamples. In other words, we want to know howfrequently loss events in a connection might have been predictedby monitoring RTT. To help assess this, we have developed threemetrics which we apply to thetcpRTTtime series data. The firstand the third metrics provide an indication of how well a DCAalgorithm might predict future loss events based on measuredRTT samples. The second metric assesses the correlation be-tween loss and increases in RTT and provides insight into theobserved queueing delay that surrounds loss events.
1) Correlation Indication Metric: The correlation indica-tion metric counts the number of times that thetcpRTTsamplesprior to packet loss are greater than the average of someprevioustcpRTTsamples. The metric is based on occurrencesof the following delay event:
sampledRTT windowAVG
The sampledRTT is the average of the number oftcpRTTsamples prior to the transmission of a dropped segment.We refer to this as theloss conditioned delay. For a giventcpRTTtime series that contains loss events, each loss eventleads to asampledRTT value defined as follows:
sampledRTTtcpRTT
for all tcpRTTsamples where .controls the size of the moving window associated with
the sampledRTTand determines the responsiveness of thealgorithm. Similarly,windowAVG is a moving window av-erage of the previous tcpRTTvalues prior to the transmissionof a segment that is dropped. The is the standard devia-tion associated withwindowAVG . The sampledRTT
represents an “instantaneous” RTT measurement while the
360 IEEE/ACM TRANSACTIONS ON NETWORKING, VOL. 11, NO. 3, JUNE 2003
windowAVG is a longer term average. The difference,sampledRTT windowAVG , is reflective of an in-crease or decrease in queue delays relative to the previousRTT samples.
For a given run, we calculate thesampledRTT andwindowAVG values that are associated with each lossevent and count the number of times that the delay event istrue. Dividing this count by the total number of packet lossoccurrences estimates the probability that thetcpRTTsamplesprior to a loss are higher than some average and consequentlyis an indicator of how well loss events might be predicted intime to avoid loss. We refer to this as thecorrelation indicationmetric (CIM) and define it as follows:
sampledRTT windowAVG
The objective of the CIM metric can be fine tuned with theselection of the pair. When both parameters are large, themetric is an indicator of long-term congestion. As an example,assume the metric is applied to a dataset using an pairof (10 000, 500 000). For this pair, once the metric valueexceeds 0.5, it can be assumed that the network is experiencinglong-term congestion (i.e., thesampledRTTis based on the mostrecent several minutes, and the threshold is based on the mostrecent several hours). An pair of (2, 500 000) makes theCIM more sensitive to any increases in RTT (which will causea DCA algorithm to incorrectly react) but the decision is notrelative to the most recent network dynamics. Smallervalues focus the metric to be sensitive to bursty congestion. Forexample, an pair of (1, 5) makes the algorithm sensitiveto packet jitter. As the value of moves toward , the metricvalue should approach 0 because thewindowAVG valueswill be identical to thesampledRTT values.
The CIM metric assesses how effectively packet loss over anetwork might be predicted. The prediction might be incorrectcausing a hypothetical DCA algorithm to react to an increase inRTT that is not associated with loss. The CIM uses a standarddeviation of thewindowAVG statistic to filter incorrect losspredictions. Based on our analysis, we found that the pairof (2, 20) along with a threshold of a standard deviation is mosteffective in accurately predicting loss events across a range ofpath dynamics. Given that DCA must differentiate longer termcongestion swells from short-term queue increases that accom-pany loss events, an pair of (2, 20) achieves this goal (atleast better than other combinations ofand ).
Table III illustrates the results of the metric applied to thetraced data grouped by paths and by time of day (i.e., the timeat which the trace was obtained). The parameters of the analysiswere (2, 20) with a threshold of one standard deviation. Eachdata point is the average of five samples of the metric (i.e., theaverage of the Monday through Friday samples over a particularpath at a specific time of day) and the standard deviation asso-ciated with the mean. As an example, on average, at 9:00 am,18.6% (with a standard deviation of 0.1) of all loss events onpath 1 were preceded by a detectable increase in RTT. Paths 1,2, and 5 exhibit the highest level of correlation between delayand loss, while paths 6 and 7 exhibit the lowest level. Taking the
TABLE IIICORRELATION INDICATION METRIC RESULTSOVER THE SEVEN PATHS
average of all values for each path shows that between 7%–18%of loss events that were observed could potentially be predictedand avoided.
The loss conditioned delay indication metric is an indicator ofhow successful a DCA algorithm could be in avoiding the lossevents found in the measured data. While the results indicatethat some level of correlation exists between loss and increasesin RTT, the results also indicate that loss is typicallynot pre-ceded by an (observed) increase in RTT. Further, the results donot convey the accuracy of the loss prediction decision. In Sec-tion III-C, we apply a DCA algorithm on the traced data and,using the loss prediction algorithm described above, show thatthe frequent incorrect decisions lead to poor performance.
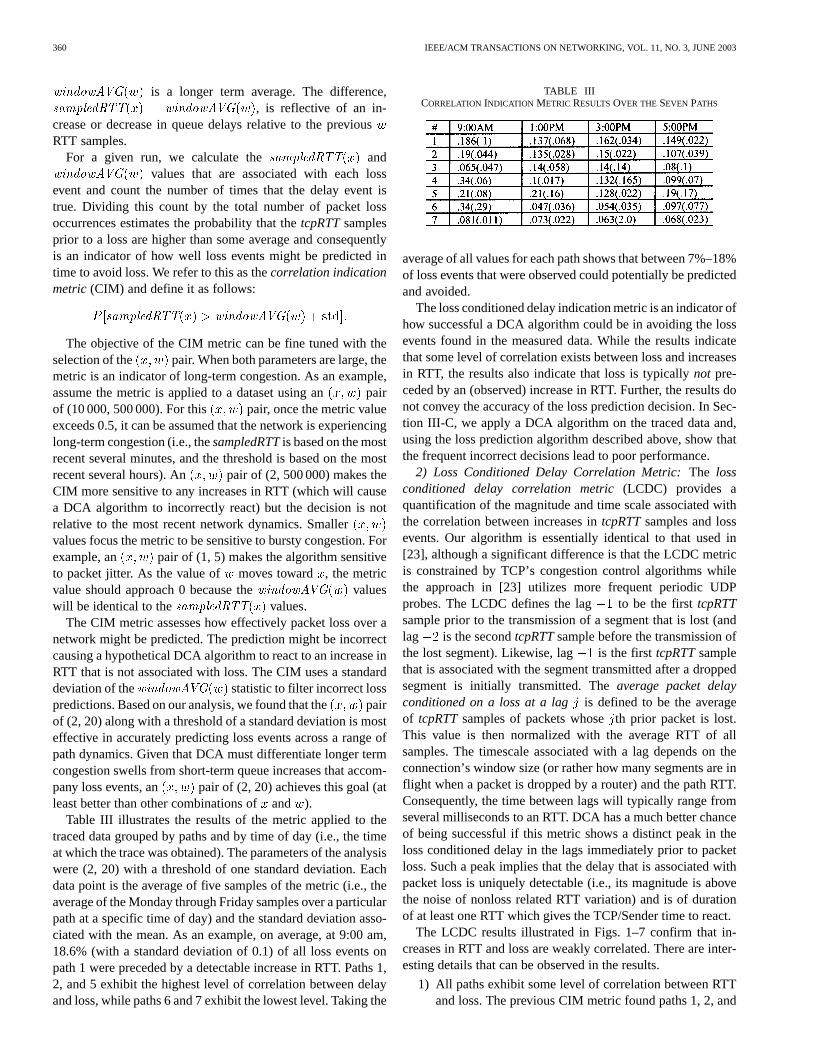
2) Loss Conditioned Delay Correlation Metric:The lossconditioned delay correlation metric(LCDC) provides aquantification of the magnitude and time scale associated withthe correlation between increases intcpRTTsamples and lossevents. Our algorithm is essentially identical to that used in[23], although a significant difference is that the LCDC metricis constrained by TCP’s congestion control algorithms whilethe approach in [23] utilizes more frequent periodic UDPprobes. The LCDC defines the lag to be the firsttcpRTTsample prior to the transmission of a segment that is lost (andlag is the secondtcpRTTsample before the transmission ofthe lost segment). Likewise, lag is the firsttcpRTTsamplethat is associated with the segment transmitted after a droppedsegment is initially transmitted. Theaverage packetdelayconditioned on a loss at a lag is defined to be the averageof tcpRTTsamples of packets whoseth prior packet is lost.This value is then normalized with the average RTT of allsamples. The timescale associated with a lag depends on theconnection’s window size (or rather how many segments are inflight when a packet is dropped by a router) and the path RTT.Consequently, the time between lags will typically range fromseveral milliseconds to an RTT. DCA has a much better chanceof being successful if this metric shows a distinct peak in theloss conditioned delay in the lags immediately prior to packetloss. Such a peak implies that the delay that is associated withpacket loss is uniquely detectable (i.e., its magnitude is abovethe noise of nonloss related RTT variation) and is of durationof at least one RTT which gives the TCP/Sender time to react.
The LCDC results illustrated in Figs. 1–7 confirm that in-creases in RTT and loss are weakly correlated. There are inter-esting details that can be observed in the results.
1) All paths exhibit some level of correlation between RTTand loss. The previous CIM metric found paths 1, 2, and
MARTIN et al.: DELAY-BASED CONGESTION AVOIDANCE FOR TCP 361
Fig. 1. LCDC metric for path 1.
Fig. 2. LCDC metric for path 2.
5 to be the most correlated, but the LCDC finds that paths2, 3, 4, 5, and 7 are the most correlated. The differenceis that the CIM applies a filter to its assessment, therebyignoring a certain level of correlation that might exist.
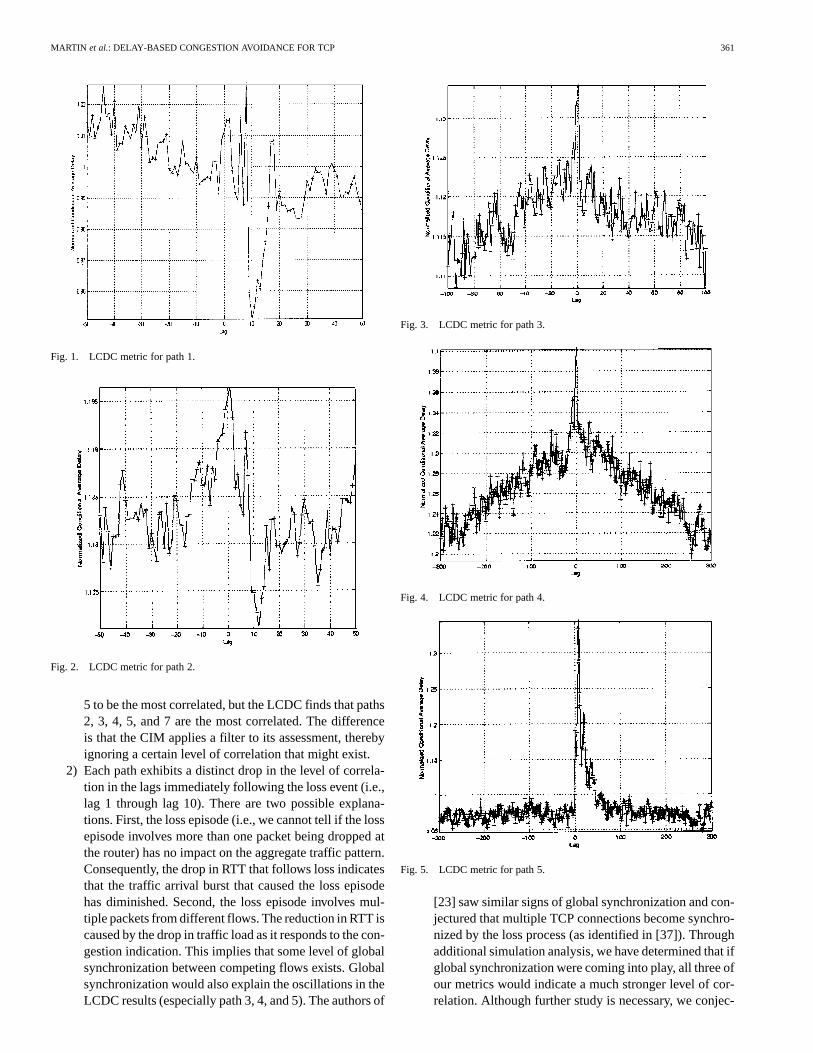
2) Each path exhibits a distinct drop in the level of correla-tion in the lags immediately following the loss event (i.e.,lag 1 through lag 10). There are two possible explana-tions. First, the loss episode (i.e., we cannot tell if the lossepisode involves more than one packet being dropped atthe router) has no impact on the aggregate traffic pattern.Consequently, the drop in RTT that follows loss indicatesthat the traffic arrival burst that caused the loss episodehas diminished. Second, the loss episode involves mul-tiple packets from different flows. The reduction in RTT iscaused by the drop in traffic load as it responds to the con-gestion indication. This implies that some level of globalsynchronization between competing flows exists. Globalsynchronization would also explain the oscillations in theLCDC results (especially path 3, 4, and 5). The authors of
Fig. 3. LCDC metric for path 3.
Fig. 4. LCDC metric for path 4.
Fig. 5. LCDC metric for path 5.
[23] saw similar signs of global synchronization and con-jectured that multiple TCP connections become synchro-nized by the loss process (as identified in [37]). Throughadditional simulation analysis, we have determined that ifglobal synchronization were coming into play, all three ofour metrics would indicate a much stronger level of cor-relation. Although further study is necessary, we conjec-
362 IEEE/ACM TRANSACTIONS ON NETWORKING, VOL. 11, NO. 3, JUNE 2003
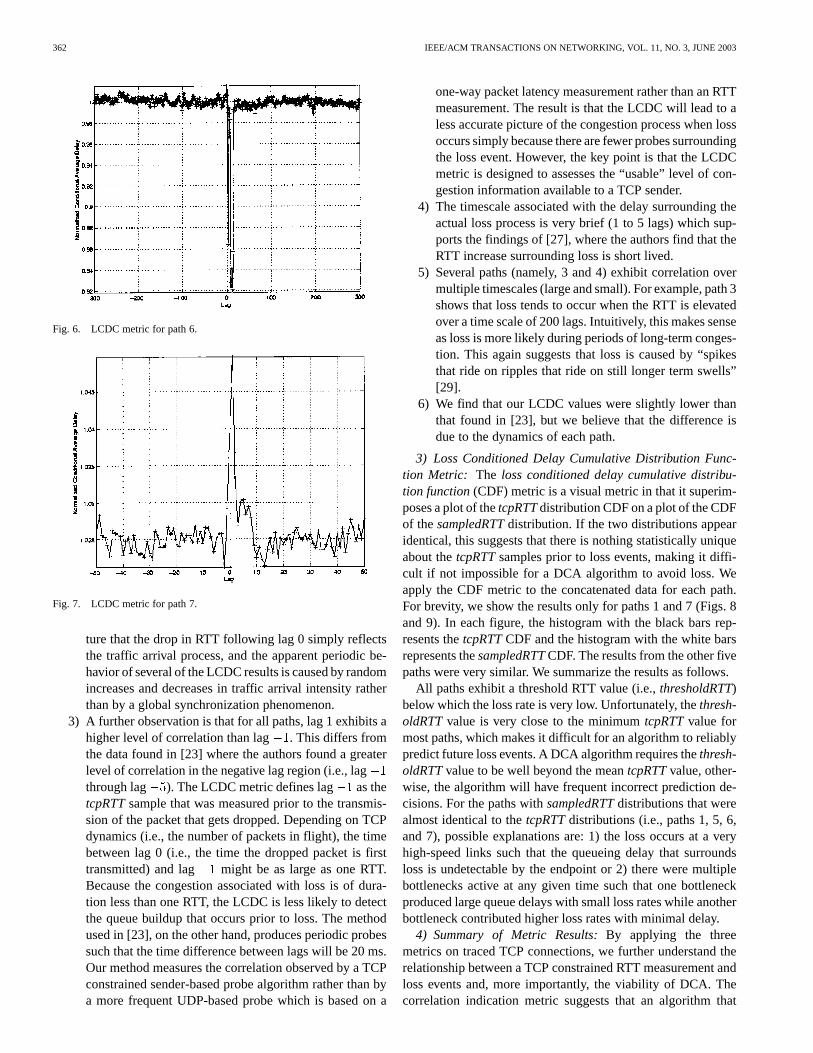
Fig. 6. LCDC metric for path 6.
Fig. 7. LCDC metric for path 7.
ture that the drop in RTT following lag 0 simply reflectsthe traffic arrival process, and the apparent periodic be-havior of several of the LCDC results is caused by randomincreases and decreases in traffic arrival intensity ratherthan by a global synchronization phenomenon.
3) A further observation is that for all paths, lag 1 exhibits ahigher level of correlation than lag . This differs fromthe data found in [23] where the authors found a greaterlevel of correlation in the negative lag region (i.e., lagthrough lag ). The LCDC metric defines lag as thetcpRTTsample that was measured prior to the transmis-sion of the packet that gets dropped. Depending on TCPdynamics (i.e., the number of packets in flight), the timebetween lag 0 (i.e., the time the dropped packet is firsttransmitted) and lag might be as large as one RTT.Because the congestion associated with loss is of dura-tion less than one RTT, the LCDC is less likely to detectthe queue buildup that occurs prior to loss. The methodused in [23], on the other hand, produces periodic probessuch that the time difference between lags will be 20 ms.Our method measures the correlation observed by a TCPconstrained sender-based probe algorithm rather than bya more frequent UDP-based probe which is based on a
one-way packet latency measurement rather than an RTTmeasurement. The result is that the LCDC will lead to aless accurate picture of the congestion process when lossoccurs simply because there are fewer probes surroundingthe loss event. However, the key point is that the LCDCmetric is designed to assesses the “usable” level of con-gestion information available to a TCP sender.
4) The timescale associated with the delay surrounding theactual loss process is very brief (1 to 5 lags) which sup-ports the findings of [27], where the authors find that theRTT increase surrounding loss is short lived.
5) Several paths (namely, 3 and 4) exhibit correlation overmultiple timescales (large and small). For example, path 3shows that loss tends to occur when the RTT is elevatedover a time scale of 200 lags. Intuitively, this makes senseas loss is more likely during periods of long-term conges-tion. This again suggests that loss is caused by “spikesthat ride on ripples that ride on still longer term swells”[29].
6) We find that our LCDC values were slightly lower thanthat found in [23], but we believe that the difference isdue to the dynamics of each path.
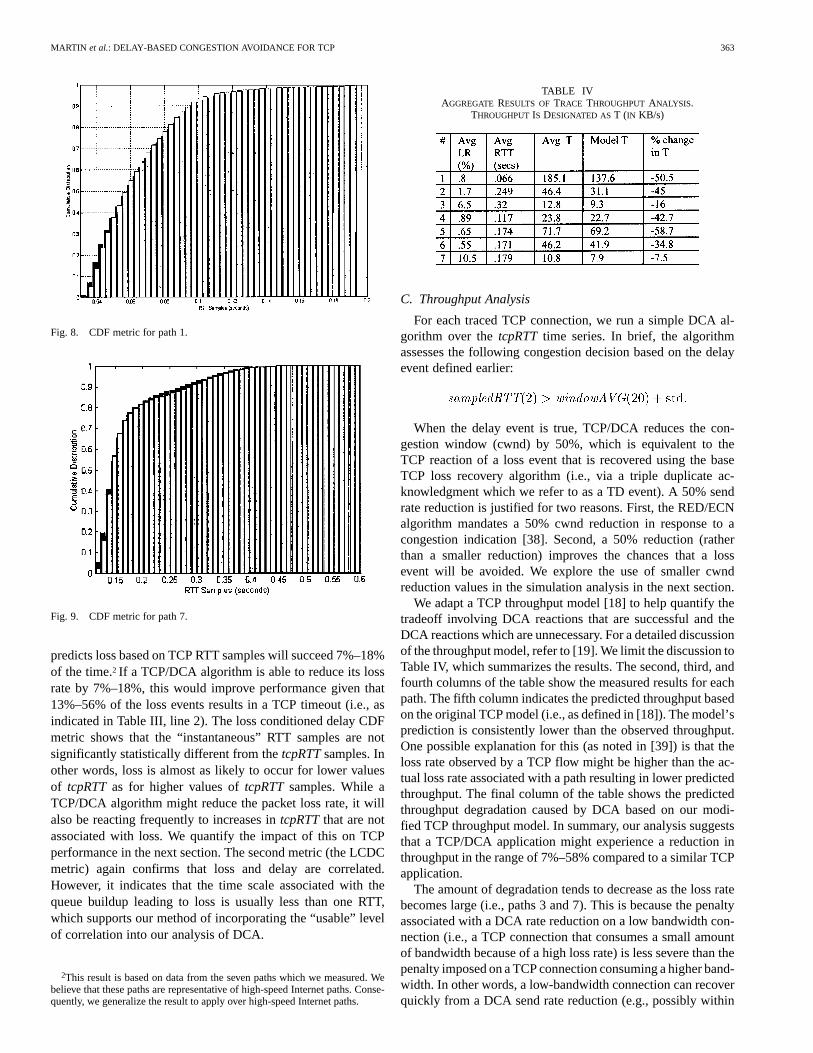
3) Loss Conditioned Delay Cumulative Distribution Func-tion Metric: The loss conditioned delay cumulative distribu-tion function(CDF) metric is a visual metric in that it superim-poses a plot of thetcpRTTdistribution CDF on a plot of the CDFof thesampledRTTdistribution. If the two distributions appearidentical, this suggests that there is nothing statistically uniqueabout thetcpRTTsamples prior to loss events, making it diffi-cult if not impossible for a DCA algorithm to avoid loss. Weapply the CDF metric to the concatenated data for each path.For brevity, we show the results only for paths 1 and 7 (Figs. 8and 9). In each figure, the histogram with the black bars rep-resents thetcpRTTCDF and the histogram with the white barsrepresents thesampledRTTCDF. The results from the other fivepaths were very similar. We summarize the results as follows.
All paths exhibit a threshold RTT value (i.e.,thresholdRTT)below which the loss rate is very low. Unfortunately, thethresh-oldRTTvalue is very close to the minimumtcpRTTvalue formost paths, which makes it difficult for an algorithm to reliablypredict future loss events. A DCA algorithm requires thethresh-oldRTTvalue to be well beyond the meantcpRTTvalue, other-wise, the algorithm will have frequent incorrect prediction de-cisions. For the paths withsampledRTTdistributions that werealmost identical to thetcpRTTdistributions (i.e., paths 1, 5, 6,and 7), possible explanations are: 1) the loss occurs at a veryhigh-speed links such that the queueing delay that surroundsloss is undetectable by the endpoint or 2) there were multiplebottlenecks active at any given time such that one bottleneckproduced large queue delays with small loss rates while anotherbottleneck contributed higher loss rates with minimal delay.
4) Summary of Metric Results:By applying the threemetrics on traced TCP connections, we further understand therelationship between a TCP constrained RTT measurement andloss events and, more importantly, the viability of DCA. Thecorrelation indication metric suggests that an algorithm that
MARTIN et al.: DELAY-BASED CONGESTION AVOIDANCE FOR TCP 363
Fig. 8. CDF metric for path 1.
Fig. 9. CDF metric for path 7.
predicts loss based on TCP RTT samples will succeed 7%–18%of the time.2 If a TCP/DCA algorithm is able to reduce its lossrate by 7%–18%, this would improve performance given that13%–56% of the loss events results in a TCP timeout (i.e., asindicated in Table III, line 2). The loss conditioned delay CDFmetric shows that the “instantaneous” RTT samples are notsignificantly statistically different from thetcpRTTsamples. Inother words, loss is almost as likely to occur for lower valuesof tcpRTTas for higher values oftcpRTTsamples. While aTCP/DCA algorithm might reduce the packet loss rate, it willalso be reacting frequently to increases intcpRTTthat are notassociated with loss. We quantify the impact of this on TCPperformance in the next section. The second metric (the LCDCmetric) again confirms that loss and delay are correlated.However, it indicates that the time scale associated with thequeue buildup leading to loss is usually less than one RTT,which supports our method of incorporating the “usable” levelof correlation into our analysis of DCA.
2This result is based on data from the seven paths which we measured. Webelieve that these paths are representative of high-speed Internet paths. Conse-quently, we generalize the result to apply over high-speed Internet paths.
TABLE IVAGGREGATE RESULTS OFTRACE THROUGHPUT ANALYSIS.
THROUGHPUTIS DESIGNATED AST (IN KB/s)
C. Throughput Analysis
For each traced TCP connection, we run a simple DCA al-gorithm over thetcpRTTtime series. In brief, the algorithmassesses the following congestion decision based on the delayevent defined earlier:
sampledRTT windowAVG
When the delay event is true, TCP/DCA reduces the con-gestion window (cwnd) by 50%, which is equivalent to theTCP reaction of a loss event that is recovered using the baseTCP loss recovery algorithm (i.e., via a triple duplicate ac-knowledgment which we refer to as a TD event). A 50% sendrate reduction is justified for two reasons. First, the RED/ECNalgorithm mandates a 50% cwnd reduction in response to acongestion indication [38]. Second, a 50% reduction (ratherthan a smaller reduction) improves the chances that a lossevent will be avoided. We explore the use of smaller cwndreduction values in the simulation analysis in the next section.
We adapt a TCP throughput model [18] to help quantify thetradeoff involving DCA reactions that are successful and theDCA reactions which are unnecessary. For a detailed discussionof the throughput model, refer to [19]. We limit the discussion toTable IV, which summarizes the results. The second, third, andfourth columns of the table show the measured results for eachpath. The fifth column indicates the predicted throughput basedon the original TCP model (i.e., as defined in [18]). The model’sprediction is consistently lower than the observed throughput.One possible explanation for this (as noted in [39]) is that theloss rate observed by a TCP flow might be higher than the ac-tual loss rate associated with a path resulting in lower predictedthroughput. The final column of the table shows the predictedthroughput degradation caused by DCA based on our modi-fied TCP throughput model. In summary, our analysis suggeststhat a TCP/DCA application might experience a reduction inthroughput in the range of 7%–58% compared to a similar TCPapplication.
The amount of degradation tends to decrease as the loss ratebecomes large (i.e., paths 3 and 7). This is because the penaltyassociated with a DCA rate reduction on a low bandwidth con-nection (i.e., a TCP connection that consumes a small amountof bandwidth because of a high loss rate) is less severe than thepenalty imposed on a TCP connection consuming a higher band-width. In other words, a low-bandwidth connection can recoverquickly from a DCA send rate reduction (e.g., possibly within
364 IEEE/ACM TRANSACTIONS ON NETWORKING, VOL. 11, NO. 3, JUNE 2003
several RTTs) while it might take the higher bandwidth connec-tion many RTTs to recover.
IV. SIMULATION ANALYSIS
The objectives of the simulation analysis are to validate ourmeasurement analysis and to extend it in a manner that was notpossible with measurement. In particular, the objectives are:
• to obtain additional insight into why our measurementanalysis suggests that a DCA congestion probe can pre-dict at the most (on average) 7%–18% of loss events. Wecan only do this by looking at the actual bottleneck linkqueue levels along with thetcpRTTtime series;
• to validate our claim that a TCP/DCA algorithm will in-deed degrade TCP throughput as compared to TCP/Reno;
• to provide additional validation of our result by showingthat TCP/Vegas and TCP/Dual also degrade throughput.
A. Developing the Models
Using the ns simulation package [20], we developed sim-ulation models based on the two U.S. paths from the set ofhigh-speed Internet paths that we analyzed in the previous sec-tion. These two paths, the Emory and ASU paths, were thebest and the worst performing paths, respectively, and conse-quently represent the two most interesting network scenarios forour DCA analysis. We usedpathcharandtracerouteto obtainan estimate of the static attributes of the path. For each path,we calibrated the simulation parameters so that the end-to-endcharacteristics of the simulation models, such as RTT varia-tions, throughput, and loss dynamics are statistically similarto the measured results. By usingpathcharand correlating theRTT samples obtained from concurrent pings to different routersalong the measured paths, we saw evidence that both of theInternet paths are subject to congestion at multiple hops. Weused this information to help us design the background trafficlevels necessary to emulate the end-to-end dynamics observedover the measured path.
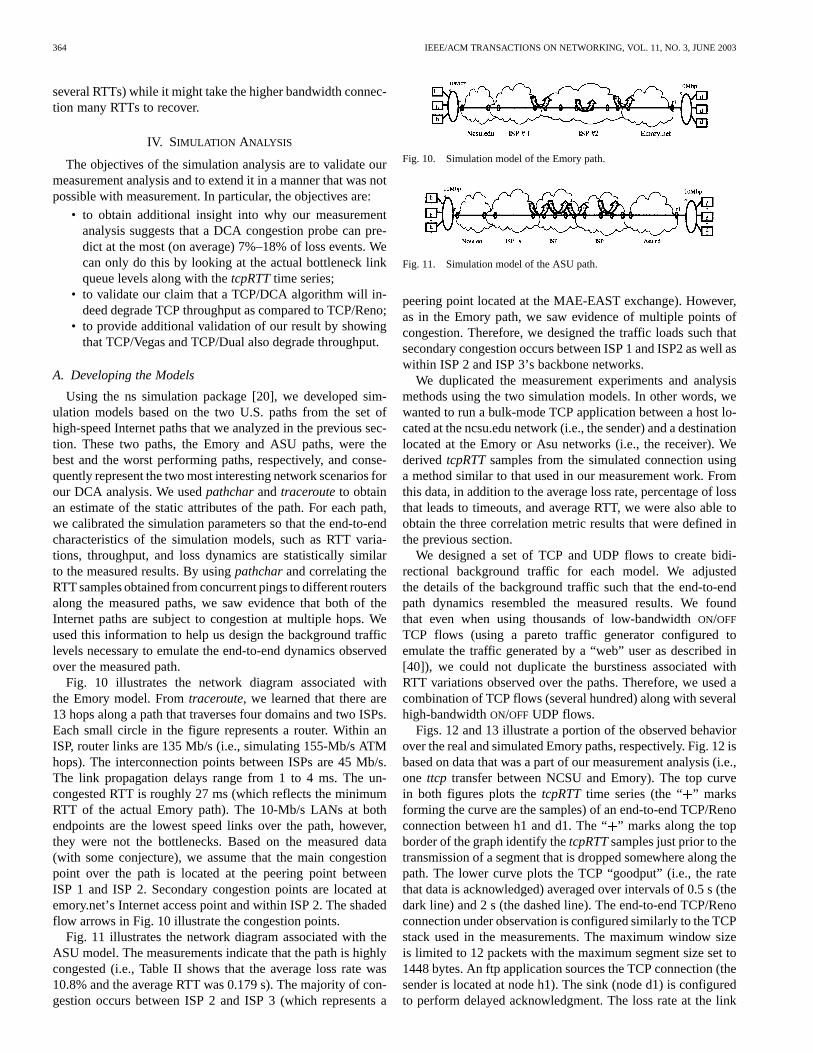
Fig. 10 illustrates the network diagram associated withthe Emory model. Fromtraceroute, we learned that there are13 hops along a path that traverses four domains and two ISPs.Each small circle in the figure represents a router. Within anISP, router links are 135 Mb/s (i.e., simulating 155-Mb/s ATMhops). The interconnection points between ISPs are 45 Mb/s.The link propagation delays range from 1 to 4 ms. The un-congested RTT is roughly 27 ms (which reflects the minimumRTT of the actual Emory path). The 10-Mb/s LANs at bothendpoints are the lowest speed links over the path, however,they were not the bottlenecks. Based on the measured data(with some conjecture), we assume that the main congestionpoint over the path is located at the peering point betweenISP 1 and ISP 2. Secondary congestion points are located atemory.net’s Internet access point and within ISP 2. The shadedflow arrows in Fig. 10 illustrate the congestion points.
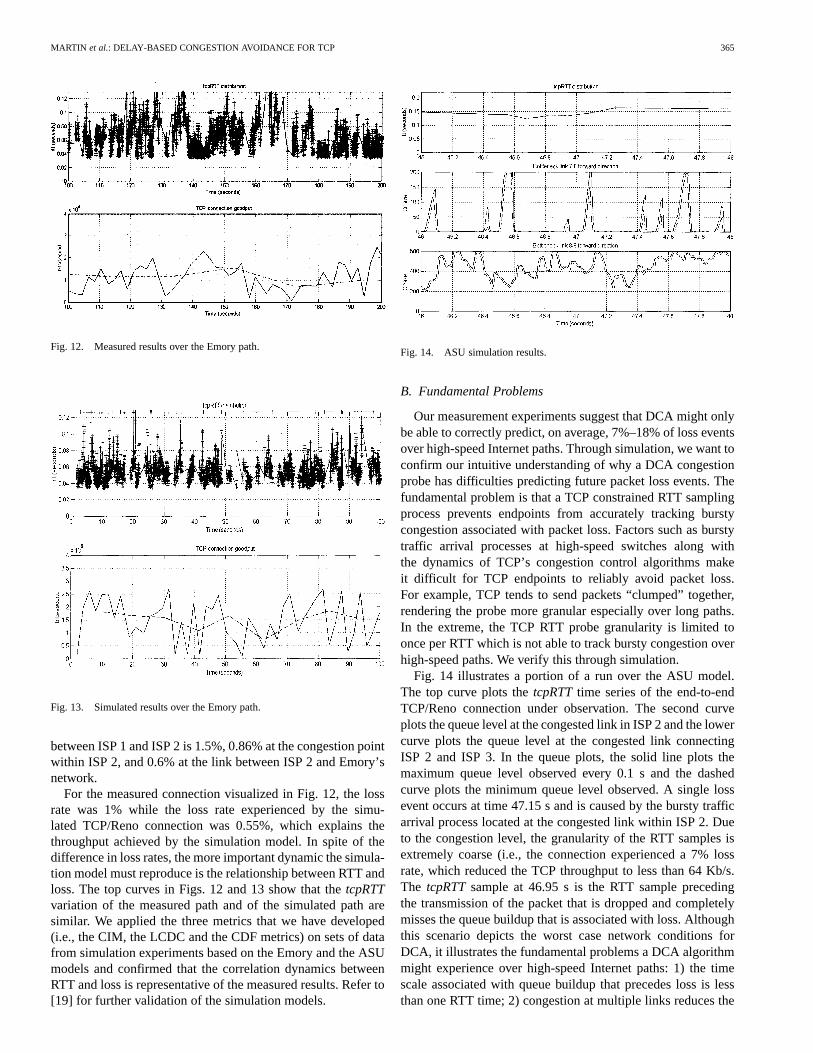
Fig. 11 illustrates the network diagram associated with theASU model. The measurements indicate that the path is highlycongested (i.e., Table II shows that the average loss rate was10.8% and the average RTT was 0.179 s). The majority of con-gestion occurs between ISP 2 and ISP 3 (which represents a
Fig. 10. Simulation model of the Emory path.
Fig. 11. Simulation model of the ASU path.
peering point located at the MAE-EAST exchange). However,as in the Emory path, we saw evidence of multiple points ofcongestion. Therefore, we designed the traffic loads such thatsecondary congestion occurs between ISP 1 and ISP2 as well aswithin ISP 2 and ISP 3’s backbone networks.
We duplicated the measurement experiments and analysismethods using the two simulation models. In other words, wewanted to run a bulk-mode TCP application between a host lo-cated at the ncsu.edu network (i.e., the sender) and a destinationlocated at the Emory or Asu networks (i.e., the receiver). WederivedtcpRTTsamples from the simulated connection usinga method similar to that used in our measurement work. Fromthis data, in addition to the average loss rate, percentage of lossthat leads to timeouts, and average RTT, we were also able toobtain the three correlation metric results that were defined inthe previous section.
We designed a set of TCP and UDP flows to create bidi-rectional background traffic for each model. We adjustedthe details of the background traffic such that the end-to-endpath dynamics resembled the measured results. We foundthat even when using thousands of low-bandwidthON/OFF
TCP flows (using a pareto traffic generator configured toemulate the traffic generated by a “web” user as described in[40]), we could not duplicate the burstiness associated withRTT variations observed over the paths. Therefore, we used acombination of TCP flows (several hundred) along with severalhigh-bandwidthON/OFF UDP flows.
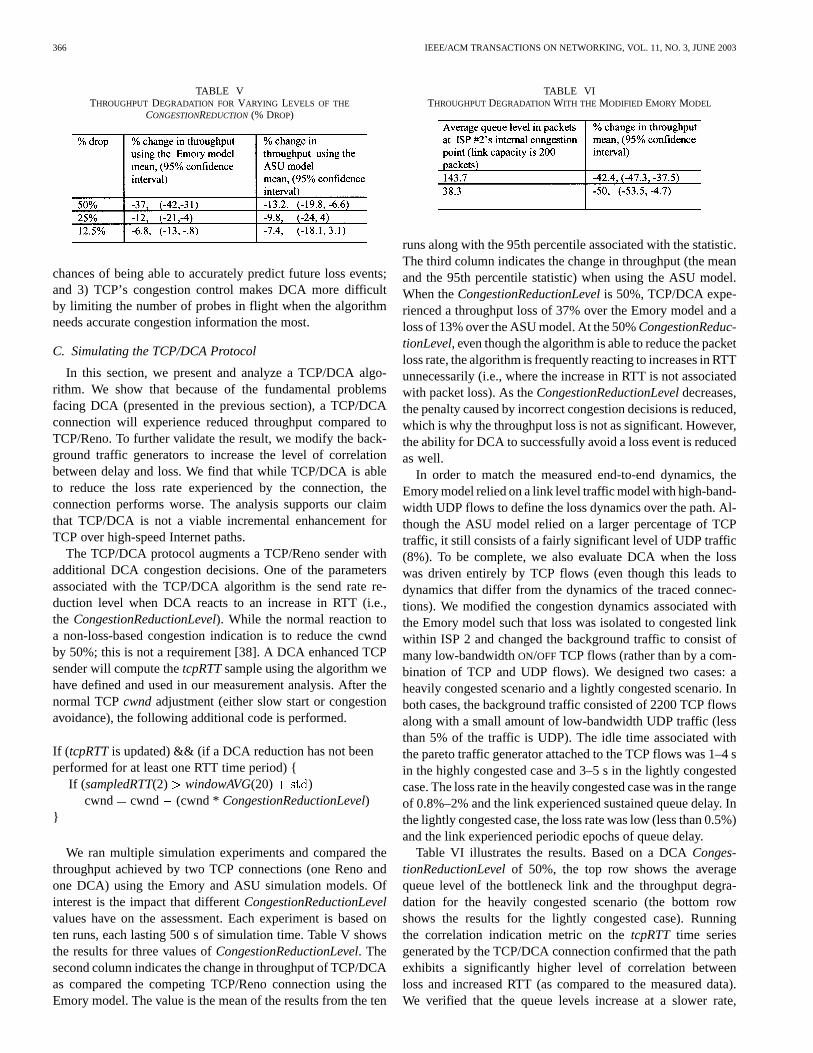
Figs. 12 and 13 illustrate a portion of the observed behaviorover the real and simulated Emory paths, respectively. Fig. 12 isbased on data that was a part of our measurement analysis (i.e.,one ttcp transfer between NCSU and Emory). The top curvein both figures plots thetcpRTTtime series (the “ ” marksforming the curve are the samples) of an end-to-end TCP/Renoconnection between h1 and d1. The “” marks along the topborder of the graph identify thetcpRTTsamples just prior to thetransmission of a segment that is dropped somewhere along thepath. The lower curve plots the TCP “goodput” (i.e., the ratethat data is acknowledged) averaged over intervals of 0.5 s (thedark line) and 2 s (the dashed line). The end-to-end TCP/Renoconnection under observation is configured similarly to the TCPstack used in the measurements. The maximum window sizeis limited to 12 packets with the maximum segment size set to1448 bytes. An ftp application sources the TCP connection (thesender is located at node h1). The sink (node d1) is configuredto perform delayed acknowledgment. The loss rate at the link
MARTIN et al.: DELAY-BASED CONGESTION AVOIDANCE FOR TCP 365
Fig. 12. Measured results over the Emory path.
Fig. 13. Simulated results over the Emory path.
between ISP 1 and ISP 2 is 1.5%, 0.86% at the congestion pointwithin ISP 2, and 0.6% at the link between ISP 2 and Emory’snetwork.
For the measured connection visualized in Fig. 12, the lossrate was 1% while the loss rate experienced by the simu-lated TCP/Reno connection was 0.55%, which explains thethroughput achieved by the simulation model. In spite of thedifference in loss rates, the more important dynamic the simula-tion model must reproduce is the relationship between RTT andloss. The top curves in Figs. 12 and 13 show that thetcpRTTvariation of the measured path and of the simulated path aresimilar. We applied the three metrics that we have developed(i.e., the CIM, the LCDC and the CDF metrics) on sets of datafrom simulation experiments based on the Emory and the ASUmodels and confirmed that the correlation dynamics betweenRTT and loss is representative of the measured results. Refer to[19] for further validation of the simulation models.
Fig. 14. ASU simulation results.
B. Fundamental Problems
Our measurement experiments suggest that DCA might onlybe able to correctly predict, on average, 7%–18% of loss eventsover high-speed Internet paths. Through simulation, we want toconfirm our intuitive understanding of why a DCA congestionprobe has difficulties predicting future packet loss events. Thefundamental problem is that a TCP constrained RTT samplingprocess prevents endpoints from accurately tracking burstycongestion associated with packet loss. Factors such as burstytraffic arrival processes at high-speed switches along withthe dynamics of TCP’s congestion control algorithms makeit difficult for TCP endpoints to reliably avoid packet loss.For example, TCP tends to send packets “clumped” together,rendering the probe more granular especially over long paths.In the extreme, the TCP RTT probe granularity is limited toonce per RTT which is not able to track bursty congestion overhigh-speed paths. We verify this through simulation.
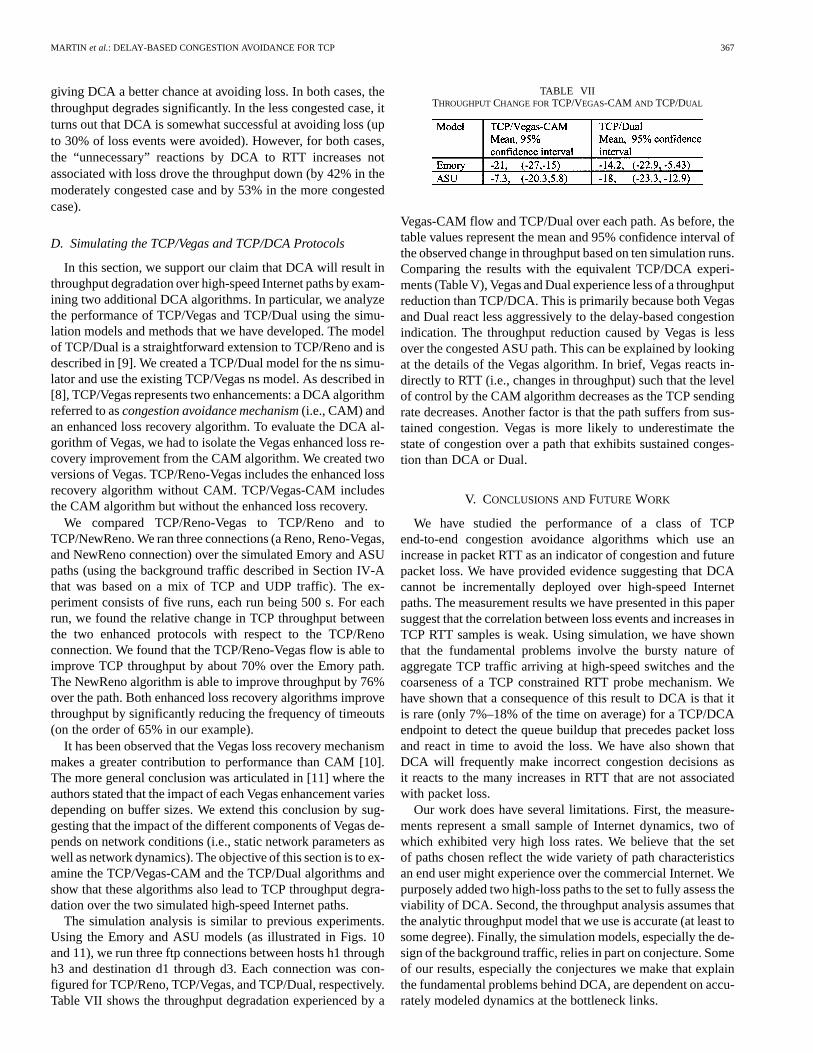
Fig. 14 illustrates a portion of a run over the ASU model.The top curve plots thetcpRTTtime series of the end-to-endTCP/Reno connection under observation. The second curveplots the queue level at the congested link in ISP 2 and the lowercurve plots the queue level at the congested link connectingISP 2 and ISP 3. In the queue plots, the solid line plots themaximum queue level observed every 0.1 s and the dashedcurve plots the minimum queue level observed. A single lossevent occurs at time 47.15 s and is caused by the bursty trafficarrival process located at the congested link within ISP 2. Dueto the congestion level, the granularity of the RTT samples isextremely coarse (i.e., the connection experienced a 7% lossrate, which reduced the TCP throughput to less than 64 Kb/s.The tcpRTTsample at 46.95 s is the RTT sample precedingthe transmission of the packet that is dropped and completelymisses the queue buildup that is associated with loss. Althoughthis scenario depicts the worst case network conditions forDCA, it illustrates the fundamental problems a DCA algorithmmight experience over high-speed Internet paths: 1) the timescale associated with queue buildup that precedes loss is lessthan one RTT time; 2) congestion at multiple links reduces the
366 IEEE/ACM TRANSACTIONS ON NETWORKING, VOL. 11, NO. 3, JUNE 2003
TABLE VTHROUGHPUT DEGRADATION FOR VARYING LEVELS OF THE
CONGESTIONREDUCTION (% DROP)
chances of being able to accurately predict future loss events;and 3) TCP’s congestion control makes DCA more difficultby limiting the number of probes in flight when the algorithmneeds accurate congestion information the most.
C. Simulating the TCP/DCA Protocol
In this section, we present and analyze a TCP/DCA algo-rithm. We show that because of the fundamental problemsfacing DCA (presented in the previous section), a TCP/DCAconnection will experience reduced throughput compared toTCP/Reno. To further validate the result, we modify the back-ground traffic generators to increase the level of correlationbetween delay and loss. We find that while TCP/DCA is ableto reduce the loss rate experienced by the connection, theconnection performs worse. The analysis supports our claimthat TCP/DCA is not a viable incremental enhancement forTCP over high-speed Internet paths.
The TCP/DCA protocol augments a TCP/Reno sender withadditional DCA congestion decisions. One of the parametersassociated with the TCP/DCA algorithm is the send rate re-duction level when DCA reacts to an increase in RTT (i.e.,the CongestionReductionLevel). While the normal reaction toa non-loss-based congestion indication is to reduce the cwndby 50%; this is not a requirement [38]. A DCA enhanced TCPsender will compute thetcpRTTsample using the algorithm wehave defined and used in our measurement analysis. After thenormal TCPcwndadjustment (either slow start or congestionavoidance), the following additional code is performed.
If ( tcpRTTis updated) && (if a DCA reduction has not beenperformed for at least one RTT time period) {
If (sampledRTT(2) windowAVG(20) )cwnd cwnd (cwnd * CongestionReductionLevel)
}
We ran multiple simulation experiments and compared thethroughput achieved by two TCP connections (one Reno andone DCA) using the Emory and ASU simulation models. Ofinterest is the impact that differentCongestionReductionLevelvalues have on the assessment. Each experiment is based onten runs, each lasting 500 s of simulation time. Table V showsthe results for three values ofCongestionReductionLevel. Thesecond column indicates the change in throughput of TCP/DCAas compared the competing TCP/Reno connection using theEmory model. The value is the mean of the results from the ten
TABLE VITHROUGHPUTDEGRADATION WITH THE MODIFIED EMORY MODEL
runs along with the 95th percentile associated with the statistic.The third column indicates the change in throughput (the meanand the 95th percentile statistic) when using the ASU model.When theCongestionReductionLevelis 50%, TCP/DCA expe-rienced a throughput loss of 37% over the Emory model and aloss of 13% over the ASU model. At the 50%CongestionReduc-tionLevel, even though the algorithm is able to reduce the packetloss rate, the algorithm is frequently reacting to increases in RTTunnecessarily (i.e., where the increase in RTT is not associatedwith packet loss). As theCongestionReductionLeveldecreases,the penalty caused by incorrect congestion decisions is reduced,which is why the throughput loss is not as significant. However,the ability for DCA to successfully avoid a loss event is reducedas well.
In order to match the measured end-to-end dynamics, theEmory model relied on a link level traffic model with high-band-width UDP flows to define the loss dynamics over the path. Al-though the ASU model relied on a larger percentage of TCPtraffic, it still consists of a fairly significant level of UDP traffic(8%). To be complete, we also evaluate DCA when the losswas driven entirely by TCP flows (even though this leads todynamics that differ from the dynamics of the traced connec-tions). We modified the congestion dynamics associated withthe Emory model such that loss was isolated to congested linkwithin ISP 2 and changed the background traffic to consist ofmany low-bandwidthON/OFFTCP flows (rather than by a com-bination of TCP and UDP flows). We designed two cases: aheavily congested scenario and a lightly congested scenario. Inboth cases, the background traffic consisted of 2200 TCP flowsalong with a small amount of low-bandwidth UDP traffic (lessthan 5% of the traffic is UDP). The idle time associated withthe pareto traffic generator attached to the TCP flows was 1–4 sin the highly congested case and 3–5 s in the lightly congestedcase. The loss rate in the heavily congested case was in the rangeof 0.8%–2% and the link experienced sustained queue delay. Inthe lightly congested case, the loss rate was low (less than 0.5%)and the link experienced periodic epochs of queue delay.
Table VI illustrates the results. Based on a DCAConges-tionReductionLevelof 50%, the top row shows the averagequeue level of the bottleneck link and the throughput degra-dation for the heavily congested scenario (the bottom rowshows the results for the lightly congested case). Runningthe correlation indication metric on thetcpRTT time seriesgenerated by the TCP/DCA connection confirmed that the pathexhibits a significantly higher level of correlation betweenloss and increased RTT (as compared to the measured data).We verified that the queue levels increase at a slower rate,
MARTIN et al.: DELAY-BASED CONGESTION AVOIDANCE FOR TCP 367
giving DCA a better chance at avoiding loss. In both cases, thethroughput degrades significantly. In the less congested case, itturns out that DCA is somewhat successful at avoiding loss (upto 30% of loss events were avoided). However, for both cases,the “unnecessary” reactions by DCA to RTT increases notassociated with loss drove the throughput down (by 42% in themoderately congested case and by 53% in the more congestedcase).
D. Simulating the TCP/Vegas and TCP/DCA Protocols
In this section, we support our claim that DCA will result inthroughput degradation over high-speed Internet paths by exam-ining two additional DCA algorithms. In particular, we analyzethe performance of TCP/Vegas and TCP/Dual using the simu-lation models and methods that we have developed. The modelof TCP/Dual is a straightforward extension to TCP/Reno and isdescribed in [9]. We created a TCP/Dual model for the ns simu-lator and use the existing TCP/Vegas ns model. As described in[8], TCP/Vegas represents two enhancements: a DCA algorithmreferred to ascongestion avoidance mechanism(i.e., CAM) andan enhanced loss recovery algorithm. To evaluate the DCA al-gorithm of Vegas, we had to isolate the Vegas enhanced loss re-covery improvement from the CAM algorithm. We created twoversions of Vegas. TCP/Reno-Vegas includes the enhanced lossrecovery algorithm without CAM. TCP/Vegas-CAM includesthe CAM algorithm but without the enhanced loss recovery.
We compared TCP/Reno-Vegas to TCP/Reno and toTCP/NewReno. We ran three connections (a Reno, Reno-Vegas,and NewReno connection) over the simulated Emory and ASUpaths (using the background traffic described in Section IV-Athat was based on a mix of TCP and UDP traffic). The ex-periment consists of five runs, each run being 500 s. For eachrun, we found the relative change in TCP throughput betweenthe two enhanced protocols with respect to the TCP/Renoconnection. We found that the TCP/Reno-Vegas flow is able toimprove TCP throughput by about 70% over the Emory path.The NewReno algorithm is able to improve throughput by 76%over the path. Both enhanced loss recovery algorithms improvethroughput by significantly reducing the frequency of timeouts(on the order of 65% in our example).
It has been observed that the Vegas loss recovery mechanismmakes a greater contribution to performance than CAM [10].The more general conclusion was articulated in [11] where theauthors stated that the impact of each Vegas enhancement variesdepending on buffer sizes. We extend this conclusion by sug-gesting that the impact of the different components of Vegas de-pends on network conditions (i.e., static network parameters aswell as network dynamics). The objective of this section is to ex-amine the TCP/Vegas-CAM and the TCP/Dual algorithms andshow that these algorithms also lead to TCP throughput degra-dation over the two simulated high-speed Internet paths.
The simulation analysis is similar to previous experiments.Using the Emory and ASU models (as illustrated in Figs. 10and 11), we run three ftp connections between hosts h1 throughh3 and destination d1 through d3. Each connection was con-figured for TCP/Reno, TCP/Vegas, and TCP/Dual, respectively.Table VII shows the throughput degradation experienced by a
TABLE VIITHROUGHPUTCHANGE FORTCP/VEGAS-CAM AND TCP/DUAL
Vegas-CAM flow and TCP/Dual over each path. As before, thetable values represent the mean and 95% confidence interval ofthe observed change in throughput based on ten simulation runs.Comparing the results with the equivalent TCP/DCA experi-ments (Table V), Vegas and Dual experience less of a throughputreduction than TCP/DCA. This is primarily because both Vegasand Dual react less aggressively to the delay-based congestionindication. The throughput reduction caused by Vegas is lessover the congested ASU path. This can be explained by lookingat the details of the Vegas algorithm. In brief, Vegas reacts in-directly to RTT (i.e., changes in throughput) such that the levelof control by the CAM algorithm decreases as the TCP sendingrate decreases. Another factor is that the path suffers from sus-tained congestion. Vegas is more likely to underestimate thestate of congestion over a path that exhibits sustained conges-tion than DCA or Dual.
V. CONCLUSIONS ANDFUTURE WORK
We have studied the performance of a class of TCPend-to-end congestion avoidance algorithms which use anincrease in packet RTT as an indicator of congestion and futurepacket loss. We have provided evidence suggesting that DCAcannot be incrementally deployed over high-speed Internetpaths. The measurement results we have presented in this papersuggest that the correlation between loss events and increases inTCP RTT samples is weak. Using simulation, we have shownthat the fundamental problems involve the bursty nature ofaggregate TCP traffic arriving at high-speed switches and thecoarseness of a TCP constrained RTT probe mechanism. Wehave shown that a consequence of this result to DCA is that itis rare (only 7%–18% of the time on average) for a TCP/DCAendpoint to detect the queue buildup that precedes packet lossand react in time to avoid the loss. We have also shown thatDCA will frequently make incorrect congestion decisions asit reacts to the many increases in RTT that are not associatedwith packet loss.
Our work does have several limitations. First, the measure-ments represent a small sample of Internet dynamics, two ofwhich exhibited very high loss rates. We believe that the setof paths chosen reflect the wide variety of path characteristicsan end user might experience over the commercial Internet. Wepurposely added two high-loss paths to the set to fully assess theviability of DCA. Second, the throughput analysis assumes thatthe analytic throughput model that we use is accurate (at least tosome degree). Finally, the simulation models, especially the de-sign of the background traffic, relies in part on conjecture. Someof our results, especially the conjectures we make that explainthe fundamental problems behind DCA, are dependent on accu-rately modeled dynamics at the bottleneck links.
368 IEEE/ACM TRANSACTIONS ON NETWORKING, VOL. 11, NO. 3, JUNE 2003
We plan to evaluate DCA over low-speed paths that utilizebroadband access technology such as xDSL or cable. Wirelessnetworks (i.e., 3G or 802.11 wireless LANs) represent a pos-sible application for DCA, as it is useful to know if a loss eventwas caused by congestion or channel errors. However, in theseenvironments that are potentially more suitable for DCA, ex-plicit congestion notification must also be considered.
A problem that we struggled with was how to accuratelymodel the dynamics of the Internet. The difficulties surroundinglarge-scale Internet simulation are well known [41]. We ob-tained satisfactory results using a combination of many TCPflows along with several high-bandwidth UDP flows. To ac-curately assess the impact of a large deployment of DCA,the design of the background traffic becomes vital. In ouranalysis, when we used primarily TCP flows (i.e., thousandsof flows), we found that we were unable to accurately repro-duce the characteristics of the measured paths. However, usingtoo much UDP traffic (i.e., aggregate link-level traffic model)might interfere with the evaluation. We plan on focusing ourmeasurement analysis techniques (which has provided us withinteresting clues and insight into congestion dynamics overthe Internet) to further develop simulation models that betterrepresent Internet behavior.
ACKNOWLEDGMENT
The authors would like to thank the anonymous reviewersand the editor for their comments and input, which have greatlycontributed to the improvement of the presentation of this paper.
REFERENCES
[1] V. Jacobson, “Congestion avoidance and control,” inProc. ACM SIG-COMM, 1988, pp. 314–329.
[2] V. Jacobson, C. Leres, and S. McCanne. (1989, June) tcpdump. [Online].Available: ftp://ftp.ee.lbl.gov
[3] M. Allman, V. Paxson, and W. Stevens, “TCP congestion control,” IETF,RFC 2581, Apr. 1999.
[4] S. Floyd, “A report on some recent developments in TCP congestioncontrol,” IEEE Commun. Mag., vol. 39, pp. 84–90, Apr. 2001.
[5] M. Mathis, J. Mahdavi, S. Floyd, and A. Romanow, “TCP selectiveacknowledgment options,” Network Working Group, RFC 2018, Apr.1996.
[6] M. Allman and S. Floyd. (2000, Aug.) Enhancing TCP’s loss recoveryusing limited transmit. IETF. Internet Draft. [Online]. Available: draft-ietf-tsvwg-limited-xmit-00.txt
[7] R. Jain, “A delay-based approach for congestion avoidance in intercon-nected heterogeneous computer networks,”Comput. Commun. Rev., vol.19, no. 5, pp. 56–71, Oct. 1989.
[8] L. S. Brakmo, S. W. O’Malley, and L. L. Peterson, “TCP Vegas: Newtechniques for congestion detection and avoidance,” inProc. ACM SIG-COMM, Aug. 1994, pp. 24–35.
[9] Z. Wang and J. Crowcroft, “Eliminating periodic packet losses in the4.3-Tahoe BSD TCP congestion control algorithm,”Comput. Commun.Rev., vol. 22, no. 2, pp. 9–16, Apr. 1992.
[10] U. Hengartner, J. Bolliger, and T. Gross, “TCP Vegas revisited,” inProc.IEEE INFOCOM, Mar. 2000, pp. 1546–1555.
[11] S. Low, L. Peterson, and L. Wang, “Understanding TCP Vegas: A dualitymodel,”J. ACM, vol. 49, no. 2, pp. 207–235, Mar. 2002.
[12] J. Mo et al., “Analysis and comparison of TCP/Reno and Vegas,” inProc. IEEE INFOCOM, 1999, pp. 1556–1563.
[13] D. Bansal, H. Balakrishnan, S. Floyd, and S. Shenker, “Dynamic be-havior of slowly-responsive congestion control algorithms,” inProc.ACM SIGCOMM, Aug. 2001, pp. 263–274.
[14] K. Claffy, G. Miller, and K. Thompson, “The nature of the beast: Re-cent traffic measurements from an internet backbone,” inProc. INETConf., 1998, [Online.] Available: http://www.isoc.org/inet98/proceed-ings/6g/6g_3.htm.
[15] W. Fang and L. Peterson, “Inter-AS traffic patterns and their implica-tions,” in Proc. IEEE GLOBECOM, 1999, pp. 1859–1868.
[16] K. Thompson, G. Miller, and R. Wilder, “Wide area internet trafficpatterns and characteristics,”IEEE Network, vol. 11, pp. 10–23,Nov. 1997.
[17] C. Fraleigh, S. Moon, B. Lyles, C. Cotton, M. Khan, D. Moll, R. Rock-well, T. Seely, and C. Diot, “Packet-level traffic measurements from theSprint IP backbone,”IEEE Network, to be published.
[18] J. Padhyeet al., “Modeling TCP throughput: A simple model and itsempirical validation,” inProc. ACM SIGCOMM, 1998, pp. 303–314.
[19] J. Martin, “RTT-based congestion avoidance for high speed TCPInternet connections,” Ph.D. dissertation, North Carolina State Univ.,Raleigh, Dec. 1999.
[20] The Network Simulator. Univ. California, Berkeley, CA. [Online].Available: http://www-mash.cs.Berkeley.EDU/ns/
[21] J. Ahn, P. Danzig, Z. Liu, and L. Yan, “Evaluation of TCP Vegas: Emu-lation and experiment,” inProc. ACM SIGCOMM, 1995, pp. 185–195.
[22] J. Bolot, “End-to-end packet delay and loss behavior in the Internet,” inProc. ACM SIGCOMM, 1993, pp. 289–298.
[23] S. Moon, J. Kurose, and D. Towsley, “Correlation of packet delay andloss in the Internet,” Dept. Comput. Sci., Univ. Massachusetts, Amherst,Tech. Rep. 98–11, 1998.
[24] V. Paxson, “End-to-end internet packet dynamics,”IEEE/ACM Trans.Networking, vol. 7, pp. 277–292, June 1999.
[25] M. Yajnik, S. Moon, J. Kurose, and D. Towsley, “Measurement and mod-eling of the temporal dependence in packet loss,” inProc. IEEE IN-FOCOM, Mar. 1999, pp. 345–352.
[26] V. Paxson, “Measurements and analysis of end-to-end Internet dy-namics,” Ph.D. dissertation, Univ. California, Berkeley, CA, 1997.
[27] Y. Zhang, N. Duffield, V. Paxson, and S. Shenker, “On the constancy ofinternet path properties,” inProc. ACM SIGCOMM Internet Measure-ment Workshop (IMW2001), Nov. 2001, pp. 197–211.
[28] D. Loguinov and H. Radha, “Large-scale experimental study of internetperformance using video traffic,”Comput. Commun. Rev., vol. 32, no.1, pp. 7–19, Jan. 2002.
[29] W. Lelandet al., “On the self-similar nature of Ethernet traffic,”IEEETrans. Networking, vol. 2, pp. 1–15, Feb. 1994.
[30] S. Floyd, M. Handley, J. Padhye, and J. Widmer, “Equation-basedcongestion control for unicast applications,” inProc. ACM SIGCOMM,Aug. 2000, pp. 43–56.
[31] S. Cen, C. Pu, and J. Walpole, “Flow and congestion control for in-ternet streaming applications,” inProc. Multimedia Computing and Net-working, Jan. 1998, pp. 250–264.
[32] R. Rejaie, M. Handley, and D. Estrin, “RAP: An end-to-end rate-basedcongestion control mechanism for realtime streams in the Internet,” inProc. IEEE INFOCOM, 1999, pp. 1337–1345.
[33] P. Hurleyet al., “ABE: Providing a low-delay service within best effort,”IEEE Network, vol. 15, pp. 60–69, May/June 2001.
[34] R. Miles.ttcpmeasurement tool. The FreeBSD Project. [Online]. Avail-able: http://www.freebsd.org/ports
[35] S. Bortzmeyer. (2002, Oct.) Echoping measurement tool. [Online].Available: http://echoping.sourceforge.net
[36] V. Paxson and M. Allman, “Computing TCP’s retransmission timer,”Network Working Group, RFC 2988, Nov. 2000.
[37] S. Shenker, L. Zhang, and D. Clark, “Some observations on the dynamicsof a congestion control algorithm,” inProc. ACM SIGCOMM, 1990, pp.30–39.
[38] S. Floyd and K. Ramakrishnan. (1999, Jan.) A Proposal toadd explicit congestion notification to IP. Experimental RFC2481. Info. Sci. Inst., Los Angeles, CA. [Online]. Available:ftp://ftp.isi.edu/in-notes/rfc2481.txt
[39] M. Goyal, R. Guerin, and R. Rajan, “Predicting TCP throughput fromnoninvasive network sampling,” inProc. IEEE INFOCOM, June 2002,pp. 180–189.
[40] P. Barford and M. Crovella, “Generating representative web workloadsfor network and server performance evaluation,” inACM SIGMETRICS,July 1998, pp. 151–160.
[41] S. Floyd and V. Paxson, “Difficulties in simulating the internet,”IEEE/ACM Trans. Networking, vol. 9, pp. 392–403, Aug. 2001.
MARTIN et al.: DELAY-BASED CONGESTION AVOIDANCE FOR TCP 369
Jim Martin (M’88) received the B.S degree inelectrical engineering from the University of Illinois,Urbana-Champaign, in 1983, the M.S. degree fromArizona State University, Tempe, in 1989, and thePh.D. degree from North Carolina State University,Raleigh, in 1999.
He is currently an Assistant Professor with the De-partment of Computer Science, Clemson University,Clemson, SC. He was previously a Senior Consultantfor the Gartner Group, where he provided consultingin the area of network design and performance man-
agement to service providers and companies. Prior to joining Gartner, he spentten years at IBM Network Systems Division where he worked on the researchand development of network and network security products. His research inter-ests are in communication networks, network performance management, andInternet transport issues.
Arne A. Nilsson received the Master of ElectricalEngineering degree and the Ph.D. degree in telecom-munication systems from the Lund University ofTechnology, Lund, Sweden, in 1968 and 1976,respectively.
He is currently a Professor with the Departmentof Electrical and Computer Engineering, NorthCarolina State University (NCSU), Raleigh. He hasmore than 30 years of experience with telecommu-nication networks. He was a Principal Investigatorfor the Swedish Telecommunication Administration
in the effort to build a Nordic packet switched network. He joined the facultyat NCSU in 1978. In 1986, he was a Professor at the Aeronautics Institute ofTechnology (ITA), Sao Jose dos Campos, Brazil. He was on the committeeresponsible for the design and architecture of the MCNC data and videonetwork in North Carolina, and was a Principal Investigator on the VISTAnet,one of 5-Gb test beds. He has been an active participant in the industry/uni-versity cooperative research center on communications and signal processingat NCSU, Center for Communications and Signal Processing (CCSP), andthe Center for Advanced Computing and Communication (CACC). He hasrecently become an External Evaluator for some of the European efforts inhigh-speed networking. He has also worked for the U.S. Army Research Officein the wireless network engineering area.
Injong Rhee (SM’89) received the Ph.D. degreefrom the University of North Carolina, Chapel Hill.
He is currently an Associate Professor of com-puter science with North Carolina State University,Raleigh. In 2000, he founded Togabi Technologies,Inc., a company that develops and markets mobilewireless multimedia applications for next-generationwireless networks. He served as CTO and CEO ofthe company until 2002. His research interests are incomputer networks, congestion control, multimediastreaming, video compression, distributed systems,
and operation systems.Dr. Rhee is a Member of the Association for Computing Machinery.