delft university of technology creating and capturing
TRANSCRIPT
Delft University of Technology
Creating and Capturing ValueA Consumer Perspective on Frugal Innovations in Water and Energy in East AfricaHowell, R.J.
DOI10.4233/uuid:347cafb2-73e2-4edd-adfd-8733ef7ec258Publication date2021Document VersionFinal published versionCitation (APA)Howell, R. J. (2021). Creating and Capturing Value: A Consumer Perspective on Frugal Innovations inWater and Energy in East Africa. https://doi.org/10.4233/uuid:347cafb2-73e2-4edd-adfd-8733ef7ec258
Important noteTo cite this publication, please use the final published version (if applicable).Please check the document version above.
CopyrightOther than for strictly personal use, it is not permitted to download, forward or distribute the text or part of it, without the consentof the author(s) and/or copyright holder(s), unless the work is under an open content license such as Creative Commons.
Takedown policyPlease contact us and provide details if you believe this document breaches copyrights.We will remove access to the work immediately and investigate your claim.
This work is downloaded from Delft University of Technology.For technical reasons the number of authors shown on this cover page is limited to a maximum of 10.

CREATING AND CAPTURING VALUE: A CONSUMER PERSPECTIVE ON FRUGAL INNOVATIONS IN WATER AND ENERGY IN EAST AFRICA
Rachel Howell
2
Creating and Capturing Value: A Consumer Perspective on Frugal
Innovations in Water and Energy in East Africa
Dissertation
for the purpose of obtaining the degree of doctor
at Delft University of Technology,
by the authority of the Rector Magnificus prof. dr. ir. T.H.J.J. van der Hagen, Chair of the Board for Doctorates
to be defended publicly on Wednesday, 17th March 2021 at 15:00 o’clock
by
Rachel HOWELL Master of Science
Engineering and Policy Analysis, Delft University of Technology the Netherlands
born in Lodi, United States

3
This dissertation has been approved by the promotors. Composition of the doctoral committee:Rector Magnificus, Chairperson Prof.dr. C.P. van Beers Delft University of Technology, promoter Prof.dr. P. Knorringa Institute of Social Studies, Erasmus University
Rotterdam, promoter Prof.dr.mr.ir. N. Doorn Delft University of Technology, promoter Independent members: Dr. S. Bhaduri Jawaharlal Nehru University, India Prof.dr. M. Dekker Leiden University Prof.dr. J.H. Slinger Delft University of Technology Prof.dr.ir. N.C. van de Giesen Delft University of Technology Economics of Innovation Section, Faculty of Technology, Policy and Management, Delft University of Technology, The Netherlands The research of this study was funded by NWO grant 313-99-314 funded by the Netherlands Organization for Scientific Research. Dr. Natascha Wagner (Erasmus University Rotterdam) and Dr. Kinsuk Mani Sinha contributed to the field work and analysis done in Chapters 3 and 4. Private partners:
ISBN: 978-94-6419-165-3
Copyright 2021 Ó by R. Howell

Table of Contents List of Figures ......................................................................................................................... 8 List of Tables ........................................................................................................................... 8
Summary ................................................................................................................................... 10 Sammenvatting ......................................................................................................................... 12 1 Introduction ....................................................................................................................... 14
1.1 Introduction ................................................................................................................ 15 1.2 Literature Review ....................................................................................................... 16
1.2.1 Frugal Innovation ................................................................................................ 16 1.2.2 Business Models ................................................................................................. 17 1.2.3 Consumers in Emerging Markets ........................................................................ 19 1.2.4 Gaps in the literature ........................................................................................... 21
1.3 Research Questions .................................................................................................... 22 1.4 Empirical Approach ................................................................................................... 23
1.4.1 Context ................................................................................................................ 23 1.5 Cases ........................................................................................................................... 26
1.5.1 TAHMO .............................................................................................................. 26 1.5.2 Dutch Water Limited .......................................................................................... 28 1.5.3 Jibu ...................................................................................................................... 32 1.5.4 Solar Company .................................................................................................... 36 1.5.5 Method ................................................................................................................ 39
1.6 Outline of Thesis and Terminology ........................................................................... 42 2 Value capture and value creation: The role of information technology in business models for frugal innovations in Africa ................................................................................................ 44
2.1 Introduction ................................................................................................................ 45 2.2 Information Technological Advancement and Frugal Innovation ............................. 46 2.3 Dual Business Challenges and the Bottom of the Pyramid ........................................ 48
2.3.1 Bottom of the Pyramid ........................................................................................ 48 2.3.2 Value Creation and Value Capturing .................................................................. 50
2.4 Business Models and Frugal Innovations ................................................................... 51 2.4.1 Business Model Conceptualizations and Challenges .......................................... 51 2.4.2 IT and Business Models ...................................................................................... 54

5
2.5 Value Capture and Value Creation: the case of frugal weather stations in sub-Saharan Africa. ...................................................................................................................... 56
2.5.1 Background ......................................................................................................... 56 2.5.2 IT Innovation ...................................................................................................... 57 2.5.3 Business Models ................................................................................................. 58 2.5.4 Local Context and Economic Development ....................................................... 61
2.6 Discussion .................................................................................................................. 62 2.7 Conclusions ................................................................................................................ 65
3 Consumption of Bottled Water at the Bottom of the Pyramid: Who Purchases First? ..... 76 3.1 Introduction ................................................................................................................ 77 3.2 Literature Review ....................................................................................................... 78
3.2.1 Macromarketing at the BoP ................................................................................ 78 3.2.2 Consumer studies at the BoP .............................................................................. 79 3.2.3 Consumption and Purchase of Clean Water Technologies ................................. 80
3.3 Conceptual Model ...................................................................................................... 81 3.4 Study Context and Sampling ...................................................................................... 82
3.4.1 Context ................................................................................................................ 82 3.4.2 Case Descriptions ................................................................................................ 84 3.4.3 Sampling ............................................................................................................. 85
3.5 Data and Empirical Model ......................................................................................... 87 3.5.1 Variable Description ........................................................................................... 87 3.5.2 Empirical Model ................................................................................................. 88 3.5.3 Descriptive Statistics ........................................................................................... 90
3.6 Results ........................................................................................................................ 92 3.7 Discussion .................................................................................................................. 98 3.8 Conclusions ................................................................................................................ 99 References ........................................................................................................................... 101
4 Experiential Marketing of Clean Drinking Water: Experimental Evidence for Kenya and Rwanda ................................................................................................................................... 106
4.1 Introduction .............................................................................................................. 107 4.2 Literature Review ..................................................................................................... 108
4.2.1 Middle of the Pyramid Consumers & Marketing ............................................. 108 4.2.2 Experiential Marketing: Definition and implementation in an emerging market setting ........................................................................................................................... 109 4.2.3 Uptake of Clean Drinking Water ...................................................................... 110
4.3 Conceptual Considerations ....................................................................................... 113

6
4.4 Study Set-Up ............................................................................................................ 114 4.4.1 Background: Water Supply in Kenya and Rwanda .......................................... 114 4.4.2 The Companies Under Study: Water Supply Models of DWL and Jibu .......... 115 4.4.3 Research Design ................................................................................................ 116
4.5 Data .......................................................................................................................... 118 4.5.1 Variable Description ......................................................................................... 118 4.5.2 Descriptive Statistics ......................................................................................... 118
4.6 Empirical Approach ................................................................................................. 121 4.7 Results ...................................................................................................................... 122
4.7.1 Main Results ..................................................................................................... 122 4.7.2 Robustness Checks ............................................................................................ 124
4.8 Discussion ................................................................................................................ 126 References ........................................................................................................................... 130
5 Energy Access and Demand in Uganda: The Role of Frugal Innovations in Meeting Future Energy Needs ............................................................................................................... 138
5.1 Introduction .............................................................................................................. 139 5.2 Literature Review ..................................................................................................... 140
5.2.1 Frugal Innovation .............................................................................................. 140 5.2.2 New Middle Class Consumption ...................................................................... 142 5.2.3 Electricity in Africa ........................................................................................... 143
5.3 Case Illustration ........................................................................................................ 145 5.3.1 Background Electricity Sector in Uganda ......................................................... 145 5.3.2 Case Illustration and Sample Description ......................................................... 148
5.4 Discussion ................................................................................................................ 151 5.5 Conclusions .............................................................................................................. 153 References ........................................................................................................................... 155
6 Conclusions ..................................................................................................................... 162 6.1 Summary of Main Findings ...................................................................................... 163
6.1.1 Business Models for Frugal Innovations .......................................................... 163 6.1.2 Consumer Heterogeneity and Purchase Decision Making ................................ 163 6.1.3 Consumer Demand ............................................................................................ 164
6.2 Research Questions .................................................................................................. 164 6.2.1 R1: How do business models affect value capture and value creation of frugal innovations? ..................................................................................................................... 165 6.2.2 R2: How do determinants of purchase decisions for emerging market consumers lead to value creation and value capture? ........................................................................ 166

7
6.2.3 R3: How will future demand influence frugal innovations? ............................. 167 6.2.4 Main Research Question: How can frugal innovations overcome the tension between value creation and value capture? ..................................................................... 168
6.3 Implications .............................................................................................................. 170 6.3.1 Theoretical ........................................................................................................ 171 6.3.2 Policy ................................................................................................................ 171 6.3.3 Managerial ........................................................................................................ 173
6.4 Reflections and Future Research .............................................................................. 174 7 References ....................................................................................................................... 176 8 Appendix ......................................................................................................................... 196
8.1 Appendix Tables from Chapter 3 ............................................................................. 196 Acknowledgements ................................................................................................................. 205
Curriculum Vitae ................................................................................................................. 207 List of Publications and Presentations ................................................................................ 208
8
List of Figures Figure 1: Reverse Osmosis at DWL's factory ........................................................................... 29 Figure 2: Cleaning process for 10L reusable jerry cans ........................................................... 29 Figure 3: DWL's product offerings. .......................................................................................... 29 Figure 4: DWL's distribution model ......................................................................................... 31 Figure 5: Jibu's UF filtration technology .................................................................................. 34 Figure 6: Jibu's Distribution Model .......................................................................................... 35 Figure 7: Solar Provider's distribution model ........................................................................... 38 Figure 8: Relationship between value creation, technology and value capture ........................ 51 Figure 9: Internal TAHMO components ................................................................................... 57 Figure 10: TAHMO installed at a Kenyan farm ....................................................................... 57 Figure 11: Relationship between value creation, technology and value capture in the TAHMO weather stations case ................................................................................................................. 61 Figure 12: Sampling in the three countries ............................................................................... 86 Figure 13: Income distribution of consumers ........................................................................... 92 Figure 14: Experimental set-up ............................................................................................... 117 Figure 15: Connection charges and electrification rates ......................................................... 144 Figure 16: Uganda's Electricity Market Structure .................................................................. 147 Figure 17: Frugal innovation system ...................................................................................... 153
List of Tables Table 1: Comparison of value capture for the RBV and CBE theories .................................... 18 Table 2: Summary of gaps in the literature ............................................................................... 22 Table 3: Economic and demographic statistics for Kenya, Rwanda and Uganda .................... 24 Table 4: TAHMO's business model .......................................................................................... 27 Table 5: Price breakdown of DWL's 10L jerry can .................................................................. 30 Table 6: DWL's business model ............................................................................................... 31 Table 7: Jibu water prices for Rwanda and Uganda ................................................................. 33 Table 8: Jibu's business model .................................................................................................. 36 Table 9: Solar Provider's business model ................................................................................. 39 Table 10: Overview of data collected ....................................................................................... 41 Table 11: Categories of literature on technology production for and in developing countries 47 Table 12: Frugal innovation features of TAHMO .................................................................... 58 Table 13: IT's influencing role in business models for frugal innovations ............................... 63 Table 14: Descriptive statistics ................................................................................................. 91
9
Table 15: Empirical results of determinants of consumption of bottled water in Kenya, Rwanda and Uganda: multinomial logit estimates ................................................................... 95 Table 16: Overview of the existing literature on uptake of clean drinking water .................. 112 Table 17: Descriptive statistics ............................................................................................... 119 Table 18: Main results: Linear regression results for Kenya and Rwanda ............................. 123 Table 19: Main results: Linear regression results for the combined sample of both countries ................................................................................................................................................. 125 Table 20: Logistic regression results ...................................................................................... 126 Table 21: Summary of common frugal energy innovations from literature ........................... 141 Table 22: Summary of Uganda’s Energy Programs ............................................................... 145 Table 23: Electricity tariffs (2019) and old connection fees for Umeme ............................... 148 Table 24: Summary of survey population ............................................................................... 149 Table 25: Fee structure for solar home systems ...................................................................... 149 Table 26: Solar Home Systems as a frugal innovation ........................................................... 150 Table 27: Average energy expenditures before and after solar access ................................... 150 Table 28: Cost comparison between Umeme grid connection and solar home system .......... 151 Table A1: Selection of variables ............................................................................................ 196 Table A2: Frequencies of consumers per category by sales area/zone .................................. 197 Table A3: Logit model of DWL and Jibu consumers and non-consumers for Kenya and Rwanda .................................................................................................................................. 199 Table A4: Results from multinomial logit of consumer categories using asset poor variable ................................................................................................................................................ 201

10
Summary Frugal innovation emphasizes the reduced use of resources and cutting of costs through the process of innovating around constraints. However, how innovating around constraints leads to profitable (value creation) businesses and local economic development impact (value capture) is still unclear. Early frugal innovation literature assumed that a reduction in cost would be a means to reach low income consumers. Yet, many companies in emerging markets are not reaching their intended low income customer group. Most early frugal innovation literature was conceptual and case study based with most case studies being from India and Asia. Additionally, frugal innovation literature focused more on the design process and less on the consumer and what drives decision making of frugal innovations. Through the use of case studies of frugal innovations in weather monitoring, water, energy in East Africa (Kenya, Uganda, and Rwanda) this research explored the research question: how can frugal innovations overcome the tension between value creation and value capture in frugal innovation? The research utilized four case studies and a combined exploratory and quantitative approach to provide a consumer perspective on value creation and value capture in frugal innovations. Two chapters used exploratory case studies to expand on the understanding of business models for frugal innovations and expose the issues of the often higher per unit costs of many frugal innovations. To develop a deeper understanding of consumer purchasing behavior and frugal innovation a randomized quantitative survey and behavioral experiment of consumers and non-consumers of two low cost re-usable bottled drinking water companies was conducted. Chapter 2 investigates business models for emerging markets and specifically the role of business models in frugal innovation through the use of a case study of a low cost weather monitoring station. Several conclusions were drawn: first, there is a role for the business model in frugal innovations. Second, the rise of information technology has resulted in lower transaction costs, new business models and frugal innovations. Additionally, business model flexibility is important to adapt to changing institutional contexts and scale up faster. Chapters 3 and 4 looked at drivers of purchase decision making for two socially oriented companies offering low cost re-usable drinking water. Through a quantitative study of consumers and non-consumers and a small behavioral experiment several insights into consumer behavior were drawn. First, consumers do not make purchasing decisions on the basis of price alone. Product experience, access to information, supply to a product and specific demographic characteristics such as educational level may drive purchase decision making and willingness to pay more than income levels. Finally, Chapter 5 took a future look by exploring the role of demand in the cost effectiveness of frugal innovations. Looking at the unit costs of small scale solar home systems in Uganda, it was explored how frugal these small scale solutions are in comparison with larger scale infrastructure like grid electrification. With the rise of new middle class consumers demand will increase as well as a shift towards a more western lifestyle. These changes will affect the efficiency and viability of small scale frugal solutions. More importantly, the all of the cases exposed the often ‘stop gap’ nature of many frugal innovations. Many frugal innovations merely replace larger scale public infrastructure alternatives unless they take a systems level approach to innovation. Finally, the conclusions point to the need to take a different approach to value creation through the business model and some future research lines. Value creation in

11
frugal innovation should move beyond merely providing low priced products that match consumers’ willingness to pay, but should focus on increasing consumers’ willingness to pay through increased access to information. Lastly, future research should further explore a systems approach to frugal innovation and the role of the new middle class.

12
Sammenvatting Frugal innovation benadrukt het verminderde gebruik van hulpbronnen en het verlagen van de kosten door het proces van innoveren rond beperkingen. Het is echter nog onduidelijk hoe innoveren rond beperkingen leidt tot winstgevende (waardecreatie) bedrijven en de impact van lokale economische ontwikkeling (waardecreatie). De vroege literatuur over frugal innovation ging ervan uit dat een verlaging van de kosten een middel zou zijn om consumenten met een laag inkomen te bereiken. Toch bereiken veel bedrijven in opkomende markten hun beoogde klantengroep met lage inkomens niet. De meeste vroege literatuur over frugal innovation was conceptueel en gebaseerd op casestudy's, waarbij de meeste casestudy's uit India en Azië kwamen. Bovendien is de literatuur over frugal innovation meer gericht op het ontwerpproces en minder op de consument en wat de besluitvorming over aankopen van frugal innovations stimuleert. Door het gebruik van casestudies van zuinige innovaties in weermonitoring, water, energie in Oost-Afrika (Kenia, Oeganda en Rwanda) onderzocht dit onderzoek de onderzoeksvraag: hoe kunnen frugal innovations de spanning tussen waardecreatie en waardevastlegging bij frugal innovation overwinnen? Het onderzoek maakte gebruik van vier casestudies en een gecombineerde verkennende en kwantitatieve benadering om een consumentenperspectief te bieden op waardecreatie en waardevastlegging in frugal innovations. In twee hoofdstukken werden verkennende casestudies gebruikt om het begrip van bedrijfsmodellen voor frugal innovations uit te breiden en de problemen bloot te leggen van de vaak hogere kosten per eenheid van veel frugal innovations. Om een beter begrip te krijgen van het koopgedrag van consumenten en frugal innovation is een gerandomiseerde kwantitatieve enquête en gedragsexperiment onder consumenten en niet-consumenten van twee goedkope herbruikbare drinkwaterflesbedrijven uitgevoerd. Hoofdstuk 2 onderzoekt bedrijfsmodellen voor opkomende markten en specifiek de rol van bedrijfsmodellen bij frugal innovation door het gebruik van een casestudy van een goedkoop weerstation. Er werden verschillende conclusies getrokken: ten eerste is er een rol weggelegd voor het businessmodel in frugal innovations. Ten tweede heeft de opkomst van informatietechnologie geleid tot lagere transactiekosten, nieuwe bedrijfsmodellen en frugal innovations. Ten slotte is flexibiliteit van bedrijfsmodellen belangrijk om zich aan te passen aan veranderende institutionele contexten en sneller op te kunnen schalen. In de hoofdstukken 3 en 4 werd gekeken naar de drijvende krachten achter aankoopbeslissingen voor twee sociaal georiënteerde bedrijven die goedkoop herbruikbaar drinkwater aanbieden. Door middel van een kwantitatieve studie van consumenten en niet-consumenten en een klein gedragsexperiment werden verschillende inzichten in consumentengedrag verkregen. Ten eerste nemen consumenten aankoopbeslissingen niet alleen op basis van prijs. Productervaring, toegang tot informatie, levering aan een product en specifieke demografische kenmerken zoals opleidingsniveau kunnen de besluitvorming over aankopen en de bereidheid om meer te betalen dan inkomensniveaus stimuleren. Ten slotte werd in hoofdstuk 5 een toekomstperspectief bekeken door de rol van de vraag in de kosteneffectiviteit van frugal innovations te onderzoeken. Kijkend naar de eenheidskosten van kleinschalige zonnesystemen voor thuis in Oeganda, werd onderzocht hoe zuinig deze kleinschalige oplossingen zijn in vergelijking met grootschalige infrastructuur zoals de aanleg van een elektriciteitsnet. Met de opkomst van een nieuwe middenklasse zal de vraag van consumenten toenemen, evenals een verschuiving naar een meer westerse levensstijl. Deze veranderingen zullen de efficiëntie en levensvatbaarheid van kleinschalige, frugal innovations beïnvloeden. Nog belangrijker is dat alle gevallen de vaak ‘stop gap’ (tijdelijke oplossings) aard

13
van veel zuinige innovaties aan het licht brachten. Veel frugal innovations vervangen alleen grootschalige alternatieven voor openbare infrastructuur, tenzij ze innovatie op systeemniveau benaderen. Ten slotte wijzen de conclusies op de noodzaak om waardecreatie op een andere manier te benaderen via het bedrijfsmodel en enkele toekomstige onderzoekslijnen. Waardecreatie bij frugal innovation moet verder gaan dan alleen het aanbieden van laaggeprijsde producten die passen bij de betalingsbereidheid van de consument, maar moet zich richten op het vergroten van de betalingsbereidheid van de consument door betere toegang tot informatie. Toekomstig onderzoek zou een systeembenadering van frugal innovation en de rol van de nieuwe middenklasse verder moeten onderzoeken.

14
Introduction
15
Introduction Conversation on addressing development challenges like clean drinking water, healthcare, and energy access shifted after Prahalad’s opening for the potential for business at the large untapped market at the Bottom of the Pyramid (BoP) (Prahalad, 2005). Moving beyond the traditional and often heavily criticized aid driven development approach (Banerjee & Duflo, 2011; Karlan & Appel, 2014; Moyo, 2009), Prahalad argued that consumers living on less than $8 per day do have purchasing power and with the right business approach this large demographic can be reached (Prahalad, 2012; Prahalad & Hammond, 2002). The optimistic view of the BoP posits that companies can be both profitable and meet basic needs through affordable products. Additionally, as western economies have stagnated particularly after the global financial crisis, there has been an increase in multinational corporations targeting emerging markets (Agarwal & Brem, 2012; Halme et al., 2012; Ojha, 2014; Schuster & Holtbrügge, 2012). Prahalad’s main message was that through designing appropriate low cost products and achieving high volume but low margins, the large demographic living on less than $8 per day could be reached profitably. In midst of focus on business oriented development interventions, innovations designed for the poor and by the poor have received increased attention (Hall et al., 2012; London et al., 2010; Ramani & Mukherjee, 2014). Frugal innovation is a concept that refers to innovating around resource, cost and institutional constraints (Bhatti & Ventresca, 2013; Bhatti, Ramaswami Basu, Barron, & Ventresca, 2018). Frugal innovation has gained ground in discourse on the BoP as it moves beyond earlier terminology like grassroots and jugaad innovations that are more small scale in nature and overlook the role of multinational companies and larger firms in innovating for the poor. Additionally, frugal innovation’s attention to quality fits with Prahalad’s argument that low income consumers are not only preoccupied with price but also have a desire for high quality products. However, to date, research on frugal innovation is primarily dominated by work defining the concept and case studies of common frugal innovations, particularly in India (Bhatti et al., 2018). Prahalad and subsequent authors helped open the conversation on the BoP as a market where profits can be gained by utilizing low margins but high sales and the need for appropriately designed innovations for this demographic. However, Prahalad’s work overlooks some of the complexities of doing business at the BoP. First, many of the companies Prahalad cites are not necessarily profit making but would instead be considered NGOs nor do they reach their intended low income group. Criticism of both frugal innovation and the BoP concept has focused on the issue of potentially exploiting the poor (Dolan & Roll, 2013; Hahn, 2009; Karnani, 2007; Meagher, 2018) and the challenge of operating a financially sustainable business in these markets. Ultimately there is an inherent tension between profits (value capture) and reaching low income consumers with products that fill needs like clean drinking water or energy (value creation). Balancing these two aspects requires appropriate financing and business models but also a deeper understanding of consumer preferences and decision making. Frugal innovation as a concept has potential to provide products that fill gaps left by the public sector (healthcare, water, energy) but a deeper understanding of how to reach the consumer beyond the technology is required. The core objective of the PhD research is to contribute towards an understanding of how frugal innovation can overcome the tension for firms operating in emerging markets between being profitable and contributing to local economic development.

16
Literature Review
Frugal Innovation Frugal innovation emerged as a concept around 2010 and has evolved from earlier ideas that focused on innovations for the poor, and making do with limited resources. Frugal innovation overlaps with and evolved from terms and concepts like ‘pro poor’, ‘grassroots’, ‘bricolage’, ‘BoP’, ‘jugaad’ innovations and Schumacher’s appropriate technology movement (Agarwal & Brem, 2012; Brem & Wolfram, 2014; Pansera & Sarkar, 2016a; Pervez et al., 2013; Ravishankar, 2016; Singh et al., 2012). Most of these earlier concepts focus on innovations for low income consumers, and lower resource use. Additionally, concepts like Jugaad innovation highlight the local entrepreneur and overlook scale and profitability (Kaplinsky, 2011; Radjou & Prabhu, 2014). Frugal innovation moves beyond earlier work on innovations for low income consumers by highlighting examples of multinational companies (MNCs) providing low cost, low resource use innovations, therefore taking a more business oriented and larger scale approach to reaching the BoP (Radjou & Prabhu, 2014). Moreover, frugal innovation has a stronger emphasis on the role of technology by highlighting how costs can be cut by stripping away unnecessary features or through the use of low cost but high technology features ( Zeschky, Winterhalter, & Gassmann, 2014). Bhatti, Ramaswami Basu, Barron, & Ventresca, (2018)’s work summarizes frugal innovation as the outcome of three sets of constraints: resource, cost and institutional. While frugal innovation has progressed as a field, a precise definition is lacking. In summary frugal innovation can be viewed as a focus on innovating around constraints with an emphasis on value for money and maintaining core functionalities. Existing frugal innovation literature can be divided into three main categories: conceptual work, a myriad of case studies primarily from India, and finally more recent work that explores frugal innovation beyond merely the design process (i.e.: sustainability, diffusion, and business models). Focusing on conceptualizations of frugal innovation and overlapping terms one of the core ideas of frugal innovation is innovating around cost constraints also often means low resource use and vice versa (innovating under resource constraints which can inherently lower costs). Therefore, some overlapping terms are bricolage which also involves ‘making do’ with low resource use, and improvisation which implies innovating under time constraints (Cunha et al., 2014). Frugal innovations could also be viewed as an outcome of resource constraints or ‘bricolage strategies’, since frugal innovations are a result of the coupling of resource constraints and customer price expectations (Ravishankar, 2016). While frugal innovation is predominantly focused on the BoP, some authors discuss the applicability of innovations designed for emerging markets also in developed markets. The term ‘reverse innovation’ refers to the process of bringing innovations created in emerging markets to the developed world (Agarwal & Brem, 2012; Shan & Khan, 2016; von Zedtwitz et al., 2015; M. B. Zeschky et al., 2014). While more recent frugal innovation literature has begun to move beyond conceptual work, the majority of the literature focuses on Indian case studies particularly in the health sector (Hossain, 2016). Frugal innovation case studies tend to frequently cite the same cases (Tata Nano, GE’s frugal ultrasound device, Mpesa, etc.) which are typically examples of MNCs innovating for BoP markets (Agarwal & Brem, 2012; K. Ojha, 2014; Pervez et al., 2013). The case analysis focuses on how these MNCs innovated around constraints to reach new low income market segments. However, the research overlooks whether these companies are reaching the very poor and what the local economic development impact is. Additionally, there are less cases exploring the role of SMEs and local innovators in frugal innovation (see: Bhaduri, 2016; Bhaduri & Kumar, 2011; Pansera & Sarkar, 2016). More importantly, frequently cited examples of frugal innovations highlight innovations that are replacing services

17
often provided by public infrastructure: health, water, energy, transport (Annala et al., 2018; Hossain, 2017; Levänen et al., 2015; Numminen & Lund, 2017; Prime et al., 2016). While low cost water filters or small solar lanterns may provide a better and cheaper service than the existing solution, they are replacements for functioning public infrastructure. Additionally, the low cost Tata Nano struggled to reach true low income segments and arguably increasing car ownership in a country where traffic and pollution are already problems is not a long term transport solution (Ray & Kanta Ray, 2011). More importantly, classifying small scale products like solar lanterns or water filters or Omo washing powder as frugal is questionable when considering the higher per unit costs (Annala et al., 2018; Karnani, 2009; Numminen & Lund, 2017; van Beers et al., 2012). Therefore, existing cases of frugal innovation seem to overlook a more systems perspective on innovation, and primarily highlight MNCs innovating around constraints to reach consumers that would be more aptly classified as middle class in emerging markets. Moving beyond specific case examples frugal innovation, more recent work has looked at the diffusion process for frugal innovation, and explored the role of business models in achieving frugality (Hossain et al., 2016; Rosca et al., 2016; Winterhalter et al., 2017). However, overall most frugal innovation literature tends to focus on the design process. There is minimal discussion in frugal innovation literature on how to reach low income consumers, rather there is an implicit assumption that lower costs will subsequently allow firms to reach the poor. Some authors have criticized the assumption of reaching the poor through frugal innovations and the work of Prahalad (Hahn, 2012; Karnani, 2009; Meagher, 2018), and others have explored the link between inclusivity (i.e.: how well innovations are reaching all members of society) (Baud, 2016; Nari Kahle et al., 2013) but practical exploration of consumer needs and how frugal innovation might reach low income consumers is lacking. When considering whether there is a role for frugal innovation in sustainable development due to its implied lower resource use, taking into account future demand and consumer preferences is important (Nocera, 2012). Some literature has explored the role for frugal innovation in relation to sustainable development with the main focus on the lower resource use aspect of frugal innovation (Basu et al., 2013; Nocera, 2012; Rosca et al., 2016, 2018). While frugal innovation as a concept opens up possibilities to reach lower income consumers in resource constrained environments profitability, there are several research gaps in this field. Overall frugal innovation research has not yet adequately addressed the issues of understanding how and why consumers purchase frugal products which ultimately relates to how firms can create and capture value. Second, there is a need to move beyond case study based work and develop a deeper understanding of the consumer perspective on frugal innovation. Finally, understanding the role of the consumer in frugal innovation moves frugal innovation beyond mere technological innovation, but also better understanding the role of business models in balancing profitability and development impact.
Business Models Research on business models has been done in a variety of contexts, and with various conceptualizations. First, a large body of work has explored conceptualizations of the business model and unpacking the concept of value within a firm or organization. Second, there has been research on the specificities of business models for specific markets or market segments such as the BoP and emerging markets. The term business model has evolved and became more popularized from literature on e-business. While various conceptualizations exist, the business model refers to how a firm or organization creates and captures values (Amit & Zott, 2001; Chesbrough, 2007) with the definition of value taking a slightly different meaning with respect to value capture and value creation. Using the resource based view of the firm there are two
18
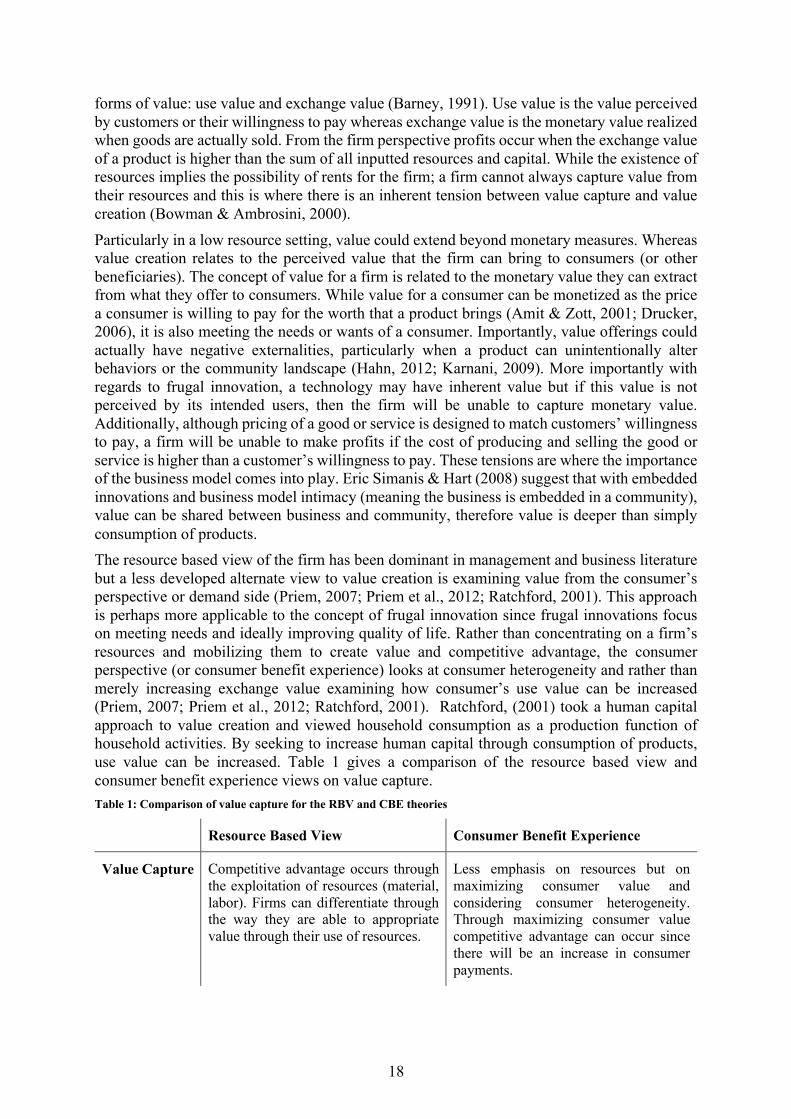
forms of value: use value and exchange value (Barney, 1991). Use value is the value perceived by customers or their willingness to pay whereas exchange value is the monetary value realized when goods are actually sold. From the firm perspective profits occur when the exchange value of a product is higher than the sum of all inputted resources and capital. While the existence of resources implies the possibility of rents for the firm; a firm cannot always capture value from their resources and this is where there is an inherent tension between value capture and value creation (Bowman & Ambrosini, 2000). Particularly in a low resource setting, value could extend beyond monetary measures. Whereas value creation relates to the perceived value that the firm can bring to consumers (or other beneficiaries). The concept of value for a firm is related to the monetary value they can extract from what they offer to consumers. While value for a consumer can be monetized as the price a consumer is willing to pay for the worth that a product brings (Amit & Zott, 2001; Drucker, 2006), it is also meeting the needs or wants of a consumer. Importantly, value offerings could actually have negative externalities, particularly when a product can unintentionally alter behaviors or the community landscape (Hahn, 2012; Karnani, 2009). More importantly with regards to frugal innovation, a technology may have inherent value but if this value is not perceived by its intended users, then the firm will be unable to capture monetary value. Additionally, although pricing of a good or service is designed to match customers’ willingness to pay, a firm will be unable to make profits if the cost of producing and selling the good or service is higher than a customer’s willingness to pay. These tensions are where the importance of the business model comes into play. Eric Simanis & Hart (2008) suggest that with embedded innovations and business model intimacy (meaning the business is embedded in a community), value can be shared between business and community, therefore value is deeper than simply consumption of products. The resource based view of the firm has been dominant in management and business literature but a less developed alternate view to value creation is examining value from the consumer’s perspective or demand side (Priem, 2007; Priem et al., 2012; Ratchford, 2001). This approach is perhaps more applicable to the concept of frugal innovation since frugal innovations focus on meeting needs and ideally improving quality of life. Rather than concentrating on a firm’s resources and mobilizing them to create value and competitive advantage, the consumer perspective (or consumer benefit experience) looks at consumer heterogeneity and rather than merely increasing exchange value examining how consumer’s use value can be increased (Priem, 2007; Priem et al., 2012; Ratchford, 2001). Ratchford, (2001) took a human capital approach to value creation and viewed household consumption as a production function of household activities. By seeking to increase human capital through consumption of products, use value can be increased. Table 1 gives a comparison of the resource based view and consumer benefit experience views on value capture. Table 1: Comparison of value capture for the RBV and CBE theories
Resource Based View Consumer Benefit Experience
Value Capture Competitive advantage occurs through the exploitation of resources (material, labor). Firms can differentiate through the way they are able to appropriate value through their use of resources.
Less emphasis on resources but on maximizing consumer value and considering consumer heterogeneity. Through maximizing consumer value competitive advantage can occur since there will be an increase in consumer payments.
19
Focusing on the second body of literature that looks at business models for specific contexts there has been some work on business models for frugal innovations (Rosca et al., 2016; Winterhalter et al., 2017) and a larger body of research that has looked at business models for lower income settings like BoP and emerging markets. Concentrating on work related to business models in low resource settings there are a few key challenges. First, the definition of value carries both negative and positive meaning in a BoP setting. Sometimes value creation can carry negative externalities. While products like small affordable washing power products provide a needed good, they also increase waste generated through packaging. These products might alter the consumption behavior of a community and change the environment (i.e. waste generated from the purchase single use plastic bottles, small washing powder packets or crowding out local entrepreneurs) (Bachnik & Szumniak-Samolej, 2013; Hahn, 2012; Karnani, 2009). Second, related to value capture and value creation are the constraints specific to the BoP. Both production (resource constraints) and transactional constraints (market access, power and security) are limited at the BoP which pose challenges for business models at the BoP (London et al., 2010). These constraints also mean that return on investment takes longer in a BoP setting (time compression diseconomies) (Seelos & Mair, 2007). Research on business models in emerging markets has explored a few ways to overcome these constraints. First, there is a higher importance for collaboration and partnerships such as public private partnerships or NGO collaborations to gain access to customers that are difficult to reach (Chaurey et al., 2012; Dahan et al., 2010; Munir et al., 2010). Second, because low income consumers have limited purchasing power there is the need to come up with multiple revenue streams, have dual business models or ‘cross subsidize’ products to keep prices low on products designed for a low income segment (Gebauer et al., 2017; Winterhalter et al., 2015). Third, because of institutional voids and market failure market creation for a product is often necessary (Khanna et al., 2005; Thompson & MacMillan, 2010). Market creation means creating demand for a product that was previously unheard of or desired. Finally, to navigate rapidly changing context and achieve scale business model flexibility is important (Chatterjee, 2016; Chesbrough, 2010; Chesbrough et al., 2006). Literature on business models for frugal innovation is limited and more importantly there is minimal work exploring the role of technology in new business models. In a low resource setting like in an emerging market technology like IT can assist in reducing transactions costs and create multiple revenue streams (World Bank, 2016). While literature on business models for emerging markets examines strategies that can allow firms to overcome some of the constraints inherent in a low resource setting, there is limited work exploring the role of the consumer in value creation and value capture. Ultimately, consideration of the business model also requires a deeper look at the end consumer.
Consumers in Emerging Markets An important aspect of innovations for emerging markets and the BoP as a market is whether these innovations will be widely adopted and consumed (Hall et al., 2014; Ramani & Mukherjee, 2014). Without a consumer base, firms operating in these markets cannot capture value (Seelos & Mair, 2007; Erik Simanis, 2011). In BoP and emerging markets there is a growing body of empirical and conceptual work exploring the specificities of low income consumers and the markets they exist in. Work on consumers at the BoP can be grouped into two main categories: research on BoP and emerging markets and consumers in general including different income groups, and research on consumer decision making and adoption in BoP and emerging markets. Literature on consumers in lower income markets like the BoP have not been clearly defined. Various cut off points exist to define the ‘bottom of the pyramid’ versus middle income/middle of the pyramid and higher income segments (Guarín &

20
Knorringa, 2014). Additionally, the markets these consumers operate in have a variety of overlapping terms (BoP, Middle of the Pyramid (MoP), emerging markets, subsistence markets, etc.) (Agnihotri, 2012; Kotler et al., 2006). Therefore, literature using the term BoP was explored but also more generally literature on consumers in low income markets. The first body of research explores consumers and markets at the BoP and how they differ in characteristics. Since Prahalad, a few authors have highlighted how BoP markets are more heterogeneous than initially assumed (Agnihotri, 2012; Kotler et al., 2006). Additionally, general marketing work has emphasized how beyond simply designing products for the poor, poverty is an inhibitor of participation in a consumer society both from the perspective of limited purchasing power but also the access to products and markets (Sheth, 2011; Viswanathan et al., 2014; Yurdakul et al., 2017). Access to products also related to the choices that BoP consumers have. Therefore, other authors have posited that purchase of products is based more on availability of products than actual preferences. If purchase decisions are merely based on product availability these authors argue that BoP consumers have inhibited freedom of choice due to the fundamental lack of choices in the markets they exist in (Bonsu & Polsa, 2011; Chikweche & Fletcher, 2011). In line with general work on consumers in emerging markets, a growing area of research is on the new middle class consumers. Early work on the new middle class focused on India and East Asia as these were markets with a large and increasing number of middle class (Banerjee & Duflo, 2008; Birdsall, 2010; Easterly, 2001), but increasingly this demographic is growing in sub-Saharan Africa (Melber & Nordiska Afrikainstitutet, 2016; Shimeles & Ncube, 2015; Thurlow et al., 2015). Most research is focused on defining this group from a quantitative perspective, with unclear estimates on how to define middle class cut off points and more importantly whether income measures alone are a good metric to define the middle class (Banerjee & Duflo, 2008; Brooks, 2017; Guarín & Knorringa, 2014; López-Calva & Ortiz-Juarez, 2014; Shimeles & Ncube, 2015; Thurlow et al., 2015). Finally, there is limited work looking at the demographic characteristics of the new middle class, their political implications, and consumption patterns (Cavusgil et al., 2018; Cheeseman, 2015; Chikweche & Fletcher, 2014; McEwan et al., 2015; Wietzke & Sumner, 2018). Consideration of the new middle class within discourse on innovations for emerging markets is important as literature suggests that companies are struggling to reach the actual bottom of the pyramid consumers (Chikweche & Fletcher, 2014a; Ray & Kanta Ray, 2011). More importantly, the new middle class plays a role in future consumption and resource considerations as rising incomes often imply an increase in demand for products. The second body of work involves studies investigating how consumers at the BoP make purchase decisions. Much of the literature on BoP consumers emphasizes how individual characteristics in particular education and income influence purchase decisions (Adkins & Ozanne, 2005; Nakata & Weidner, 2012; Ramani et al., 2012; Zanello et al., 2016). Secondly, research has shown how the low resource and low income setting of the BoP means that while products may be desired, poverty inhibits a consumer from making a purchase (Nakata & Weidner, 2012). Additionally, purchase decisions are made more instantaneously compared to a developed market due to lack of financial means and lack of product availability (Chikweche et al., 2012; Viswanathan et al., 2014). Moreover, the decision making process for BoP consumers is more of a joint process with a stronger role for different family members (Chikweche et al., 2012). Some studies investigated the effect of branding to consumers at the BoP, showing that there is a role for branding in product adoption (Chikweche & Fletcher, 2011; Rahman et al., 2013). Rahman et al., (2013) showed that consumers were more likely to adopt branded products compared to the unbranded alternatives.

21
Overall work on consumers at the BoP highlights the need to explore their heterogeneity and what drives purchase decisions (Agnihotri, 2012; Kotler et al., 2006). Additionally, the majority of the work on consumers at the BoP is qualitative and single country focused (Banbury et al., 2015; Chikweche et al., 2012; Chikweche & Fletcher, 2011; Rahman et al., 2013; Ramani et al., 2012). Particularly with regards to consumer behavior, understanding how and why consumers make purchase decisions for products that could be considered basic needs like water, energy and food exposes limited work (Sheth, 2011). Linking research on consumers at the BoP to frugal innovation and more generally business models/strategy in these markets highlights the need to better understand the role of consumers and their purchase decision making in both frugal innovation design and business models. The concept of value creation relates directly to the consumer and how they perceive the value in a product or service. Finally, a future looking view requires the need to further explore the role of the new middle-class consumers in sub-Saharan Africa and how rising incomes impact innovations and consumption.
Gaps in the literature Research on the frugal innovation has been dominated by case studies from India and conceptual work defining frugal innovation. Because frugal innovation as a concept spans several disciplines this research will link existing work in marketing, consumer studies, business and innovation economics and management, and development studies to frugal innovation. The following table summarizes the key gaps in the literature related to frugal innovation. First, while frugal innovation literature has moved beyond its initial conceptual and case study based focus, there is still a lack of quantitative investigations. Second, early frugal innovation promised meeting the dual goals of reaching bottom of the pyramid consumers with low cost and profitable products. However, these promises are not properly evaluated through the existing case examples. Finally, most frugal innovation literature tends to focus on the design process and less on the role of the business model and consumer preferences. Therefore, considering the gaps in the frugal innovation discourse, there are two additional streams of literature explored through this thesis work: business models for emerging market/BoP settings, and consumers studies at the BoP and emerging markets. Within business model literature there is a growing body of work exploring how business strategy and business models may look different in a BoP/emerging market setting. This work focuses on the flexibility of the business model, the need for multiple revenue streams, and the possibility to have different business models for different market segments. However, there is limited work exploring the role of the business model in achieving frugality and the role new technologies (like IT) can play in new business models. Finally, examining literature on consumers in BoP and emerging markets exposes a few gaps. First, while there is some discussion of heterogeneity of consumers in these markets there are limited quantitative investigations. More importantly considering the behavioral side of consumer decision making in particular for products that would be considered basic needs like clean drinking water there is limited work. Overall, the consideration of what drives purchase decisions, and the role of context and demographic characteristics of BoP/emerging market consumers should be included in frugal innovation literature.
22
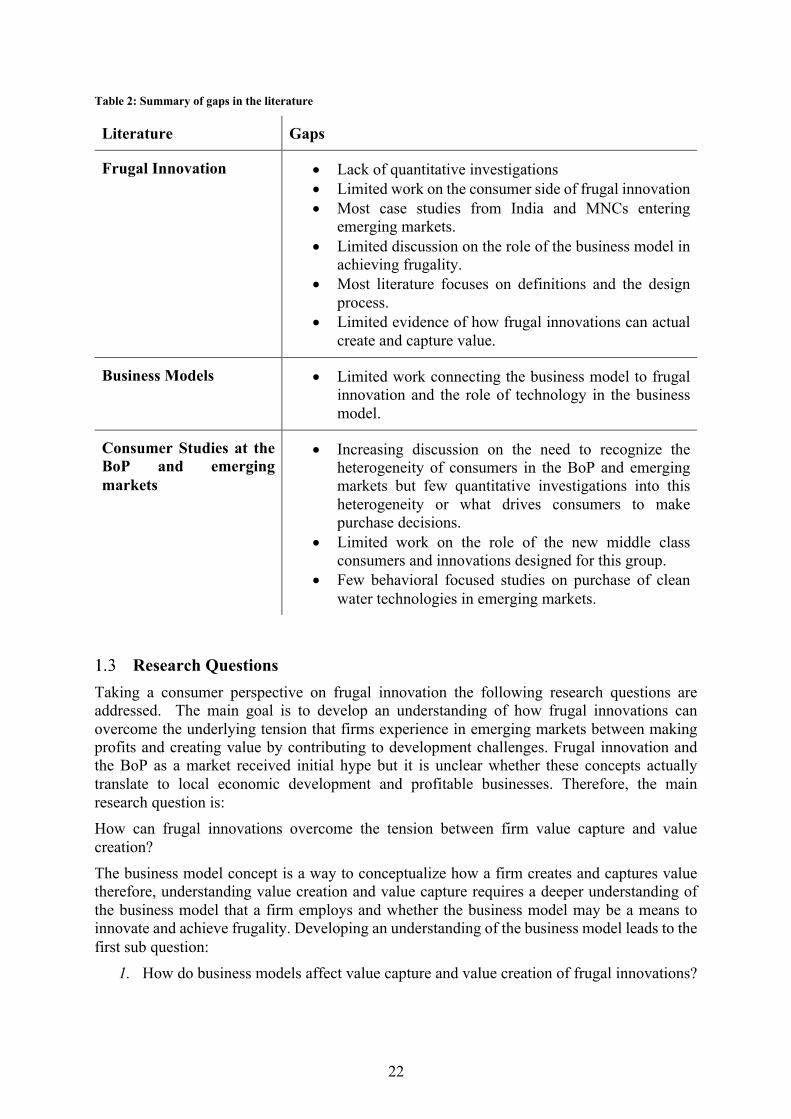
Table 2: Summary of gaps in the literature
Literature Gaps
Frugal Innovation • Lack of quantitative investigations • Limited work on the consumer side of frugal innovation • Most case studies from India and MNCs entering
emerging markets. • Limited discussion on the role of the business model in
achieving frugality. • Most literature focuses on definitions and the design
process. • Limited evidence of how frugal innovations can actual
create and capture value.
Business Models • Limited work connecting the business model to frugal innovation and the role of technology in the business model.
Consumer Studies at the BoP and emerging markets
• Increasing discussion on the need to recognize the heterogeneity of consumers in the BoP and emerging markets but few quantitative investigations into this heterogeneity or what drives consumers to make purchase decisions.
• Limited work on the role of the new middle class consumers and innovations designed for this group.
• Few behavioral focused studies on purchase of clean water technologies in emerging markets.
Research Questions Taking a consumer perspective on frugal innovation the following research questions are addressed. The main goal is to develop an understanding of how frugal innovations can overcome the underlying tension that firms experience in emerging markets between making profits and creating value by contributing to development challenges. Frugal innovation and the BoP as a market received initial hype but it is unclear whether these concepts actually translate to local economic development and profitable businesses. Therefore, the main research question is: How can frugal innovations overcome the tension between firm value capture and value creation? The business model concept is a way to conceptualize how a firm creates and captures value therefore, understanding value creation and value capture requires a deeper understanding of the business model that a firm employs and whether the business model may be a means to innovate and achieve frugality. Developing an understanding of the business model leads to the first sub question:
1. How do business models affect value capture and value creation of frugal innovations?

23
Two important aspects of the business model are the value proposition (i.e. the value that a company seeks to deliver) and the target group of customers. Without a proper understanding of the customer and what drives their purchase decisions, an innovation may go unpurchased and value is not captured. Therefore, the second sub-question deals with understanding the consumer.
2. How do determinants of purchase decisions for emerging market consumers lead to value creation and value capture?
Finally, focusing both on both the value creation (consumer side) and value capture (profits) aspects of business a related but more future looking question is the role of demand in frugal innovation. Much of the BoP business discussion hinges on high volume (in other words high demand) and low margins. Without achieving this, there may be a struggle to offer affordable products. Many frugal innovations fill gaps left by the public sector and may not be frugal particularly on a when considering higher demand levels. While an innovation may temporarily provide value and allow business financial sustainability (value capture), there are limits to value created when demand for goods (like water and energy needs) increases as is likely in emerging markets with the growing middle class and population growth. Therefore, the final sub-question addressed is the following.
3. How will future demand influence frugal innovations? The thesis is a paper based thesis therefore the specific research questions in each chapter assist in answering the main research question and sub-questions.
Empirical Approach The starting point for the research is the selection of four cases of businesses providing innovations in East Africa (Kenya, Uganda, Rwanda) that help address the research questions and complement each other. Additionally, the four cases selected are all located in East Africa (Kenya, Uganda, and Rwanda) to provide cross country comparison. While Kenya, Uganda and Rwanda are at slightly different levels of development in terms of GDP per capita, all three countries have a sizeable BoP population and a growing middle class (particularly in Kenya and in urban areas). More generally, the three countries could be classified as emerging markets. For each case, some background information is provided in addition to an overview of the case’s business model, link to frugal innovation, and rational for inclusion in the research.
Context While there is some overlap in problems faced by the selected three countries there are some contextual differences between Kenya, Uganda, and Rwanda. Earlier India was a focal point for frugal innovation case studies due to the already long history of local innovations like jugaad and grassroots. Focusing on sub-Saharan Africa and more specifically East Africa is justified due to both the economic growth the region has experienced over the last decade and the rapid proliferation of mobile phone technology (AfDB, 2016; GSMA, 2016a; World Bank, 2016). During the period of 2007-2015, inflation corrected GDP growth in the African continent was 4.6%, a growth rate that exceeds the global average during the same period (2.2%). At the same time, Africa is a global leader in mobile phone penetration and more specifically East Africa has the highest rate of mobile payments (Bughin et al., 2016; GSMA, 2016). While IT growth has spurred innovation in the region, most of sub-Saharan Africa is still plagued by poor water, health and energy infrastructure. By examining cases in the three countries, how contextual differences influence the business model, consumer preferences and strategy can be explored. Table 3 summarizes some key economic and demographic indicators for the three countries. While the data shows some overlap in development issues facing the region there are some
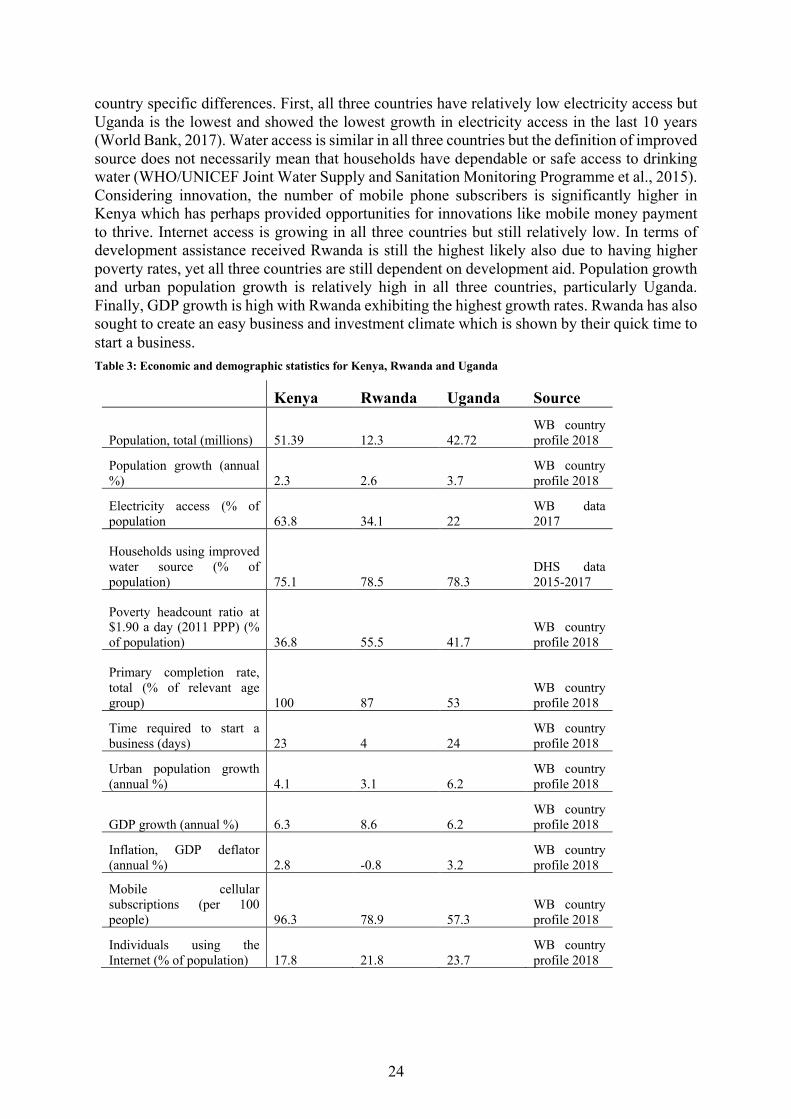
24
country specific differences. First, all three countries have relatively low electricity access but Uganda is the lowest and showed the lowest growth in electricity access in the last 10 years (World Bank, 2017). Water access is similar in all three countries but the definition of improved source does not necessarily mean that households have dependable or safe access to drinking water (WHO/UNICEF Joint Water Supply and Sanitation Monitoring Programme et al., 2015). Considering innovation, the number of mobile phone subscribers is significantly higher in Kenya which has perhaps provided opportunities for innovations like mobile money payment to thrive. Internet access is growing in all three countries but still relatively low. In terms of development assistance received Rwanda is still the highest likely also due to having higher poverty rates, yet all three countries are still dependent on development aid. Population growth and urban population growth is relatively high in all three countries, particularly Uganda. Finally, GDP growth is high with Rwanda exhibiting the highest growth rates. Rwanda has also sought to create an easy business and investment climate which is shown by their quick time to start a business. Table 3: Economic and demographic statistics for Kenya, Rwanda and Uganda
Kenya Rwanda Uganda Source
Population, total (millions) 51.39 12.3 42.72 WB country profile 2018
Population growth (annual %) 2.3 2.6 3.7
WB country profile 2018
Electricity access (% of population 63.8 34.1 22
WB data 2017
Households using improved water source (% of population) 75.1 78.5 78.3
DHS data 2015-2017
Poverty headcount ratio at $1.90 a day (2011 PPP) (% of population) 36.8 55.5 41.7
WB country profile 2018
Primary completion rate, total (% of relevant age group) 100 87 53
WB country profile 2018
Time required to start a business (days) 23 4 24
WB country profile 2018
Urban population growth (annual %) 4.1 3.1 6.2
WB country profile 2018
GDP growth (annual %) 6.3 8.6 6.2 WB country profile 2018
Inflation, GDP deflator (annual %) 2.8 -0.8 3.2
WB country profile 2018
Mobile cellular subscriptions (per 100 people) 96.3 78.9 57.3
WB country profile 2018
Individuals using the Internet (% of population) 17.8 21.8 23.7
WB country profile 2018

25
Net official development assistance received (current US$) (millions) 2474.8 1225.4 2008.1
WB country profile 2018
Development assistance per capita (millions US) 48.2 99.6 47.0
Authors calculation
Kenya Kenya is positioned in East Africa bordering Tanzania, Uganda, and Ethiopia and represents the second largest economy in Eastern and Central Africa. Recently, due to economic growth Kenya was classified as a lower middle income country. In spite of economic growth and investments in infrastructure, poverty and income inequality remain issues. Additionally, a significant portion of Kenya’s population lacks access to an improved drinking water source and grid electricity (World Bank, 2018). After decades of dictatorship under Moi, Kenya transitioned to a changeover of presidents with Mwai Kibaki in 2002. In subsequent elections particularly those of 2007, there were challenges with corruption and post-election violence. In 2017, after a contested election Uhuru Kenyatta won a second term as president. In addition to changeover of power and more democratic elections, after the post-election violence in 2007 Kenya took measures to decentralize power through a devolution strategy. Shifting much of governance to the local level as an attempt to decrease urbanization and boost opportunities in more rural areas. The decentralization policy is perhaps reflected in Kenya’s lower rate of urbanization as compared to Uganda (World Bank Group, 2020). While internet penetration is similar to Uganda and Rwanda, mobile phone penetration is very high in Kenya with nearly all of Kenya’s population being a mobile subscriber. Additionally, Kenya is the leader in Africa for mobile payments through the innovative Mpesa platform (GSMA, 2016; Jack & Suri, 2011). Finally, unlike many sub-Saharan African countries Kenya has a rising middle class which has implications for future consumption and innovation (Cheeseman, 2015).
Uganda Uganda is a landlocked country located in East Africa sharing borders with the Democratic Republic of Congo (DRC), South Sudan, Kenya, Rwanda, and Tanzania. While Uganda experienced rapid economic growth in the 1990s and early 2000s, growth has slowed in 2010 due to political unrest, weather and regional instability but more recently picked up again. Uganda is still classified as a low income country and is a significant recipient of foreign aid funds (World Bank, 2020). While the largest portion of aid money has gone to refugee programs, aid budget has also contributed to infrastructure projects in recent years. Compared to Kenya, Uganda’s infrastructure is severely lacking. Due to Lake Victoria, water supply is less of a concern but the water infrastructure is aging contributing to poor quality at the tap. Uganda’s post-independence government has been characterized by a lack of democratically elected leaders and military coups. Yoweri Museveni is Uganda’s current president and has held power since 1986. In the last nearly three decades Uganda has undergone public sector reforms that aimed to unbundle services like the electricity sector and stimulate more competition (Meyer et al., 2018a). Of the three countries under study, Uganda has the lowest electricity access and both highest urban population growth and overall population growth which could be contributors to high

26
youth unemployment. Additionally, Uganda’s educational achievements rates are lower than Rwanda and Kenya which could factor into how consumers make purchase decisions (World Bank, 2020).
Rwanda Rwanda is another landlocked, small East/Central African country bordering Uganda, Tanzania, Burundi and DRC. Rwanda’s post-independence history has been marked by ethnic conflicts between the two main groups in the country (Tutsis and Hutus) culminating in a violent genocide in 1994. Since the genocide Rwanda has made great strides towards stability and economic growth. President Paul Kagame has held power officially since 2000 but has also been a position of power (Vice President and Minister of Defense) since after leading the rebel forces that helped stop the genocide. In 2015 a referendum was held to remove term limits for Kagame, allowing him to win re-election in 2017 and offering the possibility of holding office until 2034 (World Bank Group, 2020). Rwanda has made strides in meeting development targets and improving infrastructure in a more top down approach. However, Rwanda has sought to provide a good investment climate and is number two in Africa for ease of doing business and the only low income country to be ranked in the top 30 worldwide (World Bank (Washington, District of Columbia), 2019). While Rwanda has sought to stimulate the private sector, development assistance is still high, and infrastructure like water and electricity access is still poor. However, in terms of improvement over the last 10 years, Rwanda has made strides in terms of increasing electricity access and educational achievements (World Bank Group, 2020).
Cases Four cases of what are initially presumed to be examples of frugal innovation have been selected to explore different parts of the research questions. Two of the cases (TAHMO and Dutch Water Limited) are part of a bigger research project that this PhD research was part of.
TAHMO In 2014, the Trans- African Hydro-Meteorological Observatory (TAHMO) was started by Delft University of Technology and Oregon State University to address the problem of poor weather monitoring on the continent by the co-creation of a low cost and simple ground weather station. Most sub-Saharan African countries are severely lacking in weather monitoring needs and while some aid based approaches have attempted to address this need, they have often failed due to lack of follow up maintenance. Therefore, the TAHMO approach was to create a station design that was affordable, simple and required minimal maintenance. Additionally, rather than only focus on the design it has been discovered along the way that a business model behind station diffusion is critical in order to insure the stations quick diffusion across the continent and sustainability. The initial station design was completed with input from an Africa wide design competition. TAHMO has started to roll out its network of robust weather stations in eleven African countries with pilots at scale in Kenya, Uganda, and Ghana. Over the past years, a new type of station has been co-developed that consists of an integrated sensor set that measures rainfall, incoming shortwave radiation, wind speed, wind direction, barometric pressure, air temperature, and relative humidity. Data is communicated through GPRS (General Packet Radio Services). The station runs on a solar panel about the size of half a business card. The station has no moving parts and all maintenance needed consists of dusting the station once a month.

27
Formally, TAHMO is a registered NGO but takes a business approach to the diffusion of the weather stations. Rather than giving away stations for free and risking lack of ownership and ultimately maintenance, TAHMO searches for partners that will mutually benefit economically from the data. However, the implementation and business model vary from country to country due to culture, development, geography and institutional differences. Primarily, the countries focused on for this research are Kenya, Uganda and Rwanda since at a policy level they have similar aspirations (focus on IT and entrepreneurship) but very different histories and governance. TAHMO pilots are already at scale in Kenya while in Rwanda they registered as a business (versus an NGO in Kenya) (van de Giesen et al., 2014). TAHMO’s business model is shown in Table 4. The frugal innovation aspects of TAHMO are clear both through TAHMO’s design approach (minimal maintenance, stripping away of unnecessary features, low cost but high tech) and their value proposition of low cost and low maintenance weather monitoring. Table 4: TAHMO's business model
TAHMO
Flexibility
• Governance, stakeholders and customers vary from country to country. • Station design is adjusted depending on country weather monitoring needs.
Distribution
• Depends on the country context. Stations set up primarily at schools and farms.
Stakeholders
• National Meteorological Agencies • Schools in sub-Saharan Africa and Europe/North America • Crop insurance companies • Small scale farmers • IT start ups • Mining companies • Telecom companies • Academic institutions
Governance
• Registered NGO. • Registration in each country depends on the country context (i.e.: NGO in Kenya,
Business in Rwanda). • Stations funded through grants and aid money; revenue generated primarily through
sale of the data.
Value Proposition
• Low cost and low maintenance weather monitoring. • Weather data for climate mitigation and adaptation.

28
TAHMO exposes two important research aspects: the role of technology in business model design and the importance of taking a systems approach to frugal innovation. TAHMO’s model has been to adapt both the design and delivery depending on country specific needs through an iterative approach.
Dutch Water Limited Dutch Water Limited (DWL) is a water company located north of Mombasa in Mtwapa. DWL was founded in 2006 through investment from two Dutch firms: Hatenboer and Reikon. The idea behind DWL was to utilize Hatenboer’s expertise with reverse osmosis purification to enter a new market where the need for clean drinking water was high. DWL serves three counties (Kilifi, Kwale, and Mombasa) in the region surrounding Mombasa (the largest city along the Kenyan coast). DWL utilizes reverse osmosis technology for water purification in a central factory. Water comes from a borehole located on the factory grounds. Traditionally, reverse osmosis filtration is not a low cost purification method, but DWL seeks to minimize production and distribution costs per liter of water by optimizing capacity. The lowest aspect of production cost is the purification process (at current capacity it is around 3 kSh/L). Therefore, the process of maintaining low costs is not confined to purification technology. Cost reduction occurs through optimizing production, reusable bottles, and the distribution model. Reverse osmosis (RO) is a water purification technology typically used on water that is brackish (salty). Membranes remove the salt and purify the water and most minerals from water which could affect taste compared to other purification methods. 1 Moreover, de-mineralized water has a lower pH value which could result in negative health effects compared to water that maintains some natural mineralization (Kang et. al., 2000). RO also produces waste water during the purification process. In the county that DWL’s plant is located in salt content is high but water quality would be classified as ‘fair’ according to WHO’s2 standards for total dissolved solids (TDS) (Makokha, 2019). However, in the region that DWL operates in, most of the competitor companies and particularly those that are properly certified utilize RO purification.
1 https://www.freshwatersystems.com/blogs/blog/what-is-reverse-osmosis accessed 16 February 2020 2 https://www.who.int/water_sanitation_health/dwq/chemicals/tds.pdf accessed 16 February 2020
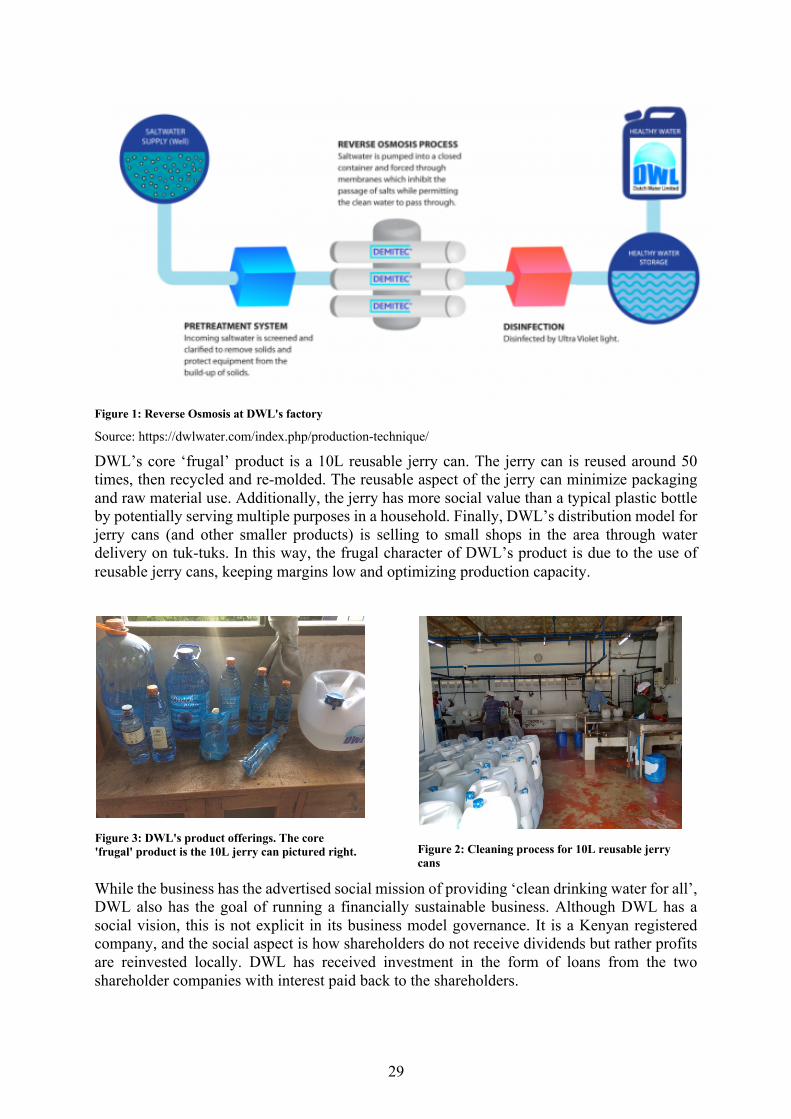
29
Figure 1: Reverse Osmosis at DWL's factory
Source: https://dwlwater.com/index.php/production-technique/
DWL’s core ‘frugal’ product is a 10L reusable jerry can. The jerry can is reused around 50 times, then recycled and re-molded. The reusable aspect of the jerry can minimize packaging and raw material use. Additionally, the jerry has more social value than a typical plastic bottle by potentially serving multiple purposes in a household. Finally, DWL’s distribution model for jerry cans (and other smaller products) is selling to small shops in the area through water delivery on tuk-tuks. In this way, the frugal character of DWL’s product is due to the use of reusable jerry cans, keeping margins low and optimizing production capacity.
While the business has the advertised social mission of providing ‘clean drinking water for all’, DWL also has the goal of running a financially sustainable business. Although DWL has a social vision, this is not explicit in its business model governance. It is a Kenyan registered company, and the social aspect is how shareholders do not receive dividends but rather profits are reinvested locally. DWL has received investment in the form of loans from the two shareholder companies with interest paid back to the shareholders.
Figure 3: DWL's product offerings. The core
'frugal' product is the 10L jerry can pictured right. Figure 2: Cleaning process for 10L reusable jerry
cans

30
There were several phases in DWL’s development. When DWL first entered the market there were no companies providing drinking water in re-usable plastic bottles. During the second phase, DWL’s distribution spread and their competitive position. Competitors were selling 5000 jerry cans of water/month in comparison to DWL’s 85,000. At the time of the research, DWL was in the new phase, having to adjust business activities to accommodate a sharp increase in excise taxes on water (since December 2015). Due to the increase, the price of a 10L jerry can of water is nearly half is taxes (excise and VAT). Therefore, the tax increase has compromised the vision of providing affordable drinking water. Although all bottled water manufacturers were initially affected by the excise tax increase, it appears DWL was the only company that has complied with fully pay the required tax, meaning that water prices for a 10L jerry can increased from 70 Kenyan shillings (kSh) to 130 kSh3 ( approximately 1.70 euros) while competitors sustained price levels of 70-80 kSh. Due to the tax increase, DWL was forced to become more flexible in their business model by selling higher margin water products to corporate clients like hotels. Finally, although DWL engages in other socially oriented activities like providing free water to local schools, these activities have not allowed for altering taxes on their water products. A breakdown of the costs associated with DWL’s 10L jerry are shown in the following table. Table 5: Price breakdown of DWL's 10L jerry can
Component Price (KSH)
VAT 17.93
Excise Tax 50
Production & Distribution costs4 32.73
Packaging costs5 39.50
Total Factory Price 130
Margin 7.7
Note : Prices are listed in local currency due to exchange rate differences between the time of data collection and the time of writing.
DWL’s distribution model is depicted in the following diagram. In the three counties of operation DWL has depots or distribution points where purified water is brought from the main factory. Each depot sends water on tuk tuks through sales areas to vendors that sell to the end
3 Currently 111 shillings is equivalent to about 1 euro.
4 These costs are for the production level at the time of data collection. At higher production, the per liter cost to purify water decreases. Data is from March 2017 and does necessarily reflect current costs and production levels.
5
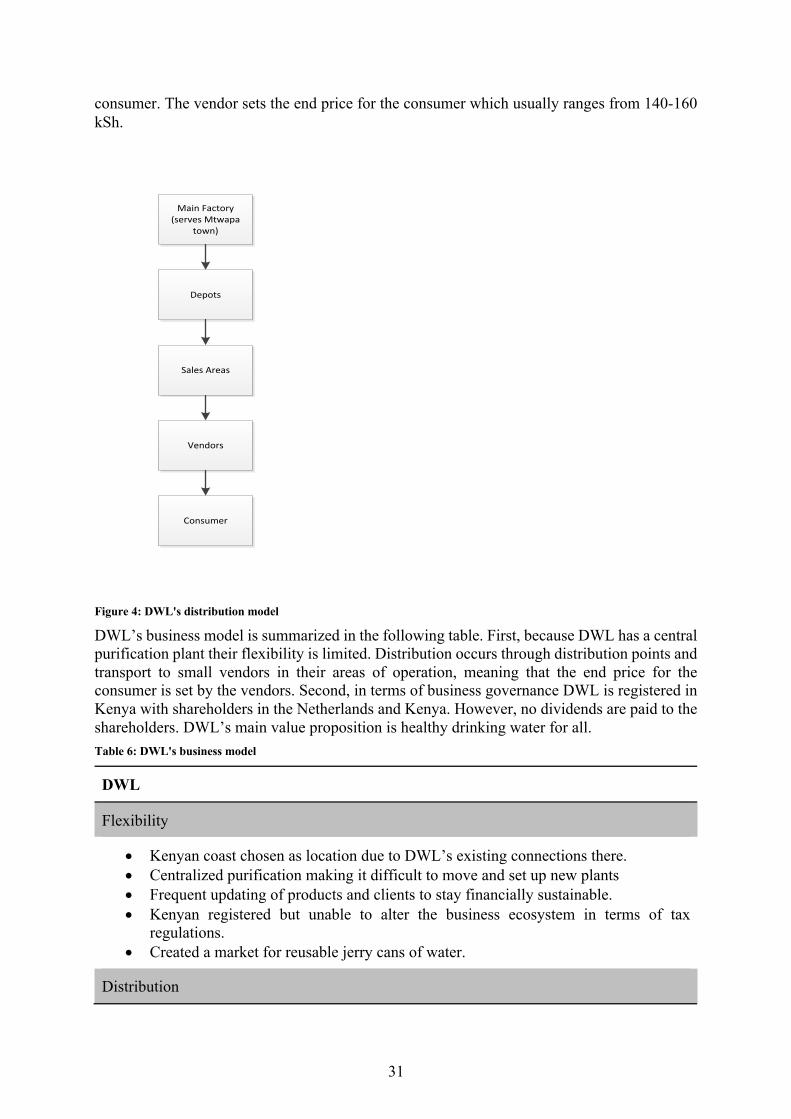
31
consumer. The vendor sets the end price for the consumer which usually ranges from 140-160 kSh.
Figure 4: DWL's distribution model
DWL’s business model is summarized in the following table. First, because DWL has a central purification plant their flexibility is limited. Distribution occurs through distribution points and transport to small vendors in their areas of operation, meaning that the end price for the consumer is set by the vendors. Second, in terms of business governance DWL is registered in Kenya with shareholders in the Netherlands and Kenya. However, no dividends are paid to the shareholders. DWL’s main value proposition is healthy drinking water for all. Table 6: DWL's business model
DWL
Flexibility
• Kenyan coast chosen as location due to DWL’s existing connections there. • Centralized purification making it difficult to move and set up new plants • Frequent updating of products and clients to stay financially sustainable. • Kenyan registered but unable to alter the business ecosystem in terms of tax
regulations. • Created a market for reusable jerry cans of water.
Distribution
Main Factory (serves Mtwapa
town)
Depots
Sales Areas
Vendors
Consumer

32
• Centralized purification. • Distribution through distribution points and tuk tuks transporting water to vendors. • Less price control since water is not sold to the end consumer directly.
Stakeholders
• Schools and orphanages who receive free water • Clients: hotels and schools, households • All Kenyan staff
Governance
• Registered Kenyan company governed by shareholders in the Netherlands and one in Kenya.
• No dividends to DWL shareholders. Profits reinvested into the company. • Investment through loans with interest paid to shareholders.
Value Proposition
• ‘Healthy drinking water for all’. • Minimal environmental impact. • Free water to schools and orphanages in the region.
The DWL case can be used to explore two aspects of the core research. First, cost is reduced by maximizing capacity and through the distribution model rather than making the purification technology itself cheaper. For one jerry can of water, the lowest component of production cost is the purification process. Second, DWL has the goal of ‘healthy drinking water for all’ which implies reaching low income consumers. However, with the tax increase DWL lost some market share and it is unclear whether they were reaching their target consumer group. Therefore, DWL provides an interesting case to investigate consumers at the BoP and what drives them to purchase products like bottled drinking water. Lastly, DWL is a case selected as part of the overall research project which necessitated its inclusion in this research.
Jibu Jibu, L3C (Low profit limited liability company)6 is a registered ‘benefit’ corporation currently selling bottled water in Uganda, Rwanda, Kenya and more recently Tanzania and Zambia. An L3C is a hybrid between a non-profit organization and traditional LLC corporation, essentially allowing a company to have more flexibility with investments to achieve a social mission while maintaining profitability. Jibu was founded in 2012, and began with simultaneous pilots in Uganda, Rwanda and Democratic Republic of Congo in 2013 with the intended goal of coming up with a model for providing affordable clean drinking water and shifting consumers from boiling to bottled water. Unlike many companies operating in emerging markets with social
6 https://www.forbes.com/sites/annefield/2014/08/22/another-reason-to-become-an-l3c/#647d9bee785a

33
missions, Jibu recognized the struggle to reach BoP consumers and yet recognized a gap for the ‘missing middle’ urban consumers. Therefore, Jibu explicitly targets middle income consumers. In 2014, Jibu began with a franchise model in Kigali and Kampala. Water purification is decentralized at a franchise location and conducted through UF (ultra-filtration) technology designed specifically for the conditions in each city. Franchises purify city water and package into various sizes of reusable bottles. Product type varies slightly from country to country with sizes ranging from 1.5L bottles to large dispenser bottles. Bottles are manufactured by an external company and branded with the Jibu logo. For the two countries under study, the commonly purchased product prices are given below. Table 7: Jibu water prices for Rwanda and Uganda
Country Product Initial price (€) Refill price (€)
Rwanda 20L bottle with tap 11.94 1.43
20L jerry can 4.78 1.43
7L bottle 4.78 0.86
Uganda 20L bottle with tap 4.93 1.23
5L bottle (no refill) 0.99
Jibu’s franchises purify public tap water (as all franchisees are located in urban areas) using solar powered ultra-filtration (UF) technology. UF also uses a five step purification process with membranes plus carbon activation to filter and purify water and can be used for most water sources. Jibu’s technology is low energy use and results in less water waste than RO technology (90% recovery of water used)7. However, UF does not remove dissolved salts so is not suitable for water with a high salt content like that on the Kenyan coast. Jibu’s UF filtration system is shown below.
7 https://www.engineeringforchange.org/solutions/product/solarpure-uf/

34
Figure 5: Jibu's UF filtration technology
Jibu has a unique business registration designation as an L3C which allows them to combine impact and financial return on investment explicitly in their business approach. The benefit corporation designation allows different types of investments, and requires impact reporting to be imbedded in the business. Additionally, the benefit corporation status requires that beyond financial reporting the company must also incorporate reporting on their social impacts8. Jibu seeks to provide the lowest priced refill water in the areas they operate. Jibu selects franchise owners through an interview process to ensure that the franchisees share Jibu’s social goals. An individual can become a franchise owner by paying a $1,000 licensing fee (Uganda rate) in exchange for assistance getting the franchise up and running, and the purification equipment. Franchises pay a per liter fee to Jibu Corporate for the water that is sold. In Rwanda, to incentivize franchise owners to reach the mass market and not go for easy customers like supermarkets and businesses, the fee per liter is reduced as production levels increase. While the average franchisee has production levels of about 2,500 L/day9, at levels of 8,000L/day the per liter charge is reduced by 50%. This is to incentivize Jibu franchises to sell directly to the consumer rather than selling water at marked up prices to super markets and businesses. Selling directly to consumers allows for higher volumes even though the sale price is lower. Each city of Jibu’s operation has been divided into zones that correspond to population density. In each zone there are one or two franchises (more in Kigali). In addition to franchises in each zone, Jibu has micro franchises that operate in the same zones. Micro franchises purchase water from the nearest franchise and resell it at a slightly higher price. While franchises are selected and managed by Jibu Corporate, micro franchises are managed by their corresponding franchise. The following figure describes Jibu’s model.
8 https://benefitcorp.net/what-is-a-benefit-corporation 9 2017 numbers from Jibu Corporate.
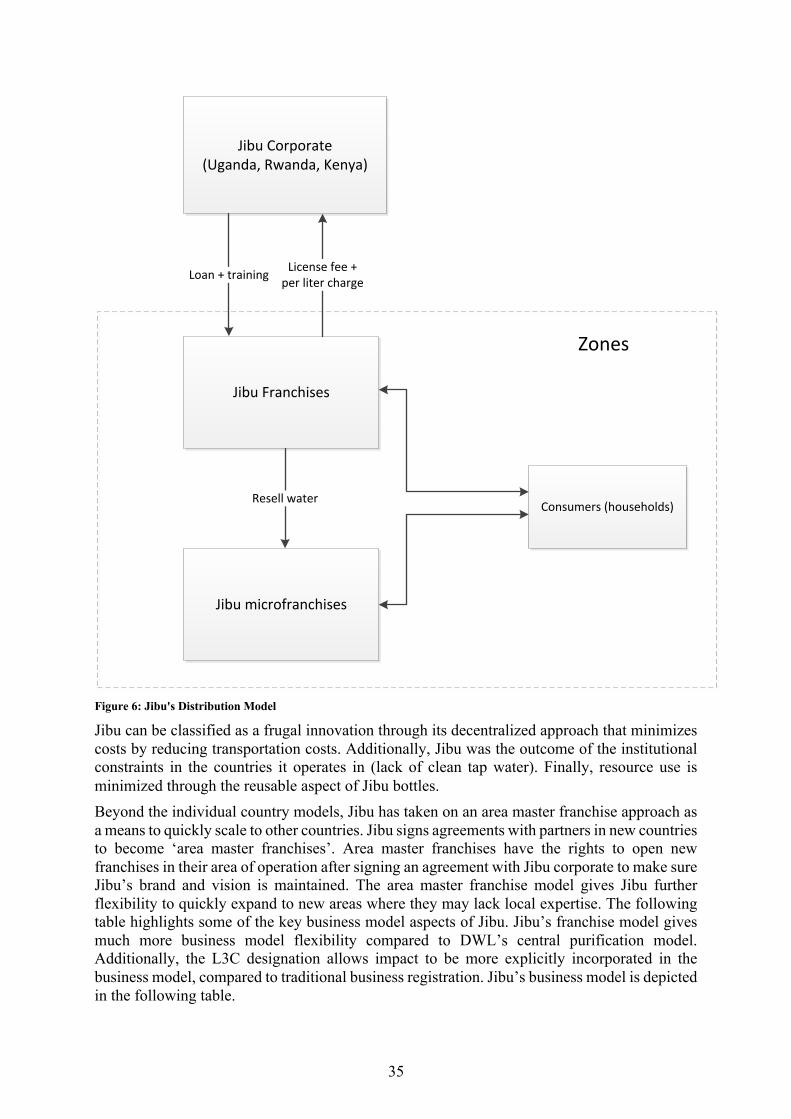
35
Figure 6: Jibu's Distribution Model
Jibu can be classified as a frugal innovation through its decentralized approach that minimizes costs by reducing transportation costs. Additionally, Jibu was the outcome of the institutional constraints in the countries it operates in (lack of clean tap water). Finally, resource use is minimized through the reusable aspect of Jibu bottles. Beyond the individual country models, Jibu has taken on an area master franchise approach as a means to quickly scale to other countries. Jibu signs agreements with partners in new countries to become ‘area master franchises’. Area master franchises have the rights to open new franchises in their area of operation after signing an agreement with Jibu corporate to make sure Jibu’s brand and vision is maintained. The area master franchise model gives Jibu further flexibility to quickly expand to new areas where they may lack local expertise. The following table highlights some of the key business model aspects of Jibu. Jibu’s franchise model gives much more business model flexibility compared to DWL’s central purification model. Additionally, the L3C designation allows impact to be more explicitly incorporated in the business model, compared to traditional business registration. Jibu’s business model is depicted in the following table.
Jibu Corporate (Uganda, Rwanda, Kenya)
Jibu Franchises
Jibu microfranchises
Loan + training License fee + per liter charge
Resell water Consumers (households)
Zones

36
Table 8: Jibu's business model
Jibu
Flexibility
• Can modify purification technology used in each country to fit the specific water quality in that context.
• Product offerings modified by country. • Basic model of franchising with the goal of franchises sharing Jibu’s vision of
reaching households. • Business ecosystem is researched prior to entering a market in order to adapt to
existing regulations.
Distribution
• Decentralized through zones of franchises and micro franchises. • Decentralized model reduces transport costs but makes quality control more
challenging.
Stakeholders
• Franchise owners • Public water utilities supplying water to franchise locations • Jibu corporate offices are a mix of international and local staff
Governance
• Registered L3C (Low Profit Limited Liability)
Value Proposition
• Low cost, quality drinking water. • Shifting consumers from boiling to bottled water. • Offering the lowest priced refill water on the market. • Reaching the missing middle of the pyramid
Jibu provides a contrasting case to DWL in the struggle to provide affordable drinking water. While Jibu operates in several countries, the two countries focused on for this research are Rwanda and Uganda since they are in the same region as Kenya and allow for cross country comparison with DWL. Additionally, Rwanda and Uganda are the two countries that Jibu entered first so their operations and consumer base are more established there. Secondly, while Jibu offers similar products to DWL, their business model is different, which allows the research to contrast two different business approaches to achieving a similar goal.
Solar Company The final case is a solar electricity business located in western Uganda. The business was set up by a Dutch NGO that provides initial investment, support and manages solar electricity businesses in several sub-Saharan African countries. In most countries the NGO acts as the

37
100% shareholder in the set up electricity companies (FRES, 2018). Due to confidentiality issues, the name of the company will not be disclosed. Rather than direct sale of solar products, the solar company operates as an electricity provider. Customers pay a connection fee corresponding to different service levels that provide varying electricity output. After connecting to the service, there is a monthly fee for each service level (the specific fee levels can be found in Chapter 5). The fee for service model allows the solar costs to be distributed and covers maintenance fees. The solar company in Uganda only sells solar home systems that range in size from being able to power a few lights and charging up to powering small electronics like TVs and radios. In Uganda most of the customers are small scale farmers who also have a small business as a side source of income. In most cases, the company only has customers in remote areas where there is no grid access, but as Uganda is seeking to expand grid access some customers have both grid connection and solar power (Howell, 2014). In the chosen country of study—Uganda—the company operates in the southwestern region of the country with a head office located Mbarara, Uganda. The solar provider has been in Uganda since 2010 and as of 2018 the company operates in 10 counties in southwestern Uganda (FRES, 2018). In Uganda Solar Provider Netherlands is the 100% shareholder.

38
Figure 7: Solar Provider's distribution model
Solar home systems can be viewed as a frugal innovation when compared with existing electricity alternatives (diesel generators and kerosene lanterns). Solar home systems being used for electricity are the outcome of all three sets of constraints: institutional (lack of grid access), cost (larger systems or paying the connection fee to the grid is too expensive), and resource (limited resources to extend the grid). The main aspects of the Solar Provider’s business model are depicted in the following table. The main characteristic of their model is the fee for service which influences the consumer base. Products are dependent on the country and the specific needs/geography (more dense areas can accommodate mini grids for example). Finally, the value proposition is providing affordable and sustainable electricity in areas without grid access or dependable grid access.
NGO Netherlands
Solar Electricity Provider (Uganda)
Energy Stores Service Centers
Rural SMEs Rural Institutions (schools, churches, etc) Rural households
Village Agents
German Solar Supplier
Loan + support
Counties

39
Table 9: Solar Provider's business model
Solar Provider
Flexibility
• Products change depending on the country (in West Africa more mini grids than in Uganda).
• Main revenue model is a fee for service. • Country entry determinant on policy, existing contacts in the country, and potential
market for solar. • Breaking even is determined by finding customers who can pay per month
consistently.
Distribution
• Products (German designed) distributed from main office to energy centers in different regions.
• Fees are collected through mobile money and village agents (cash). • Service centers in each region provide technical support.
Stakeholders
• Rural SMEs, institutions, and households • Ministry of energy and various sub-directives in each country • International donors (support Dutch NGO)
Governance
• Registered Dutch NGO. • Registered business/NGO in each country (depending on the country). • Electricity business must be financially sustainable after a designated period. • NGO is 100% shareholder in Ugandan company.
Value Proposition
• Affordable electricity for off grid/under grid communities. • Sustainable energy. • Local employment.
The solar case is another example of the role of the business model in keeping costs low but it also provides insights into the role of demand and frugality. This case is used to explore the longer term limitations of value creation in frugal innovation when the innovation is not suited to higher consumption levels. Therefore providing insight into the potential ‘stop gap’ nature of many frugal innovations.
Method In order to answer the research questions, two main methods were employed. First, because a significant portion of existing frugal innovation research is qualitative and case study based,
40
this research took a quantitative approach in order to get a more generalizable understanding of the types of consumers socially oriented firms are reaching in BoP markets. While a quantitative approach results in a loss of more in depth information it also allows for more generalizable statistical conclusions depending on the sample size. Particularly for gaining insights into consumers purchasing frugal innovations, a quantitative approach provides more generalizable results and the opportunity to gain quantitative information on consumer income levels. The power of the conclusions was limited by the relatively small sample size but still provide some quantitative insights into consumers at the BoP. More information on the power of the results is available in specific chapters. Second, as two of the research questions are more exploratory in nature (sub questions 1 and 3) a qualitative approach was taken through a combination of literature review, internal documents and interviews with key stakeholders involved in TAHMO, the solar company, and Jibu and DWL. Additionally, the qualitative research approach underlies all four of the selected cases as it provided more in depth information on the context, business model, and history of the innovations/firms. While a mostly quantitative method is a good tool to provide statistically generalizable results, quantitative conclusions are limited by the sample size, sample biases and survey design. Therefore, to better understand contextual factors and more in depth qualitative information, qualitative interviews were conducted during field work with key officials, employees of the businesses, and academics. For the solar case quantitative data from research conducted in 2014 on small business owners who are customers of the solar company was used (see : (Howell, 2014)). Data was collected through a field visit to Uganda and interviews with small business owners who use solar home systems from the company in three counties in western Uganda. Data merely provides some preliminary quantitative and qualitative insights into the profile of their business customers and their current and prior energy expenditures and electricity use. Because the data was on energy expenditures and electricity use of customers it is unaffected by the earlier time of data collection. More recent statistics on electricity penetration, electricity tariffs in Uganda, and tariffs from the solar company were collected for the purpose of this research. The two chapters on the two water companies employed a primarily quantitative survey approach with consumers and non-consumers of the two companies. Jibu collected data on their consumers in Rwanda and Uganda in December 2016 and March 2017 respectively through phone interviews. Using the consumer survey Jibu designed a similar survey was used for DWL consumers and non-consumers as point of comparison. As a result, questions regarding timing of purchase and the definition of a consumer was modified to fit Jibu’s survey. The surveys used for all consumers and non-consumers can be found in the Appendix. The survey focused on purchase habits and demographic related questions. Wealth was primarily measured using the asset based Progress out of Poverty Index (PPI). The PPI is a country specific asset based measurement tool that is based on household questionnaires. The PPI score has its limitations since it does not directly measure purchasing power. Additionally, because the set of asset questions are country specific while the scores can be directly compared across countries it is difficult to make comparisons beyond direct comparison of the PPI score. Sample randomization was done through stratified random sampling where randomization occurred at the sales area or zone level. By stratifying the sample, consumers could be grouped by geographic area and geographic specific effects could be assessed. The non-consumers interviewed in all three countries were part of a small behavioral experiment. A randomized control trial (RCT) approach was employed so that the effect of having an experience with water could be isolated. By randomizing ‘treatment’ (in this case a free water sample) the effect of having an experience with water could be isolated from other compounding factors like respondent individual characteristics. While an RCT is an effective tool to assess the effect of

41
various interventions, the conclusions can be limited by the sample size and survey design. Additionally, most RCTs focus on one context/country and are not necessarily generalizable to other contexts (White, 2014). To provide some external validity, this thesis chose to sample from two companies in three countries using a similar setup. RCT’s are effective in isolating the effects of specific interventions and are not often used in marketing studies in part due to the high costs and often lack of real-world conditions (Simester, 2017). Moreover, a RCT’s conclusions can be dictated by the representativeness of the sample. In this case, the focus was a small sample of consumers from the two bottled water companies therefore conclusions were not generalized beyond this group. More information on the research design can be found in the individual chapters. More specifics on the data collection method and survey set up can be found in each specific chapter. The following table provides an overview of the data collected in each country and the timeline. Table 10: Overview of data collected
Date(s) Case Type of data collected
3/2014-7/2014 Solar Company
Qualitative data on the company structure, interviews with personnel. Main field visit in Uganda with interviews with SMEs: April 2014.
2/2016-6/2016 General Qualitative interviews with experts (business models at the BoP, BoP innovation, etc.).
3/2016-12/2016
TAHMO Qualitative interviews with TAHMO personnel and stakeholders, company documents
6/2016 TAHMO, Jibu, DWL
First field visit-site visits to TAHMO, Jibu Rwanda, and DWL, informal interviews with key staff
10/2016-6/2017
Jibu, DWL
Main field work
10/2016-3/2017
DWL Preparation of surveys, hiring of enumerators, interviews with DWL staff, water experts, and water officials in Kenya. Observation of bottled water market on Kenyan coast
12/2016 Jibu Rwanda
Jibu company conducted survey of Jibu consumers
3/2017 DWL, Jibu Uganda
First survey round with DWL consumers and non-consumers, Jibu company conducted survey of Jibu Uganda consumers
4/2017 DWL Second survey round with DWL consumers and non-consumers
5/2017 Jibu Uganda
Interviews with Jibu Uganda staff, first round of surveys with Jibu Uganda non-consumers

42
5/2017-6/2017 Jibu First round of surveys with Jibu Rwanda non-consumers, interviews with Jibu Rwanda staff, follow up survey in Jibu Uganda
7/2017 Jibu Rwanda
Follow up surveys with Jibu non-consumers
10/2017 Jibu Rwanda
Follow up phone interviews with correct PPI questionnaire with Jibu non-consumers
Outline of Thesis and Terminology The thesis is structured into four chapters addressing the research questions and a final concluding chapter that summarizes the results, provides some overarching conclusions related to frugal innovation, limitations and future research lines. Each individual chapter corresponds to a journal article therefore there are some slight differences in terminology used in each chapter depending on the paper focus. Frugal innovation as a concept spans multiple market segments with most of the focus being in BoP (very low income with often unclear cut off points) and more generally emerging markets. While the overall research question and sub questions address more general themes the research questions in each chapter represent small questions that assist in addressing the more general research questions. Chapter 2 introduces the concept of value creation and value capture and its relation to the BoP and frugal innovation. A thorough literature review on business models and specifically business models at the BoP and emerging markets is provided. The chapter explores the role of IT in both frugal innovations and new business models. Through the use of the case of TAHMO, the role of IT and its potential in creating new business models is explored. The TAHMO case additionally provides insight into the dual challenge of value creation and value capture in a BoP setting. Chapters 3 and 4 focus on the two water cases and take a quantitative approach. The main goal of these two chapters is to begin to unpack the consumer side of value creation and what drives purchase decisions in emerging markets. Chapter 3 investigates the heterogeneity of BoP consumers in three countries by looking at differences in consumers based on their time of water purchase. Local factors (such as when water was available in certain areas) and demographic factors (education, income, etc.) were accounted for. Because much of frugal innovation literature focuses on the BoP. Chapter 3 zooms in on literature on BoP consumers. Chapter 4 extends the consumer work further through a behavioral study on non-consumers of the two water companies in Kenya and Rwanda. The study provided insights into what drives non-consumers to purchase bottled drinking water. Chapter 4 furthered the look at consumers in emerging markets by examining the middle of the pyramid consumers and the limited literature studying them since both Jibu and DWL operate in markets with middle class/middle of the pyramid consumers (MoP). Finally, chapter 5 takes a critical and future look at frugal innovation. Value created through frugal innovations may be limited when demand increases. Through a case illustration of a solar energy company, the frugality of solar home systems is assessed. The case provides an additional example of the role of the business model in reaching a large consumer base and keeping costs low but also exposes how some frugal innovations may not be the most efficient or cost effective when compared to larger scale infrastructure. Additionally, chapter 5 provides an up to date overview of the current frugal innovation literature in order to pose some future research directions.

43
44
Value capture and value creation: The role of information technology in business models for frugal innovations in Africa10
10 This chapter is co-authored and published as: Howell, R., van Beers, C., & Doorn, N. (2018). Value capture and value creation: The role of information technology in business models for frugal innovations in Africa. Technological Forecasting and Social Change, 131, 227-239.

45
Introduction Advancements in information technology (IT) have changed the economic landscape in Africa by creating opportunities for new and cheap innovations. Two accelerating trends facilitated these developments: increasing computing power and decreasing prices per unit of computing power (Nordhaus, 2007). IT applications are often considered important promoters of economic development by reducing information costs, promoting innovation and increasing inclusion (World Bank, 2016). Although sub-Saharan Africa has the lowest IT development index of any region, it has also seen the fastest increase in mobile phone access, a trend that has stimulated innovations such as mobile money payment (Pick & Sarkar, 2015). Two new possibilities of IT applications are 1) new and low-cost innovations due to more equal access to information and ease of inventing which increase the economic development potential, 2) new business models that can allow the low-cost innovations to realize this potential economic development. The combination of IT innovations like mobile payment with the rapid diffusion of mobile phones and the sharp decrease in sensor technology prices provides opportunities for innovators to design innovations that more accurately reflect the local preferences and values of consumers that live in resource-constrained environments. The second possibility – new business models – has not received much attention in the academic literature yet (Hossain, 2016; London, Anupindi, & Sheth, 2010). The low-cost and value-sensitive designed innovations often made possible by IT are an example of so-called frugal innovations (Y. A. Bhatti, 2012; Rao, 2013a). One of the goals of frugal innovation is reducing technological complexity without sacrificing user value. Frugal innovations build upon the idea of innovating around resource-constraints typical in Africa and maximizing value for money (Bhatti, 2012). A sector in which frugal innovations can have an important impact in African countries is the agricultural sector (Aker, 2011; Nakasone, Torero, & Minten, 2014). As rain-fed agriculture is the backbone of many African societies, agricultural outputs can be improved by accurate weather forecasting. Weather forecasting on the African continent is limited due to the sparse and poorly maintained network of weather stations across the continent (Snow et al., 2016). This paper examines the role of business models in addressing the dual business challenge of value capturing and value creation. Value capturing refers to revenue generation for the innovating organization and value creation relates to the impact of the innovation in the local economic and social environment. Scant research exists on exploring how business models can assist in overcoming the tension between profitability and development impact. Although research exists on the role of mobile phone access and IT in development (see (Aker & Mbiti, 2010; James, 2009, 2012, 2016)) less research examines the role of IT in business models and frugal innovation diffusion. Technological advancements like IT have enabled new business models for frugal innovations, but frugal innovation literature is in its infancy and is limited in its exploration of how to successfully bring these innovations to the market from a business perspective. While much of the literature on frugal innovation is focused on India, this paper focuses on the African context. Therefore, the research question addressed in the paper is: How has IT advancement influenced new business models for frugal innovations that contribute to the dual business challenge of value capture and value creation in Africa? In the next section, IT advancements and frugal innovations as a new phenomenon are described. In order to set the context for the necessity of business models, in section 3 the dual business challenge of value creation and value capture are defined and described in relation to Prahalad’s Bottom-bottom of-the-Pyramid concept. Section 4 picks up the lines of sections 2 and 3 through a review of business model definitions and the role of IT in their development. The application of business model literature and the role of IT in creating and capturing value

46
are examined in section 5 through the lens of a case study, a frugal weather station system that is currently being deployed across the African continent. Section 6 provides discussions about this case and its relation to literature. Conclusions and possible future research lines are presented in section 7.
Information Technological Advancement and Frugal Innovation Recent interest in and occurrence of frugal innovations relates to the emergence of new technologies in the last two decades, particularly information technologies. IT is considered as a General Purpose Technology (GPT) (Jovanovic & Rousseau, 2005). GPTs are pervasive for society, experience rapid improvements and declining user costs over time due to externalities of technical systems, and help spawn innovations (Lipsey, Carlaw, & Bekar, 2005). Examples of GPTs are the steam engine in the 17th century and electrification of factories and households in the beginning of the 20th century. The resulting innovations are not necessarily produced only by high-technology IT firms but are also created by enterprises supplying new products or production systems using IT platforms. The disruptive character of IT as a GPT together with the reduction of user costs over time has created opportunities for innovators and users to re-design or create newly designed frugal innovations. In the 1950s and 1960s Multinational Corporations (MNCs) were the main vehicles for technology transfer from developed to developing countries. Technology was designed with the developed country’s requirements and needs in mind and, via MNC affiliates, applied to products for developing countries’ markets. The result was flawed as it led to the use of labor-saving technologies for labor abundant countries with relatively low-priced labor and hence small potential to contribute to local economic development (Jones, 2010). In 1973, Schumacher introduced the idea of appropriate technology. Schumacher’s focus was on creating small scale technologies with the locality in mind either through design or manufacture of the product (Kaplinsky, 2011; Schumacher, 2011). However, the emphasis on the locality, limiting resource use, and minimizing harm through the use and design of technology that fits with its intended users was criticized for being more charity- or non-governmental organization (NGO)-focused (Kaplinsky, 2011). The Indian equivalent to innovation on a local scale is Jugaad, a term that emerged from India in the 2000s. Like appropriate technology, Jugaad has been a bottom-up and needs-based approach with a strong focus on the local innovator. Jugaad is a Hindi word that means ‘hack’. Jugaad innovations are innovations that make do with limited resources and perform basic functionalities (Brem & Wolfram, 2014). Frugal innovation could be viewed as an extension of these two terms, with fewer limitations on the local dimension of the innovator, and greater focus on wider diffusion of innovations. The link between high and low technology as well as the profit motive may give the concept of frugal innovations the opportunity to become a link between the standard technology transfer ideas to the appropriate and/or jugaad kind of technology (see Table 11).

47
Table 11: Categories of literature on technology production for and in developing countries
Category Features
Technology Transfer Large scale technical systems designed for developed countries and implemented in developing countries
Appropriate Technology Small scale, locally made/designed
Jugaad Innovation ‘Good enough’, grassroots, meeting local needs, bottom up approach
Frugal Innovation Low resource use, high quality, created under cost and resource constraints but often with high technology, can be top down or bottom up, much of the recent literature is focused on MNC entering BoP markets through frugal innovations.
Much of the literature on frugal innovation emphasizes the reduction of costs that can come through supply factors such as stripping away of unnecessary technological features, lower resource use or use of new technology (Radjou & Prabhu, 2014; Rao, 2013; Tiwari & Herstatt, 2012; Tiwari, Kalogerakis, & Herstatt, 2014; Zeschky, Winterhalter, & Gassmann, 2014). More recently, the term frugal innovation is considered to refer to innovating around constraints (Rao, 2013; Zeschky et al., 2014). Here the frugal innovations are demand-driven as they are induced by creative ideas to circumvent or change technological, institutional and organizational constraints. Bhatti & Ventresca (2013) discuss how frugal innovation can be conceptualized and propose that frugal innovation is the outcome of three sets of constraints: resource scarcity, institutional voids or complexities, and market affordability. Considering the three constraints that Bhatti mentions, it could be argued that many frugal innovations are meeting needs that are often public goods/infrastructure-related since these services are typically lacking in resource constrained environments due to poor governance and institutions. Frugal innovations could also be viewed as outcomes of resource constraints or ‘bricolage strategies’, since frugal innovations are a result of the coupling of resource constraints and customer price expectations (Cunha, Rego, Oliveira, Rosado, & Habib, 2014; Ernst, Kahle, Dubiel, Prabhu, & Subramaniam, 2015; Ravishankar, 2016). However, frugal innovation literature mostly discusses the cost reduction being achieved through the design and less attention is paid to the business model (Hossain, 2016). Frugal innovations designed for low income consumers present a way to address consumers in the BoP and emerging markets, however business models are also necessary to address the BoP. While there is some discussion of the ‘disruptive’ potential of frugal innovations (see (Rao, 2013)) and how frugal innovations can be the outcome of lower-cost high technology, there is limited work on how to bring innovations to the market and the role of the business model (Hossain, 2016; Hossain, Simula, & Halme, 2016). With new innovations such as mobile money payment and the rapid diffusion of mobile phones on the African continent, there is potential for IT enabling both new innovations and their diffusion. IT has different properties than most GPTs, and these characteristics are what provide opportunities for frugal innovation. First, IT reduces transaction costs, a characteristic that plays a role in diffusion of innovations, particularly in an emerging market setting. Secondly, the decreasing sensor prices over time that characterize a GPT like IT has allowed lower cost innovations like frugal innovations to emerge. Finally, IT has externalities that also allow for cost reduction and multiple uses. One of the characteristics of IT is its ability to create a platform that makes developing different software products cheap. The platform aspect of IT means that the marginal cost of adding additional products or functionalities to an innovation is close to zero. Externalities play a role

48
in developing frugal innovations that have multiple uses and therefore more value for their intended users. While IT plays a role in frugal innovation, literature discussing IT and frugal innovation is minimal. Heeks (2012) discusses IT innovation in emerging markets and different modes to create suitable IT innovations for low income consumers. One possibility is frugal innovation, but his discussion does not elaborate on bringing these innovations to the market. While there are examples of IT related frugal innovations, like GE’s affordable ultrasound device or Google’s low-cost smart phone, the discussion does not extend to the enabling role of IT in the business model (Radjou & Prabhu, 2014). Finally, case studies of frugal innovations in the African context, especially those focusing on how to diffuse frugal innovations are limited. Ernst et al. (2015) look more generally at ‘affordable value innovation’ and the performance of these innovations. Their discussion focuses on how well MNCs versus local firms are able to bring innovations to the market in price-sensitive market segments. Recent literature also explored diffusion patterns of frugal innovations, but the cases selected were predominantly India focused (Hossain et al., 2016). Although there are limited studies on frugal innovation in the African or global context (see: Hossain et al., 2016; Hyvärinen, Keskinen, & Varis, 2016; Peša, 2015, 2017) most case studies and examples of frugal innovation and BoP innovations have been predominantly focused on the Southeast context (see:Pansera & Owen, 2015; Radjou & Prabhu, 2014; Ramani, SadreGhazi, & Duysters, 2012; Tiwari, Fischer, & Kalogerakis, 2017; Tiwari et al., 2014; Tiwari & Herstatt, 2012). Therefore, there is a need to explore frugal innovations in other emerging markets such as sub-Saharan African countries.
Dual Business Challenges and the Bottom of the Pyramid
Bottom of the Pyramid Prahalad and Hammond (2002) first introduced the idea of doing business with the poor and the potential to tap into the large number of consumers living at the ‘Bottom of the Pyramid. Since Prahalad's work, research has been increasingly focused on the vast market at the BoP or those living on less than $8 per day (Prahalad, 2005). This is an untapped market in which companies can both make a profit and meet critical needs through their affordable product offerings to poor consumers. In particular, as high-income customer markets are saturated, many multinational corporations from Western and non-Western countries have targeted the seemingly large market in emerging markets. Prahalad (2012) sketches out that the global competitiveness agenda will be set in the BoP markets. Although Prahalad’s work has provided a new perspective of doing business in emerging markets, it also has some shortcomings. Firstly, Prahalad’s work focuses on emerging markets in Asia, particularly in India and there is less literature examining BoP markets and innovations in Africa. A focus on African countries as emphasized in this paper is justified due to the rapid economic growth sub-Saharan Africa has experienced. For example, inflation correct GDP growth in the period 2007-2015 in the African continent was 4.6%, which is far above the average real GDP growth at world level (2.2%). In sub-Saharan Africa, Kenya, Rwanda and Uganda showed inflation corrected GDP growth percentages in this period of 5.1%, 7.5% and 6.5% respectively (IMF, 2016). These growth numbers provide more purchasing power for an increasing group of people that are raised out of deep poverty (purchasing power of less than $ 1.25 a day) and hence provide opportunities for more business activities in these economies. However, many of these growth numbers are merely the effect of booming commodity prices due to increased demand fueled by China’s need to develop infrastructure, which suggests,

49
there is a need to develop local innovation capacity in Africa (Busse et al., 2016; Kaplinsky, 2013; Kaplinsky et al., 2007). Additionally, the ratio of mobile phone penetration to fixed lines is some of the highest in the world on the African continent (James, 2009). In a recent report, it was estimated that the mobile phone industry drove 6.7% of Sub-Saharan Africa’s GDP and that mobile subscribers will reach half a billion by 2020 (GSMA, 2016). This phenomenon has given rise to new payment modes and interventions that exploit the mobile phone’s ability to lower transaction costs (World Bank, 2016). In a recent McKinsey report, it was estimated that the internet could drive 10% of Africa’s GDP by 2025. In particular, East Africa is a good example of the role of IT and how its specific context has led to diffusion of new innovations. Not only have many East African countries become important centers for new consumption, but East Africa is also a global leader in mobile payments (Bughin et al., 2016). Finally, IT and mobile phones also play a role in big data usage which has the potential to impact public sector focus areas such as disease control. Big data are currently underutilized in many emerging markets (Amankwah-Amoah, 2016). However, data revenue as a percentage of service revenues in African economies is still lower than other regions (18% versus 23%) (GSMA, 2016). In addition to the need to consider other contexts in the BoP discussion, Prahalad’s thesis seems to be an oversimplification of the complexities of doing business with low income consumers and the cases he cites are not examples of profit-making companies (Crabtree, 2007; Karnani, 2007, 2009; Kolk, Rivera-Santos, & Rufin, 2014). Additionally, the more ‘top-down’ oriented approach of Prahalad ignores the role of producers and consumers at the bottom (Hart & London, 2005; Karnani, 2009; London et al., 2010; Simanis & Hart, 2008). George, McGahan, & Prabhu (2012) argue that top-down interventions have not significantly contributed to economic development and the focus should shift to ‘inclusive innovation’. Examining not only China’s role in Africa in relation to booming commodity prices but also the rise of cheap Chinese imports that have often pushed out local producers (see: (Busse et al., 2016; Kaplinsky et al., 2007), considering inclusivity and co-creation in business activities may be an alternative. Therefore, recently literature on the Bottom of the Pyramid has shifted from top-down versus bottom up or grassroots initiatives to ‘co-creation’. Co-creation refers to initiatives involving both multinational firms and consumers, and local firms in the research and design process in emerging markets (Arora & Romijn, 2009). Historically, some scholars argue that Africa has depended on a strategy of ‘extraversion’ or dependence on outside intervention (Bayart & Ellis, 2000; Peiffer & Englebert, 2012). Therefore ‘inclusive innovation’ and co-creation could represent an alternate approach for sub-Saharan Africa to develop. Given the discussion of the challenges of actually reaching the poor with new innovations, business models and financing are very important in low income consumer markets because they provide a way to make a product or system both more accessible and affordable (Prahalad, 2012). However, there are several key issues related to business model development in a BoP context. Firstly, while a business model may be profitable from the firm’s perspective it could present negative impacts for the market in which the firm is operating (Karnani, 2009). Although many businesses operating at the BoP have social missions and unique business models, such as TOM’s Shoes’11 goal of providing footwear to those in need, they can have negative externalities. In the case of TOM’s Shoes, local shoe manufacturers often went
11 http://www.economist.com/blogs/freeexchange/2014/10/economics-toms-shoes
50
bankrupt due to the free shoe distribution (Bachnik & Szumniak-Samolej, 2013). Conversely, while a business may create value for the end user and impact local economic development, it may not adequately allow the firm to capture value (revenue) (Chesbrough, 2007). A good example is the challenge of solar lighting companies in bearing the high up-front costs of solar systems while employing pay-as-you-go or leasing financial models (Miller, 2009). In pay-as-you-go or leasing models, the scale of sales plays a large role, but this is often difficult to achieve due to volatile incomes at the BoP and lack of initial capital by the firm seeking to enter an emerging market. The discussion of the impact of business ventures seeking to serve the poor most often relates to local economic development in the regions where frugal innovations are being sold or developed. While the shift in literature to co-creation and the involvement of local producers (or entrepreneurs) perhaps addresses some of the criticism of bringing business to the BoP, there is also the view that market creation at the BoP can lead to gaps between rich and poor (Munir, Ansari, & Gregg, 2010). The co-creation and inclusive innovation view emphasizes the importance of local entrepreneurship and how local entrepreneurs or partners can be incorporated into the design of the innovation and also its diffusion (Foster & Heeks, 2014; Hart & London, 2005; Simanis & Hart, 2008). An ecosystem perspective on doing business at the BoP requires looking beyond the consumer of the innovation, but also at possible beneficiaries, local producers, and distributors. While the BoP may present new business opportunities, the business model and the extent to which it is integrated in its local context is important in the diffusion of innovations (Eyring, Johnson, & Nair, 2011; Simanis, 2011). The literature on the BoP highlights the need for business models that address the complexities surrounding providing products for low income consumers (Arora & Romijn, 2009; London et al., 2010; Sánchez & Ricart, 2010). Business models conceptualize how to bring value to the end consumer and go beyond mere product design or meeting supposed needs of consumers. Technology not only has aided in creating new frugal innovations, it also plays a role in new business models that will contribute to economic development and diffusion of innovations.
Value Creation and Value Capturing As highlighted in subsection 3.1, doing business in emerging markets does not automatically result in both profit making and local development impact. Successfully achieving these two challenges of doing business at the BoP requires an appropriate business model. The business model conceptualizes how ‘value’ is created for the consumer and captured in the form of profits by the firm. The definition of value takes a slightly different meaning with respect to value capture and value creation. Taking a resource-based view of the firm there are two forms of value: use value and exchange value (Barney, 1991). Use value is the value perceived by customers or their willingness to pay, whereas exchange value is the monetary value realized when goods are actually sold. From the firm’s perspective, profits occur when the exchange value of a product is higher than the total cost of all invested resources and capital. While the existence of resources means the existence of rents for the firm, this does not automatically mean that the firm can capture the value from these resources and this is where there can be an inherent tension between value capturing and value creation (Bowman & Ambrosini, 2000). Whereas value capturing is related to the monetary value extracted from what firms offer to customers, value creation relates to the perceived value that the firm can bring to consumers (or other beneficiaries). Value for a consumer, while it can be monetized as the price a consumer is willing to pay for the worth that a product brings, is meeting the needs or wants of a consumer (Amit & Zott, 2001; Drucker, 2006). Importantly, value offerings could actually have negative externalities, particularly when a product can negatively alter behaviors or degrade the community landscape (Hahn, 2012; Karnani, 2009). Also, a technology may have inherent
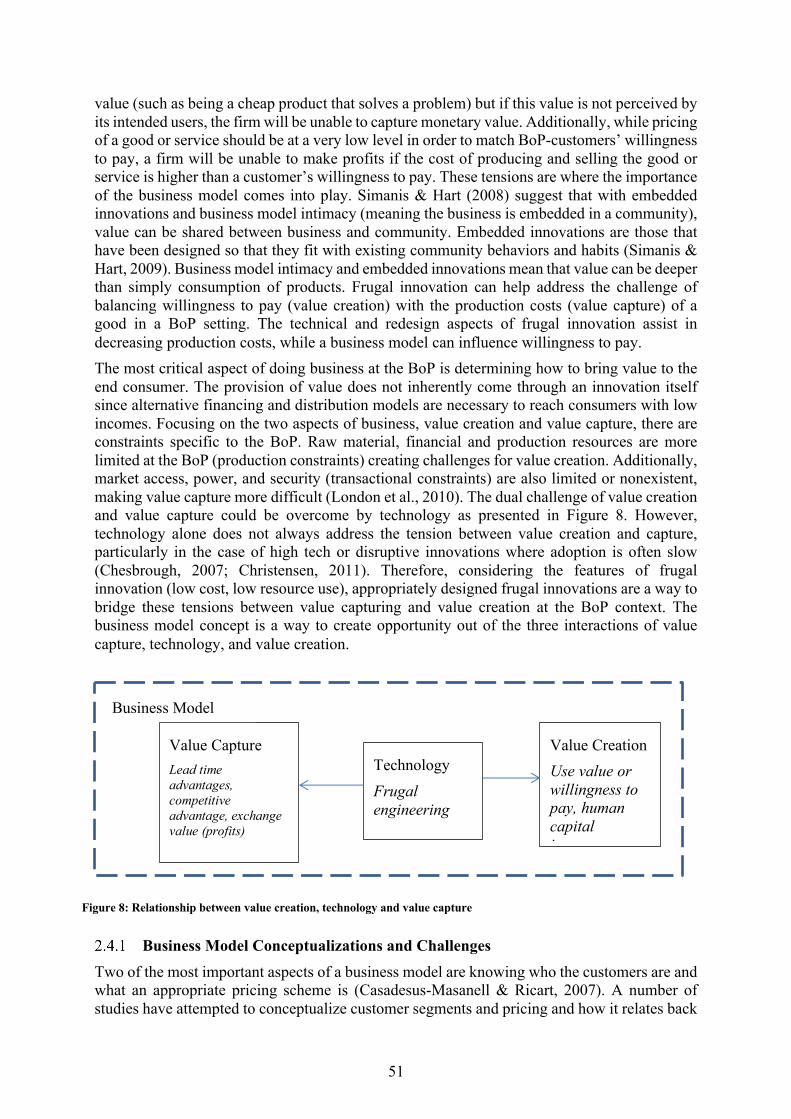
51
value (such as being a cheap product that solves a problem) but if this value is not perceived by its intended users, the firm will be unable to capture monetary value. Additionally, while pricing of a good or service should be at a very low level in order to match BoP-customers’ willingness to pay, a firm will be unable to make profits if the cost of producing and selling the good or service is higher than a customer’s willingness to pay. These tensions are where the importance of the business model comes into play. Simanis & Hart (2008) suggest that with embedded innovations and business model intimacy (meaning the business is embedded in a community), value can be shared between business and community. Embedded innovations are those that have been designed so that they fit with existing community behaviors and habits (Simanis & Hart, 2009). Business model intimacy and embedded innovations mean that value can be deeper than simply consumption of products. Frugal innovation can help address the challenge of balancing willingness to pay (value creation) with the production costs (value capture) of a good in a BoP setting. The technical and redesign aspects of frugal innovation assist in decreasing production costs, while a business model can influence willingness to pay. The most critical aspect of doing business at the BoP is determining how to bring value to the end consumer. The provision of value does not inherently come through an innovation itself since alternative financing and distribution models are necessary to reach consumers with low incomes. Focusing on the two aspects of business, value creation and value capture, there are constraints specific to the BoP. Raw material, financial and production resources are more limited at the BoP (production constraints) creating challenges for value creation. Additionally, market access, power, and security (transactional constraints) are also limited or nonexistent, making value capture more difficult (London et al., 2010). The dual challenge of value creation and value capture could be overcome by technology as presented in Figure 8. However, technology alone does not always address the tension between value creation and capture, particularly in the case of high tech or disruptive innovations where adoption is often slow (Chesbrough, 2007; Christensen, 2011). Therefore, considering the features of frugal innovation (low cost, low resource use), appropriately designed frugal innovations are a way to bridge these tensions between value capturing and value creation at the BoP context. The business model concept is a way to create opportunity out of the three interactions of value capture, technology, and value creation.
Business Models and Frugal Innovations
Business Model Conceptualizations and Challenges Two of the most important aspects of a business model are knowing who the customers are and what an appropriate pricing scheme is (Casadesus-Masanell & Ricart, 2007). A number of studies have attempted to conceptualize customer segments and pricing and how it relates back
Figure 8: Relationship between value creation, technology and value capture
Value Capture Lead time advantages, competitive advantage, exchange value (profits)
Technology Frugal engineering
Value Creation Use value or willingness to pay, human capital increase
Business Model

52
to firm revenue generation. One of the significant theoretical conceptualizations of the business model is the business model canvas developed by Osterwalder, (2004; 2010). The business model canvas consists of several ‘blocks’ that help construct how a business can create and capture value. The blocks of the business model canvas are: customer segments, value proposition, revenue and costs, partners, channels, and resources. These blocks help a business structure its activities, identify customers, and plan. A disadvantage of the business model canvas is that it does not describe business strategy or how to plan market entry. The canvas has often been analyzed for specific industries. In particular, recent work altered the business model canvas to include blocks specific for circular economy business models. Some of these modifications are also relevant for the BoP context such as a block for adoption factors or adding social business aspects like social costs and impacts (Kamath, Lee, & Zhang, 2013; Lewandowski, 2016). In addition to Osterwalder’s work and extensions of the business model canvas, another relevant and earlier contribution to the business model literature is provided by Amit & Zott (2001). Amit and Zott define the business model as ‘the content, structure and governance of transactions that create value designed to create value through exploitation of business opportunities. Content refers to goods or information exchanged and the resources and capabilities necessary. The structure of transactions involves the parties and partnerships and how they work. Finally, governance is the way flows of information are regulated in the business (i.e. legal form of the organization and incentives) (Amit & Zott, 2001; Casadesus-Masanell & Ricart, 2007). Zott and Amit (2001) expand on different ideas about value creation such as value chain analysis, Schumpeterian rents, and the resource-based view of the firm to describe how companies leverage partners and resources to deliver value to a consumer (Amit & Zott, 2001; Zott, Amit, & Massa, 2011). The flexibility of the business model often conflicts with aspects inherent to a firm such as assets (Chesbrough, 2007; Zott et al., 2011). These aspects will look different in a BoP setting or for a business focused on social impact. Business models for frugal innovation and BoP may need to have a broader view of partnerships, and deal with fewer resources and capabilities or work to increase capabilities through business activity. Additionally, the problem of poor institutions, governance, and infrastructure create the need for a business model to be more flexible to its outside environment (Klein, 2008). Therefore, achieving value capture and value creation in a BoP setting requires addressing the contextual challenges of poor institutions, governance, and infrastructure and income constraints. Chesbrough (2007) introduces five business model types that can address some of the challenges of value creation and capture. The business model types are: undifferentiated (compete on price and availability), some differentiation, segmented (compete in different market segments), externally aware (open to external ideas and technologies), innovation process integrated (suppliers and customers have access to the firm’s innovation process), and adaptive platform (experimentation with different business models; suppliers and customers can be business partners). Some of these types may be applicable to BoP settings, such as the adaptive platform business model and innovation process integrated. Relevant to the discussion of frugal innovation is work done examining how business models may be different for businesses with a focus on social impact or operating at the BoP. Yunus, Moingeon, & Lehmann-Ortega (2010) created a framework to explore the aspects of social business. A social business model is an interaction of the value proposition, value constellation, an economic profit equation, and a social profit equation (Kamath et al., 2013; Yunus et al., 2010). A social profit equation extrapolates on the idea of a typical profit equation by forcing the business to explicitly quantify social impact in their business activities. Balancing the social profit equation and the economic profit equation is how a business can achieve both profits and

53
social impact. Frugal innovations fit the development intervention shift from a donor- or NGO-led approach to a business and market-driven approach. Therefore, the consideration of impact into product development and planning is critical. Impact relates to value creation that can be both positive and negative value due to consumer desires that can often have negative impacts (Karnani, 2007, 2009). Another term that relates to impact is the idea of social enterprises or social business models. This stream of literature focuses on how businesses can have an explicit social impact approach or consider inclusivity in their business model (see Goyal, Esposito, Kapoor, Jaiswal, & Sergi, 2014; Kamath et al., 2013; Michelini, 2012). Poor consumers may not always make purchasing decisions that consider longer term needs and interest (i.e. purchasing more ‘luxury goods’ versus household necessities). Therefore, a business-oriented approach towards development impact needs to consider both positive and negative externalities and the potential beneficiaries in the business model (Banerjee & Duflo, 2007). For example, the ‘customer’ (or the person buying the product) is not necessarily the end user, or product benefits may be shared among neighbors, like in the case of solar lighting. Additionally, considering externalities is important as inclusion of poor consumers can also cause negative consequences (Hahn, 2012). Unilever’s Omo washing powder individual sachets have been hailed as an innovation that has allowed more poor consumers to afford washing powder. However, individual packets also cause more waste in environments where proper recycling and waste disposal is limited (Karnani, 2007). More importantly, individual sachets are an example of an innovation where in the long run the consumer ends up paying significantly more per unit. There are several challenges and possibilities when designing business models for emerging markets and low income customers. One of the challenges and important considerations in business models for low income customers is the need to discount future cash flows for longer time periods or the idea of ‘time compression diseconomies’. In an emerging market setting it can take longer to see return on investment, i.e., value creation is shifted into the future. This is an aspect that is often overlooked by western firms that are accustomed to seeing return on investment in shorter time periods achieved in high-income markets (Seelos & Mair, 2007). Additionally, a very important concern in designing business models for the BoP is the issue of institutional voids and market failure (Khanna, Palepu, & Sinha, 2005; Thompson & MacMillan, 2010). Market creation for a product is often necessary and this requires a business model that is ‘interactive’, i.e. functioning with and within a whole ecosystem to be developed due to the lack of efficient resources and institutions. Ecosystem development could occur through the firm seeking to enter the market or through partnerships with NGOs and competitors (Dahan, Doh, Oetzel, & Yaziji, 2010). Unlike isolated business models where the firm simply seeks to exploit own resources to offer products at prices lower than a consumer’s willingness to pay, interactive business models seek to innovate in order to increase willingness to pay (Sánchez & Ricart, 2010). While literature on business models for the BoP is new, there is some discussion of models that could fit the particular challenges of emerging markets. One approach is partnerships with NGOs. NGOs can assist in reaching rural and low income areas and may have a better understanding of local conditions than an MNC. Additionally, the NGO-business approach allows for better leveraging of resources (Dahan et al., 2010). An example of an effective NGO business approach which also involves partnerships with government is the One Laptop Per

54
Child12 (OLPC) initiative. OLPC can be considered a frugal innovation through their goal of designing a robust and affordable product that can be sold throughout schools across the global south. Although its success in terms of educational impact has been mixed—moreover lower cost laptops have recently become available, making the OLPC laptop less cost competitive—the initiative has succeeded in rapid diffusion of laptops in schools. Additionally, the OLPC example highlights how a registered NGO can take a more explicit social impact oriented approach while still avoiding giving away products for free. It is often assumed that purely commercial organizations cannot also be ‘social entrepreneurs’. Therefore, the NGO collaboration could be one way to overcome the perceived tension between social missions and business orientation (Munir et al., 2010). Beyond the NGO collaboration model is the idea of dual business models, which allow a business to have different models for low income consumers and for higher income segments. Different models could either be differentiated by consumer type (like what TOM’s shoes or Waka Waka13 does with their different pricing schemes of solar lanterns in emerging markets versus developed markets) or by products. ‘Cross subsidization’ of products is one configuration of dual business models, but also offering different products for different markets in order to stay financially sustainable is another approach. Managing dual models requires different organization of the firm but can overcome the challenge of making profits from consumers with low incomes (Gebauer, Saul, Halidmann, & Kramer, 2017; Winterhalter, Zeschky, & Gassmann, 2015). Recently, work has been done linking frugal and other forms of BoP innovations to business model literature (Chatterjee, 2016; Rosca, Arnold, & Bendul, 2016; Winterhalter, Zeschky, Gassmann, & Weiblen, 2014). Focusing on the value proposition, revenue model, and value chain, these elements were linked to case studies of frugal innovation and their business models. Rosca et al. (2016) investigates how frugal innovations facilitate sustainable development. While the unit of analysis was the business model, the authors did not make fully explicit the link between the business model and the sustainability impacts they identified. Using the selected business model aspects, Rosca et al. (2016) identified several business model patterns. Important aspects were: low margins and high volume for value capture, a locally oriented value chain (although it increases costs due to the need to train locals), and cooperation with NGOs as a solution to overcome institutional barriers and low profit margins. Chatterjee (2016) and Winterhalter et al. (2014) discuss more generally the need to have appropriately designed business models for frugal innovations. Chatterjee highlights the need for business models that are flexible and focus on sharing value with the communities with which companies are doing business.
IT and Business Models The frugal innovation and BoP literature, and the existing discussion of business models for emerging markets highlight the need for low price points and financing schemes that assist in bringing products within reach of poor consumers. IT can play an important role in business model development for overcoming the tension between value creation and value capture, particularly in the African context. The last several years have shown incredible growth and
12 http://one.laptop.org/ 13 https://waka-waka.com

55
changes in IT adoption and subsequent innovations in Africa (GSMA, 2016; James, 2009; Pick & Sarkar, 2015). Since 2007, mobile phone penetration increased by 340% in sub-Saharan Africa14. The trend of increased mobile phone penetration is perhaps one of the reasons for the rapid diffusion of mobile money payment like Safaricom’s Mpesa15. Additionally, IT innovations like Mpesa can have considerable impact in the context of Africa due to the poor infrastructure, weak institutions, and resource constraints. Research on mobile money payment and mobile phones and their role in financial development is increasing (see: Asongu, 2013; Jack & Suri, 2011; Maurer, 2012), but discussion on the role of IT innovations like mobile payment and mobile sensing in business model innovation has hardly been paid attention to. Like with frugal innovation, there are several characteristics of IT that have influenced business models in emerging markets. First, IT reduces transaction costs. Particularly in an emerging market setting where much of the population is unbanked or lacks access to market information, mobile money innovations have provided payment options that reduce transaction costs. Additionally, access to a mobile phone can provide SMS alerts on market information (for example in the agriculture sector) reducing the costs associated with getting information. Mobile money has changed business models by allowing pay as you go schemes with minimal transaction costs since money can be seamlessly sent via a mobile phone (World Bank, 2016). The reduction of transaction costs has also reduced information asymmetry, since access to market information is more easily available. Although most of the population of sub-Saharan Africa lacks internet access, market information is becoming available through SMS. Access to information can create business opportunities like the business of providing agricultural market information through SMS. Secondly, IT has influenced the value proposition of businesses operating in the BoP. Decreases in sensor technology prices have allowed innovations that come at a lower cost with reduced maintenance needs. Finally, the externalities associated with IT have allowed multiple revenue streams and value propositions to come from one innovation. IT creates a platform which increases value both for the business (value capture) and for the consumer (value creation). A recent example of IT’s role in aiding innovation diffusion and business models is exhibited by the rapid diffusion of off-grid energy products such as solar home systems and solar lanterns throughout sub-Saharan Africa. Two technologies have aided in altering the business models for solar lighting companies: mobile money payment and sensing devices that allow for shut off of lanterns if a consumer has not paid their bill. Companies like BBox, Fenix, MKopa, and Mobisol16 have implemented smart devices that allow consumers to ‘pay as they go’ for their light. Rather than bearing the high upfront costs of a solar product, consumers can pay for light on a daily basis using some variation of a code or voucher system that is paid for with mobile money. Ultimately, the pay-as-you-go model has the goal of solar product ownership. BBoxx also has smart monitoring of their systems, which better facilitates maintenance and efficient system use. Like Simanis & Hart (2008) and Simanis (2011) suggest, the business model of pay-as-you-go also fits with existing community habits by emulating the previous system of paying for kerosene every day for daily lighting needs.
14 http://www.itu.int/en/ITU-D/statistics 15 https://www.safaricom.co.ke/personal/m-pesa 16 http://www.bboxx.co.uk/, http://www.fenixintl.com/, http://www.m-kopa.com/, http://www.plugintheworld.com/mobisol/
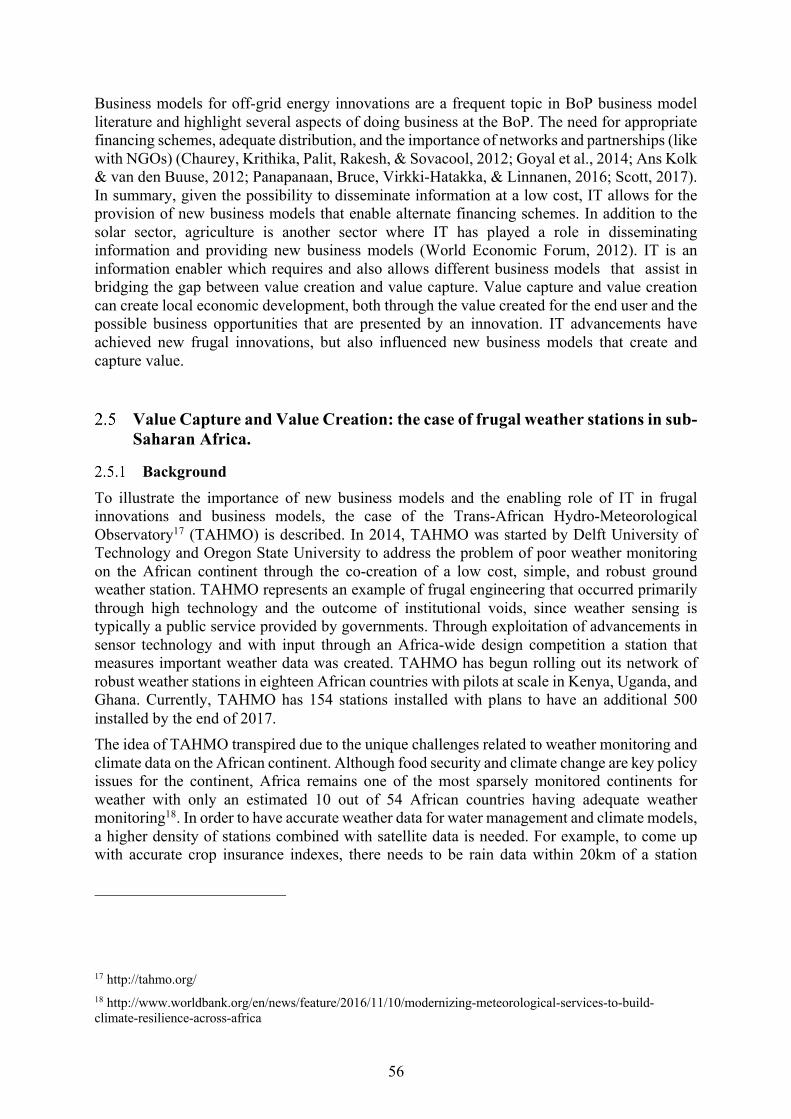
56
Business models for off-grid energy innovations are a frequent topic in BoP business model literature and highlight several aspects of doing business at the BoP. The need for appropriate financing schemes, adequate distribution, and the importance of networks and partnerships (like with NGOs) (Chaurey, Krithika, Palit, Rakesh, & Sovacool, 2012; Goyal et al., 2014; Ans Kolk & van den Buuse, 2012; Panapanaan, Bruce, Virkki-Hatakka, & Linnanen, 2016; Scott, 2017). In summary, given the possibility to disseminate information at a low cost, IT allows for the provision of new business models that enable alternate financing schemes. In addition to the solar sector, agriculture is another sector where IT has played a role in disseminating information and providing new business models (World Economic Forum, 2012). IT is an information enabler which requires and also allows different business models that assist in bridging the gap between value creation and value capture. Value capture and value creation can create local economic development, both through the value created for the end user and the possible business opportunities that are presented by an innovation. IT advancements have achieved new frugal innovations, but also influenced new business models that create and capture value.
Value Capture and Value Creation: the case of frugal weather stations in sub-Saharan Africa.
Background To illustrate the importance of new business models and the enabling role of IT in frugal innovations and business models, the case of the Trans-African Hydro-Meteorological Observatory17 (TAHMO) is described. In 2014, TAHMO was started by Delft University of Technology and Oregon State University to address the problem of poor weather monitoring on the African continent through the co-creation of a low cost, simple, and robust ground weather station. TAHMO represents an example of frugal engineering that occurred primarily through high technology and the outcome of institutional voids, since weather sensing is typically a public service provided by governments. Through exploitation of advancements in sensor technology and with input through an Africa-wide design competition a station that measures important weather data was created. TAHMO has begun rolling out its network of robust weather stations in eighteen African countries with pilots at scale in Kenya, Uganda, and Ghana. Currently, TAHMO has 154 stations installed with plans to have an additional 500 installed by the end of 2017. The idea of TAHMO transpired due to the unique challenges related to weather monitoring and climate data on the African continent. Although food security and climate change are key policy issues for the continent, Africa remains one of the most sparsely monitored continents for weather with only an estimated 10 out of 54 African countries having adequate weather monitoring18. In order to have accurate weather data for water management and climate models, a higher density of stations combined with satellite data is needed. For example, to come up with accurate crop insurance indexes, there needs to be rain data within 20km of a station
17 http://tahmo.org/ 18 http://www.worldbank.org/en/news/feature/2016/11/10/modernizing-meteorological-services-to-build-climate-resilience-across-africa
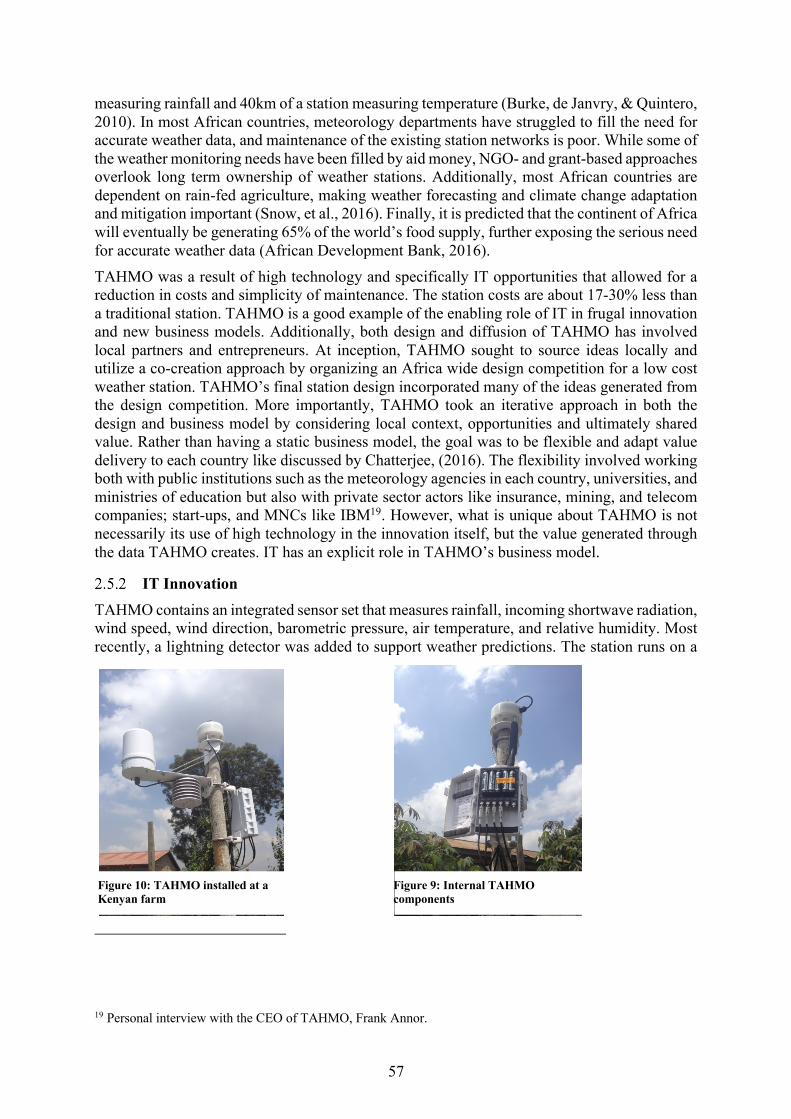
57
measuring rainfall and 40km of a station measuring temperature (Burke, de Janvry, & Quintero, 2010). In most African countries, meteorology departments have struggled to fill the need for accurate weather data, and maintenance of the existing station networks is poor. While some of the weather monitoring needs have been filled by aid money, NGO- and grant-based approaches overlook long term ownership of weather stations. Additionally, most African countries are dependent on rain-fed agriculture, making weather forecasting and climate change adaptation and mitigation important (Snow, et al., 2016). Finally, it is predicted that the continent of Africa will eventually be generating 65% of the world’s food supply, further exposing the serious need for accurate weather data (African Development Bank, 2016). TAHMO was a result of high technology and specifically IT opportunities that allowed for a reduction in costs and simplicity of maintenance. The station costs are about 17-30% less than a traditional station. TAHMO is a good example of the enabling role of IT in frugal innovation and new business models. Additionally, both design and diffusion of TAHMO has involved local partners and entrepreneurs. At inception, TAHMO sought to source ideas locally and utilize a co-creation approach by organizing an Africa wide design competition for a low cost weather station. TAHMO’s final station design incorporated many of the ideas generated from the design competition. More importantly, TAHMO took an iterative approach in both the design and business model by considering local context, opportunities and ultimately shared value. Rather than having a static business model, the goal was to be flexible and adapt value delivery to each country like discussed by Chatterjee, (2016). The flexibility involved working both with public institutions such as the meteorology agencies in each country, universities, and ministries of education but also with private sector actors like insurance, mining, and telecom companies; start-ups, and MNCs like IBM19. However, what is unique about TAHMO is not necessarily its use of high technology in the innovation itself, but the value generated through the data TAHMO creates. IT has an explicit role in TAHMO’s business model.
IT Innovation TAHMO contains an integrated sensor set that measures rainfall, incoming shortwave radiation, wind speed, wind direction, barometric pressure, air temperature, and relative humidity. Most recently, a lightning detector was added to support weather predictions. The station runs on a
19 Personal interview with the CEO of TAHMO, Frank Annor.
Figure 10: TAHMO installed at a
Kenyan farm Figure 9: Internal TAHMO
components

58
solar panel that is half the size of a business card and data is communicated through 2G and 3G networks (General Packet Radio Service-GPRS) available on the station’s sim card. While these sensors are not low tech or inherently simple, their combination coupled with the station’s ability to run on a very small solar panel and AA batteries decrease the system’s complexity, costs, and maintenance requirements. TAHMO’s components are manufactured by the American company Decagon (now called METER) and currently partnerships with IBM for data analysis tools are being explored. Additionally, TAHMO is exploring local assembly and manufacture of some station components. The following figures depict the weather station’s external and internal components. Due to the low technical and skilled labor resource setting in most of sub-Saharan Africa, the station was designed with the requirements of being low maintenance and with no moving parts. This was possible due to the availability of low cost high resolution and small sensors. There are several ways that TAHMO can be classified as an example of a frugal innovation as listed in the following table. Firstly, the entire innovation process for TAHMO revolved around low resource use with the goal of reducing costs and complexity (Bhatti, 2012). IT played a direct role in TAHMO’s cost reduction in two ways. TAHMO utilized IT as a way to reduce maintenance needs (all data stored locally and transmitted via GPRS) and cut costs. The IT aspect reduces transaction costs, since data can be sent via telemetry and viewed remotely. Additionally, the reduction of sensor prices allowed TAHMO to be designed so that it fits in a shoebox, and has very low energy use, all aspects that reduced costs. Finally, TAHMO also fits with literature emphasizing the importance of taking a co-creation approach in designing innovations (Eric Simanis & Hart, 2008b). TAHMO was designed not merely with costs in mind, but the specific context that it would be installed in (remote, low skilled labor, poor infrastructure). Through the Africa design competition and partnerships with meteorology agencies, TAHMO’s design was achieved through co-creation rather than top down implementation. Table 12: Frugal innovation features of TAHMO
TAHMO frugal innovation features Literature
Outcome of institutional & resource constraints
(Bhatti, 2012; Cunha et al., 2014; Ernst et al., 2015)
Low cost (Agarwal & Brem, 2012)
Solves existing problem (Bhatti, 2012)
Use of high technology (IT) to reduce maintenance
(Radjou & Prabhu, 2014; Rao, 2013)
Business Models More important than TAHMO’s technology is its unique business approach to weather station delivery. TAHMO highlights many of the theoretical aspects of business models for emerging markets but more importantly the role of IT in enabling new business models. TAHMO’s diffusion has depended largely on its business model more so than its frugal technology. Formally, TAHMO is a registered international NGO but it takes a business approach to the diffusion of the weather stations. Rather than giving stations away for free and risking lack of ownership and ultimately maintenance, TAHMO searches for partners who will receive mutual
59
economic benefits from the data. For instance, a public-private partnership tactic is used with local adaptions made due to culture, development, and institutional differences in each country (van de Giesen, Hut, & Selker, 2014). In all countries, TAHMO first approaches meteorology agencies, then private sector partners. Furthermore, an important aspect of TAHMO’s strategy is being adaptable and flexible to the local conditions in operating countries. While the technology has a low price point, the business model allows the stations to be deployed across the African continent. The value in TAHMO does not come from the low cost of the station but from the economic value generated by weather data. TAHMO’s business model could be viewed as the adaptive platform model described by Chesbrough (2007). TAHMO experiments with different business model variants in each country and, like Chesbrough discusses, key suppliers and customers are also business partners. In each country, TAHMO’s customers and partners are different and station design has become iterative as different country needs require slightly different sensor sets. TAHMO’s adaptive business model has also been influenced by three characteristics of IT: reduced transaction costs, lower sensor prices, and externalities. Initially, TAHMO’s focus was a ‘two-for-one’ business model. Stations were purchased by partner schools in North America and the Netherlands with one installed at the partner school and one at a school in Africa. By cooperating with the Ministry of Education in African countries, schools could be selected and matched with northern hemisphere schools. The two-for-one model highlights the externalities of IT and how TAHMO can function as a multi-use platform and provide multiple value propositions. Through the website, school2school.net, weather data is shared between the partner schools, allowing for educational activities. However, the school-to-school model makes it challenging to allow for rapid diffusion of the stations due to the difficulty in selling the station to ‘richer’ schools. TAHMO’s school-to-school model is similar to literature discussing how an effective approach to entering emerging markets is through NGO collaboration or through a dual business model for different market segments (Dahan et al., 2010; Winterhalter et al., 2015). Due to the slow diffusion of the two-for-one model, TAHMO now focuses on funding station installation through project funds (USAID, Global Resilience Partnership, and NWO as examples). However, the key value proposition of TAHMO comes in the data generated, and this is where TAHMO focuses revenue generation. Sale and analysis of data is how TAHMO aims to earn money to cover maintenance costs. The customers of TAHMO’s data vary from country to country, and they include micro crop insurance, mining and telecom companies. Again, TAHMO’s approach is adaptive and experimental by packaging the data into products, then experimenting with different business models to bring the product to private sector parties. The multiple products are possible due to the near zero marginal cost of creating new software or data tools from the data. This is one of the externalities of IT. For example, TAHMO has used a subscription model with the telecom company Airtel in Uganda to provide weather data services to Airtel consumers. Total costs for the maintenance of a station is about $100/year, a price point that was possible due to the bundling of low cost sensor sets and low energy use of the station. But because weather data is often viewed as a public good and most African countries have challenges with their public institutions, there is a need for private sector involvement. Therefore, TAHMO has taken a private-public partnership approach to diversify cost-sharing. This approach fits with the NGO collaboration business model where social impact and diffusion can better occur via NGO involvement (TAHMO is registered as an NGO), but it also demonstrates the need for business model intimacy where value is shared between the company and a community, like Simanis & Hart (2008) discussed (Dahan et al., 2010). In TAHMO’s arrangement, value is shared through the weather data for both private partners and governments and through

60
educational opportunities by setting up the stations in schools. TAHMO is also required to create an ecosystem in each operating country through extensive market research and selection of partners (Goyal & Sergi, 2015). For example, in Rwanda TAHMO is cooperating with an IT start-up that had the idea to provide simple SMS-based weather prediction information to small holder farmers. Other partners are the East African-based micro crop insurance company Acre20. Acre can directly benefit from TAHMO data because it would give higher accuracy than satellite data only, allowing Acre to reduce its insurance premiums for smallholder farmers (Burke et al., 2010; Njenga, 2016). Not only have these partnerships resulted in additions and improvements to the station design, they have also maximized the value of the station beyond simply weather data. Including local partners in the business model is a way to decentralize the costs. However, one of the challenges is the issue of the ‘public good’ nature of weather data. While one party, such as a micro crop insurance company, has an incentive to invest in stations, the data benefits a larger group and therefore should be shared. The following diagram illustrates how frugal engineering interconnects value capturing and value creation in the example of TAHMO21. In the case of TAHMO, IT is the linking point in creating and capturing value. Reduction of transaction costs have allowed for data to be easily generated and spread to multiple partners. Additionally, the decrease in transaction costs have created spin offs like Severe Weather Consult that can send SMS alerts to farmers. The drop in sensor costs, is what created TAHMO’s low price point and minimal maintenance costs, but IT’s externalities are what have allowed multiple value propositions and increased the economic value of TAHMO.
20 http://acreafrica.com/ 21 Personal interview with Nick van de Giesen, TU Delft and co-founder of TAHMO.
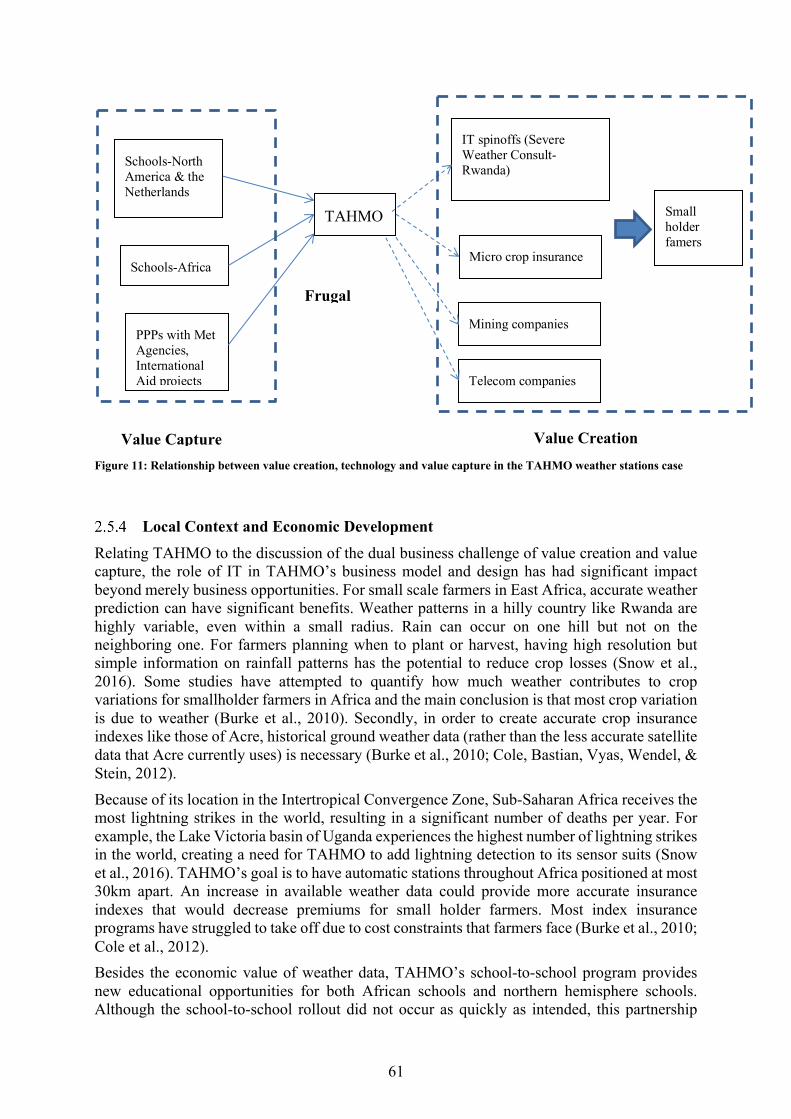
61
Figure 11: Relationship between value creation, technology and value capture in the TAHMO weather stations case
Local Context and Economic Development Relating TAHMO to the discussion of the dual business challenge of value creation and value capture, the role of IT in TAHMO’s business model and design has had significant impact beyond merely business opportunities. For small scale farmers in East Africa, accurate weather prediction can have significant benefits. Weather patterns in a hilly country like Rwanda are highly variable, even within a small radius. Rain can occur on one hill but not on the neighboring one. For farmers planning when to plant or harvest, having high resolution but simple information on rainfall patterns has the potential to reduce crop losses (Snow et al., 2016). Some studies have attempted to quantify how much weather contributes to crop variations for smallholder farmers in Africa and the main conclusion is that most crop variation is due to weather (Burke et al., 2010). Secondly, in order to create accurate crop insurance indexes like those of Acre, historical ground weather data (rather than the less accurate satellite data that Acre currently uses) is necessary (Burke et al., 2010; Cole, Bastian, Vyas, Wendel, & Stein, 2012). Because of its location in the Intertropical Convergence Zone, Sub-Saharan Africa receives the most lightning strikes in the world, resulting in a significant number of deaths per year. For example, the Lake Victoria basin of Uganda experiences the highest number of lightning strikes in the world, creating a need for TAHMO to add lightning detection to its sensor suits (Snow et al., 2016). TAHMO’s goal is to have automatic stations throughout Africa positioned at most 30km apart. An increase in available weather data could provide more accurate insurance indexes that would decrease premiums for small holder farmers. Most index insurance programs have struggled to take off due to cost constraints that farmers face (Burke et al., 2010; Cole et al., 2012). Besides the economic value of weather data, TAHMO’s school-to-school program provides new educational opportunities for both African schools and northern hemisphere schools. Although the school-to-school rollout did not occur as quickly as intended, this partnership
TAHMO
IT spinoffs (Severe Weather Consult-Rwanda)
Schools-North America & the Netherlands
Micro crop insurance
Small holder famers
Schools-Africa
Value Capture Value Creation
Frugal Innovation
PPPs with Met Agencies, International Aid projects
Mining companies
Telecom companies

62
likely has positive benefits particularly for students in schools that lack access to advanced science labs or other interactive learning tools. The educational value from TAHMO comes from its platform like setup. Data can be shared through an online platform in a way that would not be possible in traditional weather station set ups. On a larger scale, economic losses due to climate change have been estimated on the order of $2.4 trillion in the last four years, an impact that is felt even more strongly on the African continent due to insufficient data that allows for planning of climate mitigation and adaptation (World Meteorological Organization et al., 2014). Additionally, there have been 1000 natural disasters in Africa in the period from 1980-2010 with losses that could have perhaps been mitigated with better weather monitoring (Burke et al., 2010). Particularly important are the economic losses in the agricultural sector due to poor weather monitoring, since smallholder farmers and agriculture are important contributors to African GDPs (Burke et al., 2010; Snow et al., 2016). Therefore, TAHMO’s larger goal of deploying their low cost stations across the continent could have even longer term economic impacts in terms in of climate change mitigation (Annor et al., 2016). IT can seamlessly provide multiple uses through the externalities inherent in IT innovations. TAHMO is a good example of the value creating (impact) potential of frugal innovations that employ IT. TAHMO can both be a sustainable business venture by generating revenue to cover maintenance costs, while providing economic impact in terms of improved weather forecasting and ultimately mitigation of crop losses due to weather.
Discussion The case of TAHMO highlights two enabling features of IT. First, some of the frugal innovations that are possible due to rapid decreases in sensor costs and size. TAHMO’s simplicity and cost reduction did not occur through stripping away or lower resource use, but rather through a reconfiguration and redesign utilizing high tech components. Fitting with the frugal innovation definition of Bhatti (2012), the innovation was the outcome of resource constraints (minimal technical labor and locally available technology), institutional constraints (poor weather monitoring, no government funds for weather stations), and market constraints (needed to create a market by involving multiple partners through public private partnerships). TAHMO can also be seen as an example of a frugal innovation that is disruptive in how it has changed how weather data delivery occurs and who pays for weather stations. More importantly, TAHMO demonstrates how IT has enabled new business models that create new economic opportunities. Although technological advancement played a role in TAHMO’s frugality (through decreased sensor costs), TAHMO would not be successfully diffused without an appropriate business model. TAHMO’s low cost comes through its neatly bundled low cost sensor set and low energy use. Without the rapid decrease in sensor costs, this would not have been possible. IT’s characteristics of low transaction costs, decreasing sensor prices, and externalities have influenced TAHMO’s business model. TAHMO’s main economic value proposition is the weather data generated. While weather data alone does not create economic value, the platform like characteristic of TAHMO has provided opportunities for the creation of weather data products that can generate revenue for TAHMO’s maintenance. The lack of maintenance seems to be what causes NGO based weather station approaches to be unsuccessful (Snow et al., 2016). Eventually, TAHMO’s goal is to have station maintenance costs be covered through the data products offered. These sales can also generate revenue to scale up station installation beyond project funding. There are several ways that TAHMO data has been used to create revenue and economic activity. TAHMO data is easily transmitted through GPRS and can be used by IT startups like the Rwandan Severe Weather Consult. Severe Weather Consult makes use of advanced programming to send simple SMS alerts to
63
smallholder farmers that can be paid for through mobile money. Micro crop insurance companies also provide simple insurance products that are an output of complex algorithms that assess weather risks. Insurance premiums are highly dependent on the quality of weather data available, therefore the high-quality ground weather data TAHMO can help improve the weather indexes and ultimately lower insurance premiums for small holder farmers (Burke et al., 2010; Njenga, 2016). In other regions, telecom companies and mining companies are customers for TAHMO’s data. Besides the IT component in TAHMO data itself, IT allows low maintenance of the stations (through remote monitoring). Finally, IT innovations like mobile money and the diffusion of mobile phones in Africa has allowed spin offs like Severe Weather Consult to spring up and benefit from the TAHMO initiative. All of these spin off activities are examples of how the low marginal cost of creating new products creates economic value. Additionally, the reduction of transaction costs has reduced information asymmetry (providing SMS alerts to low income farmers) and provided new payment schemes through mobile money. TAHMO also highlights many of the theoretical aspects of designing a business model for an emerging market setting. In addition to taking an explicit co-creation approach from the beginning, TAHMO utilizes partnerships (with NGOs, government agencies, and the private sector), and while officially an NGO, their approach is business-oriented by seeking to generate revenue for station maintenance through the sale of data. Moreover, TAHMO has both an interactive and flexible business model. TAHMO’s model fits well with Chesbrough (2007)’s classification of adaptive business models in the following ways. First, customers and partners vary from country to country, and while the initial approach is signing a memorandum of understanding (MOU) with meteorology departments, the final customer and station set up varies depending on the needs of the specific context. Second, many customers are also TAHMO’s partners and have input into the station design (like Severe Weather Consult and the need for lighting detection). In addition to flexibility in the business model, country differences have altered TAHMO’s value proposition. Initially, TAHMO utilized ‘cross subsidization’ through its two-for-one model of selling to more prosperous northern hemisphere schools (Winterhalter et. al, 2015). However, after experimentation in different countries and with different business models, it was discovered that much of TAHMO’s value is realized through its data. The following table summarizes how IT has influenced TAHMO’s business model and assisted in addressing the tension between creating value (in terms of local economic development impact) and capturing value (generating revenue to keep the stations running). More so than the innovation, business models are critical for adoption of frugal innovations. Table 13: IT's influencing role in business models for frugal innovations
IT characteristic Business model aspect
Reduction of transaction costs • Reducing information asymmetry making it easier to reach low income segments (i.e., SMS alerts to low income farmers)
• Multiple payment options (i.e., mobile money has allowed for pay as you go and brought products within reach of the unbanked)
• Adaptive business model: different partners, spin off activities and revenue streams for different contexts (reduced transaction costs and high mobile phone penetration in Africa)
• Revenue generation, alternate financing
Decreasing sensor prices • Low price points
64
• Value proposition suited to low income consumers
Externalities • Multiple uses from one innovation (i.e., spin off activity, school-to-school platform)
• Marginal cost of adding additional value is close to zero because of the platform like characteristic of IT
• Enables cross subsidization of TAHMO stations
Although TAHMO is a good illustration of the possibilities IT can provide in terms of new frugal innovations, business models, and economic development, the TAHMO case also shows the complexity of who receives the benefits. IT’s externalities and reduced transaction costs have provided potential to reach lower income consumer segments, but these groups are not necessarily being reached. As outlined in the recent World Bank report on IT and development, 70% of the bottom fifth of the world’s population owns a mobile phone. While the large and growing demographic of mobile phone owners has allowed innovations like mobile money payment to rapidly diffuse and create new economic opportunities such as the spin off activities from TAHMO, a notable inhibitor is that still more than half of the world’s population lacks internet access (World Bank, 2016). Internet access is particularly low in sub-Saharan Africa where mobile broadband subscriptions are lowest in the world and 50% of the population lacks access to the network (GSMA, 2016). Therefore, even though IT is often considered as an enabler of development and a tool to promote inclusion of previously disadvantaged communities, there are winners and losers in these changes and it seems in the case of Sub-Saharan Africa that lower adoption rates due to affordability constraints may inhibit the development possible through IT (Asongu & Le Roux, 2017; Papaioannou, 2014). Technological advancements have allowed new frugal innovations to develop through the use of lower cost sensors as illustrated by the case of TAHMO. Furthermore, the internet reduces information asymmetry which can provide new opportunities for more groundbreaking entrepreneurial activities like some of the spin offs resulting from TAHMO data. However, these benefits cannot be exploited by the majority of the population since internet access is still limited (James, 2016; World Bank, 2016). For TAHMO, internet access plays a role in their data products (like the weather products offered Airtel subscribers in Uganda) which could impact TAHMO’s revenue generating data product offerings. The positive and negative externalities inherent in all business activity and IT, and specifically the possibility of exclusion, should be examined before considering business at BoP. The idea of inclusive development needs to be incorporated into the design of frugal innovations and their business models. Inclusive development means considering the conditions that help drive innovation such as: government regulations, technology access, behaviors, attitudes and consumption, and human capital (George et al., 2012). One way to approach these issues is by considering who is receiving the benefits from an innovation or the distribution of value creation (consumer) and value capture (firm). The example of TAHMO highlights the complexity of inclusivity because the entrepreneurs who are creating spin-off activities are not necessarily ‘survival entrepreneurs’ (see Berner, Gomez, & Knorringa, 2012) but rather individuals with a higher level of education and access to more information. More importantly, weather data, and therefore the station, could be considered as a public good which creates the need to balance who pays for the station with who receives most of the benefits. The inclusivity of innovations and business models could be explored by examining how value is dispersed

65
between a firm and the end user or consumer and taking a demand pull view of innovation versus technology push (Priem, Li, & Carr, 2012; Ratchford, 2001). Additionally, as demonstrated by TAHMO, their business model involves a strong sharing of value and resources between both firms and organizations so the work of Lavie (2006) could be expanded on for its applicability to frugal innovations and doing business at the BoP.
Conclusions Much of the literature on frugal innovation focuses on defining the concept and the process surrounding the invention of frugal innovations. However, in the case of the diffusion of frugal innovations, the role of the business model becomes more important and it can also become an alternative way to introduce frugality. IT has introduced frugal innovations that decrease costs-- not through the stripping away of resources and or features-- but instead through reconfigurations of high tech components that decrease complexity and ultimately lower the overall cost. TAHMO’s simple design due to high technology components, highlights how reconfigurations can result in frugal innovations. More importantly, the role of IT is not limited to the design of the innovation but extends to introducing new economic opportunities such as Severe Weather Consult and Acre’s micro-insurance for smallholder farmers and influencing the business model. These economic possibilities have only been possible through technological change and the rapid diffusion of mobile phones across the African continent. Conducting business in emerging markets poses a dual challenge: capturing value (revenue), and creating value (local development impact). Addressing this dual challenge is where the business model plays a role. While literature on frugal innovation claims that frugal innovation is a way to provide products that can address cost and resource constraints, less research has looked at the role of the business model in diffusing these innovations. TAHMO illustrates how business models not only take on different configurations in emerging market settings, but it also illustrates the importance of new business models in the diffusion of frugal innovations. TAHMO utilized an adaptive business model, with a different approach in each country and the incorporation of suppliers and customers as business partners. Co-creation in both the business model and design was an important part of TAHMO’s development and diffusion. Finally, rather than taking a purely top down approach, TAHMO has sought to be embedded in the areas where stations are deployed by seeking to involve local entrepreneurs and suppliers. TAHMO’s approach also represents a shift in both traditional aid and business approaches in Africa. A shift that is currently necessary to sustain the economic growth most sub-Saharan African countries experienced due to increased commodity prices resulting from China’s rapid infrastructure development. Most importantly, IT is rapidly changing the business model possibilities for frugal innovations in Africa through its reduced transaction costs, decreasing sensor prices, and externalities. IT is an information enabler, which reduces transaction costs. Business models in the African context must cope with poor infrastructure, institutional constraints, and financial limitations. One way these challenges can be overcome is through IT solutions that seamlessly generate valuable data either to allow pay-as-you-go systems (as implemented with solar lighting), or through the sale of products created from the data itself (such as TAHMO’s model). The influencing role of IT in creating new business models has come about not only due to technological advances, but also due to high mobile phone penetration and mobile money payment in Africa. Unlike other world regions, mobile money payment has dramatically altered the business model options in Africa. While much of the frugal innovation literature highlights cases from India, TAHMO is a good example of an Africa-generated frugal innovation in which context plays a role in frugal innovations. TAHMO came about due to a specific problem that
66
is faced by the African continent: low density of weather stations and the need for increased weather monitoring. The role of technology in the business model and the question of how to diffuse innovations in a manner that maximizes inclusivity is a future research topic. Ultimately, while IT has filtered into frugal innovations for the BoP and created new opportunities for entrepreneurs, it has also created the opportunity for exclusion of certain groups. Future research should further explore how frugal innovations can result in inclusion. Like TAHMO’s approach, exclusion of groups could be overcome by considering shared value in the business model and innovation design. Shifting focus from technology push innovation to demand pull where the needs of the end user are taken into account is another means to further inclusion.

67
References African Development Bank. (2016). Retrieved from http://www.afdb.org/en/news-and-
events/article/world-food-day-adapting-africas-agriculture-to-the-exigencies-of-climate-change-16218/
Aker, J. C. (2011). Dial “A” for agriculture: a review of information and communication technologies for agricultural extension in developing countries. Agricultural Economics, 42(6), 631–647. https://doi.org/10.1111/j.1574-0862.2011.00545.x
Aker, J. C., & Mbiti, I. M. (2010). Mobile Phones and Economic Development in Africa. Journal of Economic Perspectives, 24(3), 207–232. https://doi.org/10.1257/jep.24.3.207
Amankwah-Amoah, J. (2016). Emerging economies, emerging challenges: Mobilizing and capturing value from big data. Technological Forecasting and Social Change, 110, 167–174. https://doi.org/10.1016/j.techfore.2015.10.022
Amit, R., & Zott, C. (2001). Value creation in E-business. Strategic Management Journal, 22(6–7), 493–520. https://doi.org/10.1002/smj.187
Annor F.O, Abbasi A., van de Giesen N., Selker J. S., Jachens E., van Andel E., … Shafiei M. (2016). Promoting water and climate education through the Trans-African Hydro-Meteorological Observatory (TAHMO). Presented at the WENM 2016, Tehran, Iran.
Arora, S., & Romijn, H. (2009). Innovation for the base of the pyramid : critical perspectives from development studies on heterogeneity and participation. Maastricht : United Nations Univ., Maastricht Economic and social Research and training centre on Innovation and Techn. Retrieved from http://www.merit.unu.edu/publications/wppdf/2009/wp2009-036.pdf
Asongu, S. A. (2013). How has Mobile Phone Penetration Stimulated Financial Development in Africa? Journal of African Business, 14(1), 7–18. https://doi.org/10.1080/15228916.2013.765309
Asongu, S. A., & Le Roux, S. (2017). Enhancing ICT for inclusive human development in Sub-Saharan Africa. Technological Forecasting and Social Change, 118, 44–54. https://doi.org/10.1016/j.techfore.2017.01.026
Bachnik, K., & Szumniak-Samolej, J. (2013). Shared Value in Practice: TOMS Business Model. Chinese Business Review, 12(9), 639–645.
Banerjee, A. V., & Duflo, E. (2007). The Economic Lives of the Poor. Journal of Economic Perspectives, 21(1), 141–167. https://doi.org/10.1257/jep.21.1.141
Barney, J. (1991). Firm Resources and Sustained Competitive Advantage. Journal of Management, 17(1), 99–120. https://doi.org/10.1177/014920639101700108
Bayart, J.-F., & Ellis, S. (2000). Africa in the world: a history of extraversion. African Affairs, 99(395), 217–267.
Berner, E., Gomez, G., & Knorringa, P. (2012). “Helping a large number of people become a little less poor”: The logic of survival entrepreneurs. European Journal of Development Research, 24(3), 382.
Bhatti, Y. A. (2012). What is Frugal, What is Innovation? Towards a Theory of Frugal Innovation. SSRN Electronic Journal. https://doi.org/10.2139/ssrn.2005910

68
Bhatti, Y. A., & Ventresca, M. (2013). How Can “Frugal Innovation” Be Conceptualized? SSRN Electronic Journal. https://doi.org/10.2139/ssrn.2203552
Bowman, C., & Ambrosini, V. (2000). Value Creation Versus Value Capture: Towards a Coherent Definition of Value in Strategy. British Journal of Management, 11(1), 1–15. https://doi.org/10.1111/1467-8551.00147
Brem, A., & Wolfram, P. (2014). Research and development from the bottom up - introduction of terminologies for new product development in emerging markets. Journal of Innovation and Entrepreneurship, 3(1), 9. https://doi.org/10.1186/2192-5372-3-9
Bughin, J., Chironga, M., Desvaux, G., Ermias, T., Jacobson, P., Kassiri, O., … Zouaoui, Y. (2016). Lions On The Move II: Realizing The Potential Of Africa’s Economies. McKinsey Global Institute. Retrieved from http://www.mckinsey.com/global-themes/middle-east-and-africa/lions-on-the-move-realizing-the-potential-of-africas-economies
Burke, M., de Janvry, A., & Quintero, J. (2010). Providing Index–Based Agricultural Insurance to Smallholders: Recent Progress and Future Promise. Documento de Trabajo. CEGA, University of California at Berkeley.
Busse, M., Erdogan, C., & Mühlen, H. (2016). China’s Impact on Africa - The Role of Trade, FDI and Aid: China’s Impact on Africa. Kyklos, 69(2), 228–262. https://doi.org/10.1111/kykl.12110
Casadesus-Masanell, R., & Ricart, J. E. (2007). Competing Through Business Models. SSRN Electronic Journal. https://doi.org/10.2139/ssrn.1115201
Chatterjee, S. R. (2016). Rethinking Business Models for Flexible Configuration: Lessons from Disruptive Innovations at the Bottom of the Pyramid (BOP). In Sushil, J. Connell, & J. Burgess (Eds.), Flexible Work Organizations (pp. 181–193). New Delhi: Springer India. Retrieved from http://link.springer.com/10.1007/978-81-322-2834-9_12
Chaurey, A., Krithika, P. R., Palit, D., Rakesh, S., & Sovacool, B. K. (2012). New partnerships and business models for facilitating energy access. Energy Policy, 47, 48–55. https://doi.org/10.1016/j.enpol.2012.03.031
Chesbrough, H. (2007). Business model innovation: it’s not just about technology anymore. Strategy & Leadership, 35(6), 12–17. https://doi.org/10.1108/10878570710833714
Christensen, C. M. (2011). The innovator’s dilemma: the revolutionary book that will change the way you do business ; [with a new preface] (1. Harper Business paperback). New York, NY: Harper Business.
Cole, S., Bastian, G., Vyas, S., Wendel, C., & Stein, D. (2012). The effectiveness of index-based micro-insurance in helping smallholders manage weather-related risks. London: EPPI-Centre, Social Science Research Unit, Institute of Education, University of London.
Crabtree, A. (2007). Evaluating “The Bottom of the Pyramid” from a fundamental capabilities perspective. Copenhagen Business School Centre for Business and Development Studies Working Paper, 1, 1–22.
Cunha, M. P. e, Rego, A., Oliveira, P., Rosado, P., & Habib, N. (2014). Product Innovation in Resource-Poor Environments: Three Research Streams: Product Innovation in Resource-Poor Environments. Journal of Product Innovation Management, 31(2), 202–210. https://doi.org/10.1111/jpim.12090

69
Dahan, N. M., Doh, J. P., Oetzel, J., & Yaziji, M. (2010). Corporate-NGO Collaboration: Co-creating New Business Models for Developing Markets. Long Range Planning, 43(2–3), 326–342. https://doi.org/10.1016/j.lrp.2009.11.003
Drucker, P. F. (2006). Innovation and entrepreneurship: practice and principles (Reprint). New York, NY: HarperBusiness.
Ernst, H., Kahle, H. N., Dubiel, A., Prabhu, J., & Subramaniam, M. (2015). The Antecedents and Consequences of Affordable Value Innovations for Emerging Markets: Affordable Value Innovations for Emerging Markets. Journal of Product Innovation Management, 32(1), 65–79. https://doi.org/10.1111/jpim.12171
Eyring, M. J., Johnson, M. W., & Nair, H. (2011). New business models in emerging markets. Harvard Business Review, 89(1/2), 88–95.
Foster, C., & Heeks, R. (2014). Nurturing user–producer interaction: inclusive innovation flows in a low-income mobile phone market. Innovation and Development, 4(2), 221–237. https://doi.org/10.1080/2157930X.2014.921353
Gebauer, H., Saul, C., Halidmann, M., & Kramer, S. (2017). When one business model is not enough for a social business. Strategic Direction, 33(1), 10–12. https://doi.org/10.1108/SD-06-2016-0096
George, G., McGahan, A. M., & Prabhu, J. (2012). Innovation for Inclusive Growth: Towards a Theoretical Framework and a Research Agenda: Innovation for Inclusive Growth. Journal of Management Studies, 49(4), 661–683. https://doi.org/10.1111/j.1467-6486.2012.01048.x
Goyal, S., & Sergi, B. S. (2015). Creating a formal market ecosystem for base of the pyramid markets - strategic choices for social embeddedness. International Journal of Business and Globalisation, 15(1), 63. https://doi.org/10.1504/IJBG.2015.070224
Goyal, S., Esposito, M., Kapoor, A., Jaiswal, M. P., & Sergi, B. S. (2014). Linking up: inclusive business models for access to energy solutions at base of the pyramid in India. International Journal of Business and Globalisation, 12(4), 413. https://doi.org/10.1504/IJBG.2014.062843
GSMA. (2016). The Mobile Economy Africa 2016. GSMA. Retrieved from http://www.gsma.com/mobileeconomy/africa/
Hahn, R. (2012). Inclusive business, human rights and the dignity of the poor: a glance beyond economic impacts of adapted business models. Business Ethics: A European Review, 21(1), 47–63. https://doi.org/10.1111/j.1467-8608.2011.01640.x
Hart, S. L., & London, T. (2005). Developing native capability. Stanford Social Innovation Review, 3(2), 28–33.
Heeks, R. (2012). IT innovation for the bottom of the pyramid. Communications of the ACM, 55(12), 24. https://doi.org/10.1145/2380656.2380665
Hossain, M. (2016). Frugal Innovation: A Systematic Literature Review. Available at SSRN: https://ssrn.com/abstract=2768254
Hossain, M., Simula, H., & Halme, M. (2016). Can frugal go global? Diffusion patterns of frugal innovations. Technology in Society, 46, 132–139. https://doi.org/10.1016/j.techsoc.2016.04.005

70
Hyvärinen, A., Keskinen, M., & Varis, O. (2016). Potential and Pitfalls of Frugal Innovation in the Water Sector: Insights from Tanzania to Global Value Chains. Sustainability, 8(9), 888. https://doi.org/10.3390/su8090888
International Monetary Fund. (2016). Regional Economic Outlook, October 2016, Sub -Saharan Africa. S.l.: INTL MONETARY FUND.
Jack, W., & Suri, T. (2011). Mobile Money: The Economics of M-PESA (No. w16721). Cambridge, MA: National Bureau of Economic Research. Retrieved from http://www.nber.org/papers/w16721.pdf
James, J. (2009). Leapfrogging in mobile telephony: A measure for comparing country performance. Technological Forecasting and Social Change, 76(7), 991–998. https://doi.org/10.1016/j.techfore.2008.09.002
James, J. (2012). The distributional effects of leapfrogging in mobile phones. Telematics and Informatics, 29(3), 294–301. https://doi.org/10.1016/j.tele.2011.09.001
James, J. (2016). The Impact of Mobile Phones on Poverty and Inequality in Developing Countries. Cham: Springer International Publishing. Retrieved from http://link.springer.com/10.1007/978-3-319-27368-6
Jovanovic, B., & Rousseau, P. (2005). General Purpose Technologies (No. w11093).
Cambridge, MA: National Bureau of Economic Research. Retrieved from http://www.nber.org/papers/w11093.pdf
Kamath, S. J., Lee, Y. J., & Zhang, X. T. (2013). Social enterprise models: creating the fortune at the base of the pyramid. International Journal of Social Entrepreneurship and Innovation, 2(3), 269. https://doi.org/10.1504/IJSEI.2013.057023
Kaplinsky, R., McCormick, D., & Morris, M. (2007). The impact of China on sub-Saharan Africa. Working paper series, 291. Brighton: IDS.
Kaplinsky, R. (2013). What Contribution Can China Make to Inclusive Growth in Sub-Saharan Africa?: China and Inclusive Growth in Sub-Saharan Africa. Development and Change, 44(6), 1295–1316. https://doi.org/10.1111/dech.12059
Karnani, A. (2007). The Mirage of Marketing to the Bottom of the Pyramid: How the Private Sector Can Help Alleviate Poverty. California Management Review, 49(4), 90–111. https://doi.org/10.2307/41166407
Karnani, A. (2009). Romanticising the poor harms the poor. Journal of International Development, 21(1), 76–86. https://doi.org/10.1002/jid.1491
Khanna, T., Palepu, K. G., & Sinha, J. (2005). Strategies that fit emerging markets. Harvard Business Review, 83(6), 63–74, 76, 148.
Klein, H. (2008). Poverty alleviation through sustainable strategic business models: essays on poverty alleviation as a business strategy = Armoedebestrijding via duurzame strategische bedrijfsmodellen. Rotterdam: ERIM.
Kolk, A., Rivera-Santos, M., & Rufin, C. (2014). Reviewing a Decade of Research on the “Base/Bottom of the Pyramid” (BOP) Concept. Business & Society, 53(3), 338–377. https://doi.org/10.1177/0007650312474928
Kolk, A., & van den Buuse, D. (2012). In search of viable business models for development: sustainable energy in developing countries. Corporate Governance: The International

71
Journal of Business in Society, 12(4), 551–567. https://doi.org/10.1108/14720701211267865
Lavie, D. (2006). The Competitive Advantage of Interconnected Firms: An Extension of the Resource-Based View. Academy of Management Review, 31(3), 638–658. https://doi.org/10.5465/AMR.2006.21318922
Lewandowski, M. (2016). Designing the Business Models for Circular Economy—Towards the Conceptual Framework. Sustainability, 8(1), 43.
Lipsey, R. G., Carlaw, K., & Bekar, C. (2005). Economic transformations: general purpose technologies and long-term economic growth. Oxford ; New York: Oxford University Press.
London, T., Anupindi, R., & Sheth, S. (2010). Creating mutual value: Lessons learned from ventures serving base of the pyramid producers. Journal of Business Research, 63(6), 582–594. https://doi.org/10.1016/j.jbusres.2009.04.025
Maurer, B. (2012). Mobile Money: Communication, Consumption and Change in the Payments Space. Journal of Development Studies, 48(5), 589–604. https://doi.org/10.1080/00220388.2011.621944
Michelini, L. (2012). Corporate Social Entrepreneurship and New Business Models. In L. Michelini, Social Innovation and New Business Models (pp. 19–35). Berlin, Heidelberg: Springer Berlin Heidelberg. Retrieved from http://link.springer.com/10.1007/978-3-642-32150-4_2
Miller, D. (2009). Selling solar: the diffusion of renewable energy in emerging markets. London: Earthscan.
Munir, K., Ansari, S., & Gregg, T. (2010). Beyond the hype: Taking business strategy to the “bottom of the pyramid.” In B. Joel A.C. & J. Lampel (Eds.), The Globalization of Strategy Research (Vol. 27, pp. 247–276). Emerald Group Publishing Limited. Retrieved from http://www.emeraldinsight.com/doi/abs/10.1108/S0742-3322%282010%290000027012
Nakasone, E., Torero, M., & Minten, B. (2014). The Power of Information: The ICT Revolution in Agricultural Development. Annual Review of Resource Economics, 6(1), 533–550. https://doi.org/10.1146/annurev-resource-100913-012714
Njenga, B. (2016, June 7). Interview with Acre representative. Nordhaus, W. D. (2007). Two Centuries of Productivity Growth in Computing. The Journal of
Economic History, 67(1). https://doi.org/10.1017/S0022050707000058 Osterwalder, A. (2004). The Business Model Ontology-a proposition in a design science
approach. Osterwalder, A., Pigneur, Y., & Clark, T. (2010). Business model generation: a handbook for
visionaries, game changers, and challengers. Hoboken, NJ: Wiley. Panapanaan, V., Bruce, T., Virkki-Hatakka, T., & Linnanen, L. (2016). Analysis of Shared and
Sustainable Value Creation of Companies Providing Energy Solutions at the Base of the Pyramid (BoP): SSVC by Energy Enterprises. Business Strategy and the Environment, 25(5), 293–309. https://doi.org/10.1002/bse.1866
Pansera, M., & Owen, R. (2015). Framing resource-constrained innovation at the “bottom of the pyramid”: Insights from an ethnographic case study in rural Bangladesh.

72
Technological Forecasting and Social Change, 92, 300–311. https://doi.org/10.1016/j.techfore.2014.10.004
Papaioannou, T. (2014). How inclusive can innovation and development be in the twenty-first century? Innovation and Development, 4(2), 187–202. https://doi.org/10.1080/2157930X.2014.921355
Peša, I. (2015). Homegrown or Imported? Frugal Innovation and Local Economic Development in Zambia. Southern African Journal of Policy and Development, 2(1), 15–25.
Peša, I. (2017). Sawdust pellets, micro gasifying cook stoves and charcoal in urban Zambia: Understanding the value chain dynamics of improved cook stove initiatives. Sustainable Energy Technologies and Assessments. https://doi.org/10.1016/j.seta.2017.02.010
Pick, J. B., & Sarkar, A. (2015). Digital Divide in Africa. In J. B. Pick & A. Sarkar (Eds.), The Global Digital Divides: Explaining Change (pp. 275–310). Berlin, Heidelberg: Springer Berlin Heidelberg. Retrieved from http://dx.doi.org/10.1007/978-3-662-46602-5_9
Peiffer, C., & Englebert, P. (2012). Extraversion, vulnerability to donors, and political liberalization in Africa. African Affairs, 111(444), 355–378. https://doi.org/10.1093/afraf/ads029
Prahalad, C. K. (2005). The fortune at the bottom of the pyramid. Upper Saddle River, NJ: Wharton School Publishing.
Prahalad, C. K. (2012). Bottom of the Pyramid as a Source of Breakthrough Innovations: BOP as Source of Innovations. Journal of Product Innovation Management, 29(1), 6–12. https://doi.org/10.1111/j.1540-5885.2011.00874.x
Prahalad, C. K., & Hammond, A. (2002). Serving the world’s poor, profitably. Harvard Business Review, 80(9), 48–59.
Priem, R. L., Li, S., & Carr, J. C. (2012). Insights and New Directions from Demand-Side Approaches to Technology Innovation, Entrepreneurship, and Strategic Management Research. Journal of Management, 38(1), 346–374. https://doi.org/10.1177/0149206311429614
Radjou, N., & Prabhu, J. C. (2014). Frugal innovation: how to do more with less (First edition). New York: PublicAffairs.
Ramani, S. V., SadreGhazi, S., & Duysters, G. (2012). On the diffusion of toilets as bottom of the pyramid innovation: Lessons from sanitation entrepreneurs. Technological Forecasting and Social Change, 79(4), 676–687. https://doi.org/10.1016/j.techfore.2011.06.007
Rao, B. C. (2013). How disruptive is frugal? Technology in Society, 35(1), 65–73. https://doi.org/10.1016/j.techsoc.2013.03.003
Ratchford, B. T. (2001). The Economics of Consumer Knowledge: Table 1. Journal of Consumer Research, 27(4), 397–411. https://doi.org/10.1086/319617
Ravishankar, M. N. (2016). A Bricolage Perspective on Technological Innovation in Emerging Markets. IEEE Transactions on Engineering Management, 63(1), 53–66. https://doi.org/10.1109/TEM.2015.2494501
Rosca, E., Arnold, M., & Bendul, J. C. (2016). Business models for sustainable innovation – an empirical analysis of frugal products and services. Journal of Cleaner Production. https://doi.org/10.1016/j.jclepro.2016.02.050

73
Sánchez, P., & Ricart, J. E. (2010). Business model innovation and sources of value creation in low-income markets. European Management Review, 7(3), 138–154. https://doi.org/10.1057/emr.2010.16
Schumacher, E. F. (2011). Small is beautiful: a study of economics as if people mattered. Random House.
Scott, I. (2017). A business model for success: Enterprises serving the base of the pyramid with off-grid solar lighting. Renewable and Sustainable Energy Reviews, 70, 50–55. https://doi.org/10.1016/j.rser.2016.11.179
Seelos, C., & Mair, J. (2007). Profitable Business Models and Market Creation in the Context of Deep Poverty: A Strategic View. Academy of Management Perspectives, 21(4), 49–63. https://doi.org/10.5465/AMP.2007.27895339
Simanis, E. (2011). Needs, needs, everywhere, but not a BoP market to tap. Next Generation Business Strategies for the Base of the Pyramid, 103–126.
Simanis, E., & Hart, S. (2008). Beyond selling to the poor: building business intimacy through embedded innovation. Johnson School of Management.
Simanis, E., & Hart, S. L. (2009). Innovation from the inside out. MIT sloan management review, 50(4), 77.
Snow, J. T., Biagini, B., Benchwick, G., George, G., Hoedjes, J., Miller, A., & Usher, J. (2016). A New Vision for Weather and Climate Services in Africa. New York, USA: UNDP.
Thompson, J. D., & MacMillan, I. C. (2010). Business Models: Creating New Markets and Societal Wealth. Long Range Planning, 43(2–3), 291–307. https://doi.org/10.1016/j.lrp.2009.11.002
Tiwari, R., Fischer, L., & Kalogerakis, K. (2017). Frugal Innovation: An Assessment of Scholarly Discourse, Trends and Potential Societal Implications. In C. Herstatt & R. Tiwari (Eds.), Lead Market India (pp. 13–35). Cham: Springer International Publishing. Retrieved from http://link.springer.com/10.1007/978-3-319-46392-6_2
Tiwari, R., & Herstatt, C. (2012). Frugal innovation : a global networks’ perspective. Die Unternehmung : Swiss Journal of Business Research and Practice ; Organ Der Schweizerischen Gesellschaft Für Betriebswirtschaft (SGB), 66(3), 245–274.
Tiwari, R., Kalogerakis, K., & Herstatt, C. (2014). Frugal innovation and analogies some propositions for product development in emerging economies. Retrieved from http://nbn-resolving.de/urn:nbn:de:gbv:830-tubdok-12735
van de Giesen, N., Hut, R., & Selker, J. (2014). The Trans-African Hydro-Meteorological Observatory (TAHMO): The Trans-African Hydro-Meteorological Observatory. Wiley Interdisciplinary Reviews: Water, n/a-n/a. https://doi.org/10.1002/wat2.1034
Winterhalter, S., Zeschky, M. B., & Gassmann, O. (2015). Managing dual business models in emerging markets: an ambidexterity perspective: Managing dual business models in emerging markets. R&D Management, n/a-n/a. https://doi.org/10.1111/radm.12151
Winterhalter, S., Zeschky, M., Gassmann, O., & Weiblen, T. (2014). Business models for frugal innovation: the role of Resource-Constraints.
World Bank. (2016). World Development Report 2016: Digital Dividends. The World Bank. Retrieved from http://elibrary.worldbank.org/doi/book/10.1596/978-1-4648-0671-1
74
World Economic Forum. (2012). Multiplying Agriculture by the Power of Mobile (Brief). World Economic Forum.
World Meteorological Organization, Etienne, C., Castonguay, S., Golnaraghi, M., Guha-Sapir, D., Below, R., … Centre for Research on the Epidemiology of Disasters. (2014). Atlas of mortality and economic losses from weather, climate, and water extremes (1970-2012). Retrieved from http://www.wmo.int/pages/prog/drr/transfer/2014.06.12-WMO1123_Atlas_120614.pdf
Yunus, M., Moingeon, B., & Lehmann-Ortega, L. (2010). Building Social Business Models: Lessons from the Grameen Experience. Long Range Planning, 43(2–3), 308–325. https://doi.org/10.1016/j.lrp.2009.12.005
Zeschky, M. B., Winterhalter, S., & Gassmann, O. (2014). From Cost to Frugal and Reverse Innovation: Mapping the Field and Implications for Global Competitiveness. Research-Technology Management, 57(4), 20–27.
Zott, C., Amit, R., & Massa, L. (2011). The Business Model: Recent Developments and Future Research. Journal of Management, 37(4), 1019–1042. https://doi.org/10.1177/0149206311406265

75

76
Consumption of Bottled Water at the Bottom of the Pyramid: Who Purchases First?22
22 This chapter is co-authored and based on the published work: Howell, R., Sinha, K. M., Wagner, N., Doorn, N., & van Beers, C. (2019). Consumption of Bottled Water at the Bottom of the Pyramid: Who Purchases First? Journal of Macromarketing. https://doi.org/10.1177/0276146719866890

77
Introduction While the last decade of research brought attention to the potential for businesses reaching the large and untapped market of low income consumers, it is debated whether businesses can be both profitable and meet needs for low income consumers (Agnihotri 2012; Karnani 2007; Meagher 2018; Prahalad 2005; Ramani and Mukherjee 2014). In order for businesses offering Bottom-of-the-Pyramid (BoP) innovations to be profitable and self-sustainable their innovations need to be widely adopted and consumed (Hall et al. 2014; Ramani and Mukherjee 2014). Although research examining marketing and consumption habits in developed markets is well established, consumers and their consumption decisions in the BoP is a less studied yet relevant focus as increasingly western firms target BoP markets (Agnihotri 2012; Kotler et al. 2006; Sheth 2011; Silvestre and Neto 2014). The seminal work of Prahalad and others (Montgomery et al. 2012; Prahalad 2005) implies that consumers at the BoP are homogenous, however more recent research points towards a more heterogeneous group of BoP consumers (Chikweche et al. 2012; Guarín and Knorringa 2014; Kotler et al. 2006; Marinakis et al. 2016). In particular, much of the BoP literature focuses on the Asian context with less work looking at African markets and consumers (Mair and Marti 2009; Prahalad 2012; Ramani et al. 2012). However, as a recent African Development Bank report highlighted, GDP growth in sub-Saharan Africa has outpaced other regions in the last 15 years, creating opportunities for market development (AfDB, 2016). This paper contributes empirical evidence to the debate on BoP consumer heterogeneity with a focus on the African context, by investigating characteristics of BoP customers who consume fresh drinking water in Kenya, Uganda and Rwanda. While marketing literature has increasingly looked at new markets in Asia and Africa, focusing on the potential for business, there is still limited understanding of how markets and consumers in these markets differ from developed markets (Kotler et al., 2006; Sheth, 2011). Authors have highlighted the issue of poverty changing the way consumers make purchase decisions (Bonsu & Polsa, 2011; Chikweche & Fletcher, 2011a). Additionally, other authors have criticized businesses seeking to reach poor consumers, arguing that they are often not being reached and may instead be exploited (Hahn 2009; Karnani 2007, 2009; Meagher 2018). Developing a better understanding of these aspects requires a deeper look into how consumers at the BoP are heterogeneous and how this influences the timing of their consumption decisions. Possible ways to understand consumers’ consumption behavior is to analyze individual characteristics, the local context in which the consumer is embedded and finally, the cultural context that shapes the local understanding (Ramani et al. 2012; Zanello et al. 2016). Despite the seeming resemblance, the various factors affecting the decision process of a BoP consumer are considerably different than the traditional consumers. One way to look at consumer heterogeneity is through timing of purchase and how BoP consumers may differ based on their time of purchase. Timing is relevant due to the severe budget and income constraints BoP consumers face that affect timing of purchase (Viswanathan et al. 2014; Yurdakul et al. 2017). The study at hand contributes to the scarce literature on BoP consumer heterogeneity by assessing the characteristics of consumers based on their time of purchase and whether there are systematic differences between groups . Two types of characteristics are analyzed – individual characteristics such as education and income, and features of the local context such as how the consumer received information about a product. The following research question is addressed: What is the effect of BoP consumer characteristics on their timing of consumption? The research contributes to BoP marketing literature in two ways: 1) it exposes the heterogeneity amongst BoP consumers by focusing on timing of consumption, 2) quantitative study on consumers in three countries. The context under study is the consumption of bottled water – of two different socially oriented companies (Dutch Water Limited and Jibu, L3C) in

78
urban East Africa (Kenya, Rwanda, Uganda). The first is a Dutch founded water company on the Kenyan coast and the second an American founded ‘social enterprise’ in the capitals of Rwanda and Uganda. We study 713 bottled water consumers breaking them apart by their time of purchase. This research aims to address the gap in empirical work at the BoP by focusing on differences between consumers based on their time of purchase and not at differences between consumers versus non-consumers, thus exposing BoP consumer heterogeneity. The study shows that late consumers have a lower level of education whereas earlier consumers are more likely to have purposefully searched for bottled drinking water. A novel feature of our analysis is that we can control for entry into different sales areas/zones. Controlling for location specific effects we demonstrate that consumption at the BoP is highly supply driven. Most importantly, the research suggests that unlike traditional consumers in developed markets, consumption of bottled water for BoP consumers does not seem to be influenced by wealth. The remainder of this paper is structured as follows: Section 2 provides an overview of existing literature on macromarketing at the BoP, BoP consumer studies and bottled water consumption. Section 3 presents the conceptual model. The study context is set up in section 4 and the variables and empirical model are detailed in Section 5. Results are presented in section 6 and the last two sections provide the discussion and conclusions.
Literature Review
Macromarketing at the BoP The advent of three changes have brought increasing attention to the importance of business in emerging markets and the BoP. First, besides Prahalad’s initial opening of the possibilities at the large and untapped BoP market, growth in emerging markets has occurred due to economic reforms in these countries. Second, due to the limited demand in advanced economies because of aging populations, BoP markets have been brought to the forefront. Finally, the advent of free trade and a rising new middle class have increased business opportunities at the BoP (Sheth, 2011). Therefore, understanding how marketing and consumer behavior is different in BoP markets has become a growing area of research (Bonsu & Polsa, 2011; Davies & Torrents, 2017; Jagadale et al., 2018; Jaiswal & Gupta, 2015; Kotler et al., 2006; Yurdakul et al., 2017). Besides the business opportunities in these new markets, there is the question of how marketing to these new demographics plays a role in poverty alleviation (Kotler et al., 2006). Therefore marketing literature on the BoP can be divided into two streams: case studies on specific markets (Alur & Schoormans, 2013; Banbury et al., 2015; Chikweche & Fletcher, 2011a; Davies & Torrents, 2017; Jagadale et al., 2018; Viswanathan et al., 2014; Viswanathan & Rosa, 2010), and how marketing strategies and consumer behavior more generally might differ in these markets (Agnihotri 2012; Bonsu and Polsa 2011; Kotler et al. 2006; Piacentini and Hamilton 2013; Sheth 2011; Subrahmanyan and Tomas Gomez-Arias 2008; Yurdakul et al. 2017). Focusing on the second stream of literature within marketing and consumer studies, highlights a few points about operating within BoP markets. First, authors have illuminated the issue of heterogeneity at the BoP both in terms of markets and consumers (Kotler et al., 2006; Sheth, 2011). Prahalad’s work overlooked the heterogeneity of this demographic (Agnihotri, 2012; Kotler et al., 2006). Rather than being one homogenous group with similar purchasing power, BoP consumers are driven to purchase products for different reasons and have different socio-demographic characteristics that drive them to make purchase decisions (Jagadale et al., 2018; Sheth, 2011). In addition to consumer heterogeneity, markets themselves are heterogeneous in the sense that one particular geographically demarcated market can be made up of consumers that have means to purchase and those who do not (Sheth, 2011). Second, marketing scholars

79
emphasize that poverty limits consumers from being part of a consumer society (Yurdakul et al., 2017). Consumption decisions are made less from the perspective of choices but more from immediate needs which challenges Prahalad’s notion of freedom of choice and individual empowerment through marketplace participation (Bonsu & Polsa, 2011; Viswanathan et al., 2014). Related to the issue of participation in a consumer society, other research has exposed that purchase decisions may be driven more by availability of products than specific desires (Chikweche & Fletcher, 2011b). Finally, studies that have focused on specific emerging/BoP markets have illustrated the lack of branding in many BoP markets (Sheth, 2011) and the problem of distribution and the importance of social networks and local entrepreneurs in overcoming this problem (Alur & Schoormans, 2013; Chikweche & Fletcher, 2011b; Davies & Torrents, 2017). Existing marketing literature on BoP markets exposes two areas for future research: unpacking consumer heterogeneity in BoP markets from an empirical perspective, and understanding better what drives consumers to purchase particular products, especially products that could be considered basic needs like clean drinking water (Kotler et al., 2006; Sheth, 2011; Yurdakul et al., 2017). This paper will explore consumer heterogeneity from a marketing perspective.
Consumer studies at the BoP BoP literature following Prahalad’s seminal work, emphasized both the need to define the poor and acknowledge their heterogeneity (Agnihotri 2012; Karnani 2007; Kotler et al. 2006). Investigating these two aspects requires a look at consumption at the BoP and what drives BoP consumers to make purchasing decisions. The literature on consumers and purchasing decisions at the BoP is mostly dominated by qualitative work (Chikweche et al. 2012; Nakata and Weidner 2012; Ramani et al. 2012; Subrahmanyan and Tomas Gomez-Arias 2008) with fewer quantitative investigations (Ernst et al. 2015). While the focus of this research is on consumption of goods not adoption of innovations, there is some overlap in factors driving these decisions. Adoption implies a time dimension and looking at the overall market, whereas consumption is an instantaneous purchase decision. Therefore, an overview from both types of literature is given. First an overview of qualitative work on adoption of innovations at the BoP, BoP consumers and their purchasing decisions is given and second the limited quantitative work is described. Zanello et al. (2016) conducted a systematic literature review looking at factors influencing purchase decisions at the BoP. The review highlights the importance of individual characteristics like education and financial means in a consumers’ choice. The characteristics of consumers that allow them to use a particular innovation to their advantage play a key role in creating demand at BoP (Ramani et al. 2012). An understanding of the nature and process of demand creation is important to understand the needs of the customers at BoP. The discrepancy in the perception of needs as experienced by the BoP and as perceived by a supplier is one of the main obstacles for purchase at the BoP (Zanello et al. 2016). The needs mismatch can be observed in case of technology design, product design and delivery design (Ramani et al. 2012). Chikweche and Fletcher (2012) also stress the lack of contextualized and local knowledge possessed by foreign firms seeking to operate in developing countries. Nakata and Weidner (2012) developed a conceptual model that looked at adoption of products at the BoP. The model emphasized adoption as a two-stage process: symbolic and material. Symbolic means a new product is ‘wanted/desired’, while material is the actual purchasing of

80
the product (Sen, 2001).23 According to the model, usually poor consumers desire/want a product, but the product is not purchased due to poverty. Therefore, both stages of adoption do not always occur at the BoP. Nakata and Weidner's (2012) model for new product adoption considered the effect of social context, poverty, marketing environment, and new product attributes. Furthermore, a limited number of studies have looked at the specificities of consumers in a BoP context, like the role played by family in the purchase decision making process. Chikweche et al. (2012) highlight how BoP markets have different characteristics through a case study about the role of family decision making in purchasing in Zimbabwe. Unlike developed markets, at the BoP the decision making for consumption of goods is a more of a joint process, with possibly different roles for different family members. Sometimes these roles overlap between individuals but the frequent difference between user and decision maker or even buyer plays a role for marketing and design of products. Another important observation that likely applies in other BoP contexts is the different types of purchasing decisions. Products are either bought instantaneously as they are needed, when the product is actually available, or when the household can afford products (Chikweche et al., 2012; Viswanathan et al., 2014). Education and information available to the consumer play a role in purchase decisions (Adkins and Ozanne 2005; Nakata and Weidner 2012; Prahalad and Hammond 2002; Ramani et al. 2012). Those with higher levels of formal education may make earlier purchase decisions. Finally, linking consumption to the discussion of timing of purchase also requires a look at the search process and the role of information that consumers seek out or receive (Chikweche and Fletcher 2012; Lüthje et al. 2005; Ramani et al. 2012; Subrahmanyan and Tomas Gomez-Arias 2008). Authors such as Kotler et al., (2006) mentioned the importance of marketing to early adopters of innovations at the BoP because this group can further diffuse innovations through word of mouth referral. Focusing on quantitative work, Ernst et al. (2015) studied the effect of bricolage, local embeddedness and standardization on product purchase. The quantitative findings from Ernst et al. (2015) support the qualitative research: bricolage and local embeddedness are positively related to adoption highlighting the importance of understanding aspects of local context like the product design required by the local population, and the social and cultural aspects of the local setup. Rahman et al. (2013) focus on the role played by brand orientation in creating a relative advantage at the BoP market of Bangladesh. Examining consumer data from Grameenphone Community Information Center, the authors show that brand orientation as a strategy has a positive effect on adoption of the innovation.
Consumption and Purchase of Clean Water Technologies At the BoP, where public access to clean drinking water is often limited, bottled water or other clean water innovations are necessary. From a macro perspective work has looked at the privatization of water resources and the rise of the bottled water industry both in developed and emerging markets (Patsiaouras et al. 2015). Specifically, there has been a rise in multinational companies CSR initiatives in emerging markets providing bottled drinking water (Brei & Böhm, 2011). These companies claim to be alleviating poverty through provision of clean
23 In economic consumer theory symbolic would be referred to as ‘preference’ and material as ‘revealed preference’ (Lancaster, 1966).

81
drinking water, but a more critical view suggests that the companies are also trying to change their image in developed markets (Brei & Böhm, 2011). Cohen et al. (2017) conducted a quantitative study to investigate predictors of boiled water and bottled water consumption in rural China analyzing data from 450 rural households in Guangxi province. The results show that female-headed households were more likely to boil water whereas higher-income households with younger, literate and male heads were more likely to purchase bottled water. Ritter et al. (2017) tested the effect of marketing strategies on consumers and suppliers for the case of household chlorination products employing a randomized controlled trial in rural Haiti. The results of the study suggest that visits from sales agents may increase purchase of chlorination products, however, the rise in sales does not cover the costs of the visit. The authors argue that in developing countries decisions related to promotion and pricing have long lasting health implications. Focusing only on factors driving bottled water consumption in emerging markets, there are a limited number of bottled water specific studies with mixed results. Research in Guatemala, the Philippines and Ghana showed that generally smaller, higher educated and higher income households were more likely to consume bottled water (Francisco 2014; Quansah et al. 2015; Vásquez 2017). However, in rural Guatemala, Vásquez (2017) found that income was not a significant driver for smaller purchases of bottled water. Income also had a minimal effect on bottled water consumption in the Philippines (Francisco, 2014). A gender effect did not show up in any of the quantitative studies, but qualitative research on bottled water consumers in Brazil hinted that women may be important decision makers in the choice of bottled water (de Queiroz et al. 2013). Overall, it has been found that the limited uptake of decentralized water solutions like bottled water were due to low affordability of the products, high income variability of consumers, and the companies’ challenges in communicating their value proposition (Dahlberg 2017). In summary, the work looking at bottled water consumption highlights the role of household head gender, education level, and wealth (Francisco, 2014; Quansah et al., 2015; Vásquez, 2017).
Conceptual Model Building on literature discussed above, we develop a conceptual model and three hypotheses regarding the timing of consumption of bottled drinking water in a BoP context. Education is considered to be a vital starting point for introducing change in consumption behavior of BoP consumers for basic needs like clean drinking water, health care alternatives, to mention few examples (Prahalad and Hammond 2002; UNDP 2008). Education provided to the consumer can be divided in two main categories: traditional education and customer education. Traditional education comprises of formal education provided at educational institutes, learning programs available on online platforms. Usually, BoP consumers have access to a lower level of education when compared with the main stream consumers (Ramani et al 2012; Nakata et al 2012). One of the reasons for the low level of education could be lack of access to up to date formal educational institutions that provide basic education and skill training (Subrahmanyan and Gomez-Arias 2008). In the presence of lack of basic education skill set, a BoP consumer may not feel equipped with sufficient information to make a consumption choice or lack the required agency to make a decision, in other words a lack of empowerment (Adkins & Ozanne, 2005). Education is one of the inputs which raises awareness, helps the poor consumer in understanding different aspects of their decision process like today’s gain in terms of need fulfillment as a compensation for today’s financial loss. Education thereby increases the chances of an informed choice being made by the poor

82
consumer. Hence, we argue that a high level of education leads to a consumption choice being made earlier rather than later. H1: Higher level of education increases the chances of earlier consumption. Receiving information is one of the first steps in gaining awareness about a product, especially at the BoP. To understand the structure of information received it is important to analyze who is bringing the information, to whom the information being transferred to and who is responsible for exchange of the information in a local setup. BoP consumers receive information via two means: personal network and in-person promotions. Consumers at the BoP depend on their personal network comprising of friends, relatives, neighbors while making consumption choices (Nakata and Weidner 2012). Traditional means of product promotion like advertisements via television are less influential in the BoP setup, where consumers prefer in-person promotion (Nakata and Weidner 2012; Chikweche and Fletcher 2012). Information received through the personal network and in-person promotions helps the consumer in understanding their need requirement. Both personal network and in-person promotion give the opportunity to receive information via personal interaction thereby, providing the possibility to see another consumer in their use environment. Understanding of need information and intended use environment help the consumer in building his/her local information (Lüthje et al., 2005). One of the inputs affecting accumulation of local information is personal network and chances of early consumer’s personal network knowing about the product is less when compared with the network of late consumer, even if all the consumers had a chance to attend the product demonstration. Furthermore, given the collectivist culture in a BoP setting, the local information about a product possessed by late consumers will be greater compared early consumers. Hence, we argue that receiving local information increases the chances of late consumption. H2: Local information increases the chances of late consumption. External information search is one input in the consumer decision process. Smith & Beatty (1987, p. 85) define external information search as ‘the degree of attention, perception and effort directed toward obtaining environmental data or information related to the specific purchase under consideration.’ While gathering information a poor consumer considers three main factors: cost benefit assessment of the purchase choice, factors related to the local context, and household specific factors (Chikweche et al. 2012; Ramani et al. 2012; Subrahmanyan and Tomas Gomez-Arias 2008). Local factors could include cultural environment, social capital, family systems and access to distribution systems. Household specific factors could include tastes, needs and willingness to explore different alternatives. Given the presence of collectivist culture at the BoP and the dependence of other consumers on their cultural environment while making choices, consumers who do not engage in a search process follow the choices of the majority BoP consumers or act to fulfill certain aspirational needs (Chikweche & Fletcher, 2014; Jaiswal & Gupta, 2015). Consequently, consumers who engage in purposeful external information search to understand consumption options might gain exposure to additional sources of information not available in his/her local context. The additional information may result in an earlier purchase when compared with other consumers. H3: External information search increases the chances of earlier consumption.
Study Context and Sampling
Context In this section we describe the local context of the three study countries: Kenya, Rwanda and Uganda.

83
Like many developing countries, Kenya faces the common problem of delivering fresh water to the entire population.24 Particularly due to urbanization, supply of quality water is a challenge. Often the quality of piped water is mediocre or unsafe for drinking. Although one of the Millennium Development Goals was improving access to improved water sources and progress was made in this regard it seems unclear whether access to an improved water source also implies access to safe drinking water (WHO et al. 2015). According to available data from 2014, 67% of the Kenyan population (with higher levels in urban areas) have access to an improved water source, where an improved water source is classified as the ‘main source of drinking water [being] a household connection (piped), public tap or standpipe, tube well or borehole, protected dug well, protected spring, rainwater collection, or bottled water’ (Kenya National Bureau of Statistics et al. 2015). Yet, there is evidence that many improved sources do have the bacteria e-coli and other contaminants suggesting that a better definition of improved water source is needed (Grady et al. 2015). Furthermore, a study for rural Kenya demonstrates that coping with poor water quality makes households incur further costs (Cook et al. 2016). Access to clean water for all is further put under pressure since Kenya’s water supply was privatized in 2002 through reforms that decentralized water provision (Ministry of Water and Irrigation, 2017; Water Services Regulatory Board, 2014). Piped water delivery in Kampala, Uganda is slightly different than in Kenya. The National Water and Sewage Corporation (NWSC) is responsible for water delivery in Kampala. NWSC is a parastatal, owned by the government. The costs of the water corporation are only partially covered by revenues from consumers. Larger investments come from the government through donor funds. NWSC is under the jurisdiction of the Ministry of Water and the Environment.25 The water quality at the source is managed by the Ministry but tapped water quality is managed by NWSC. Unlike at the Kenyan coast, supply is less of a concern in Kampala due to supply from nearby Lake Victoria. While there are some supply and demand issues, it is an infrequent occurrence compared to Kenya. Quality issues in Kampala are mainly due to old piping infrastructure and illegal tapping of pipes. Yet, water quality issues have created a large market for bottled water. This market is not properly regulated leading to cases where branded bottled water containers are filled with unpurified water and resold. Due to regulation problems, knowledge on certification in Kampala seems to be high and consumers desire water that has been certified by the Uganda Bureau of Standards (UNBS).26 While Kigali, Rwanda faces some of the same water delivery issues as in Kenya and Uganda, the governance of water delivery is again different. Water delivery is regulated by the Rwanda Utilities Regulatory Agency (RURA). Companies must pay for a license for a particular operating area in order to delivery water to that region. Although competition is technically allowed, when a company acquires a license for an area, no other companies can supply water in the same area. In Kigali and the major cities of Rwanda, water is supplied by a government owned, private company called Water and Sanitation Corporation (WASAC), which has a monopoly there.27 Kigali is attempting to address existing shortages in water supply. Two new
24 Water delivery is regulated through two agencies under the Ministry of Water: Water Services Regulatory Board (WASREB) and Water Resources Management Authority (WMRA).
25 https://www.nwsc.co.ug/index.php/faqs accessed 4 May 2017. 26 Interview with the research director of the National Water and Sewage Corporation (NWSC) on 5 May 2017. 27 http://www.wasac.rw/index.php/about-us. Accessed 11 May 2017.

84
purification plants are nearly complete that are expected to fulfill the remaining supply needs of Kigali. Like in the Kampala and Mombasa area, Kigali’s piping infrastructure is old and illegal tapping of water is widespread. Moreover, like Mombasa, Kigali has experienced rapid population growth in particular in the period directly following the genocide of 1994. The existing infrastructure is insufficient for the current population.28 In all three locations, the combination of insufficient supply, and unsafe quality has created a market for bottled water. While the underlying factors that have constituted markets for innovations in bottled water are similar, location specific factors are likely to have influenced how these products are consumed.
Case Descriptions Data for this study was collected from two bottled water companies: Dutch Water Limited (DWL) and Jibu, L3C. While there is a large market for bottled drinking water in East Africa (Dahlberg, 2017), the two companies were specifically selected for their unique business models and explicit social oriented missions. The two selected companies highlight the ethical complexities of fresh drinking water provision in an emerging market setting. Bottled water is traditionally an expensive product and companies like Coca Cola’s Dasani brand, have often been criticized for creating markets for bottled drinking water in areas plagued with water quality and supply issues (Brei & Böhm, 2011). DWL and Jibu are both socially oriented in their mission yet take a different delivery approach. Unlike traditional bottled water companies, Jibu and DWL seek to only use reusable bottles to minimize plastic waste. DWL is a water company based in Mtwapa, Kenya founded in 2006 through a partnership and investment from two Dutch firms: Hatenboer and Reikon. DWL provides bottled drinking water to three Kenyan counties (Kilifi, Kwale, and Mombasa) in the region surrounding Mombasa. DWL’s core low cost product is a 10L reusable jerry can. DWL’s distribution model is to sell to small shops in the area through water delivery on tuk-tuks. Jibu, L3C (Low profit liability company) is an American founded ‘benefit corporation’ selling low cost bottled drinking water in Uganda, Rwanda and Kenya. Jibu was founded in 2012. It started with simultaneous pilots in Uganda, Rwanda and the Democratic Republic of Congo in 2013. Jibu’s declared goal was to find a suitable model to provide low cost drinking water and shift consumers from boiling to bottled water. Their target consumer base is ‘missing middle’ or ‘middle of the pyramid’ consumers in urban areas in emerging markets. In 2014, Jibu began with a franchise model in Kigali and Kampala. Water purification is decentralized at each franchise location. Purification is done with ultra-filtration technology designed specifically for the conditions in each city. Franchises purify city water and package it into various sizes of reusable bottles. Part of Jibu’s social vision is providing entrepreneurship opportunities through their franchise model. While DWL has the social mission of providing affordable drinking water, it also has the dual goal of running a financially sustainable business. In the beginning of 2016, due to changes in tax law, DWL had to adjust its business activities to accommodate a sharp increase in excise taxes on water. Although all competitor manufacturers of bottled water were initially affected by the excise tax increase, DWL is the only company that fully complied, meaning that water
28 Interview with the director of water regulation from Rwanda Utilities Regulatory Agency (RURA) on 11 May 2017.
85
prices for a 10L jerry nearly doubled and DWL now offers a much higher priced product than competitors. Jibu provides a contrasting case study in the consumption of bottled water. Due to Jibu’s social benefit corporation status, the company aims to provide the lowest cost refill prices for bottled water in their areas of operation. A social benefit corporation is a relatively new business designation that allows businesses to incorporate a social mission explicitly into their strategy, allowing them to accept different types of investments and zero margins29. Jibu consumers pay a relatively high bottle deposit fee, then a low refill price. In some cases, because profit is not the only motive of Jibu, they accept zero margin on their refill prices to maintain the lowest cost water.
Sampling Sampling for the two companies was done using stratified random sampling to account for demographic differences in the geographic areas of operation for the two companies. In both cases randomization occurred at the sales area (DWL) or zone level (Jibu) where demographic characteristics would be similar rather than randomly selecting consumers from the entire population. This insured that the overall sample was representative of DWL and Jibu consumers. Jibu conducted phone interviews with their consumers based on lists of loyal customers collected from each franchise. Jibu divides their cities into zones, which are based on population density. Consumers were randomly selected from the given lists according to the percentage of sales in each zone. Jibu conducted data collection in December 2016 (Rwanda) and March 2017 (Uganda). The DWL questionnaire was based on Jibu’s questionnaire for consistency between the three countries. There were 19 and 20 zones in Rwanda and Uganda respectively. The majority of sampling occurred in Jibu zones within Kigali and Kampala, but some consumers were sampled from franchises in Busenyi (North western Rwanda), and Entebbe (near Kampala-Uganda). These areas are also mostly urban like Kigali and Kampala. In addition to Jibu’s consumer survey, we collected similar data on Jibu non-consumers in May 2017. Non-consumers were randomly interviewed at Jibu micro-franchise locations. Data collection in Kenya was done in March 2017. DWL’s main factory is in Mtwapa in Kilifi county. From there water is distributed to six distribution points located in the three counties of operation. At each of the six-distribution points and the main factory there are sales areas. Sales areas represent the routes the water is distributed along using auto rickshaws. In each sales area there are DWL vendors, usually small kiosks that sell DWL and other water brands, along with general products. According to DWL, there are roughly 5,000 vendors in Mombasa, Kilifi, and Kwale counties. Out of the 5,000 vendors, 112 were randomly selected for our study. At each vendor three consumers and four non-consumers were interviewed. During test surveys it was discovered that it can be challenging to locate consumers, therefore selection was based on proximity to the vendor. Consumers were determined by their response to the question: ‘When did you last purchase DWL/Jibu water?’ Respondents who purchased DWL/Jibu water in the last year were considered consumers. Figure 12 gives an overview of the survey respondents and selection
29 https://benefitcorp.net/

86
criteria. In Kenya, we have a sample of 326 consumers, the Rwanda sample consists of 292 consumers, and the Uganda sample of 188 consumers.
Panel A: DWL Sampling
Panel B: Jibu Rwanda Sampling
Panel C: Jibu Uganda Sampling
Figure 12: Sampling in the three countries
Vendors (N=112): Stratified random sample
Consumers, 3 at each vendor (N=326)
Early
Time of Purchase> 2 years ago
N= 121
Middle
Time of Purchase> 1 ≤ 2 years ago
N= 97
Late
Time of Purchase ≤ 1 year ago
N= 108
Consumers (N=292) : Random selection from consumer lists at each franchise
Early
Time of Purchase> 2 years ago
Middle
Time of Purchase> 1 ≤ 2 years ago
Late
Time of Purchase ≤ 1 year ago
Consumers (N=188) : Random selection from consumer lists at each franchise
Early
Time of Purchase> 2 years ago
Middle
Time of Purchase> 1 ≤ 2 years ago
Late
Time of Purchase ≤ 1 year ago

87
Data and Empirical Model
Variable Description The focus of the study is exposing consumer heterogeneity; therefore, consumers were divided into three categories based on their time of first purchasing DWL or Jibu water. The dependent variable is the consumer category. Jibu data was based on a company survey and the questionnaire used for DWL was based on Jibu’s survey. The categories of consumers are as follows: (i) Early consumers (first purchase greater than 2 years) (ii) Middle consumers (first purchase between 1 and 2 years) and (iii) Late consumers (first purchase from 1 year to present). To ensure comparability across the empirical analyses of the three datasets only variables that were measured in all three datasets were included. In the first specification, only control variables were included: the gender of household head which is a binary variable that is equal to 1 for male and zero otherwise, and the Progress out of Poverty Index (PPI). Chikweche et al. (2012) discuss the role of decision maker and purchaser gender in African households. The PPI score does not measure wealth directly but can be viewed as an asset index. A score is assigned to every respondent based on his or her response to a set of ten questions related to assets and household demographics.30 The PPI allows us to empirically represent the local context of each country since the questionnaire differs from country to country. It should be noted that the PPI score is updated regularly based on new household surveys conducted in each country. For Uganda the 2012 survey was used, for Kenya 2005, and for Rwanda 2005. The next three specifications add the independent variables: education, local information and external information. education which consists of two binary variables, one for secondary education and one for higher education. The excluded category is made up of individuals with primary or no education. Local information measures whether the individual had received personal information about the bottled water under study either through a company representative or personal recommendation from a friend or relative. The fourth specification adds the independent variable of a purposeful search for clean water which represents the external information search. A table detailing the different variables, what they proxy, and their literature motivation is presented in the appendix (Table A1). All specifications contain controls for the location of the sales points to capture differences in infrastructure and market settings across the different sales points that are likely to affect the decision and timing of uptake of bottled water. Note that both companies entered different sales areas/zones at different points in time. Therefore, it is necessary to control for these regional differences. The location specific effects control for differences in local infrastructure, local embeddedness, and local context within each sub-market is represented by the different sales areas/zones. This takes the work of Ernst et al. (2015) on local embeddedness a step further. Table A2 in the appendix shows the relative frequencies for consumer categories per sales area/zone, demonstrating that there is significant variation across sales areas by consumer category. For example, there is a higher relative frequency of respondents in the late category for Kilifi as compared to early consumers because Kilifi is an older market area for DWL. Similar relative frequencies can be found for the Jibu zones depending on the entry of the company into the respective zone.
30 For more information see: https://www.povertyindex.org/. Last accessed: 20 June 2018.

88
Empirical Model With the empirical analysis we want to assess the heterogeneity across consumers by analyzing the determinants of the timing of initial consumption across our three consumer groups. Before studying within consumer heterogeneity, we start out with a comparison between consumers and non-consumers to set the stage. Standard innovation diffusion literature compares consumers with non-consumers through a probit or logit model (Geroski, 2000). We employ the logistic function to model a binary dependent variable, i.e. the decision to consume bottled water. For every individual i in location l we estimate the following model: P(Yil=1) = 1/(1+ exp(-(β0 + β1Xil)) (1) where Yil is equal to 1 for consumers and Xil contains the control variables of interest, i.e. gender of the household head, the education level, an asset index, and location specific effects. We limit the analysis to this small set of predictors since we are mainly interested in purchase decisions related to education, economic wellbeing and easy access to the water, i.e. being near to the bottled water supply. Standard errors are clustered at the location level. Imposing the logistic transformation, we obtain a model that is linear in its predictors. The model is fit by maximum likelihood. ln(P(Yil=1)) = β0 + β1Xil (2) The outcome of interest (dependent variable) is the category in which the consumers fall based on their timing of initial consumption: (i) early consumers, (ii) middle consumers, (iii) late consumers. Technically our outcome of interest can be viewed as an ordinal variable. At the same time, the distance between categories is not a measure of actual distance. We cannot ‘rank’ the categories such that we could say late consumers are more important than early ones. The different consumer groups merely represent the different points in time when the consumers started purchasing bottled water. Therefore, we decided to employ a multinomial logistic regression model, which extends the logit model to a multiclass analysis without taking the ordering into account. For every class we estimate the effect of the predictors on the probability of success in that class compared to the reference class. Each class has its own intercept and regression coefficients meaning that the predictors can affect each category differently.31
31 The disadvantage of employing the multinomial logit is that we throw away information about the ordering in time. An ordinal logit model would preserve that information but imposes stronger assumptions, i.e. the proportional odds assumption. But, for the case at hand we consider it as an advantage that the multinomial logit allows us to estimate different coefficient estimates for the predictors in every category whereas the ordered logit only identifies individual intercepts for every class but the same predictor coefficients
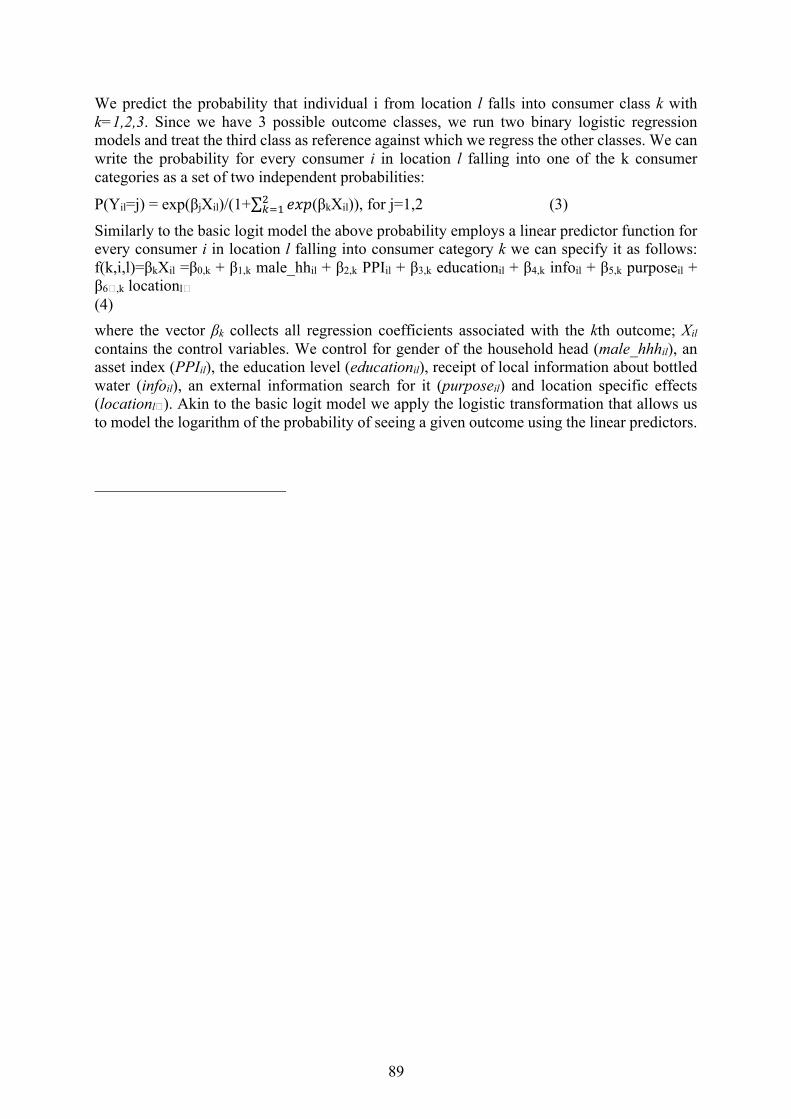
89
We predict the probability that individual i from location l falls into consumer class k with k=1,2,3. Since we have 3 possible outcome classes, we run two binary logistic regression models and treat the third class as reference against which we regress the other classes. We can write the probability for every consumer i in location l falling into one of the k consumer categories as a set of two independent probabilities:
P(Yil=j) = exp(βjXil)/(1+∑ "#$!"#$ (βkXil)), for j=1,2 (3)
Similarly to the basic logit model the above probability employs a linear predictor function for every consumer i in location l falling into consumer category k we can specify it as follows: f(k,i,l)=βkXil =β0,k + β1,k male_hhil + β2,k PPIil + β3,k educationil + β4,k infoil + β5,k purposeil + β6�,k locationl� (4) where the vector βk collects all regression coefficients associated with the kth outcome; Xil contains the control variables. We control for gender of the household head (male_hhhil), an asset index (PPIil), the education level (educationil), receipt of local information about bottled water (infoil), an external information search for it (purposeil) and location specific effects (locationl�). Akin to the basic logit model we apply the logistic transformation that allows us to model the logarithm of the probability of seeing a given outcome using the linear predictors.
90
The model is estimated by maximum likelihood. Standard errors are clustered at the sales point level to account for correlated residual variation. Since the coefficient estimates of a multinomial logit model cannot be directly interpreted, the marginal effects were computed and are presented (Cameron and Trivedi 2009; Wooldridge 2016).
Descriptive Statistics Descriptive statistics for all three countries are presented in Table 14. DWL entered the market in 2006 so the early consumer category makes up a larger percentage than for Jibu Uganda and Rwanda. Almost 40% of DWL consumers are early consumers with a fairly even split in the middle and late categories. The opposite is true for Jibu due to their market entry in 2014. For Jibu Rwanda 40% of consumers fall in the late category, and for Jibu Uganda 61%. Jibu Uganda only has 9% of consumers in the early category whereas there’s a more even split for Jibu Rwanda between the early and middle categories (24% and 36%). There is stiff bottled water competition in Uganda, so it is possible that the customer lists in Uganda represent more recent Jibu consumers. Concerning the characteristics of the consumers there are some demographic differences between the three countries. The majority of DWL consumers have an education level of secondary (55%). One quarter of the DWL sample is university educated. Education levels are even higher for Jibu consumers, with 40% (Rwanda) and 55% (Uganda) of consumers being university educated. This finding indicates already that both companies are not reaching the intended BoP consumers, which are more likely to be those with no or limited education. Turning to gender, a lower number of DWL consumers were both male and the household head (38%) than Jibu (65%-Rwanda, and 59%-Uganda). Looking at how consumers received information about DWL and Jibu shows that most (38%) consumers received information about DWL through personal interactions (i.e. a friend or a DWL sales representative) with the remaining consumers either purchasing because of a purposeful search for clean drinking water or an impersonal source like an advertisement. For Jibu the source of information varied between countries. In Rwanda 23% of respondents received personal information about Jibu versus 65% for Uganda. A purposeful search for a new affordable clean drinking water brand was highest for Rwanda consumers (19%) compared to Kenya and Uganda (16% and 13% respectively). Finally, looking at the asset index as a proxy for wealth of the consumers across the three countries using the PPI score shows that the average PPI score is at least ten points higher for Rwandan and Ugandan consumers (70 and 68 respectively) compared to Kenya (57). Note that higher PPI scores can be used to indicate higher levels of wealth. The difference in average PPI score could be due to the sampling differences (for Jibu mostly loyal customers were interviewed) but also due to geographic differences since Jibu is located in the capital cities of Uganda and Rwanda where wealth is likely higher than on the Kenyan coast. The distribution of the PPI score is fairly spread for Kenya and more skewed to the right for Uganda and Rwanda, i.e. the scores fall toward the higher side of the scale and there are very few low scores (Figure 12). Figure 12 shows that DWL has a larger spread of income levels in spite of having the highest water prices in the coastal region. Using a cut off of $2.50/day ( Prahalad 2005), 42.6% of DWL’s consumers could be classified as low income. However, a greater percentage would be considered middle class ($2.50-$8.44/day) and above. In contrast to DWL consumers, both Jibu Uganda and Rwanda consumers make up a higher income demographic. The majority of both country’s consumers would be considered middle class or higher.

91
Table 14: Descriptive statistics
Kenya Rwanda Uganda
Mean Std. Dev. Mean Std.
Dev. Mean Std. Dev.
Consumer categories
Early consumer 0.398 0.237 0.093
Middle consumer 0.285 0.360 0.292
Late consumer 0.318 0.403 0.615
Control variables
Male household head 0.383 0.647 0.590
PPI poverty score 57.193 15.319 70.14
7 9.706 68.317 8.279
Education (Excluded category: No formal education and primary education)
Secondary 0.551 0.338 0.280
University 0.252 0.406 0.534
Received personal information about water 0.38 0.219 0.652
Purposeful search 0.164 0.212 0.13
Observations 274 278 161
Note: The descriptive statistics were derived based on the regression models including the full set of covariates

92
Figure 13: Income distribution of consumers
Results The first analysis is the estimation of a logit model of consumers versus non-consumers of the two companies. The logit model of consumers only is given in the Appendix (Table A3) and
Panel A: DWL Consumers
Panel B: Jibu Uganda Consumers
Panel C: Jibu Rwanda Consumers
13,7%
28,9%
20,9%25,0%
11,5%
0,0%
5,0%
10,0%
15,0%
20,0%
25,0%
30,0%
35,0%
< $1.25 $1.25 -$2.50
$2.50 -$4.00
$4.00 -$8.44
> $8.44
Perc
enta
ge o
f DW
L
Con
sum
ers
Daily Household Income (2005 PPP)
1%5% 7%
40%
27%
20%
0%5%
10%15%20%25%30%35%40%45%
< $1.25 $1.25 -$2.00
$2.00 -$2.50
$2.50 -$5.00
$5.00 -$8.44
> $8.44Perc
enta
ge o
f Jib
u U
gand
a C
onsu
mer
s
Daily Household Income (2005 PPP)
5%
14%
9%
32%
17%
22%
0%
5%
10%
15%
20%
25%
30%
35%
< $1.25 $1.25 -$2.00
$2.00 -$2.50
$2.50 -$5.00
$5.00 -$8.44
> $8.44
Perc
enta
ge o
f Jib
u R
wan
da
Con
sum
ers
Daily Household Income (2005 PPP)

93
highlights the reason for only focusing on consumers of the two companies. Because not all non-consumer data was available for Uganda the logit was only conducted for Kenya and Rwanda. Additionally, there was no data available for the household role for Rwanda, so instead of the male household head variable simply respondent gender was used. The logit results presented in Table A3 in the appendix show two findings that help strengthen the argument to further break apart the consumers of the two companies. First, the results differ between the two countries. In Rwanda, male respondents are more likely to purchase water, and those with a university education are more likely to be Jibu consumers. Additionally, for Jibu consumers, using the asset index, wealthier consumers are more likely to purchase Jibu water. The results are different for Kenya. Gender and wealth have no influence, rather DWL consumers are merely more likely to have a higher level of education (secondary or university). Therefore, understanding the heterogeneity within consumers and between countries is the focus. The results of the main multivariate analysis are presented in Table 15 for each category of consumer. The middle category was used as the base category but the full regression results are presented to highlight the differences between the three consumers categories. Four specifications are presented for every country. They all contain location fixed effects to account for the fact that DWL and Jibu entered different areas at different points in time. Specification 1 focuses on the socio-demographic determinants, i.e.: wealth and gender. For Jibu Rwanda consumers, early consumers are about 15 percentage points more likely to be male household heads. In Uganda, an opposite effect is shown with middle consumers being less likely to be male by 11 percentage points and late consumers being more likely to be male by about 9 percentage points. The result does not show up for Kenya, which could be due to cultural differences between the three countries. Additionally, note that overall Kenya had a lower percentage of male household heads (38%) than Rwanda and Uganda. However, the existing literature also suggests that women household heads may be less likely to be risk taking in consumption decisions (Byrnes et al., 1999). Finally, it is important to note that the Rwanda dataset had the highest percentage of male household heads (65%). Looking at wealth as measured by the asset index PPI score, overall wealth does not determine consumption decisions in all countries. For Kenya and Rwanda there is an economically small wealth effect for late consumers. For both countries wealthier respondents are less than 1 percentage point less likely to be late consumers. Since the wealth effect, if identified at all, is very small, these results suggest that wealth cannot be considered an important driver in timing of purchase. Considering that DWL nearly doubled their water prices during the period of time for late consumers, the individuals who we identify as late consumers do not have income as a binding factor to consumption. Overall specification 1 neither supports nor disproves that DWL or Jibu reaches poor households. But taken with the descriptive statistics, the findings suggest that neither company are reaching BoP consumers. This result is particularly relevant for Jibu since Jibu income data suggests that Jibu consumers are at a higher end of the income spectrum. In the next step (Specification 2), the effect of education is assessed. There is a small education effect for the middle and late consumer categories of DWL. For two of the specifications in the middle category of DWL consumers, having a university education increases the chance of being a middle consumer by almost 12 percentage points. However, the education effect does not show up for Jibu consumers. But it should be noted that Jibu consumers are on average even higher educated compared to the DWL consumers. Due to a relative lack of variation in education among Jibu consumers we are unable to identify an education channel for Rwanda and Uganda. This could be due to sampling issues and demographic differences between Jibu being located in capital cities and DWL in a less educated and less urban region.

94
In specification 4 we added information related variables, namely whether the consumer received local information about DWL/Jibu and whether the consumer searched for bottled water on purpose. Rwandan consumers receiving local information are less likely to be late consumers . In Kenya early consumers were about 13 percentage points less likely to have received local information. Finally in Uganda, consumers in the middle category were less likely to have received local information. This result fits with the market situation in Rwanda. Jibu entered the market when there was already a well-established market for bottled water, suggesting that early consumers would have purchased due to curiosity and not through local information. Looking at the consumption decision being made as a result of a purposeful search for drinking water alternatives shows a few interesting results. For Uganda, early consumers were 10 percentage points more likely to have conducted a purposeful search. A nearly significant (p=12%) similar result is shown in Rwanda with early consumers being 11 percentage points more likely to conduct a purposeful search. For the middle category of consumers in Uganda and Rwanda, opposite effects are shown. Uganda middle consumers are less likely to have been purposefully searching for water (20 percentage points) and in Rwanda the middle consumers are slightly more likely to conduct a purposeful search. Finally, Rwandan late consumers were more than 20 percentage points less likely to have been purposefully searching for water. In Kenya, purposeful search only showed up significant for consumers in the middle group with those purchasing due to a purposeful search being 19 percentage points more likely to be middle consumers. For DWL consumers, in the last year before data collection water prices doubled, which means particularly for late consumers the reasons to purchase DWL water may have changed. The most important finding is related to the supply side dimension of consumption and is disguised in the tables presented. Across all empirical models we include location fixed effects. The coefficients associated with the location fixed effects tend to be large in absolute terms and are jointly statistically significant (p-value<0.000) suggesting that it is location characteristics that are the most important determinants of the consumption of bottled water. Since, the two companies entered the different sales areas at different moments in time, the location fixed effects also include market entry and suggest that the strongest determinant of uptake is the timing of market entry. This finding shows that at the BoP, due to the many constraints the individuals and households are facing, the likelihood of demand driven consumption is limited. Concerning the reliability of our results across specifications, Table 2 shows that there is stability of the coefficient estimates across models. The stability of the coefficients suggests that the identified pathways are meaningful and not driven by omitted variables that might appear in the specifications with a limited number of control variables. Secondly, as a further robustness check the PPI score was divided into two categories by using the median PPI score for each country dataset to construct a binary variable ‘asset poor’ (1=poorer group, 0=higher group). These results are presented in the Appendix and show consistency with the main results in terms of coefficient signs and values.

95
Table 15: Empirical results of determinants of consumption of bottled water in Kenya, Rwanda and Uganda: multinomial logit estimates
Kenya Rwanda Uganda
(1) (2) (3) (4) (5) (6) (7) (8) (9) (10) (11) (12)
Early Consumers
Male household head 0.012 0.018 0.024 0.026 0.156*** 0.152*** 0.149*** 0.146*** 0.025 0.023 0.027 0.024
(0.060) (0.057) (0.053) (0.054) (0.037) (0.043) (0.045) (0.049) (0.037) (0.037) (0.032) (0.031)
PPI score -0.059 0.001 0.001 0.001 -0.002 -0.002 -0.002 -0.002 -0.001 -0.001 -0.001 -0.001
(0.067) (0.002) (0.002) (0.002) (0.003) (0.003) (0.003) (0.003) (0.002) (0.002) (0.002) (0.002)
Education (Excluded category: No formal education and primary education)
Secondary -0.017 -0.0133 -0.013 -0.025 -0.028 -0.035 0.008 0.026 0.027
(0.092) (0.097) (0.099) (0.072) (0.073) (0.072) (0.055) (0.054) (0.052)
University 0.060 0.080 0.083 0.003 0.004 0.002 -0.018 -0.007 0.001
(0.095) (0.101) (0.103) (0.046) (0.046) (0.044) (0.031) (0.030) (0.028)
Received personal information about water -0.103 -0.127* -0.023 0.003 0.054 0.086
(0.069) (0.071) (0.053) (0.064) (0.062) (0.064)
Purposeful search -0.067 0.119° 0.109***
(0.051) (0.076) (0.037)
Middle Consumers
Male household head 0.065 0.084** 0.084** 0.080** -0.092* -0.091° -0.083 -0.089 -0.113* -0.110** -0.114** -0.114**
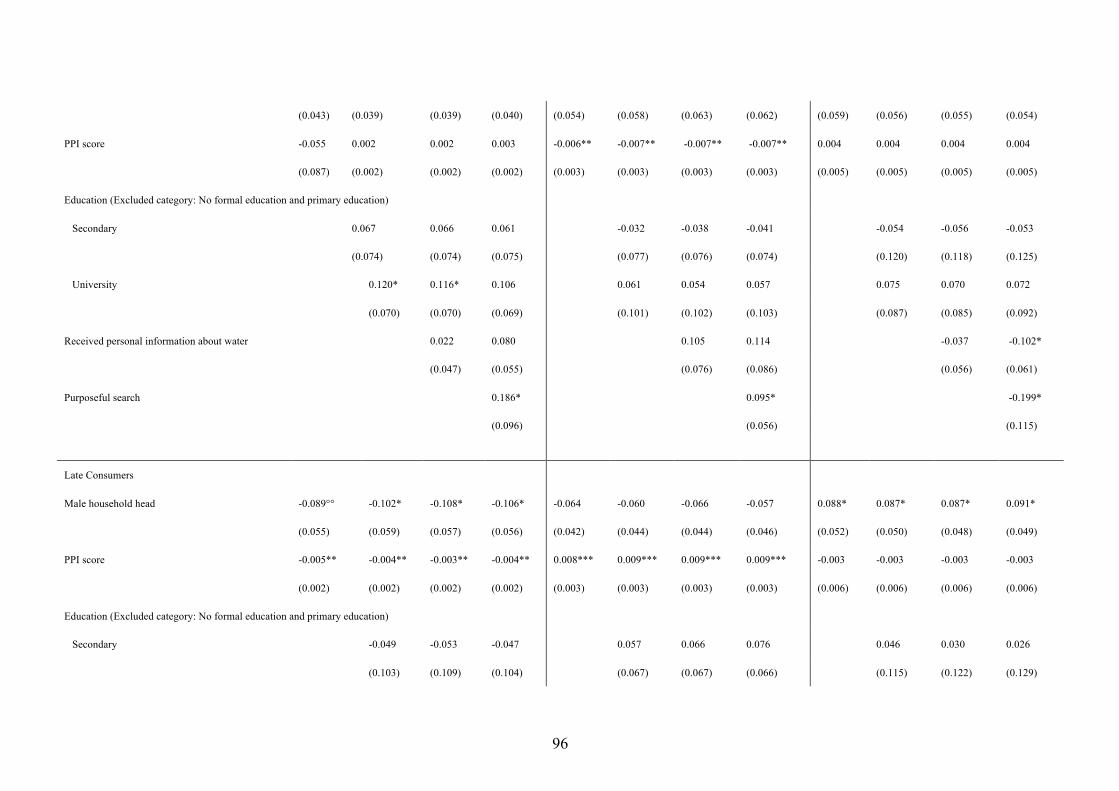
96
(0.043) (0.039) (0.039) (0.040) (0.054) (0.058) (0.063) (0.062) (0.059) (0.056) (0.055) (0.054)
PPI score -0.055 0.002 0.002 0.003 -0.006** -0.007** -0.007** -0.007** 0.004 0.004 0.004 0.004
(0.087) (0.002) (0.002) (0.002) (0.003) (0.003) (0.003) (0.003) (0.005) (0.005) (0.005) (0.005)
Education (Excluded category: No formal education and primary education)
Secondary 0.067 0.066 0.061 -0.032 -0.038 -0.041 -0.054 -0.056 -0.053
(0.074) (0.074) (0.075) (0.077) (0.076) (0.074) (0.120) (0.118) (0.125)
University 0.120* 0.116* 0.106 0.061 0.054 0.057 0.075 0.070 0.072
(0.070) (0.070) (0.069) (0.101) (0.102) (0.103) (0.087) (0.085) (0.092)
Received personal information about water 0.022 0.080 0.105 0.114 -0.037 -0.102*
(0.047) (0.055) (0.076) (0.086) (0.056) (0.061)
Purposeful search 0.186* 0.095* -0.199*
(0.096) (0.056) (0.115)
Late Consumers
Male household head -0.089°° -0.102* -0.108* -0.106* -0.064 -0.060 -0.066 -0.057 0.088* 0.087* 0.087* 0.091*
(0.055) (0.059) (0.057) (0.056) (0.042) (0.044) (0.044) (0.046) (0.052) (0.050) (0.048) (0.049)
PPI score -0.005** -0.004** -0.003** -0.004** 0.008*** 0.009*** 0.009*** 0.009*** -0.003 -0.003 -0.003 -0.003
(0.002) (0.002) (0.002) (0.002) (0.003) (0.003) (0.003) (0.003) (0.006) (0.006) (0.006) (0.006)
Education (Excluded category: No formal education and primary education)
Secondary -0.049 -0.053 -0.047 0.057 0.066 0.076 0.046 0.030 0.026
(0.103) (0.109) (0.104) (0.067) (0.067) (0.066) (0.115) (0.122) (0.129)

97
University -0.180 -0.196° -0.189 -0.064 -0.058 -0.060 -0.057 -0.064 -0.073
(0.118) (0.125) (0.123) (0.116) (0.116) (0.116) (0.093) (0.096) (0.099)
Received personal information about water 0.081 0.047 -0.082 -0.117** -0.017 0.017
(0.065) (0.059) (0.064) (0.059) (0.056) (0.053)
Purposeful search -0.119 -0.214*** 0.090
(0.088) (0.070) (0.121)
Sales point/Location FE Yes Yes Yes Yes Yes Yes Yes Yes Yes Yes Yes Yes
Observations 274 274 274 274 278 278 278 278 161 161 161 161
Chi2 37.90 43 46.05 52.34 135.39 139.46 142.21 151.31 72.95 75.65 76.66 79.56
p-value 0.036 0.035 0.031 0.013 0.000 0.000 0.000 0.000 0.001 0.002 0.003 0.003
Pseudo R2 0.064 0.072 0.077 0.088 0.226 0.233 0.238 0.253 0.258 0.267 0.271 0.281
Note: Results from a multinomial logit regression. Standard errors are in parentheses. ***/**/* indicates statistical significance at the 1/5/10% level, respectively; ° p-value=12%,°° p-value=11%

98
Discussion The regression results presented several insights regarding consumer heterogeneity and some differences from the initial hypotheses. The first hypothesis regarded the role of education in the timing of purchase. It was hypothesized that those with a higher level of education would be more likely to be earlier consumers. Those with a higher level of education will have higher knowledge of the health impacts of unsafe drinking water. Because of the already high levels of education of Jibu consumers there was no education effect for Jibu consumers in Rwanda and Uganda. However, the consumer logit model did show that higher educated individuals were more likely to purchase Jibu water. Considering that in Rwanda and Uganda in particular most individuals were already using either treated or bottled water, this result suggests that Jibu water might be considered higher quality by ‘higher’ status individuals. In Kenya, there was an education effect for middle and later consumers. University education decreased the chance of being a late consumer, suggesting that earlier consumers could be considered ‘higher’ status individuals (in terms of education and knowledge about clean drinking water). University education also increased the chances of being a middle consumer compared to earlier or later. Ramani et al. (2012) also found the importance of education purchase of innovations related to health. Previous studies on bottled water consumption also showed higher education levels increasing the likelihood of purchasing bottled water (Francisco, 2014; Quansah et al., 2015; Vásquez, 2017). Therefore, the education hypothesis was partially corroborated through the Kenya results. The second hypothesis looked at the role of local information in the timing of consumption. Local information comprised of two components: recommendation from friends and family and being approached by a company representative. Overall local information had minimal effect on the timing of purchase. While prior literature suggests that particularly at the BoP word of mouth information about a product can influence purchase decision (Kotler et al., 2006; Nakata & Weidner, 2012), our results show minimal effects from local information. This could be possible because of two reasons. Firstly, for consumer to receive information through word of mouth enough consumers need to be aware of the product, which will not be the case if it is a new product. So, word of mouth may not lead to early purchase but rather to late purchase when sufficient number of consumers know about it and can spread the word. Secondly, the minimal and mixed effects may be due to the features of the markets under study. The last category of consumers for Kenya were those who first purchased when DWL water was increased sharply and was the one of the highest priced in the market. Therefore, it is expected that these consumers would be purchasing for different reasons than earlier consumers. For Jibu consumers, most of them were already using treated or bottled water indicating that they were already aware of the health benefits of clean drinking water. The last hypothesis looked at the role of external information search. It was expected that consumers who engaged in a purposeful search for a clean drinking water alternative would be earlier consumers. We were able to partially corroborate this hypothesis. In both Uganda and Rwanda, early consumers were more likely to have engaged in a purposeful search. For the consumers who purchased later the results were mixed. Because Jibu is new to the market in both Uganda and Rwanda and therefore consumers in these markets are already familiar with bottled water, it fits that earlier consumers are those who are curious about drinking water alternatives and are seeking out another water source. In Rwanda, we also saw that late consumers were less likely to be purposefully searching for water. While wealth was not included in our conceptual model and merely used as a control variable, the results also suggested that both companies are not reaching their target demographic. The results fit with literature criticizing western firms who seek to achieve social missions like
99
reaching low income consumers and suggest that firms like DWL/Jibu are often reaching consumers at the higher end of the BoP or middle class (Karnani 2007; Meagher 2018). Finally, the results emphasized the supply driven side of consumption as backed up by prior literature (Chikweche & Fletcher, 2011b; Sheth, 2011; Viswanathan et al., 2014). The strongest determinant of purchase was from the location effects, indicating that consumers may purchase based primarily on availability.
Conclusions To provide clean water is one of the sustainable development goals (SDGs) set out by the United Nations in 2015. Particularly in the African context where infrastructure is still lacking, clean drinking water is often an unfulfilled need that is now creating markets for bottled water companies like DWL and Jibu (Brei and Böhm 2011; Patsiaouras et al. 2015). A first step in reaching this goal is to understand the characteristics of consumers living at BoP and the local context they inhabit. Consumers are usually studied as a homogenous source of demand (Kotler et al. 2006; Prahalad 2005; Sheth 2011). In this paper, we shed light on the heterogeneity amongst BoP consumers and highlight features of their local context by comparing three countries and two firms, with the help of a multivariate analysis. The study contributes to the larger picture of marketing at the BoP by empirically assessing whether the characteristics of early consumers are systematically different from consumers who purchase at a later time. First, the role of formal education on timing of consumption was explored. We have identified that a higher level of education made it less likely to be a late consumer. Higher education levels also likely play a role in purchase of a product like clean drinking water, where education would imply a higher level of knowledge about the health impacts of poor drinking water quality (Ramanai et al. 2012). By looking at consumers versus non consumers we also saw that higher educated were more likely to consume bottled water which fit with previous bottled water studies. Furthermore, we identified that the information search process plays a role in the decision to purchase. In contrast, wealth related factors had little to no influence on time of purchase. The consumers under study tended to be wealthier than the average poor person in the countries under study. BoP innovation literature often focuses on low price points as a means to reach low income consumers, yet the results from the DWL and Jibu study suggest that the price might not be low enough for poor consumers to purchase. Prior marketing literature also emphasized that poverty is an inhibitor in participation in a market society (Bonsu & Polsa, 2011; Yurdakul et al., 2017) which is also suggested by DWL and Jibu’s inability to reach poor consumers. More importantly the sales area effects are strongest in our model, which implies that purchase of bottled water is driven more by supply of bottled water rather than demand. This result also fits with marketing and consumer literature that highlighted how BoP consumers tend to make instantaneous purchase decisions based more on availability of a product than on demand (Chikweche & Fletcher, 2011; Sheth, 2011; Viswanathan et al., 2014). The BoP literature can be divided in two camps. One camp focuses on market development and emphasizes the need to reach the poor consumers (Prahalad 2005; Ramani and Mukherjee 2014; Sheth 2011). The emphasis on poor consumers is in line with our finding that consumption is driven by supply. The other camp criticizes businesses seeking to reach this demographic since they fear the poorest might not be reached or if targeted successfully might be exploited (Karnani 2007, 2009; Meagher 2018). The results of our study highlight a third overlooked aspect in the BoP literature. Companies like DWL and Jibu are reaching more the middle-income category of consumers. For Jibu reaching middle income consumers is part of their business strategy, however for DWL reaching middle income consumers is not an explicit

100
strategy. Moreover, as exhibited by the differences between consumer categories, consumers at the BoP are not as homogenous as assumed in some of the earlier BoP literature (Guarín and Knorringa 2014). DWL and Jibu are providing a much-needed good to an underserved market. Particularly in the case of Jibu, their recognition of the struggle to reach the ‘BoP’ or very poor led them to instead focus on the ‘missing middle’ in urban areas. Future research should continue the quantitative angle on BoP consumers and further explore the rising ‘new middle class’ and the role for western companies in reaching this new demographic. Additionally, to gain a grounded understanding of the heterogeneity amongst the ‘new middle class’ it is critical to understand the behavioral aspects that might trigger consumption and thereby foster the diffusion of clean water at the BoP. An in depth understanding of consumers’ heterogeneous needs is vital for companies marketing to not only the ‘new middle class’ but also the original target – poor consumers at the BoP.

101
References Adkins NR and Ozanne JL (2005) Critical Consumer Education: Empowering the Low-Literate
Consumer. Journal of Macromarketing 25(2): 153–162. DOI: 10.1177/0276146705280626.
AfDB A (2016) African Development Report 2015-Growth, Poverty and Inequality Nexus: Overcoming Barriers to Sustainable Development. African Development Bank.
Agnihotri A (2012) Revisiting the Debate over the Bottom of the Pyramid Market. Journal of Macromarketing 32(4): 417–423. DOI: 10.1177/0276146712451596.
Alur S and Schoormans JPL (2013) Retailers and new product acceptance in India’s base of pyramid (BoP) markets: Propositions for research. International Journal of Retail & Distribution Management 41(3): 189–200. DOI: 10.1108/09590551311306246.
Banbury C, Herkenhoff L and Subrahmanyan S (2015) Understanding Different Types of Subsistence Economies: The Case of the Batwa of Buhoma, Uganda. Journal of Macromarketing 35(2): 243–256. DOI: 10.1177/0276146714528954.
Bonsu SK and Polsa P (2011) Governmentality at the Base-of-the-Pyramid. Journal of Macromarketing 31(3): 236–244. DOI: 10.1177/0276146711407506.
Brei V and Böhm S (2011) Corporate social responsibility as cultural meaning management: a critique of the marketing of ‘ethical’ bottled water. Business Ethics: A European Review 20(3): 233–252. DOI: 10.1111/j.1467-8608.2011.01626.x.
Byrnes JP, Miller DC and Schafer WD (1999) Gender differences in risk taking: a meta-analysis. Psychological bulletin 125(3): 367.
Cameron AC and Trivedi PK (2009) Microeconometrics Using Stata. College Station, Tex: Stata Press.
Chikweche T and Fletcher R (2011a) Branding at the base of pyramid: a Zimbabwean perspective. Omar M (ed.) Marketing Intelligence & Planning 29(3): 247–263. DOI: 10.1108/02634501111129239.
Chikweche T and Fletcher R (2011b) Franchising at the Bottom of the Pyramid (BOP): an alternative distribution approach. The International Review of Retail, Distribution and Consumer Research 21(4): 343–360. DOI: 10.1080/09593969.2011.588717.
Chikweche T and Fletcher R (2012) Revisiting the marketing mix at the bottom of pyramid (BOP): from theoretical considerations to practical realities. Journal of Consumer Marketing 29(7): 507–520. DOI: 10.1108/07363761211275018.
Chikweche T and Fletcher R (2014) Marketing to the “middle of the pyramid” in emerging markets using a social network perspective: Evidence from Africa. Keith Perks and Dr Phani Tej Adidam D (ed.) International Journal of Emerging Markets 9(3): 400–423. DOI: 10.1108/IJoEM-05-2013-0090.
Chikweche T, Stanton J and Fletcher R (2012) Family purchase decision making at the bottom of the pyramid. Journal of Consumer Marketing 29(3): 202–213. DOI: 10.1108/07363761211221738.
Cohen A, Zhang Q, Luo Q, et al. (2017) Predictors of Drinking Water Boiling and Bottled Water Consumption in Rural China: A Hierarchical Modeling Approach. Environmental Science & Technology 51(12): 6945–6956. DOI: 10.1021/acs.est.7b01006.
102
Cook J, Kimuyu P and Whittington D (2016) The costs of coping with poor water supply in rural Kenya: COPING COSTS OF POOR WATER. Water Resources Research 52(2): 841–859. DOI: 10.1002/2015WR017468.
Dahlberg (2017) The Untapped Potential of Decentralized Solutions to Provide Safe, Sustainable Drinking Water at Large Scale. January. Available at: www.safewaterentreprises.com.
Davies IA and Torrents A (2017) Overcoming Institutional Voids in Subsistence Marketplaces: A Zimbabwean Entrepreneurial Case. Journal of Macromarketing 37(3): 255–267. DOI: 10.1177/0276146717698020.
de Queiroz JTM, Doria M de F, Rosenberg MW, et al. (2013) Perceptions of bottled water consumers in three Brazilian municipalities. Journal of Water and Health 11(3): 520–531. DOI: 10.2166/wh.2013.222.
Ernst H, Kahle HN, Dubiel A, et al. (2015) The Antecedents and Consequences of Affordable Value Innovations for Emerging Markets: Affordable Value Innovations for Emerging Markets. Journal of Product Innovation Management 32(1): 65–79. DOI: 10.1111/jpim.12171.
Francisco JPS (2014) Why households buy bottled water: a survey of household perceptions in the Philippines: Why households buy bottled water. International Journal of Consumer Studies 38(1): 98–103. DOI: 10.1111/ijcs.12069.
Geroski PA (2000) Models of technology diffusion. Research Policy 29(4–5): 603–625. DOI: 10.1016/S0048-7333(99)00092-X.
Grady CA, Kipkorir EC, Nguyen K, et al. (2015) Microbial quality of improved drinking water sources: evidence from western Kenya and southern Vietnam. Journal of Water and Health 13(2): 607. DOI: 10.2166/wh.2014.206.
Guarín A and Knorringa P (2014) New Middle-Class Consumers in Rising Powers: Responsible Consumption and Private Standards. Oxford Development Studies 42(2): 151–171. DOI: 10.1080/13600818.2013.864757.
Hahn R (2009) The Ethical Rational of Business for the Poor – Integrating the Concepts Bottom of the Pyramid, Sustainable Development, and Corporate Citizenship. Journal of Business Ethics 84(3): 313–324. DOI: 10.1007/s10551-008-9711-6.
Hall J, Matos S, Sheehan L, et al. (2012) Entrepreneurship and Innovation at the Base of the Pyramid: A Recipe for Inclusive Growth or Social Exclusion?: Entrepreneurship and Innovation at the BOP. Journal of Management Studies 49(4): 785–812. DOI: 10.1111/j.1467-6486.2012.01044.x.
Hall J, Matos SV and Martin MJC (2014) Innovation pathways at the Base of the Pyramid: Establishing technological legitimacy through social attributes. Technovation 34(5–6): 284–294. DOI: 10.1016/j.technovation.2013.12.003.
Henrich J (2001) Cultural Transmission and the Diffusion of Innovations: Adoption Dynamics Indicate That Biased Cultural Transmission Is the Predominate Force in Behavioral Change. American Anthropologist 103(4): 992–1013. DOI: 10.1525/aa.2001.103.4.992.
Jagadale SR, Kadirov D and Chakraborty D (2018) Tackling the Subaltern Quandary: Marketing Systems of Dignity. Journal of Macromarketing 38(1): 91–111. DOI: 10.1177/0276146717740680.

103
Jaiswal AK and Gupta S (2015) The influence of marketing on consumption behavior at the bottom of the pyramid. Journal of Consumer Marketing 32(2): 113–124. DOI: 10.1108/JCM-05-2014-0996.
Karnani A (2007a) The Mirage of Marketing to the Bottom of the Pyramid: How the Private Sector Can Help Alleviate Poverty. California Management Review 49(4): 90–111. DOI: 10.2307/41166407.
Karnani A (2007b) The Mirage of Marketing to the Bottom of the Pyramid: How the Private Sector Can Help Alleviate Poverty. California Management Review 49(4): 90–111. DOI: 10.2307/41166407.
Karnani A (2009) Romanticising the poor harms the poor. Journal of International Development 21(1): 76–86. DOI: 10.1002/jid.1491.
Kenya National Bureau of Statistics, Ministry of Health/Kenya, National AIDS Control Council/Kenya, et al. (2015) Kenya Demographic and Health Survey 2014. Rockville, MD, USA. Available at: http://dhsprogram.com/pubs/pdf/FR308/FR308.pdf.
Kotler P, Roberto N and Leisner T (2006) Alleviating Poverty: A Macro/Micro Marketing Perspective. Journal of Macromarketing 26(2): 233–239. DOI: 10.1177/0276146706291039.
Lancaster KJ (1966) A New Approach to Consumer Theory. Journal of Political Economy 74(2): 132–157. DOI: 10.1086/259131.
Lüthje C, Herstatt C and Von Hippel E (2005) User-innovators and “local” information: The case of mountain biking. Research policy 34(6): 951–965.
Mair J and Marti I (2009) Entrepreneurship in and around institutional voids: A case study from Bangladesh. Journal of Business Venturing 24(5): 419–435. DOI: 10.1016/j.jbusvent.2008.04.006.
Marinakis YD, Walsh Prof dr ST and Harms dr. R (2016) Catalyzing new product adoption at the base of the pyramid. In: 25th International Association for Management of Technology Conference, IAMOT 2016, 2016, pp. 775–794. Available at: http://doc.utwente.nl/101405/.
Meagher K (2018) Cannibalizing the Informal Economy: Frugal Innovation and Economic Inclusion in Africa. The European Journal of Development Research 30(1): 17–33. DOI: 10.1057/s41287-017-0113-4.
Ministry of Water and Irrigation (2017) Water Boards. Available at: http://www.water.go.ke/?page_id=57.
Montgomery N, Peredo A and Carlson E (2012) The BOP Discourse as Capitalist Hegemony. Academy of Management Proceedings 2012(1): 14505. DOI: 10.5465/AMBPP.2012.274.
Nakata C and Weidner K (2012) Enhancing New Product Adoption at the Base of the Pyramid: A Contextualized Model: New Product Adoption at the BOP. Journal of Product Innovation Management 29(1): 21–32. DOI: 10.1111/j.1540-5885.2011.00876.x.
Patsiaouras G, Saren M and Fitchett JA (2015) The Marketplace of Life? An Exploratory Study of the Commercialization of Water Resources through the Lens of Macromarketing. Journal of Macromarketing 35(1): 23–35. DOI: 10.1177/0276146714538454.
104
Piacentini M and Hamilton K (2013) Consumption lives at the bottom of the pyramid. Marketing Theory 13(3): 397–400. DOI: 10.1177/1470593113489195.
Prahalad CK (2005) The Fortune at the Bottom of the Pyramid. Upper Saddle River, NJ: Wharton School Publishing.
Prahalad CK (2012) Bottom of the Pyramid as a Source of Breakthrough Innovations: BOP as Source of Innovations. Journal of Product Innovation Management 29(1): 6–12. DOI: 10.1111/j.1540-5885.2011.00874.x.
Prahalad CK and Hammond A (2002) Serving the world’s poor, profitably. Harvard business review 80(9): 48–59.
Quansah F, Okoe A and Angenu B (2015) Factors Affecting Ghanaian Consumers’ Purchasing Decision of Bottled Water. International Journal of Marketing Studies 7(5). DOI: 10.5539/ijms.v7n5p76.
Rahman M, Hasan MR and Floyd D (2013) Brand Orientation as a Strategy That Influences the Adoption of Innovation in the Bottom of the Pyramid Market. Strategic Change 22(3–4): 225–239. DOI: 10.1002/jsc.1935.
Ramani SV and Mukherjee V (2014) Can breakthrough innovations serve the poor (bop) and create reputational (CSR) value? Indian case studies. Technovation 34(5–6): 295–305. DOI: 10.1016/j.technovation.2013.07.001.
Ramani SV, SadreGhazi S and Duysters G (2012) On the diffusion of toilets as bottom of the pyramid innovation: Lessons from sanitation entrepreneurs. Technological Forecasting and Social Change 79(4): 676–687. DOI: 10.1016/j.techfore.2011.06.007.
Ritter M, Velcine C, Camille E, et al. (2017) Optimizing Household Chlorination Marketing Strategies: A Randomized Controlled Trial on the Effect of Price and Promotion on Adoption in Haiti. The American Journal of Tropical Medicine and Hygiene 97(1): 271–280. DOI: 10.4269/ajtmh.16-0820.
Sen A (2001) Development as Freedom. Oxford ; New York: Oxford University Press. Available at: http://www.loc.gov/catdir/toc/fy02/2001274375.html.
Sheth JN (2011) Impact of Emerging Markets on Marketing: Rethinking Existing Perspectives and Practices. Journal of Marketing 75(4): 166–182. DOI: 10.1509/jmkg.75.4.166.
Silvestre BS and Neto R e S (2014) Capability accumulation, innovation, and technology diffusion: Lessons from a Base of the Pyramid cluster. Technovation 34(5–6): 270–283. DOI: 10.1016/j.technovation.2013.09.007.
Smith SM and Beatty SE (1987) External Search Effort: An Investigation Across Several Product Categories. Journal of Consumer Research 14(1): 83–95. DOI: 10.1086/209095.
Subrahmanyan S and Tomas Gomez‐Arias J (2008) Integrated approach to understanding consumer behavior at bottom of pyramid. Pitta D (ed.) Journal of Consumer Marketing 25(7): 402–412. DOI: 10.1108/07363760810915617.
UNDP (2008) Creating value for all: Strategies for doing business with the poor. Vásquez WF (2017) Understanding bottled water consumption in a high-poverty context:
empirical evidence from a small town in Guatemala: Understanding bottled water consumption. International Journal of Consumer Studies 41(2): 199–206. DOI: 10.1111/ijcs.12327.
105
Viswanathan M and Rosa JA (2010) Understanding subsistence marketplaces: Toward sustainable consumption and commerce for a better world. Journal of Business Research 63(6): 535–537. DOI: 10.1016/j.jbusres.2009.06.001.
Viswanathan M, Jung K, Venugopal S, et al. (2014) Subsistence and Sustainability: From Micro-Level Behavioral Insights to Macro-Level Implications on Consumption, Conservation, and the Environment. Journal of Macromarketing 34(1): 8–27. DOI: 10.1177/0276146713499351.
Water Services Regulatory Board (2014) Water Tariffs. Available at: http://wasreb.go.ke/tariffs/index.php?wsp=5.
WHO/UNICEF Joint Water Supply and Sanitation Monitoring Programme, World Health Organization and UNICEF (2015) Progress on Sanitation and Drinking Water.
Wooldridge JM (2016) Introductory Econometrics: A Modern Approach. Sixth edition. Boston, MA: Cengage Learning.
Yurdakul D, Atik D and Dholakia N (2017) Redefining the bottom of the pyramid from a marketing perspective. Marketing Theory 17(3): 289–303. DOI: 10.1177/1470593117704265.
Zanello G, Fu X, Mohnen P, et al. (2016) The Creation and Diffusion of Innovation in Developing Countries: A Systematic Literature Review. Journal of Economic Surveys 30(5): 884–912. DOI: 10.1111/joes.12126.

106
Experiential Marketing of Clean Drinking Water: Experimental Evidence for Kenya and Rwanda32
32 This chapter is co-authored with KM Sinha and N. Wagner. Versions of this chapter were reviewed and presented at the Symposium on Economic Experiments in Developing Countries (SEEDEC) at UC Berkeley 2019 and the conference on Model Based Evidence on Innovation and Development (MEIDE) in Abidjan, Ivory Coast 2019.

107
Introduction While the Sustainable Development Goals highlight the importance of access to clean drinking water, in many urban areas in sub-Saharan Africa such as Kenya and Rwanda access to improved drinking water has actually decreased due to poor planning and rapid urbanization (Dos Santos et al., 2017; Lapworth et al., 2017). Coping with the high costs of improving and increasing an aging water infrastructure implies there is a concomitantly increasing demand for decentralized water solutions like bottled drinking water particularly in Eastern Africa (Bhatnagar et al., 2017; Dos Santos et al., 2017; Marson and Savin, 2015). In Africa and the Middle East, the market for bottled water was estimated at 12 billion USD with a growth rate of almost 9% in 2018.33 This demand is not without reply. It has been addressed not only by corporate social responsibility (CSR) initiatives of multinational companies’ (MNCs) and social enterprises but also by profitable and higher cost brands like Coca Cola’s Dasani Water (Brei and Böhm 2011). The rise in demand for bottled drinking water in sub-Saharan Africa goes side by side with the rise of the new middle-class or ‘middle of the pyramid’ (MoP) on the continent (Chikweche and Fletcher, 2014; Shimeles and Ncube, 2015; Thurlow et al., 2015). While the MoP in the Asian context has been explored in the literature, research looking at consumption decisions of the MoP particularly in Africa is newer yet slowly expanding (Banerjee and Duflo, 2008; Chikweche and Fletcher, 2014). The lack of studies about the MoP contrasts with the wealth of studies about poor consumers or the ‘bottom of the pyramid’ (BoP) consumers (Chikweche and Fletcher, 2014; Diallo and Siqueira Jr, 2017; Ihtiyar et al., 2019). Yet, these tend not to have the means to take up new products even if they are healthy. In turn, Banerjee and Duflo (2008) have shown that MoP consumers tend to spend more on health which has direct implications for the consumption of clean drinking water alternatives since water borne diseases are a commonly known and experienced threat in Africa. Our analysis focuses on sub-Saharan Africa as a region, and zooms in on two country case studies, namely Kenya and Rwanda. By simultaneously studying two country cases, we provide insights into contextual differences in consumption decisions of the MoP. Additionally, and important from a marketing perspective, we study the role of experiential marketing for MoP consumers because there is limited work within marketing and specifically experiential marketing looking at consumption decisions of the MoP and in particular the role of experience (Griffith and Jain, 2011; Zarantonello et al., 2013). Thus, we contribute to the growing body of research on marketing strategies in emerging markets, which have been identified as not necessarily being identical to those in developed countries (Cavusgil et al., 2018; Diallo and Siqueira Jr, 2017; Griffith and Jain, 2011; Ihtiyar et al., 2019; Malhotra et al., 2005; Nakata and Sivakumar, 1997; Sheth, 2011; Zarantonello et al., 2013). The chosen countries of study are interesting for a MoP experiential marketing study on clean drinking water for several reasons. Both Kenya and Rwanda have similar levels of access to
33 Middle East and Africa Bottled Water Market. Available online: https://www.marketdataforecast.com/market-reports/mea-bottled-water-market. Last accessed on 29 August 2020.

108
improved water sources (75% and 78% respectively), rapid GDP growth (above 5.5 and 7% on average in the last five years), and high levels of primary school achievement (100% and 87%) (Kenya National Bureau of Statistics et al., 2015; National Institute of Statistics of Rwanda et al., 2016; World Bank, 2019). Kenya was recently classified as a middle income country, making it a prominent candidate for studies on MoP consumers but also for drinking water studies (Luoto et al., 2014; Onjala et al., 2014). Rwanda also has a growing middle-class. Yet, to the best of our knowledge there are no studies on uptake of drinking water alternatives in Rwanda. Finally, within the MoP consumer literature there is limited focus on Africa as a region. Therefore, a study on Kenya and Rwanda provides an interesting cross-country comparison of how urban MoP consumers are influenced through experiential marketing tools like free samples. We aim to contribute to the limited literature on experiential marketing in sub-Saharan Africa by addressing two research questions about MoP consumers: 1) What is the relationship between wealth and purchase (intention) of clean drinking water? and 2) What is the effect of the provision of a pre-purchase, free drinking water sample on purchase intention and product purchase? To answer these questions, we conducted a randomized controlled trail (RCT) in which we use the advertising approach of provision of product related information as baseline scenario, i.e. we inform where and how to purchase reusable bottled drinking water. To assess whether experiential marketing has a role and added value of its own we randomly provide a free sample of water to non-consumers living in the sales areas of two bottled water companies in Kenya and Rwanda. The results showed that across both countries, our sample of non-consumers captures the MoP. Furthermore, information about the water companies motivated purchase intentions (80% for Kenya, 67% for Rwanda) and purchase (49% for Kenya, 67% for Rwanda) but purchase intention and purchase were even higher among those who were exposed to the experiential marketing component; purchase intention increased by 10.0 (11.3) percentage points for Kenya (Rwanda) and product purchase by 19.7 (12.5) percentage points for Kenya (Rwanda). The remainder of the paper is structured as follows: In section 2 a brief overview of the existing literature on marketing at the MoP, experiential marketing and uptake of clean drinking water is presented. Conceptual considerations and hypotheses are introduced in section 3. Section 4 presents the study set up and section 5 the data. The employed empirical strategy is introduced in section 6. The results are presented in section 7 and section 8 concludes.
Literature Review The study at hand combines three different strands of the literature: (i) the emerging literature on MoP consumers, (ii) the limited experiential marketing literature in an emerging market setting and (iii) the literature identifying the determinants of uptake of clean drinking water solutions.
Middle of the Pyramid Consumers & Marketing While Prahalad (2005) developed the concept of consumers at the bottom of pyramid being a large group that could potentially be reached profitably, more recent work has criticized this take and shown that reaching the very poorest is often not feasible (Hahn, 2009; Karnani, 2007, 2009; Kolk et al., 2014; Meagher, 2018). Howell et al. (2020) demonstrate that consumers reached by businesses in emerging markets would be more aptly classified as middle-class. In the marketing literature we find a large body of work that has looked at what drives

109
consumption decisions of BoP consumers (Alur and Schoormans, 2013; Rahman et al., 2013; Agnihotri, 2012; Chikweche and Fletcher, 2012; Chikweche et al., 2012; Nakata and Weidner, 2012; Sheth, 2011). Yet, less explored are the ‘middle of the pyramid’ (MoP) consumers in emerging markets (Cavusgil et al., 2018; Chikweche and Fletcher, 2014).34 The discussion of middle-class consumers in emerging markets was first sparked by the growing middle-class in China and India. Much literature on the new middle-class focuses on defining this group and whether there should be different income limits depending on the region (Banerjee and Duflo, 2008; Birdsall, 2015; Kharas, 2010; Melber and Nordiska Afrikainstitutet, 2016; Shimeles and Ncube, 2015; Thurlow et al., 2015; Wietzke and Sumner, 2018). More recently, there has been a shift to examining the fast growing middle-class in sub-Sahara Africa (Cheeseman, 2015; Chikweche and Fletcher, 2014; Kodila-Tedika et al., 2016; Melber and Nordiska Afrikainstitutet, 2016; Shimeles and Ncube, 2015). Studies about marketing towards MoP consumers and assessments of their purchase decisions are few and far between. Yet, more and more research exposes that many companies seeking to reach the BoP are actually reaching MoP consumers (Howell et al., 2020; Karnani, 2009). Chikweche and Fletcher (2014) qualitatively investigated the purchasing decisions of the MoP in several sub-Saharan African countries focusing on the heterogeneity of middle-class consumers and identifying the key purchase influencers for this group. The new middle-class consumers in sub-Saharan Africa are more likely to have formal employment, higher levels of education and home ownership; they have access to healthcare, are smartphone owners, and either own or desire luxury cars. Importantly, they place an importance on aesthetics which is in part determined by peers and social networks. While this research identifies MoP characteristics and the role of peers and social networks for consumption decisions, it does not answer the question whether experiential marketing can contribute to consumer uptake in emerging markets that goes beyond marketing efforts that built mainly around advertising and information dissemination.
Experiential Marketing: Definition and implementation in an emerging market setting
Much of the marketing literature focuses on the exchange of value between a consumer and a firm, and tends to have a utilitarian view with the consumer rationalizing the price as appreciation of the value of a product. In turn, experiential marketing –a concept developed by Schmitt (1999)– touches more on the emotional aspect of consumer decision making and how a brand can create an experience. Experiential marketing overlaps with concepts like consumer experience, experience marketing and consumption experience (Schmitt et al., 2015; Smilansky, 2009; Yuan and Wu, 2008). Schmitt (1999) posits that value can be created through the experience of a product. In experiential marketing consumers are both rational and emotional and consumption of a product is considered a holistic experience (Schmitt, 1999 and 2010; Schmitt et al., 2015; Smilansky, 2009). According to experiential marketing consumer decision making can be influenced by creating experiences that engage a consumer’s senses
34 The term emerging markets is used to represent countries with lower-than-average per capita income but a newly emerging middle-class. These countries move away from their traditional economies that have relied on agriculture and the export of raw materials. This is what we observe in both countries under study, Kenya and Rwanda.
110
and emotions (Kranzbühler et al., 2018). Experience can be viewed as a test or a trail that allows the consumer to engage with a brand in a sensory way, i.e. evoking feel, taste, and/or emotions (Brakus et al., 2009; Carù and Cova, 2003; Schmitt, 2010). One possible way of sensory engagement is the distribution of free samples that evokes a brand experience. Despite a growing middle-class there is limited work within experiential marketing looking at emerging market consumers and the role of branding and experience on consumption decisions (Diallo and Siqueira Jr, 2017; Griffith and Jain, 2011; Ihtiyar et al., 2019; Zarantonello et al., 2013). Diallo and Siqueira Jr (2017) looked at the role of previous brand experience on Latin American consumers’ purchase intentions at two popular retail chains in both countries (Carrefour and Extra-Brazil, Exito and Jumbo-Colombia), showing that brand experience plays a different role in the two countries (Brazil and Columbia). Focusing on free samples as a form of experience, Bawa and Shoemaker (2004) studied the effect of free samples on product purchase, emphasizing how an experience with a product influences the decision to purchase a certain brand. Similarly, evidence from the 1980s highlights already that product trial is a better predictor for purchase compared to advertising (Smith and Swinyard, 1983). The empirical assessment of the value added of experiential marketing is not straightforward, in particular in an emerging country setting: Field experiments are one tool to look at the effect of different marketing mechanisms on consumption decisions such price variations or free samples (Simester, 2017) While field experiments are prominent in development economics, their use in marketing studies are more limited and typically do not employ RCTs in a real world setting (Bawa and Shoemaker, 2004; Simester, 2017). Particularly in sub-Saharan Africa quantitative studies from a more business or marketing perspective that allow for causal conclusions are limited (Sheth, 2011; Simester, 2017). This study sets out positing that an RCT study in sub-Saharan Africa provides an opportunity to stage a simulation where the potential consumer can personally experience the product in their own local context thus providing an opportunity to the consumer to better understand their own needs and wishes.
Uptake of Clean Drinking Water Looking at supply of safe drinking water in emerging markets, there is a large body of work examining consumption of clean drinking water alternatives in various emerging market contexts. Existing studies analyze the willingness to pay for safe drinking water (Burt et al., 2017; Kremer et al., 2011; Luoto et al., 2011; Null et al., 2012; Whittington et al., 1990), perceptions of drinking water quality (Espinosa-García et al., 2015), and choice of water or treatment options (Cohen et al., 2017; de Queiroz et al., 2013; Francisco, 2014; Tsaneva, 2013; Vásquez, 2017; Vásquez et al., 2009) in various contexts. Table 16 provides an overview of the existing literature on uptake of clean drinking water, the main results, study location and methods employed. Summarizing the literature on choice of drinking water alternatives a few patterns emerge. Higher education seems to play a role in risk adverting behavior and choosing clean drinking water sources. Research also looked at the role of wealth, gender, household size and children under 5 with mixed results. Focusing on studies that employed a behavioral intervention, Luoto et al. (2014) implemented an RCT in two countries (Kenya and Bangladesh) to look at uptake of point-of-use water treatment technologies (chlorine products and filters). They distributed these water treatment technologies for free along with different educational messages to assess the role of information and experience on uptake, showing that commitment to use messages

111
combined with reminders were most effective. Finally, research on willingness to pay is mostly focused on clean water technologies or public supply and only limited research looks at the role of marketing –product (attributes), distribution, and promotion– in take up. Considering the methods employed in the studies on drinking water choice, there is limited work employing field experiments with a randomized controlled design.

112
Table 16: Overview of the existing literature on uptake of clean drinking water
Focus Main Results Location Method Authors
Willingness to pay for safe drinking water
Education is a strong predictor for willingness to pay for clean drinking water alternatives more so than wealth.
Emerging markets generally, Kenya, Haiti, Tanzania
Systematic literature review, quantitative analysis
Burt et al., 2017; Kremer et al., 2011; Luoto et al., 2011; Null et al., 2012; Whittington et al., 1990
Risk perception & water choice Higher educated individuals and women more likely to treat water (more risk adverse)
Kenya Quantitative analysis
Onjala et al., 2014; Tsaneva, 2013
Drinking water choice Female headed households more likely to boil; younger, male headed households more likely to purchase bottled water
China Hierarchical modeling
Cohen et al., 2017
Bottled water consumption Determinants: Higher education, children under 5, female headed households, smaller households, mixed income effects,
Guatemala, Ghana, Brazil, Philippines
Consumer studies- mix of quantitative and qualitative analysis
de Queiroz et al., 2013; Francisco, 2014; Howell et al., 2020; Quansah et al., 2015; Vásquez, 2017
Non-health impacts of clean drinking water
Door to door information and targeting increased connection to public tap
Morocco RCT Devoto et al., 2012
Adoption of clean water purification technologies
Opinion leaders influence middle category of adopters
Bolivia Rogers adoption of innovations framework
Moser and Mosler, 2008
Uptake of point of use water treatment technologies
Commitment to use messages plus reminders most effective in uptake
Kenya, Bangladesh RCT Luoto et al., 2014
113
From the literature on uptake of clean drinking water solutions we derive two observations: First, understanding what drives people to purchase and consume various drinking water choices is relevant particularly in an emerging market setting where water supply and quality tend to be poor. Second, there is limited work in the sub-Sahara African context specifically employing a cross-country comparison within the same region (in our case East Africa).
Conceptual Considerations Experiential marketing is a process through which companies create an environment for the potential consumer that leverages emotions, feelings and senses (Cantone and Risitano, 2011). With the help of tools deployed in experiential marketing, a company is able to recognize both needs and wants of the consumer and satisfy them profitably (Smilansky, 2009). In addition, the MoP literature highlights that consumers do not just aim to fulfill their immediate needs but also aspirational wishes and wants (Chikweche and Fletcher, 2014). With an increase in per capita income and wealth, MoP consumers aspire and demand better health care alongside better education and housing (Solimano, 2008). Increase in wealth as a consequence of more savings or higher levels of assets is a necessary condition for the newly emerging MoP to be able to satisfy their consumption desires (Schlogl and Sumner, 2014). Experiential marketing tools create a desire based on an experience; however, the consumer cannot act on the feelings or judgement derived from this experience in the absence of a suitable financial position. The possibility to create value by experiencing the product combined with the presence of suitable financial means, i.e. higher wealth, allows for reframing the loss versus gain framework since consumers in emerging markets usually place more value on the current financial costs compared to possible future gains (Rathi and Chunekar, 2015). Consequently, wealth is a crucial enabler for MoP consumers to be able to benefit from experiential marketing. In fact, MoP consumers might face a trade-off between purchase intention and realizing purchases. Therefore, the following hypotheses were deducted: H1a: Wealth is positively related to purchase intention.
H1b: Wealth is positively related to purchase.
Consumption of drinking water is a routine task and consumers all over the world engage in it on a daily basis. Compared to a developed market, consumers from an emerging market have to make regular decisions about drinking water: where to get it, to buy it or not, to boil or treat it or not. In most cases, these decisions have to be performed in the presence of lack of information about the actual quality of the different water sources and only limited awareness of the health consequences of poor quality water (Dupas, 2011). By receiving additional information both about the company and the product and in the form of experience of a water source, a consumer gains the opportunity to reflect on the regular decision process and make more informed health choices. Experience has become one of the key components in consumer decision making processes (Shaw and Ivens, 2002). It is not just important to create this experience for the consumer through the different points of interaction but that the consumer is able to co-create their own unique experience with a company (Prahalad and Ramaswamy, 2004). Different contact points are moments where the brand (of a company) interacts with a consumer and leaves an impression (Davis and Longoria, 2003). Provision of a free sample is a pre-purchase contact point that helps the consumer in creating usage experience at a personal level and in their own local context (Davis and Longoria, 2003; Gentile et al., 2007). A free

114
sample like bottled water provides the consumer with the basic raw material (water) that she can consume at her own convenience to derive her experiences. These experiences are multidimensional and constitute complex bundles (Schmitt, 1999). Gentile et al. (2007) divide these experiences into six categories: (i) sensorial, (ii) emotional, (iii) cognitive, (iv) pragmatic, (v) lifestyle, and (vi) relational component. As middle-class is a way of life, where people share and feel common experiences which shape their identity (Wheary, 2005), the lifestyle component plays a crucial role in shaping the consumer experience. This is evident in the value attached to purchasing for example the latest smartphone or branded cars (Chikweche and Fletcher, 2014). In countries like, Kenya and Rwanda where access to safe drinking water is a regular concern, spending on bottled water can be considered a healthy lifestyle choice (Onjala et al., 2014; Tsaneva, 2013). By purchasing bottled water, the consumer is able to affirm the identity of an individual who makes adequate lifestyle choices. Receipt of a free sample reinforces the lifestyle experience as the consumer gets a feeling of the healthy choice. In the case of bottled water, the sensorial component further adds to the bundle of components, which constructs the consumer experience. The sensorial component is activated when the consumer is exposed to, for example, a good taste, hearing, sight or visual experience. Pre-purchase, free samples of bottled water provide an opportunity to taste the water, a sensorial component and a crucial part of product performance. A chance to experience the core functionality of a product, helps in creating an improved consumer experience and might increase both purchase intention and purchase (Davis and Longoria, 2003; Gentile et al, 2007; Schmitt, 1999). Experience of a product is particularly important for MoP consumers since they tend to believe that brand is a guarantee for product performance (Chikweche and Fletcher, 2014). Therefore, the following hypotheses were deducted: H2a: Beyond the provision of information, the provision of a pre-purchase, free sample further reinforces purchase intention.
H2b: Beyond the provision of information, the provision of a pre-purchase, free sample further reinforces purchase.
Study Set-Up
Background: Water Supply in Kenya and Rwanda Like many countries in sub-Saharan Africa, Kenya and Rwanda are challenged with adequate fresh water delivery. In large part due to aging infrastructure, the quality of piped water is mediocre or unsafe for drinking (Grady et al., 2015; Peletz et al., 2016). Although some progress has been made in providing access to safe drinking water, access to an improved water source does not necessarily indicate safe drinking water (WHO et al., 2015). For the first country under study, Kenya, 2015 data show that 75% of the population (with higher levels in urban areas) have access to an improved water source (Kenya National Bureau of Statistics et al., 2015). Yet, available evidence reveals that many improved sources have e-coli bacteria and other contaminants (Grady et al., 2015; Herrera, 2019). The Mombasa region of Kenya, which is our study area, faces particularly challenging supply and quality issues; access to clean water is under pressure since water supply was privatized in 2002 through reforms that decentralized water provision (Ministry of Water and Irrigation, 2017; Water

115
Services Regulatory Board, 2014). Typically, residents of Mombasa county without private tap have water supply three times per week with water losses through the network being estimated at 55%.35 The second country under study is Rwanda with a focus on the Kigali area. Rwanda has similar levels to Kenya in terms of access to an improved drinking water source (78%). Shortage of quality water is also a challenge in Kigali. To address the insufficient supply, two new purification plants were constructed in 2017 that are supposed to provide for Kigali’s water needs. Yet, Kigali’s piping infrastructure is old and illegal tapping of water is prevalent. Moreover, Kigali has seen rapid population growth putting the water delivery system under further pressure.36 Ultimately, in both Kenya and Rwanda insufficient supply and poor water quality have created a market for bottled water. In both of the study regions there are around 20 prominent bottled water brands offering a mix of single use bottled water, large refillable dispenser bottles and in the case of the two companies under study reusable bottles available for refill or bottle return.37
The Companies Under Study: Water Supply Models of DWL and Jibu Data for this study was collected from two socially oriented bottled water companies: Dutch Water Limited (DWL) and Jibu. DWL is a 2006 founded water company based on the Kenyan coast in the city of Mtwapa with operations in three counties surrounding Mombasa (Kilifi, Kwale, and Mombasa). DWL was established through investments from the Dutch firms Hatenboer and Reikon with the primary mission of ‘healthy drinking water for all’. DWL’s lowest cost/best value product is a 10l reusable jerry can. Water is sold primarily through small vendors that also sell other products and other bottled water brands. DWL employs a centralized purification model. Costs are kept low through maximizing production and using reusable jerry cans. Vendors pay the deposit for the jerry can and set the end price for the consumer. Additional water can be purchased from DWL once used jerry cans are returned. Although DWL has a stated social mission, recently DWL prices increased sharply due to changes in Kenyan tax law. Jibu is an American founded social enterprise that provides a slightly different case study but has a similar mission and product offering. Jibu began operations in 2014 and provides low cost bottled drinking water in Uganda, Rwanda, Kenya and Tanzania through a franchise model with decentralized water purification. Due to Jibu’s social mission, the company seeks to keep their water refill prices the lowest in their areas of operation. Therefore, Jibu’s business model is to charge a relatively high bottle deposit fee and low refill price. Additionally, Jibu explicitly
35 Personal interviews with Mombasa Water Supply & Sanitation Company, Coast Water Services Board, and external consultants from Dutch Water Operators VEI (http://www.vitensevidesinternational.com/). 36 Interview with the director of water regulation from the Rwanda Utilities Regulatory Agency (RURA) on 11 May 2017. 37 Data collected during fieldwork; March-May 2017.
116
reaches out to MoP consumers rather than the BoP, acknowledging that reaching the very poor is challenging with a business approach.38 The two companies are examples of businesses with dual social and profit goals which is in contrast to traditional bottled water companies operating in both regions. Traditional bottled water companies like Coca Cola’s Dasani or other CSR initiatives have been criticized for merely exploiting the lack of public drinking water infrastructure to make profits (Brei and Böhm, 2011). Therefore, understanding what drives MoP consumers to purchase reusable bottled water from enterprises with social missions is warranted. Additionally, the two cases provide two contrasting contexts due to the different locations and market conditions. DWL offers the highest priced water on the market due to a tax change, whereas Jibu is able to keep their refill prices low. Moreover, DWL has been operating for eight more years than Jibu and can be considered an established company.
Research Design The research design was motivated by existing studies that use field experiments to explore the uptake of various development interventions (Banerjee and Duflo, 2017; Karlan and Appel, 2014). More precisely, we explore how experiential marketing can influence decision making beyond advertising. To assess the effect of experiencing bottled water on purchase intensions and decisions an RCT was employed. First, non-consumers who live in the sales areas of the two companies under study were randomly selected through street intercepts and invited to participate in the study. Those who accepted to participate where randomly divided in a treatment and control group.39 Randomization was based on the number of arrival, i.e. every odd numbered respondent received a free 10l jerry can of water (DWL) or a voucher to pick up two 5l bottles of Jibu water from the nearby franchise.40 All respondents (control and treatment) received information on where and how to purchase DWL or Jibu water by the interviewer. The final sample consists of 347 respondents in Kenya and 275 respondents in Rwanda. Figure 14 shows the experimental set up for each country. For DWL, vendors were randomly selected in each sales area according to sales density (which was cross checked with population density). For Jibu, respondents were selected at micro-franchises within each Jibu sales area. Note that Jibu sales areas are demarcated so that they reach an equal population size in each zone. Following the initial face-to-face interviews, where we collected data on water use alongside socio-demographic background characteristics, all respondents were interviewed by phone during follow-up. The follow-up survey took place roughly four weeks after the initial survey.
38 The Jibu Solution. Online available: https://jibuco.com/how-are-we-different/. Last accessed on 29 August 2020. 39 Due to the high density of DWL’s sales reach, we had to define who we refer to as a non-consumer. A non-consumer was defined as someone who had not purchased either of the two brands of water in the last year. 40 Concerning the experiential marketing intervention, we aimed for a comparable set-up in both countries in terms of the amount of the distributed water.

117
Figure 14: Experimental set-up
The initial number of respondents during the first survey round was 426 for Kenya and 403 for Rwanda resulting in a response rate of 84% for Kenya and 74% for Rwanda after the follow-up telephone calls. Since we did not visit the survey participants in their homes and could only reach out to them via telephone, our study has experienced attrition. Yet, attrition does not seem to influence our results. For the power calculations underlying the study, simple individual level randomization was applied since the individuals were randomized based on their order of arrival. We aimed for individual country level analyses imposing the conventional power of 0.8, a significance level of 5%, an equal split between the treatment and control group and a one-sided test, since the literature has shown that free samples are effective in increasing uptake. To detect a 15 percentage point difference between the control and the treatment group assuming the control
Case 1: Kenya
Case 2: Rwanda
Vendors within DWL sales areas
Non-Consumers, ~4 at each vendor (N=347)
Control Group (N=171)
Intervention Group (N=176)
Follow up phone interviews 4 weeks after intervention (N=347)
Randomized Control Trial
Micro-franchises within Jibu sales areas
Non-Consumers, ~11 at each micro-franchise (N=275)
Control Group (N=123)
Intervention Group (N=152)
Follow up phone interviews 4 weeks after intervention (N=275)
Randomized Control Trial

118
group has an uptake of 30%, we need a sample of 282 respondents. We reach that sample size for Kenya but are slightly underpowered for Rwanda. Since actual uptake in the control group was higher (roughly 50% in Kenya) our ex-post re-calculations suggest that we need a sample of 294 respondents. Importantly, when pooling the country-level samples we have enough power to detect differences. Moreover, we account for confounding factors in the multivariate analysis, which further increases the power to find impacts.
Data
Variable Description We collected data on two dependent variables, the free sample treatment status and a set of socio-economic background characteristics. The dependent variables were collected in a telephone interview four weeks after the initial, face-to-face interview. The socio-economic background characteristics were gathered during the initial interview that identified the study participants. The first dependent variable is a simple Yes-No question, the respondents were asked whether they have plans to purchase bottled water. This results in a 0-1 dummy variable. In addition, we inquired about actual purchase of bottled water in the four weeks between the initial and the follow up telephone survey. The duration is short enough to ensure that the study participants still remember whether they bought bottled water and most importantly, the beginning of the period is clearly marked by the initial survey. The answer to this question (Yes-No) results in another dummy variable. All respondents (treatment and control group) received purchase related information on where and how to buy bottled water from the two companies. Purchase information was obtained from the enumerator who explained to respondents where and how to purchase water from the two companies. Since Jibu is a newer company, respondents received a small flyer that showed where the closest franchise location was. DWL respondents received the same information but directly from the enumerator. The experiential marketing component in the form of receipt of the free water sample, i.e. the treatment status, is represented by a dummy variable coding 1 for recipients and zero otherwise. The socio-economic control variables are based on the existing literature on uptake of bottled water in emerging markets (compare Table 16). We control for household size, whether the respondent has children, age (data is only available for Kenya), gender, the education level and employment status as well as self-rated wealth. The first set of variables controls for the family composition, the latter for household purchasing power. We further control for a dependent variable-related aspect: whether the respondent has previous experience with bottled water. The previous experience variable is meant to capture existing knowledge about bottled water. Finally, sales area specific effects are considered to account for differences in infrastructure, including water related infrastructure, across areas.
Descriptive Statistics Descriptive statistics for both the Kenya and Rwanda datasets are shown in Table 17. The two dependent variables display significant differences in means across the treatment and the control group while the socio-demographic independent variables are identical for both groups. Thus, balancing is obtained along the covariate space indicating that the outcomes are likely not driven by demographic differences between the two groups and that the randomized
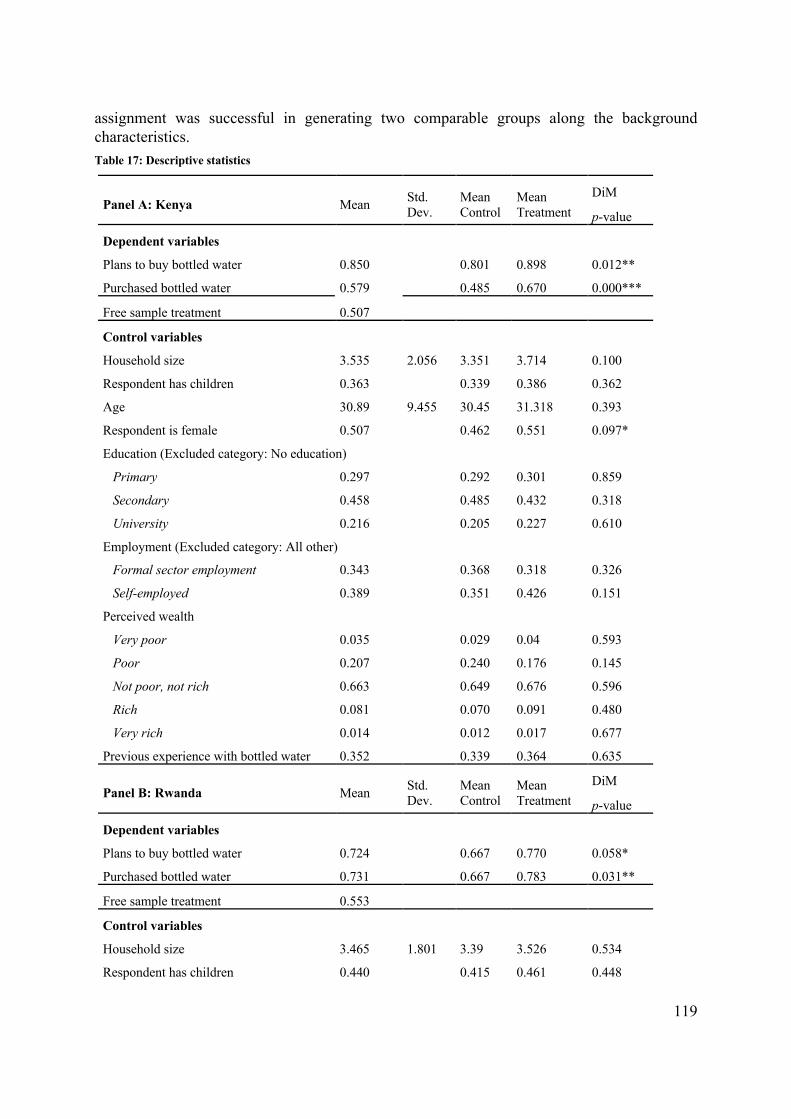
119
assignment was successful in generating two comparable groups along the background characteristics. Table 17: Descriptive statistics
Panel A: Kenya Mean Std. Dev.
Mean Control
Mean Treatment
DiM
p-value
Dependent variables
Plans to buy bottled water 0.850 0.801 0.898 0.012**
Purchased bottled water 0.579 0.485 0.670 0.000***
Free sample treatment 0.507
Control variables
Household size 3.535 2.056 3.351 3.714 0.100
Respondent has children 0.363 0.339 0.386 0.362
Age 30.89 9.455 30.45 31.318 0.393
Respondent is female 0.507 0.462 0.551 0.097*
Education (Excluded category: No education)
Primary 0.297 0.292 0.301 0.859
Secondary 0.458 0.485 0.432 0.318
University 0.216 0.205 0.227 0.610
Employment (Excluded category: All other)
Formal sector employment 0.343 0.368 0.318 0.326
Self-employed 0.389 0.351 0.426 0.151
Perceived wealth
Very poor 0.035 0.029 0.04 0.593
Poor 0.207 0.240 0.176 0.145
Not poor, not rich 0.663 0.649 0.676 0.596
Rich 0.081 0.070 0.091 0.480
Very rich 0.014 0.012 0.017 0.677
Previous experience with bottled water 0.352 0.339 0.364 0.635
Panel B: Rwanda Mean Std. Dev.
Mean Control
Mean Treatment
DiM
p-value
Dependent variables
Plans to buy bottled water 0.724 0.667 0.770 0.058*
Purchased bottled water 0.731 0.667 0.783 0.031**
Free sample treatment 0.553
Control variables
Household size 3.465 1.801 3.39 3.526 0.534
Respondent has children 0.440 0.415 0.461 0.448

120
Respondent is female 0.429 0.439 0.421 0.766
Education (Excluded category: No education)
Primary 0.320 0.285 0.349 0.259
Secondary 0.320 0.374 0.276 0.085*
University 0.218 0.195 0.237 0.407
Employment (Excluded category: All other)
Formal sector employment 0.196 0.187 0.204 0.726
Self-employed 0.418 0.423 0.414 0.890
Perceived wealth
Very poor 0.185 0.146 0.217 0.134
Poor 0.276 0.276 0.276 0.998
Not poor, not rich 0.316 0.325 0.309 0.778
Rich 0.178 0.211 0.151 0.197
Very rich 0.044 0.041 0.046 0.828
Previous experience with bottled water 0.549 0.553 0.546 0.911
Note: The Kenya (Rwanda) sample has 347 (275) observations. ***/**/* indicates statistical significance at the 1/5/10% level. DiM abbreviates difference in means.
We start with introducing the outcome variables: For the case of Kenya, on average 85.0% of the sampled non-consumers indicate purchase intention and 57.9% purchased bottled water, showing that personal advertising information is effective in emerging markets. Yet, experiential marketing holds its promise of further increasing purchase (intention). When comparing those who obtained the free water sample with the control group, we find considerable differences. For purchase intention we identify a difference between the treatment and control group of 9.7 percentage points (p-value=0.012). For realized purchase the difference is more than 17 percentage points (p-value<0.01), suggesting that the experiential marketing component was effective in generating additional demand. Rwanda had similar results. Purchase intention is lower compared to Kenya –77.0% in the treatment and 66.7% in the control group (p-value<0.05)– but actual uptake is higher. On average, 73.1% purchased bottled water with the share among the treatment (control) group being 78.3% (66.7%). The difference is statistically significant at the 5% level. The descriptive statistics for both countries indicate that the provision of the free water sample was successful in increasing purchase (intention) beyond what was generated by providing personal advertising information. The differences in uptake between Rwanda and Kenya, i.e. the higher share of consumers purchasing bottled water after receiving information in Rwanda, is likely due to the Rwandan supplier Jibu being newer to the market and therefore fewer people are aware of the brand. Due to the relative recentness of Jibu’s market entrance, the provided information had a larger effect in raising brand awareness. By providing consumers with information on how and where to purchase bottled water in their neighborhood access and consequently purchase are made more convenient. As Devoto et al. (2012) show, providing relevant product-related information is likely to increase uptake. The role of information also fits with the work of (Dupas, 2011),

121
where access to information had a strong effect on incorporating beneficial health related behavior like the consumption of clean drinking water. Note that in both countries the randomization of the free water sample has worked out with half the respondents having received the free water sample and the other half being in the control group. Yet, there remains the risk that the found differences in purchase behavior between the treatment and control group are largely driven by related socio-economic factors; except for one factor in each country, all of the socio-economic characteristics are identical across the treatment and control group.41 Since there are no marked differences in the background characteristics, we proceed by only discussing global averages. In both countries the average household size is around 3.5 people. In Kenya (Rwanda) 36% (44%) of the respondents have children. The gender split in Kenya is equal whereas in Rwanda the sample is made up of more men (58%). Next and more importantly, we turn to MoP identifiers: Most Kenyan respondents have achieved secondary education (46%). In Rwanda the education level of the respondents is more evenly split between primary, secondary and university. In both countries the majority of respondents are self-employed (39% in Kenya, 42% in Rwanda) indicating that they are entrepreneurs (versus public sector and other forms of employment). Regarding wealth, respondents were asked to self-rank on a 5-point Likert scale. In Kenya the majority (73.1%) self-classified as middle-class or richer. In Rwanda 57.7% identified at least as middle-class. Thus, undoubtedly the sample under study consists to a large extent of MoP consumers showing that they gain prominence in the African cities under study. Finally, in Kenya only 35% of respondents have previous experience with bottled water. In Rwanda, the majority of respondents (55%) were previous bottled water users. This difference is not surprising since in Kigali there is a high level of knowledge about unsafe drinking water so most people opt for bottled water or treat their tap water. While the simple comparison of means has already indicated a difference in the outcome variable as result of the free water sample, in a next step we will employ a multivariate analysis controlling for the above background characteristics and sales area specific effects to rule out that they might have mitigating effects on the found impacts.
Empirical Approach We applied an RCT as motivated by related field experiments that investigate promotion of healthy behaviors and the triggers of behavioral change. Our set-up is akin to existing RCTs about water use (Datta et al., 2015; Devoto, Duflo, Dupas, and Parien et al., 2012; Luoto, Levine, Albert, et al., 2014). Similar to the literature, we employ the simple linear regression model in the multivariate analysis of both outcomes: (i) purchase intention and (ii) purchase. We use the linear model despite the two variables being dummy variables because it allows to directly interpret the marginal effects. As a robustness check, a logit model is estimated
41 In the Kenya sample, there are slightly more women in the control group and in the Rwanda sample individuals in the treatment group are more likely to have completed secondary education. However, in both countries the one factor that differs is only statistically significant at the 10% level.

122
(Wooldridge, 2010). We specify the following model for every respondent i living in sales area s: Ysi = α0 + β1 Free_Samplesi + β2 Controlssi + λs + εsi,
Ysi is one of the two dependent variables. Free_Samplesi is the variable of interest, denoting 1 for those who obtained the free water sample and zero otherwise. The matrix of control variables Controlssi collects the above described socio-economic variables to account for any possible remaining demographic differences that might influence purchase (intention). The socio-economic variables are: Household size, whether there are children in the household, age, gender, education, type of employment, wealth, and prior experience with bottled drinking water. In addition, we control for sales area fixed effects, denoted by λs, to account for differences in infrastructure across locations such as accessibility, availability of public water sources, etc. Finally, the error term is denoted by εsi. We cluster the error term at the sales area level to account for possible correlations within areas in the unobservable errors. As a first step, the above specification is estimated separately for both countries.
Results
Main Results The estimation results for both countries are shown in Table 18. Two general observations stand out. First, for both countries the distribution of the free water sample affects both dependent variables in a practically and statistically meaningful way. Second, the relationship between the socio-economic control variables and the outcome variables is by and large negligible. In a well-designed RCT setting it is not surprising that the moderator variables or confounding factors that are included in the empirical model do not have any impact. In fact, it shows that the assignment into treatment and control was well designed and implemented, allowing to assess only the causal impact of the randomly assigned treatment which is the experiential marketing component in our setup. Focusing on Kenya, columns 1 and 2 of Table 18 show the findings. The free water sample increases the purchase intention by 10.0 percentage points (p-value≤0.05) and the likelihood of purchase by 19.7 percentage points (p-value≤0.05). The findings are robust to confounding factors since there is no relationship between the covariates and the dependent variables and the inclusion of the sales area fixed effects does not alter the results indicating that the randomization was properly implemented.

123
Table 18: Main results: Linear regression results for Kenya and Rwanda
Panel A: Kenya Panel B: Rwanda Panel C: Rwanda (excluding areas with limited compliance)
Outcome variable: Planned purchase (intention)
Purchase Planned purchase (intention)
Purchase Planned purchase (intention)
Purchase
Free sample treatment 0.100** 0.197** 0.113° 0.125* 0.147** 0.156** (0.036) (0.064) (0.068) (0.066) (0.060) (0.064)
Household size -0.004 -0.022 -0.013 -0.014 -0.008 -0.008 (0.017) (0.012) (0.015) (0.015) (0.016) (0.016)
Respondent has children 0.008 0.031 -0.056 -0.070 -0.050 -0.059 (0.051) (0.046) (0.044) (0.047) (0.050) (0.054)
Age 0.001 0.000
(0.002) (0.002)
Respondent is female -0.038 0.009 -0.026 -0.030 -0.011 -0.005 (0.064) (0.073) (0.047) (0.046) (0.055) (0.055)
Education (Excluded category: No education)
Primary 0.156 0.125 -0.101 -0.111 -0.031 -0.031 (0.175) (0.178) (0.115) (0.113) (0.151) (0.151)
Secondary 0.187 0.160 -0.083 -0.087 -0.066 -0.067 (0.167) (0.172) (0.084) (0.086) (0.125) (0.127)
University 0.158 0.190 -0.139 -0.125 -0.091 -0.082 (0.162) (0.199) (0.113) (0.105) (0.175) (0.167)
Employment (Excluded category: All other)
Formal sector employment 0.056 0.091 0.088 0.102 0.133 0.157 (0.051) (0.081) (0.073) (0.085) (0.087) (0.098)
Self-employed 0.020 0.139* 0.097 0.111 0.121 0.125 (0.039) (0.076) (0.079) (0.078) (0.102) (0.104)
Perceived wealth (Excluded category: Very poor)
Poor 0.048 0.052 0.003 -0.011 -0.074 -0.070 (0.103) (0.122) (0.082) (0.074) (0.099) (0.099)
Not poor , not rich 0.013 -0.032 0.170* 0.157** 0.137** 0.140** (0.110) (0.149) (0.081) (0.072) (0.057) (0.058)
Rich 0.055 -0.149 0.170 0.151 0.115 0.118 (0.107) (0.213) (0.105) (0.092) (0.111) (0.109)
Very rich 0.094 0.288 -0.051 0.002 -0.151 -0.065 (0.128) (0.219) (0.119) (0.121) (0.119) (0.148)
124
Previous experience with bottled water 0.059 0.004 0.084* 0.097** 0.077 0.083 (0.047) (0.066) (0.040) (0.042) (0.062) (0.063)
Note: For Kenya (for Rwanda) the total number of observations across specifications is 347 (275). The restricted sample only has 210 observations. All specifications include sales area specific effects. Standard errors clustered at the sales area level are in parentheses. ***/**/* indicates statistical significance at the 1/5/10% level. ° indicates statistical significance at the 12% level.
For Rwanda, we find similar results but magnitudes and statistical significance are smaller (Table 3, Columns 3-4). Purchase intention is increased by 11.3 percentage points in response to the experiential marketing intervention, but this estimate is only statistically significant at a level of 12%. The free water sample increased purchase by 12.5 percentage points (p-value≤0.10). The lower statistical significance is the result of the set-up of the Rwandan experiment. In Rwanda, respondents in the treatment group were given a voucher to pick up their free water at the nearest franchise location. However, in two of the franchise locations information on the free water vouchers was not communicated properly to the franchise owners, therefore some respondents in these two areas encountered difficulties picking up their water. To account for the lack of compliance from the franchise owners, the analysis was also conducted excluding the problematic areas. Results for the restricted sample are presented in Columns 5 and 6. For the restricted sample we obtain results that resemble the ones for Kenya in both coefficient size and statistical significance. Similar to Kenya, most of the control variables have no influence on consumption of Jibu water. We find some impact of wealth reinforcing that it is indeed MoP consumers that switch to safer drinking water options. The finding is likely driven by the fact that the Rwandan sample is more heterogeneous along the wealth dimension. Thus, across contexts we find evidence in favor of experiential marketing having an impact on the MoP in emerging markets; if properly implemented, the random distribution of a free water sample shows to causally increases purchase intentions and purchase.
Robustness Checks A downside of the study is that the two individual datasets are rather small. As a robustness check, we conduct the analysis on the combined dataset yielding an increase in sample size and thus a higher level of precision (Table 19). Since both countries showed individually that the free water sample was successful in spurring purchase (intentions) it is not surprising that almost the same effect is found in the combined analysis. On average, across countries, purchase intention increases by 11 percentage points as a consequence of receiving the free water sample and, as expected, statistical significance improves (p-value≤ 0.01). Purchase increases by 17.3 percentage points (p-value≤ 0.01).

125
Table 19: Main results: Linear regression results for the combined sample of both countries
Outcome variable: Planned purchase (intention)
Purchase
Free sample treatment 0.110*** 0.173*** (0.028) (0.043)
Household size -0.005 -0.015* (0.012) (0.009)
Respondent has children -0.011 -0.004 (0.032) (0.030)
Respondent is female -0.029 0.001 (0.040) (0.045)
Education (Excluded category: No education)
Primary 0.060 0.024 (0.084) (0.084)
Secondary 0.055 0.023 (0.087) (0.080)
University 0.019 0.025 (0.088) (0.092)
Employment (Excluded category: All other)
Formal sector employment 0.083* 0.110* (0.047) (0.062)
Self-employed 0.049 0.132** (0.038) (0.050)
Perceived wealth (excluded category: Very poor)
Poor -0.004 0.021 (0.054) (0.056)
Not poor, not rich 0.050 0.064 (0.052) (0.056)
Rich 0.095 0.038 (0.065) (0.081)
Very rich -0.079 0.052 (0.084) (0.115)
Previous experience in the use of bottled water 0.061* 0.025 (0.035) (0.049)
Note: The total number of observations is 622. All specifications include sales area specific effects. Standard errors clustered at the sales area level are in parentheses. ***/**/* indicates statistical significance at the 1/5/10% level.

126
It might be argued that the logit model should be the model of choice. Results are presented in Table 20. The logit estimates differ in magnitude from the OLS coefficient estimates and are not directly comparable. We can interpret them in terms of odds ratios by taking the exponential value of the coefficient estimates. For respondents’ purchase decision in Kenya (Rwanda) this implies that the odds ratio is 2.394 (2.363). Thus, the odds of purchase are 139% (136%) higher as a consequence of the free water sample. The result is in line with the findings derived from the linear probability model. Table 20: Logistic regression results
Note: For Kenya (Rwanda) the total number of observations across specifications is 347 (275). All specifications include sales area specific effects. The same control variables are included as in the linear model (compare Table 3). Standard errors clustered at the sales area level are in parentheses. ***/**/* indicates statistical significance at the 1/5/10% level.
In short, the two outcomes and the different model specifications reinforce each other showing that the experience of a free water sample increases the likelihood of purchase (intentions). These results fit within the literature that looks at how having a product experience (not just a price promotion) can increase the likelihood of purchase (Bawa and Shoemaker, 2004; Dupas, 2011; Gentile et al., 2007; Schmitt et al., 2015; Stead et al., 2017).
Discussion With the rise of MoP consumers in sub-Saharan Africa, it is important for enterprises operating in these markets to understand how these consumers make consumption decisions. Our work contributes to the research on MoP consumers by providing insights about the role of experiential marketing, i.e. pre-purchase experience, in driving purchase (intention). Our findings support the development of effective marketing strategies of social enterprises like Jibu and DWL by showing that experience can be a powerful marketing tools in targeting MoP consumers with much needed, healthy products like clean drinking water. More precisely, this paper assessed two hypotheses about purchase of bottled drinking water in emerging markets. The first hypothesis posits that wealth is positively related to purchase intention and purchase. The second hypothesis investigates the relationship between receipt of a pre-purchase, free sample of drinking water and purchase (intention). Concerning the first hypothesis, we descriptively identify that indeed our sample constitutes to a large extent of MoP consumer. In Kenya, two-thirds of the respondents self-identified as middle-class. The distribution of the Rwandan respondents is more even across the wealth ladder, yet even there almost 60% identify as middle-class or richer. As a consequence of the limited variation along the wealth dimension, we only find limited support for the first hypothesis in the multivariate analysis of the Rwandan sub-sample. This finding fits with earlier work that showed mixed results on the role of wealth and income in choice of drinking water alternatives (Dupas, 2011;
Panel A: Kenya Panel B: Rwanda
Outcome variable:
Planned purchase (intention)
Purchase Planned purchase (intention)
Purchase
Free sample treatment 0.846*** 0.873*** 0.799** 0.860**
(0.315) (0.284) (0.317) (0.346)

127
Null et al., 2012; Quansah et al., 2015). Put differently, since most respondents of our sample are MoP consumers, it is not surprising that we only identify a limited impact of wealth on consumption decisions. Within this demographic it is not so much wealth that drives consumption decisions but lifestyle. This implies that consumers are not necessarily purely influenced by price. This finding seems to be particularly relevant for MoP consumers where branding and aspirational spending becomes more important with their increased purchasing power. This leads us to our second hypothesis that incorporates the lifestyle aspect as part of the experiential marketing approach. We find support for both parts of the second hypothesis independent of the country under study, showing that experiential marketing provides a considerable value added to consumers beyond personal advertising in the form of information. In line with experiential marketing theory, the findings in support of the second hypothesis indicate that the opportunity to create a personal experience which comprises of a lifestyle and a sensorial component fosters purchase decisions. Furthermore, the found support for the second hypothesis also implies that the middle-class is not just an income or wealth category but it is also a way of life, where people establish a group identity because of a common belief system. More importantly, as the MoP continues to grow particularly in East Africa, they will generate additional demand that the marketing departments of enterprises operation in emerging markets should not underestimate. What our research further reinforces is that experiential marketing can boost demand substantially. Thus, our results bolster previous qualitative findings on the new middle-class that emphasize the role of branding, the need to experience branding, and the importance of health spending (Banerjee and Duflo, 2008; Chikweche and Fletcher, 2014; Diallo and Siqueira Jr, 2017). In addition, we used an RCT to investigate the effect of a product experience on purchase of bottled drinking water. Contrary to qualitative and observational studies, the RCT allows us to causally infer the value added of experiential marketing. In the current literature such studies are few and far between leaving businesses operating in emerging markets in doubt about the expected gains of the extra effort of an experiential marketing campaign. Our study closes this gap. Enterprises interested in the cost implications of experiential marketing versus personal information sharing can use our estimates for back-of-the-envelope calculations. For the sake of simplicity let us assume that an enterprise wants to conduct a marketing campaign targeted towards 100 potentially new consumers. We further assume that advertising in the form of personal information sharing costs 1$ per non-consumer and in the form of experiential marketing 2$, implying that experiential marketing has double the cost of only personal information sharing (100$ versus 200$). Our results suggest that on average across the two countries purchase increased by almost 58% as a consequence of information only and further increased by 17 percentage points (average result, Table 4) due to experiential marketing. If the product under study costs as little as 2$, experiential marketing results in a gain versus advertising with personal information as soon as at least three purchases are realized per new consumer (3*2$*75 new consumers – 200$ > 3*2$*58 new consumers – 100$) assuming all of the new consumers make three purchases under both settings. While this calculation is simplistic, it shows that given the large additional consumer share that can be reached with experiential marketing, enterprises in emerging markets can reap large benefits from employing this tool when reaching out to MoP consumers. Another strength of the study is that we conducted the analysis for two countries and two different social enterprises, increasing the external validity of our findings. This allows us to

128
generalize our conclusions across similar contexts. For both country settings we find evidence that distribution of a free water sample increases purchase (intention) of bottled water, showing that MoP consumers can be encouraged to shift their water consumption from unsafe to safer sources. That consumers need to be supported in taking up safer water sources suggests that they are risk adverse with respect to new experiences. Companies that offer health related products like clean drinking water can learn the following lessons: first, supply of a safer product does not necessarily create demand. To boost uptake, consumers need to be introduced to the product, and a free sample can be a very effective means. Second, because free sample provision can be a costly marketing tool, in particular for firms operating in emerging markets, we also showed that simply providing purchase-related information on a safer product increases uptake. Importantly, from a public health perspective, our findings suggest that consumers can shift to healthier drinking water choices when presented with purchase-related information and the relevant product experience. While the health implications and the presented back-of-the-envelope calculation are promising and the results are coherent, robust and practically as well as statistically meaningful, we do not want to keep quiet about the limitations our study suffers from. First, sample sizes are fairly small and the geographical coverage is limited to the urban areas in both countries. Therefore, we have to apply caution when extrapolating the results for the countries as a whole. A follow up study should aim at increasing the sample size as well as the geographical coverage. Second, sample attrition is a concern that future research could address by conducting the interviews at the homes of the respondents. Third, respondents were selected through street intercepts and are not necessarily the household decision makers. It is possible that the provision of purchase related information via conversation has even larger effects if targeted at the household decision makers. Fourth, while respondents were asked about their purchase intention, follow-up and measurement of future purchase of bottled water was not within the scope of the study. Therefore, it is possible that the free sample only had an effect on the consumers’ immediate decision to consume bottled drinking water, but they will not sustain bottled water purchase in the future. Future research should further explore the behavioral side of consumption through the use of repeated follow-up surveys to investigate the sustainability of altered consumption behaviors. Fifth, our study relies on self-reported consumption decisions. To avoid reporting bias, future work should aim at observing consumption decisions directly. Sixth, our work did not fully explore the sensory component of experience; we did not look at the role of water taste in purchase decision making. Since the research only involved one water brand in each country and consumers were not asked about the role of taste and branding in their decision to purchase, we cannot draw conclusions on how MoP consumers react to sensory elements like taste. Finally, the role of personal advertising in the form of information sharing was not assessed as part of the RCT and we can thus not draw causal conclusions about the role of personal advertising information. Future research could also randomize the advertising component. Despite the highlighted limitations we argue that our design is strong enough to establish that experiential marketing tools should be considered by businesses operating in emerging markets since lifestyle and emotions are non-negligible factors for consumption decisions by members of the MoP. From a psychological point of view, the provision of a free sample gives consumers the opportunity to experience a product which provides them with a new reference point to reframe current loss versus future gain, and ultimately allows them to change their consumption behavior. An experience with a product minimizes the perceived future risk of purchase that a consumer may have and also taps into the emotional component of purchase decision making.

129

130
References Agnihotri, A. (2012). Revisiting the Debate over the Bottom of the Pyramid Market. Journal of
Macromarketing, 32(4), 417–423. https://doi.org/10.1177/0276146712451596 Alur, S., & Schoormans, J. P. L. (2013). Retailers and new product acceptance in India’s base
of pyramid (BoP) markets: Propositions for research. International Journal of Retail & Distribution Management, 41(3), 189–200. https://doi.org/10.1108/09590551311306246
Atkinson, J., de Janvry, A., McIntosh, C., & Sadoulet, E. (2013). Prompting Microfinance Borrowers to Save: A Field Experiment from Guatemala. Economic Development and Cultural Change, 62(1), 21–64. https://doi.org/10.1086/671713
Banerjee, A., & Duflo, E. (Eds.). (2017). Handbook of economic field experiments. North-Holland, An imprint of Elsevier.
Banerjee, A. V., & Duflo, E. (2008). What is Middle Class about the Middle Classes around the World? Journal of Economic Perspectives, 22(2), 3–28. https://doi.org/10.1257/jep.22.2.3
Bawa, K., & Shoemaker, R. (2004). The Effects of Free Sample Promotions on Incremental Brand Sales. Marketing Science, 23(3), 345–363. https://doi.org/10.1287/mksc.1030.0052
Birdsall, N. (2015). Does the Rise of the Middle Class Lock in Good Government in the Developing World? The European Journal of Development Research, 27(2), 217–229. https://doi.org/10.1057/ejdr.2015.6
Bjørner, T. B., Hansen, L. G., & Russell, C. S. (2004). Environmental labeling and consumers’ choice—An empirical analysis of the effect of the Nordic Swan. Journal of Environmental Economics and Management, 47(3), 411–434. https://doi.org/10.1016/j.jeem.2003.06.002
Brakus, J. J., Schmitt, B. H., & Zarantonello, L. (2009). Brand experience: What is it? How is it measured? Does it affect loyalty? Journal of Marketing, 73(3), 52-68. https://doi.org/10.1509/jmkg.73.3.052
Brécard, D., Hlaimi, B., Lucas, S., Perraudeau, Y., & Salladarré, F. (2009). Determinants of demand for green products: An application to eco-label demand for fish in Europe. Ecological Economics, 69(1), 115–125. https://doi.org/10.1016/j.ecolecon.2009.07.017
Brei, V., & Böhm, S. (2011). Corporate social responsibility as cultural meaning management: A critique of the marketing of ‘ethical’ bottled water. Business Ethics: A European Review, 20(3), 233–252. https://doi.org/10.1111/j.1467-8608.2011.01626.x
Burt, Z., Njee, R. M., Mbatia, Y., Msimbe, V., Brown, J., Clasen, T. F., Malebo, H. M., & Ray, I. (2017). User preferences and willingness to pay for safe drinking water: Experimental evidence from rural Tanzania. Social Science & Medicine, 173, 63–71. https://doi.org/10.1016/j.socscimed.2016.11.031

131
Campenhout, B. V. (2019). The Role of Information in Agricultural Technology Adoption: Experimental Evidence from Rice Farmers in Uganda. Economic Development and Cultural Change, 703868. https://doi.org/10.1086/703868
Cantone, L., & Risitano, M. (2011). Building consumer-brand relationships for the customer experience management. 1–33.
Carù, A., & Cova, B. (2003). Revisiting Consumption Experience: A More Humble but Complete View of the Concept. Marketing Theory, 3(2), 267–286. https://doi.org/10.1177/14705931030032004
Cavusgil, S. T., Deligonul, S., Kardes, I., & Cavusgil, E. (2018). Middle-Class Consumers in Emerging Markets: Conceptualization, Propositions, and Implications for International Marketers. Journal of International Marketing. https://doi.org/10.1509/jim.16.0021
Cheeseman, N. (2015). “No Bourgeoisie, No Democracy”? The Political Attitudes of the Kenyan Middle Class: Democracy in the African Middle Class. Journal of International Development, 27(5), 647–664. https://doi.org/10.1002/jid.3057
Chikweche, T., & Fletcher, R. (2012). Revisiting the marketing mix at the bottom of pyramid (BOP): From theoretical considerations to practical realities. Journal of Consumer Marketing, 29(7), 507–520. https://doi.org/10.1108/07363761211275018
Chikweche, T., & Fletcher, R. (2014). “Rise of the middle of the pyramid in Africa”: Theoretical and practical realities for understanding middle class consumer purchase decision making. Journal of Consumer Marketing, 31(1), 27–38. https://doi.org/10.1108/JCM-10-2013-0729
Cohen, A., Zhang, Q., Luo, Q., Tao, Y., Colford, J. M., & Ray, I. (2017). Predictors of Drinking Water Boiling and Bottled Water Consumption in Rural China: A Hierarchical Modeling Approach. Environmental Science & Technology, 51(12), 6945–6956. https://doi.org/10.1021/acs.est.7b01006
Cohen, J., & Dupas, P. (2008). Free Distribution or Cost-Sharing? Evidence from a Malaria Prevention Experiment (No. w14406). National Bureau of Economic Research. https://doi.org/10.3386/w14406
Dahlberg. (2017). The Untapped Potential of Decentralized Solutions to Provide Safe, Sustainable Drinking Water at Large Scale. www.safewaterentreprises.com
Datta, S., Miranda, J. J., Zoratto, L., Calvo-González, O., Darling, M., & Lorenzana, K. (2015). A behavioral approach to water conservation: Evidence from Costa Rica. The World Bank.
Davis, S., & Longoria, T. (2003). Harmonizing your touch points. Brand Packaging, 1. de Queiroz, J. T. M., Doria, M. de F., Rosenberg, M. W., Heller, L., & Zhouri, A. (2013).
Perceptions of bottled water consumers in three Brazilian municipalities. Journal of Water and Health, 11(3), 520–531. https://doi.org/10.2166/wh.2013.222
Devoto, F., Duflo, E., Dupas, P., Parienté, W., & Pons, V. (2012). Happiness on Tap: Piped Water Adoption in Urban Morocco. American Economic Journal: Economic Policy, 4(4), 68–99. https://doi.org/10.1257/pol.4.4.68

132
Diallo, M. F., & Siqueira Jr, J. R. (2017). How previous positive experiences with store brands affect purchase intention in emerging countries: A comparison between Brazil and Colombia. International Marketing Review, 34(4), 536–558. https://doi.org/10.1108/IMR-07-2014-0224
Dos Santos, S., Adams, E. A., Neville, G., Wada, Y., de Sherbinin, A., Mullin Bernhardt, E., & Adamo, S. B. (2017). Urban growth and water access in sub-Saharan Africa: Progress, challenges, and emerging research directions. Science of The Total Environment, 607–608, 497–508. https://doi.org/10.1016/j.scitotenv.2017.06.157
Downs, J. S., Loewenstein, G., & Wisdom, J. (2009). Strategies for Promoting Healthier Food Choices. American Economic Review, 99(2), 159–164. https://doi.org/10.1257/aer.99.2.159
Duflo, E., Kremer, M., & Robinson, J. (2011). Nudging Farmers to Use Fertilizer: Theory and Experimental Evidence from Kenya. American Economic Review, 101(6), 2350–2390. https://doi.org/10.1257/aer.101.6.2350
Dupas, P. (2011). Health Behavior in Developing Countries. Annual Review of Economics, 3(1), 425–449. https://doi.org/10.1146/annurev-economics-111809-125029
Dupas, P., & Robinson, J. (2013). Why Don’t the Poor Save More? Evidence from Health Savings Experiments. American Economic Review, 103(4), 1138–1171. https://doi.org/10.1257/aer.103.4.1138
Dupas Pascaline. (2014). Short-Run Subsidies and Long-Run Adoption of New Health Products: Evidence From a Field Experiment. Econometrica, 82(1), 197–228. https://doi.org/10.3982/ECTA9508
Espinosa-García, A. C., Díaz-Ávalos, C., González-Villarreal, F. J., Val-Segura, R., Malvaez-Orozco, V., & Mazari-Hiriart, M. (2015). Drinking Water Quality in a Mexico City University Community: Perception and Preferences. EcoHealth, 12(1), 88–97. https://doi.org/10.1007/s10393-014-0978-z
Francisco, J. P. S. (2014). Why households buy bottled water: A survey of household perceptions in the Philippines: Why households buy bottled water. International Journal of Consumer Studies, 38(1), 98–103. https://doi.org/10.1111/ijcs.12069
Gentile, C., Spiller, N., & Noci, G. (2007). How to Sustain the Customer Experience: European Management Journal, 25(5), 395–410. https://doi.org/10.1016/j.emj.2007.08.005
Grady, C. A., Kipkorir, E. C., Nguyen, K., & Blatchley, E. R. (2015). Microbial quality of improved drinking water sources: Evidence from western Kenya and southern Vietnam. Journal of Water and Health, 13(2), 607. https://doi.org/10.2166/wh.2014.206
Griffith, D. A., & Jain, S. C. (2011). Handbook of research in international marketing. http://www.elgaronline.com/view/9781849803021.xml
Hahn, R. (2009). The Ethical Rational of Business for the Poor – Integrating the Concepts Bottom of the Pyramid, Sustainable Development, and Corporate Citizenship. Journal of Business Ethics, 84(3), 313–324. https://doi.org/10.1007/s10551-008-9711-6
133
Hanks, A. S., Just, D. R., Smith, L. E., & Wansink, B. (2012). Healthy convenience: Nudging students toward healthier choices in the lunchroom. Journal of Public Health, 34(3), 370–376. https://doi.org/10.1093/pubmed/fds003
Herrera, V. (2019). Reconciling global aspirations and local realities: Challenges facing the Sustainable Development Goals for water and sanitation. World Development, 118, 106–117. https://doi.org/10.1016/j.worlddev.2019.02.009
Hingston, S. T., & Noseworthy, T. J. (2018). Why Consumers Don’t see the Benefits of Genetically Modified Foods, and what Marketers can do about It. Journal of Marketing, 82(5), 125–140. https://doi.org/10.1509/jm.17.0100
Holden, S. T., & Bezu, S. (2019). Exchange asymmetries in productive assets: Tools, fertilizer or cash? World Development, 115, 269–278. https://doi.org/10.1016/j.worlddev.2018.12.002
Howell, R., Sinha, K. M., Wagner, N., Doorn, N., & van Beers, C. (2020). Consumption of Bottled Water at the Bottom of the Pyramid: Who Purchases First? Journal of Macromarketing, 40(1), 31–50. https://doi.org/10.1177/0276146719866890
Ihtiyar, A., Barut, M., & Ihtiyar, H. G. (2019). Experiential marketing, social judgements, and customer shopping experience in emerging markets. Asia Pacific Journal of Marketing and Logistics, 31(2), 499–515. https://doi.org/10.1108/APJML-02-2018-0081
Jilcott Pitts, S. B., Wu, Q., Sharpe, P. A., Rafferty, A. P., Elbel, B., Ammerman, A. S., Payne, C. R., Hopping, B. N., McGuirt, J. T., & Wall-Bassett, E. D. (2016). Preferred Healthy Food Nudges, Food Store Environments, and Customer Dietary Practices in 2 Low-Income Southern Communities. Journal of Nutrition Education and Behavior, 48(10), 735-742.e1. https://doi.org/10.1016/j.jneb.2016.08.001
Kallbekken, S., & Sælen, H. (2013). ‘Nudging’ hotel guests to reduce food waste as a win–win environmental measure. Economics Letters, 119(3), 325–327. https://doi.org/10.1016/j.econlet.2013.03.019
Karlan, D., & Appel, J. (2014). More than good intentions improving the ways the world’s poor borrow, save, farm, learn, and stay healthy. Plume. http://rbdigital.oneclickdigital.com
Karnani, A. (2007). The Mirage of Marketing to the Bottom of the Pyramid: How the Private Sector Can Help Alleviate Poverty. California Management Review, 49(4), 90–111. https://doi.org/10.2307/41166407
Karnani, A. (2009). Romanticising the poor harms the poor. Journal of International Development, 21(1), 76–86. https://doi.org/10.1002/jid.1491
Kenya National Bureau of Statistics, Ministry of Health/Kenya, National AIDS Control Council/Kenya, Kenya Medical Research Institute, & National Council for Population and Development/Kenya. (2015). Kenya Demographic and Health Survey 2014. http://dhsprogram.com/pubs/pdf/FR308/FR308.pdf
Kharas, H. (2010). The Emerging Middle Class in Developing Countries (OECD Development Centre Working Papers No. 285). https://doi.org/10.1787/5kmmp8lncrns-en
134
Kodila-Tedika, O., Asongu, S. A., & Kayembe, J. M. (2016). Middle Class in Africa: Determinants and Consequences. International Economic Journal, 30(4), 527–549. https://doi.org/10.1080/10168737.2016.1204340
Kolk, A., Rivera-Santos, M., & Rufin, C. (2014). Reviewing a Decade of Research on the “Base/Bottom of the Pyramid” (BOP) Concept. Business & Society, 53(3), 338–377. https://doi.org/10.1177/0007650312474928
Kormos, C., Gifford, R., & Brown, E. (2015). The Influence of Descriptive Social Norm Information on Sustainable Transportation Behavior: A Field Experiment. Environment and Behavior, 47(5), 479–501. https://doi.org/10.1177/0013916513520416
Kranzbühler, A.-M., Kleijnen, M. H. P., Morgan, R. E., & Teerling, M. (2018). The Multilevel Nature of Customer Experience Research: An Integrative Review and Research Agenda: Customer Experience Research. International Journal of Management Reviews, 20(2), 433–456. https://doi.org/10.1111/ijmr.12140
Kremer, M., Leino, J., Miguel, E., & Zwane, A. P. (2011). Spring Cleaning: Rural Water Impacts, Valuation, and Property Rights Institutions*. The Quarterly Journal of Economics, 126(1), 145–205. https://doi.org/10.1093/qje/qjq010
Lapworth, D., Stuart, M., Pedley, S., Nkhuwa, D., & Tijani, M. (2017). A review of urban groundwater use and water quality challenges in Sub-Saharan Africa.
Luoto, J., Levine, D., & Albert, J. (2011). Information and Persuasion: Achieving Safe Water Behaviors in Kenya. SSRN Electronic Journal. https://doi.org/10.2139/ssrn.1980292
Luoto, J., Levine, D., Albert, J., & Luby, S. (2014). Nudging to use: Achieving safe water behaviors in Kenya and Bangladesh. Journal of Development Economics, 110, 13–21. https://doi.org/10.1016/j.jdeveco.2014.02.010
Malhotra, N.K., Ulgado, F.M., Agarwal, J., Shainesh, G. & Wu, L. (2005). Dimensions of service quality in developed and developing economies: multi‐country cross‐cultural comparisons. International Marketing Review, 22(3), 256–278. https://doi.org/10.1108/02651330510602204
Marson, M., & Savin, I. (2015). Ensuring Sustainable Access to Drinking Water in Sub Saharan Africa: Conflict Between Financial and Social Objectives. World Development, 76, 26–39. https://doi.org/10.1016/j.worlddev.2015.06.002
Meagher, K. (2018). Cannibalizing the Informal Economy: Frugal Innovation and Economic Inclusion in Africa. The European Journal of Development Research, 30(1), 17–33. https://doi.org/10.1057/s41287-017-0113-4
Melber, H., & Nordiska Afrikainstitutet (Eds.). (2016). The rise of Africa’s middle class: Myths, realities and critical engagements. Zed Books.
Ministry of Water and Irrigation. (2017). Water Boards. Ministry of Water and Irrigation. http://www.water.go.ke/?page_id=57
Moser, S., & Mosler, H.-J. (2008). Differences in influence patterns between groups predicting the adoption of a solar disinfection technology for drinking water in Bolivia. Social Science & Medicine, 67(4), 497–504. https://doi.org/10.1016/j.socscimed.2008.04.002
135
Nakata, C. & Sivakumar, K. (1997). Emerging market conditions and their impact on first mover advantages: An integrative review. International Marketing Review, 14(6), 461–485. https://doi.org/10.1108/02651339710192993
National Institute of Statistics of Rwanda, Ministry of Finance and Economic Planning/Rwanda, Ministry of Health/Rwanda, & ICF International. (2016). Rwanda Demographic and Health Survey 2014-15. National Institute of Statistics of Rwanda, Ministry of Finance and Economic Planning/Rwanda, Ministry of Health/Rwanda, and ICF International. http://dhsprogram.com/pubs/pdf/FR316/FR316.pdf
Null, C., Kremer, M., Miguel, E., Hombrados, J. G., Meeks, R., & Zwane, A. P. (2012). Willingness to pay for cleaner water in less developed countries: Systematic review of experimental evidence. The International Initiative for Impact Evaluation (3iE).
Onjala, J., Ndiritu, S. W., & Stage, J. (2014). Risk perception, choice of drinking water and water treatment: Evidence from Kenyan towns. Journal of Water, Sanitation and Hygiene for Development, 4(2), 268. https://doi.org/10.2166/washdev.2014.131
Peletz, R., Kumpel, E., Bonham, M., Rahman, Z., & Khush, R. (2016). To What Extent is Drinking Water Tested in Sub-Saharan Africa? A Comparative Analysis of Regulated Water Quality Monitoring. International Journal of Environmental Research and Public Health, 13(3), 275. https://doi.org/10.3390/ijerph13030275
Prahalad, C. K. (2005). The fortune at the bottom of the pyramid. Wharton School Publishing. Prahalad, C. K., & Ramaswamy, V. (2004). Co-creation experiences: The next practice in value
creation. Journal of Interactive Marketing, 18(3), 5–14. https://doi.org/10.1002/dir.20015
Quansah, F., Okoe, A., & Angenu, B. (2015). Factors Affecting Ghanaian Consumers’ Purchasing Decision of Bottled Water. International Journal of Marketing Studies, 7(5). https://doi.org/10.5539/ijms.v7n5p76
Rathi, S. S., & Chunekar, A. (2015). Not to buy or can be ‘nudged’ to buy? Exploring behavioral interventions for energy policy in India. Energy Research & Social Science, 7, 78–83. https://doi.org/10.1016/j.erss.2015.03.006
Schlogl, L., & Sumner, A. (2014). How middle class are the ‘emerging middle’ or ‘scooter class’ in Indonesia? A household asset approach to social stratification. Department of Economics, Padjadjaran University.
Schmitt, B. (1999). Experiential Marketing. Journal of Marketing Management, 15(1–3), 53–67. https://doi.org/10.1362/026725799784870496
Schmitt, B. (2010). Experience Marketing: Concepts, Frameworks and Consumer Insights. Foundations and Trends® in Marketing, 5(2), 55–112. https://doi.org/10.1561/1700000027
Schmitt, B., Joško Brakus, J., & Zarantonello, L. (2015). From experiential psychology to consumer experience. Journal of Consumer Psychology, 25(1), 166–171. https://doi.org/10.1016/j.jcps.2014.09.001
Shaw, C., & Ivens, J. (2002). Building great customer experiences (Vol. 241). Springer.
136
Sheth, J. N. (2011). Impact of Emerging Markets on Marketing: Rethinking Existing Perspectives and Practices. Journal of Marketing, 75(4), 166–182. https://doi.org/10.1509/jmkg.75.4.166
Shimeles, A., & Ncube, M. (2015). The Making of the Middle-Class in Africa: Evidence from DHS Data. The Journal of Development Studies, 51(2), 178–193. https://doi.org/10.1080/00220388.2014.968137
Simester, D. (2017). Field Experiments in Marketing. In Handbook of Economic Field Experiments (Vol. 1, pp. 465–497). Elsevier. https://doi.org/10.1016/bs.hefe.2016.07.001
Smilansky, S. (2009). Experiential marketing: A practical guide to interactive brand experiences. Kogan Page.
Smith, R. E., & Swinyard, W. R. (1983). Attitude-Behavior Consistency: The Impact of Product Trial versus Advertising. Journal of Marketing Research, 20(3), 257. https://doi.org/10.2307/3151829
Solimano, A. (2008). The middle class and the development process. ECLAC. Stead, M., MacKintosh, A. M., Findlay, A., Sparks, L., Anderson, A. S., Barton, K., & Eadie,
D. (2017). Impact of a targeted direct marketing price promotion intervention (Buywell) on food-purchasing behavior by low income consumers: A randomized controlled trial. Journal of Human Nutrition and Dietetics, 30(4), 524–533. https://doi.org/10.1111/jhn.12441
Teisl, M. F., Roe, B., & Hicks, R. L. (2002). Can Eco-Labels Tune a Market? Evidence from Dolphin-Safe Labeling. Journal of Environmental Economics and Management, 43(3), 339–359. https://doi.org/10.1006/jeem.2000.1186
Thomas, M., Desai, K. K., & Seenivasan, S. (2011). How Credit Card Payments Increase Unhealthy Food Purchases: Visceral Regulation of Vices. Journal of Consumer Research, 38(1), 126–139. https://doi.org/10.1086/657331
Thurlow, J., Resnick, D., & Ubogu, D. (2015). Matching Concepts With Measurement: Who Belongs to Africa’s Middle Class? Journal of International Development, 27(5), 588–608. https://doi.org/10.1002/jid.3105
Tsaneva, M. (2013). The Effect of Risk Preferences on Household Use of Water Treatment. Journal of Development Studies, 49(10), 1427–1435. https://doi.org/10.1080/00220388.2013.790960
Vásquez, W. F. (2017). Understanding bottled water consumption in a high-poverty context: Empirical evidence from a small town in Guatemala: Understanding bottled water consumption. International Journal of Consumer Studies, 41(2), 199–206. https://doi.org/10.1111/ijcs.12327
Vásquez, W. F., Mozumder, P., Hernández-Arce, J., & Berrens, R. P. (2009). Willingness to pay for safe drinking water: Evidence from Parral, Mexico. Journal of Environmental Management, 90(11), 3391–3400. https://doi.org/10.1016/j.jenvman.2009.05.009
Water Services Regulatory Board. (2014). Water Tariffs. WASREB. http://wasreb.go.ke/tariffs/index.php?wsp=5

137
Wheary, J. (2005). Measuring the middle: Assessing what it takes to be middle class. Dēmos. Whittington, D., Briscoe, J., Mu, X., & Barron, W. (1990). Estimating the Willingness to Pay
for Water Services in Developing Countries: A Case Study of the Use of Contingent Valuation Surveys in Southern Haiti. Economic Development and Cultural Change, 38(2), 293–311. https://doi.org/10.1086/451794
WHO/UNICEF Joint Water Supply and Sanitation Monitoring Programme, World Health Organization, & UNICEF. (2015). Progress on sanitation and drinking water.
Wietzke, F.-B., & Sumner, A. (2018). The Developing World’s “New Middle Classes”: Implications for Political Research. Perspectives on Politics, 16(01), 127–140. https://doi.org/10.1017/S1537592717003358
Wooldridge, J. M. (2010). Econometric analysis of cross section and panel data (2nd ed). MIT Press.
World Bank. (2019). World Bank Group Country Survey 2019. https://microdata.worldbank.org/index.php/catalog/3516/study-description
Yuan, Y.-H., & Wu, C. (2008). Relationships Among Experiential Marketing, Experiential Value, and Customer Satisfaction. Journal of Hospitality & Tourism Research, 32(3), 387–410. https://doi.org/10.1177/1096348008317392
Zarantonello, L., Jedidi, K., & Schmitt, B. H. (2013). Functional and experiential routes to persuasion: An analysis of advertising in emerging versus developed markets. International Journal of Research in Marketing, 30(1), 46–56. https://doi.org/10.1016/j.ijresmar.2012.09.001
138
Energy Access and Demand in Uganda: The Role of Frugal Innovations in Meeting Future Energy Needs42
42 Single authored. A shorter version of this chapter was reviewed and accepted for presentation at the Africalics conference 2019 in Dar es Salaam, Tanzania.

139
Introduction With the advent of the new Sustainable Development Goals (SDGs), sustainability has shifted towards the forefront of the development agenda. Many of these goals center on infrastructural issues such as energy access and clean drinking water. A relatively new concept, frugal innovation, potentially has implications for the SDGs since it addresses innovating for the poor while promoting the idea of innovating around less resource use (Nocera, 2012; Rosca et al., 2016, 2018). Frugal innovation is the idea of innovating around constraints, but without sacrificing quality (Agarwal & Brem, 2012; Bhatti, 2012; Knorringa et al., 2016). Despite frugal innovation’s promises to provide affordable and needed product many examples in literature of frugal innovations are innovations that have filled gaps in services that are normally provided by the public sector (energy, water, electricity, health) and it is unclear whether these innovations are cheaper than the public infrastructure option (Annala et al., 2018; Howell et al., 2017; Hyvärinen et al., 2016; Levänen et al., 2015; Numminen & Lund, 2017). Focusing on the electricity sector, Sub-Saharan Africa has some of the lowest electrification rates in the world (Wolde-Rufael, 2005). 2014 data shows that an estimated 600 million people lack electricity access in sub-Saharan Africa (IEA, 2014). Due to the lack of access and difficulty in extending the grid, there has been a growing market for a myriad of off grid electricity options ranging from mini grids to solar home systems and small solar lanterns (Miller, 2009). Although many of these alternatives have been classified as frugal innovations (Levänen et al., 2015; Numminen & Lund, 2017), depending on the context, these alternatives might not necessarily be cheaper than grid particularly when considering growing energy demands as incomes rise (Numminen & Lund, 2017; Sovacool, 2011). The rise of the new middle class in Africa (Melber & Nordiska Afrikainstitutet, 2016) presents implications for frugal innovation, as rising income implies increased consumption. Concepts like ‘global consumerism’ (Ger & Belk, 1996) that posit that consumers in emerging markets will copy the consumption habits of developed market consumers, have implications when considering the SDGs and climate change. Global consumerism implies increasing consumption of goods and ultimately higher resource use (Madubansi & Shackleton, 2006; Myers & Kent, 2003; Sovacool, 2011). Therefore, whether small scale innovations like frugal innovations can provide both a more sustainable energy source and accommodate future energy demands in an affordable way is uncertain (Nocera, 2012). This paper aims to explore the role of frugal innovation in the energy sector with the issue of growing global consumption and the environmental burden this entails. The following research question is explored: Can frugal energy innovations contribute to meeting the future energy demands in sub-Saharan Africa? The issues of sustainability, frugality, consumption and future pathways are explored through a case illustration of a frugal innovation in the energy sector in Uganda The paper is structured as follows. First, in section 2 a literature review on frugal innovation, middle class consumers, and the electricity sector in sub-Saharan Africa is provided. Section 3 expands on the illustrative case in Uganda. The case is discussed in section 4 in relation to issues of frugality and future consumption. Finally, conclusions and future research directions are drawn in section 5.
140
Literature Review
Frugal Innovation The term frugal innovation was coined and evolved from several related and overlapping terms referring to innovation and technology for the Bottom of the Pyramid (BoP) and the process of innovating around constraints (Rao, 2013; M. Zeschky, Widenmayer, & Gassmann, 2011). Most frugal innovation literature can be divided into three categories. First, literature exploring how to define frugal innovation, theoretical underpinnings, and how frugal innovation can reach the BoP (Bhatti, 2012; Bhatti & Ventresca, 2013; Bhatti, Ramaswami Basu, Barron, & Ventresca, 2018; Bhatti et al., 2018; Ernst, Kahle, Dubiel, Prabhu, & Subramaniam, 2015; Pansera & Owen, 2015; Ravishankar, 2016; Tiwari, Fischer, & Kalogerakis, 2017; Weyrauch & Herstatt, 2017). Second, case studies of frugal innovation, particularly in the Indian/Asian context (Annala et al., 2018; Hyvärinen et al., 2016; Levänen et al., 2015; Peša, 2015; Radjou & Prabhu, 2014; Winterhalter et al., 2017). Third some literature has begun to explore more the adoption and diffusion side of frugal innovation, including how business models might be frugal (Hossain et al., 2016; Howell et al., 2017; Rosca et al., 2016; Winterhalter et al., 2017, 2017). Finally, more recently some authors have begun to explore the sustainability implications of frugal innovations (Levänen et al., 2015; Nocera, 2012; Rosca et al., 2018, 2018). Focusing on the first stream of literature, frugal innovation can be traced back to the Indian concept of Jugaad which refers to the idea of ‘hacking’ and making do from a bottom up approach was a starting point for frugal innovation (Brem & Wolfram, 2014). Literature on frugal innovation stresses the reduction of costs that can come through stripping away of unnecessary features, lower resource use or utilizing new technology (Radjou & Prabhu, 2014; Rao, 2013; Tiwari et al., 2014; Tiwari & Herstatt, 2012; Zeschky et al., 2014). Although some frugal innovation/BoP literature criticizes companies reaching the poor with so called low cost innovations (Karnani, 2007, 2009; Meagher, 2018), the criticism is primarily focused on how companies are not reaching the very poor, how the products being offered may do more harm than good, and finally how frugal innovations may overlook the informal sector and the role of local producers. Some work has explored the inclusiveness of frugal innovation and whether frugal innovations have the potential to include poor consumers and producers (Nari Kahle et al., 2013; Papaioannou, 2014). Finally, in a paper by (Rao, 2013), the idea of how frugal innovations could be disruptive and ultimately contribute to sustainable development is explored. Disruptive innovation/technology implies creating new markets or changing existing institutions (Christensen, 2011). However, no literature has yet looked at whether particularly frugal innovations that are filling gaps due to institutional constraints are actually a cheaper or more efficient alternative for low income consumers compared to the traditional large scale infrastructure option. Looking at the frugal innovation research that focus on case studies some themes can be identified. First, the majority of case examples of frugal innovations cited are coming from the health sector (Hossain, 2017; Pisoni et al., 2018). Additionally, many of the examples of frugal innovation in current literature reuse the same case studies. While frugal innovation literature stresses the reduction in costs and often resource use (Hossain, 2018), the examples cited are cheaper only when compared to the existing alternative.

141
Focusing on cases from the energy sector, Table 21 highlights some of the examples of cited frugal energy innovations and the previously used alternative they the innovation replaced. Considering costs when compared to the existing alternative many of these examples are cheaper but represent small scale alternatives that may not be cheaper on a larger scale (Nocera, 2012; Numminen & Lund, 2017). For example, SELCO provides electricity through a variety of small scale solar products. Their pay as you go model makes the energy more affordable than purchasing products up front. However, when compared to a functioning electricity grid, the per kWh costs are likely higher (Murphy et al., 2014; Nocera, 2012). With the exception of the Mitticool fridge the cases highlighted in the following table are not necessarily cheaper than the infrastructure option. While the cases do often provide a better alternative to the previous used energy source they can also be considered ‘stop gap’ solutions to a large scale public infrastructure option that would potentially better accommodate future energy demand. Numminen & Lund, (2017) discuss some of the cited frugal energy innovations and come up with a framework to approach frugal energy innovations. While they do not take a systems perspective on frugal innovation, they do highlight the need to look at use patterns of energy and the environmental sustainability of the resources used in the products. Table 21: Summary of common frugal energy innovations from literature
Case Type Description Replacement Literature
Husk Power Systems Product Micro grid rice husk power
Diesel generator, kerosene lantern, batteries
(Levänen et al., 2015)
SELCO Product/business model
Through a mostly pay as you go model, provides small solar products
Diesel generator, kerosene lantern, batteries
(Levänen et al., 2015)
Boond LTD Product/business model
Small scale renewable energy products
Diesel generator, kerosene lantern, batteries
(Numminen & Lund, 2017; Urpelainen & Yoon, 2016)
Mitticool Product Fridge that does not require electricity
Without electricity access no food storage
(Hossain, 2017, 2018; Rao, 2013b; Simula et al., 2015)
Clean cook stove alternatives (various)
Product Cook stoves that do not require charcoal or firewood
Charcoal or firewood, open cooking
(Numminen & Lund, 2017; Peša, 2017)
Discussions of frugal innovation in relation to the Sustainable Development Goals and sustainability issues is a more recent stream within frugal innovation literature. Several authors have explored the implications of innovating around constraints and how this might be a way to achieve sustainable development goals (Levänen et al., 2015; Nocera, 2012; Rosca et al., 2018). The link between sustainability and frugal innovation is mostly due to the implied lower resource use in the innovation process for frugal innovation (Rosca et al., 2018). However, lower resource use and lower costs (in other words higher efficiency) could also result in an increase in demand (Alcott, 2008).

142
Overall, existing frugal innovation literature tends to focus on the technology and design process as a means to reduce costs and resource use (Bhatti et al., 2018; Brem & Wolfram, 2014; Radjou & Prabhu, 2014; Tiwari et al., 2017; M. B. Zeschky et al., 2014). There is minimal literature looking at the consumer side of frugal innovation or an in depth analysis of the frugality of commonly cited frugal innovations. Additionally, since many frugal innovations are small scale and more of ‘stop gap’ solutions replacing public infrastructure, a better understanding of how these innovations can be made more frugal from a systems perspective is required. Finally, an understanding the role of rising income in relation to frugal innovation is relevant as higher incomes result in increased demand for services like energy.
New Middle Class Consumption While Prahalad’s (2005) work helped spark the shift towards viewing the low income population in developing countries as potential consumers and an unreached market segment, subsequent work criticized his bold claim that this demographic could be easily reached through a business approach (Karnani, 2007, 2009; Meagher, 2018). One of the criticisms centered on whether the group being reached through business intervention is actually reaching the poorest (Crabtree, Copenhagen Business School. CBS, Institut for Interkulturel Kommunikation og Ledelse. CBDS, & Department of Intercultural Communication and Management. ICM, 2007; Hahn, 2012; Karnani, 2007, 2009; Kolk et al., 2014). Increasingly, consumers reached by businesses in emerging markets would be more aptly classified as middle class. Discussion of middle class consumers in emerging markets and their role in economic development was first generated by the growing middle class in China and India (Easterly, 2001; Guarín & Knorringa, 2014; Kharas, 2010; Ravallion, 2010). The growing ‘new’ middle class has received increasing attention from various perspectives. First, much of the literature focuses on how to both quantitatively and qualitatively define this group and whether there should be different cut off points for different regions (A. V. Banerjee & Duflo, 2008; Birdsall, 2015; Kharas, 2010; Melber & Nordiska Afrikainstitutet, 2016; Shimeles & Ncube, 2015; Thurlow et al., 2015; Wietzke & Sumner, 2018). Second, increasingly literature has shifted focus from middle class consumers in Asia to sub-Saharan Africa (Cheeseman, 2015b; Chikweche & Fletcher, 2014a; Kodila-Tedika et al., 2016; Melber & Nordiska Afrikainstitutet, 2016). Finally, a newer area is how to reach this demographic and the implications for politics and business (Cheeseman, 2015; Chikweche & Fletcher, 2014; Wietzke & Sumner, 2018). Chikweche and Fletcher, 2014 explored the purchasing decisions of the ‘Middle of the Pyramid’ (MoP) in several sub-Saharan African countries. Their work exposed the heterogeneity of middle class consumers from a more qualitative perspective and looked at what are key purchase influencers for this group. Besides income and spending characteristics, new middle class consumers in sub-Saharan Africa are more likely to have formal employment, higher levels of education and home ownership. Chikweche also found that this new group had access to healthcare, were smartphone owners, and either owned or desired luxury cars. There was an importance for aesthetics which were in part determined by peer and social networks. While there is limited work exploring the new middle class consumption in sub-Saharan Africa, there is some work in other middle income economies looking at consumption patterns of middle class consumers. There are several related theories that consider how people consume based on their income levels and social status (Ger & Belk, 1996; Ordabayeva & Chandon, 2011; Üstüner & Holt, 2010). Veblen, (1899) put forth ‘trickle down’ theory or the idea that

143
the wealthy use expensive goods as pecuniary symbols which eventually trickles down the class hierarchy. Other work since then extended trickle-down theory to a global scale, theorizing that with the rise of neoliberalism and the framing of the western way of life being better, consumers in less industrialized countries model their consumption behavior after the middle class in developed countries rather than the middle or upper class in their own countries (Üstüner & Holt, 2010). Similar patterns were shown among the new elite in post-colonial Zimbabwe, where this new group would copy the patterns of the white and foreign population in Zimbabwe (Belk, 2000). Other authors have further extended these ideas by looking at the effects of Coca Cola as a symbol of status consumption in developing countries and the idea of global consumerism (Ger & Belk, 1996). Finally, Ordabayeva & Chandon, (2011) took the status or ‘conspicuous’ consumption a step further by investigating the effects of equality in a society on conspicuous consumption. Moving beyond status consumption, the question of the role of rising incomes in emerging markets and sustainable consumption becomes pertinent. Work on global consumerism, and whether consumers in least industrialized nations will copy western consumption patterns presents a dilemma for sustainability. Evidence shows that with rising levels of new middle class consumers there has also been increased demand for products like meat and cars (Myers & Kent, 2003). Globally car ownership increased by 89% from 1999-2000 with most growth in countries like India and China. Looking at the energy sector, differences between income levels and energy consumption are also visible. Those in the low income group merely have subsistence energy use, middle income move to more informational uses of energy, and finally the highest income have more energy consumption but for luxurious uses like heating of a swimming pool for example (Sovacool, 2011). Additionally, as energy prices decrease, consumption increases. These trends are potentially problematic when put together with the rising middle class in sub-Saharan Africa from a sustainability perspective (Lee, 2013; Madubansi & Shackleton, 2006).
Electricity in Africa In addition to having the lowest electrification rates in the world, sub-Saharan Africa also has low development indicators such as GDP/capita and human development index (Wolde-Rufael, 2005). In the last more than a decade, some African governments have sought to improve electricity access through a combination of institutional reforms such as the unbundling of the electricity sector, and policy such as renewable energy feed in tariffs that target increasing investment in electricity generation (Karekezi & Kimani, 2004; Martinot et al., 2002; Mawejje et al., 2012; Meyer et al., 2018b; Suberu et al., 2013). With some of the highest solar irradiation values in the world, sub-Saharan Africa presents an ideal region to utilize solar power. However, expanding electricity access is in Africa is challenging for a number of reasons (Ahlborg & Hammar, 2014). First, in spite of increased foreign investment in infrastructure projects, most governments in sub-Saharan Africa lack the finance and coordinated institutions to make large scale options such as grid extension or the creation of new power plants. Secondly, off grid options carry their own set of challenges. Particularly, low willingness to pay and limited expertise of technical systems are barriers in undeveloped rural areas where the need for electricity is high (Martinot et al., 2002; Meyer et al., 2018b). Besides the lack of access to the grid particularly in rural areas, there is a large rural population in many African countries (for example Kenya) that has grid access but is not connected due to
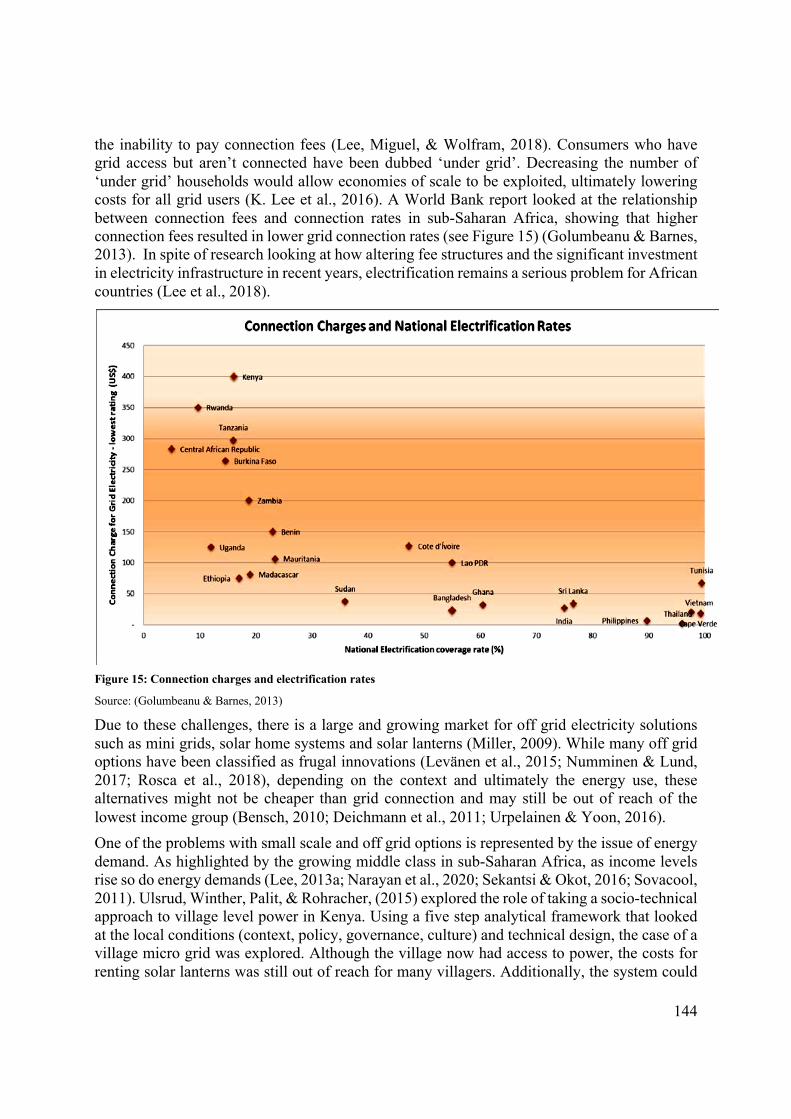
144
the inability to pay connection fees (Lee, Miguel, & Wolfram, 2018). Consumers who have grid access but aren’t connected have been dubbed ‘under grid’. Decreasing the number of ‘under grid’ households would allow economies of scale to be exploited, ultimately lowering costs for all grid users (K. Lee et al., 2016). A World Bank report looked at the relationship between connection fees and connection rates in sub-Saharan Africa, showing that higher connection fees resulted in lower grid connection rates (see Figure 15) (Golumbeanu & Barnes, 2013). In spite of research looking at how altering fee structures and the significant investment in electricity infrastructure in recent years, electrification remains a serious problem for African countries (Lee et al., 2018).
Figure 15: Connection charges and electrification rates
Source: (Golumbeanu & Barnes, 2013)
Due to these challenges, there is a large and growing market for off grid electricity solutions such as mini grids, solar home systems and solar lanterns (Miller, 2009). While many off grid options have been classified as frugal innovations (Levänen et al., 2015; Numminen & Lund, 2017; Rosca et al., 2018), depending on the context and ultimately the energy use, these alternatives might not be cheaper than grid connection and may still be out of reach of the lowest income group (Bensch, 2010; Deichmann et al., 2011; Urpelainen & Yoon, 2016). One of the problems with small scale and off grid options is represented by the issue of energy demand. As highlighted by the growing middle class in sub-Saharan Africa, as income levels rise so do energy demands (Lee, 2013a; Narayan et al., 2020; Sekantsi & Okot, 2016; Sovacool, 2011). Ulsrud, Winther, Palit, & Rohracher, (2015) explored the role of taking a socio-technical approach to village level power in Kenya. Using a five step analytical framework that looked at the local conditions (context, policy, governance, culture) and technical design, the case of a village micro grid was explored. Although the village now had access to power, the costs for renting solar lanterns was still out of reach for many villagers. Additionally, the system could

145
not support important energy needs like a fridge for medicine or improved water supply. These energy needs may not be able to be met by small scale electrification alternatives both from a technology and affordability perspective. Pico or mini grids are often promoted as a more cost effective way to electrify rural areas. However, existing studies showed mixed results in terms of how well these solutions provide reliable electricity access and can be affordable for the poorest consumers (Moner-Girona et al., 2018; Narayan et al., 2020; Numminen et al., 2018). Narayan et al., 2020 also highlights some of the challenges associated with different electrification options: grid extension, micro grids, solar home systems and pico solar (i.e. solar lanterns). As households move up the electrification ladder options like solar home systems and solar lanterns no longer because economically feasible.
Case Illustration
Background Electricity Sector in Uganda Uganda’s electricity sector provides an example of power sector reforms that many sub-Saharan African countries have enacted over the last two decades to address insufficient electricity supply (Meyer et al., 2018b). Uganda is a primary recipient of foreign aid and investment with many initiatives focused on improving electricity access. Over the last more than two decades Uganda has targeted restructuring its electricity sector to address low electrification rates and a poorly functioning grid (Meyer et al., 2018b). Currently, the majority of the population utilizes biomass energy (from firewood) and some combination of kerosene or battery powered lamps although electricity access has increased (Kaijuka, 2007; Lee, 2013). Uganda’s limited electricity grid is primarily powered through several large hydro power plants on the Nile river and some diesel generated power plants (Kaijuka, 2007; Meyer et al., 2018b). A combination of measures were set up over the last two decades to address low electrification rates. In particular, the Rural Electrification Agency (REA) and Energy for Rural Transformation (ERT) were set up to tackle the very low rural electrification penetration. Over the ten period of 2013-2022 the goal is to achieve rural electrification access of 22% with the long term target of universal access by 2040. Additionally, the strategy included the elimination of kerosene lamps by 2030 (Government of Uganda, 2012). Uganda’s situation is particularly challenging with the expected fourfold increase in energy demand by 2030 (Renewable Energy Investment Guide, 2012). Table 22 summarizes some of the measures that Uganda has taken to address its electricity shortage. Table 22: Summary of Uganda’s Energy Programs
Program Focus
Renewable Energy Feed in Tariffs (Electricity Regulatory Agency)
0.5-20 MW renewable power generation (tariffs & subsidies)
Energy for Rural Transformation World Bank funded project (two phases soon to be three) focused on stimulating rural electrification & energy efficiency
Emerging Africa Infrastructure Fund Funds infrastructure projects in Africa
GET Fit Uganda Supplements existing tariffs for hydro, biomass, and bagasse power plants from 0.5-20 MW

146
Photovoltaic Project for Rural Transformation Small scale solar for rural electrification
Rural Electrification Agency Branch of Ministry of Energy that is focused on grid extension, small scale renewables, and independent grids to increase rural electricity access
Source: (Government of Uganda, 2007; Meyer et al., 2018; Renewable Energy Investment Guide, 2012; Rural Electrification Agency, 2012; Sengendo, 2001)
Uganda’s electricity market structure underwent electricity reforms during the late 1990s along with many African countries. The reforms aimed to unbundle electricity generation, transmission and distribution and achieve more competition in the sector (Mawejje et al., 2012; Meyer et al., 2018b). The Electricity Act of 1999 established the Electricity Regulatory Agency (ERA) which controls tariffs, issues licenses for generation, transmission and distribution; provides standards and advises the Ministry of Energy (Electricity Regulatory Agency, 2014; The Electricity Act, 1999). Besides REA and the ERT program, the Electricity Disputes Tribunal handles all electricity disputes either from consumers or public bodies (The Electricity Act, 1999). The actual electricity market structure is overseen by ERA and comprised of separate entities for generation (Uganda Electricity Generation Company Ltd), distribution (Uganda Electricity Distribution Company Ltd) and transmission (Uganda Electricity Transmission Company Ltd) of electricity. Figure 16 shows the electricity market structure in Uganda. Although there are other private distribution companies Umeme controls most of the market, however there has been an increase in competition since unbundling of the sector (Mawejje et al., 2012; Meyer et al., 2018).

147
Source: Adapted from (Mawejje et al., 2012)
Uganda’s efforts to increase electrification have been moderately successful. Currently, around 20% of the population has electricity access through the grid but there are still significant problems with load shedding and unreliability of the electricity supply. As of 2015, six hydro plants supply 70% of Uganda’s power capacity (Meyer et al., 2018). In 2018, in an effort to increase connection rates in the country, the government made connection fees free for household use43. Table 23 shows the 2019 connection fees for Umeme and the latest electricity tariffs for domestic use (Q3 2019 new rates). The old connection fees are also shown which highlights how for low income consumers the new connection fee particularly in rural areas can be a barrier to electricity access.
43 https://www.newvision.co.ug/new_vision/news/1470676/free-connection-policy-bring-300-users-grid-annually
Figure 16: Uganda's Electricity Market Structure

148
Table 23: Electricity tariffs (2019) and old connection fees for Umeme
Type of charge Fee in UGX Fee in €
First 15kWh/month of use 250/kWh 0.06
Above 15kWh/month 755.0/kWh 0.19
Fixed monthly charge 3,360 0.81
Inspection Fees 100,000 24.21
New connection: No pole
One pole
98,000 23.73
326,000 78.93
Source: (Umeme, 2019)
Case Illustration and Sample Description A case study of solar electrification in Uganda is described and compared with the national grid tariffs. The case is a company that offers solar home systems through a fee for service model in western Uganda, operating as an electricity provider. After receiving initial investment and support from a Dutch NGO that sets up solar electricity businesses in sub-Saharan Africa, a solar electricity company began ‘leasing’ solar home systems to rural customers in western Uganda. First, the user pays a connection fee depending on the level of electricity they require. Second, the user pays a monthly fee for the solar electricity provision. All costs include maintenance and installation. In most of the areas that the company operates in, there is no grid access. However, in a few villages where the grid became accessible many consumers still opted for solar since it was deemed to be more dependable. Additionally, many consumers who were already familiar with solar products chose products from the described case due to it being a Dutch affiliated company that used German designed solar products. Consumers cited concern over Chinese products failing quickly44. Data was collected on small business owners who had solar home systems in three of the counties that the solar company operates in. The sample size of small business owners and survey area is summarized below. Of the 35 villages only 7 had grid access. These business owners were representative of a typical Solar Provider customer as the majority of Solar Provider customers are small business owners that mostly use electricity for business use and personal lighting.
44 Qualitative data from consumer interviews collected May 2014.

149
Table 24: Summary of survey population
Businesses with Solar Provider SHS 64
Villages 35
Districts 3
Solar home systems can be viewed as frugal when compared to existing solutions in rural villages: kerosene lanterns, car batteries, or diesel generators. Additionally, some literature cites solar home systems as examples of frugal innovations (Levänen et al., 2015; Numminen & Lund, 2017). In this case, the unique fee for service business model also allows the up-front costs of solar home systems to be reduced by spreading out the costs through monthly fees. The fee structure for the company is given in Table 25. The fees also include subsidies from a World Bank program promoting solar in Uganda. Table 25: Fee structure for solar home systems
Services Service level 1
Service level 2
Service level 3
Service level 4 Service level 4 +
Technical specification
80W Solar panel + 90 AH battery
160W Solar panels + 90AH battery
160W Solar panels + 150 AH battery
240W Solar panels + 240AH battery
320W Solar panels + 300AH battery
Package 3 lighting points, socket for phone charging, -all wiring, accessories and regulator
3 lighting points, socket for phone charging, supports a 14 inch Television, -all wiring, accessories and regulator
4 lighting points, socket for phone charging, supports a 14-17 inch Television,
-all wiring, accessories and regulator
-5 lighting points, -socket for phone charging, -supports a 14-21 inch Television,
-all wiring, accessories and regulator
6 lighting points, socket for phone charging, supports a 21 inch Television, -all wiring, accessories and 30Amp Regulator
Connection fees
~47€ ~57€ ~69€ ~81€ ~91€
Service fees ~6€ ~8€ ~11€ ~14€ ~16€
Source: internal company documents. Fees were converted to euros using August 2019 exchange rates: 1€=4130UGX
Looking at the characteristics of frugal innovation as the outcome of resource, institutional and cost constraints the cases can be evaluated in terms of its fit as a frugal innovation. Table 26 looks at the case in terms of resource, institutional and cost constraints.

150
Table 26: Solar Home Systems as a frugal innovation
Constraint Analysis
Resource Both cases use solar technology which is generally manufactured in China and requires rare earth resources. Resource use could be considered lower when compared to alternatives: diesel and kerosene.
Institutional Off grid solar electrification is a result of a poorly functioning and lacking grid.
Cost Costs are kept low through the business model. Consumers pay a monthly fee that helps distribute costs. Frugality is achieved through the business model. When compared to the alternative that would provide similar power (diesel generator) solar is cheaper per unit.
Like many frugal innovations solar home systems provided in the case example do offer a cheaper solution than traditional sources. Table 27 shows the average electricity expenditures for the surveyed customers before and after receiving solar electricity. As prior literature showed electricity costs with solar are lower than traditional sources depending on the consumption level of the user (Bensch, 2010). However, on average customers in our sample had lower energy expenditures after receiving solar electricity. Lowered costs for the SHS came not only through the technology but through the business model that allowed the customer to pay in instalments. Regardless, the solution can still be viewed as cost inefficient on a kWh basis. If electricity demand increased in rural areas, small solar home systems would not be able to provide the required electricity demand. Table 27: Average energy expenditures before and after solar access
Energy expenditures per month prior to solar access
Energy expenditures per month after solar access
Total (€) 23.40 21.65
Std Dev. 32.25 12.09
Count 59 64
Note that the difference in counts is due to some customers not having any electricity use (or reported use) before gaining access to solar
Looking at the cost comparison between solar home systems shows that ultimately the grid is significantly cheaper, particularly at lower electricity demand. Table 28 shows the cost comparison between Umeme (the grid) and the case fees. For 18kWh per month, which corresponds to the system 4+, there is a difference in fees of about 12€ between grid connection and solar.
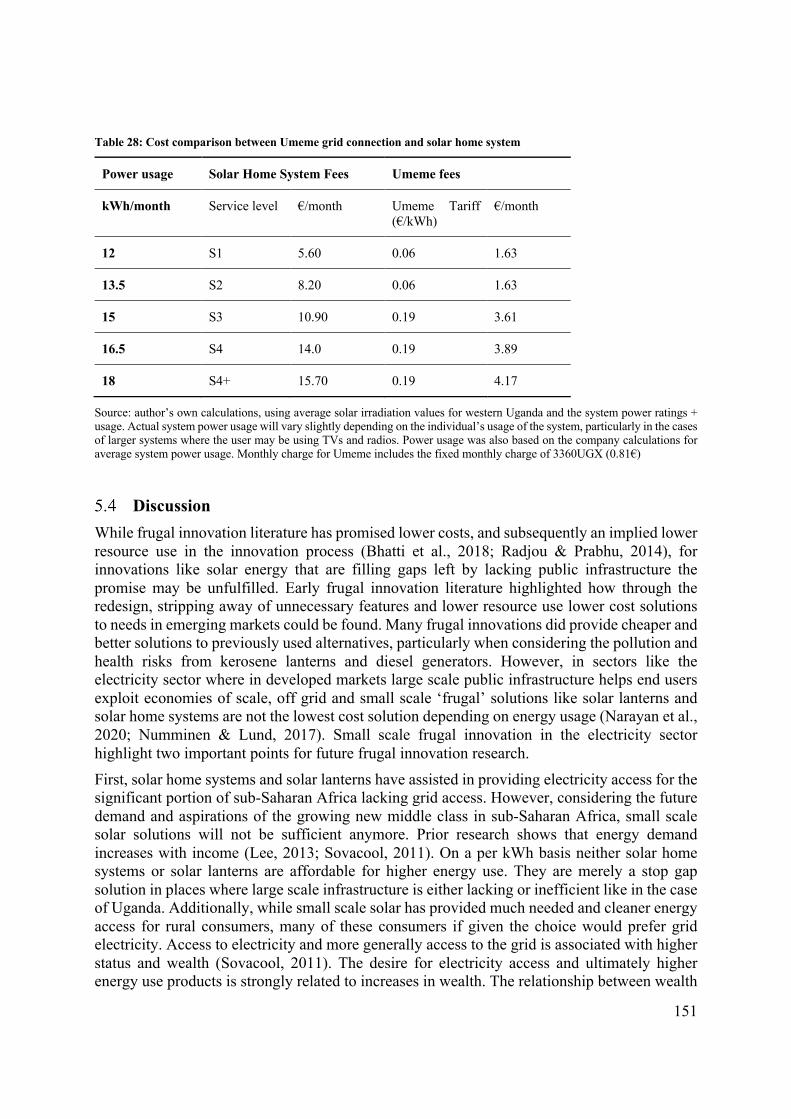
151
Table 28: Cost comparison between Umeme grid connection and solar home system
Power usage Solar Home System Fees Umeme fees
kWh/month Service level €/month Umeme Tariff (€/kWh)
€/month
12 S1 5.60 0.06 1.63
13.5 S2 8.20 0.06 1.63
15 S3 10.90 0.19 3.61
16.5 S4 14.0 0.19 3.89
18 S4+ 15.70 0.19 4.17
Source: author’s own calculations, using average solar irradiation values for western Uganda and the system power ratings + usage. Actual system power usage will vary slightly depending on the individual’s usage of the system, particularly in the cases of larger systems where the user may be using TVs and radios. Power usage was also based on the company calculations for average system power usage. Monthly charge for Umeme includes the fixed monthly charge of 3360UGX (0.81€)
Discussion While frugal innovation literature has promised lower costs, and subsequently an implied lower resource use in the innovation process (Bhatti et al., 2018; Radjou & Prabhu, 2014), for innovations like solar energy that are filling gaps left by lacking public infrastructure the promise may be unfulfilled. Early frugal innovation literature highlighted how through the redesign, stripping away of unnecessary features and lower resource use lower cost solutions to needs in emerging markets could be found. Many frugal innovations did provide cheaper and better solutions to previously used alternatives, particularly when considering the pollution and health risks from kerosene lanterns and diesel generators. However, in sectors like the electricity sector where in developed markets large scale public infrastructure helps end users exploit economies of scale, off grid and small scale ‘frugal’ solutions like solar lanterns and solar home systems are not the lowest cost solution depending on energy usage (Narayan et al., 2020; Numminen & Lund, 2017). Small scale frugal innovation in the electricity sector highlight two important points for future frugal innovation research. First, solar home systems and solar lanterns have assisted in providing electricity access for the significant portion of sub-Saharan Africa lacking grid access. However, considering the future demand and aspirations of the growing new middle class in sub-Saharan Africa, small scale solar solutions will not be sufficient anymore. Prior research shows that energy demand increases with income (Lee, 2013; Sovacool, 2011). On a per kWh basis neither solar home systems or solar lanterns are affordable for higher energy use. They are merely a stop gap solution in places where large scale infrastructure is either lacking or inefficient like in the case of Uganda. Additionally, while small scale solar has provided much needed and cleaner energy access for rural consumers, many of these consumers if given the choice would prefer grid electricity. Access to electricity and more generally access to the grid is associated with higher status and wealth (Sovacool, 2011). The desire for electricity access and ultimately higher energy use products is strongly related to increases in wealth. The relationship between wealth

152
and consumption is particularly problematic when considering the rise of the new middle class in Africa. Second, solar home systems and solar lanterns show the need for a systems approach in frugal innovation thinking. The electricity sector in sub-Saharan Africa is complex due to the problem of future increases in demand (due to population growth and rising incomes), the lack of a proper functioning electricity grid and technical expertise in most countries that make policy constructions like feed in tariffs difficult, and finally the challenge of providing electricity in remote and sparsely populated areas (Deichmann et al., 2011; K. Lee et al., 2018; Meyer et al., 2018). In the current situation in countries like Uganda, off grid solutions easily fill a gap that is left by the lack of technical expertise and functioning grid and the remote nature of most of the population. However, small scale solutions are not a systems level solution. Frugal innovation as a concept provides a way to innovate around the cost, resource and institutional constraints inherent in most of sub-Saharan Africa but without considering the entire system that an innovation is operating in, frugal innovations will continue to be merely stop gap measures in the place of large scale public infrastructure or become part of new system level solutions that reduce the path dependency of large scale infrastructure. Therefore, frugal innovation should move beyond small product innovations and consider system level innovation. In case of the electricity sector this means more public private partnerships and technical solutions like mini-grids. Additionally, the role of policy innovations needs to be considered like feed-in-tariffs and subsidies for renewable energy. The role of frugal innovation in sustainable development is still a new and mostly unexplored area. While solar home systems and solar lanterns are more environmentally friendly solutions than kerosene lanterns and diesel generators, they overlook future demand which is particularly pressing with the rise of the middle class in Africa. In order to develop both cost effective, and sustainable solutions to problems like energy access a systems level approach is required. A systems approach to frugal innovation would allow the discussion to move beyond the technology central view of simply minimizing resources and costs through the design to an integrated approach that considers the actors (consumers and beneficiaries, government, business, etc.), the task (current and future demand, intended use), the structure (links with existing systems), and context (policy, culture). Actors within the system are more than just the end consumer of the product but could also be other electricity providers, beneficiaries of electricity. The task involves what the innovation would be used for which means considering current and future demand and the intended use. While many solar users in countries like Uganda only use electricity for light and phone charging, electricity needs will/should increase to higher value uses like computer use, fridge for food and medicine, etc. The structure involves considering how an innovation can be connected with existing systems. In the case of solar connections could be made with the existing grid but this requires enough technical expertise and a functioning grid that operates without high electricity losses through the system. Finally, consideration of the context is important since it influences pricing, the use and the potential connections that can be made. The pricing in the case of solar home systems in Uganda was possible in part due to World Bank subsidies for solar. Constructions like feed in tariffs are options due to government policy. While there is work taking a systems level approach to implementation of solutions like solar mini grids (Ulsrud et al., 2015) and others investigating the reliability and cost effectiveness of mini or pico grids (Narayan et al., 2020; Numminen et al., 2018), successful implementation of
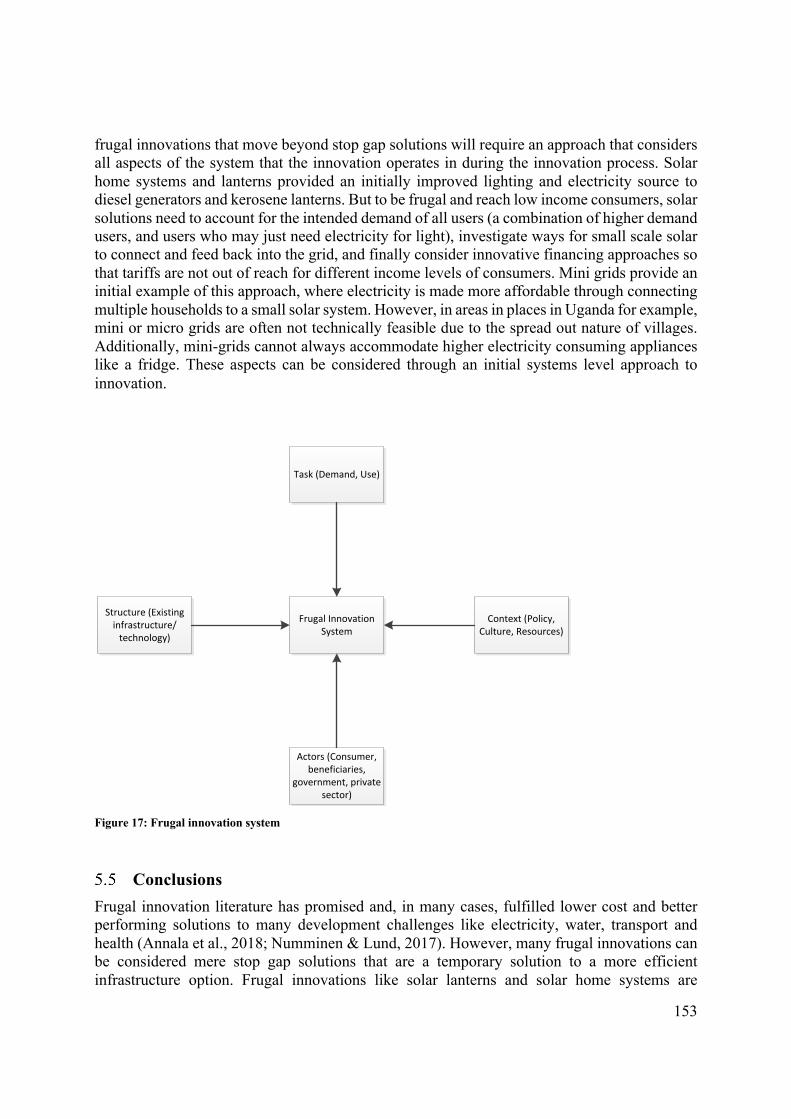
153
frugal innovations that move beyond stop gap solutions will require an approach that considers all aspects of the system that the innovation operates in during the innovation process. Solar home systems and lanterns provided an initially improved lighting and electricity source to diesel generators and kerosene lanterns. But to be frugal and reach low income consumers, solar solutions need to account for the intended demand of all users (a combination of higher demand users, and users who may just need electricity for light), investigate ways for small scale solar to connect and feed back into the grid, and finally consider innovative financing approaches so that tariffs are not out of reach for different income levels of consumers. Mini grids provide an initial example of this approach, where electricity is made more affordable through connecting multiple households to a small solar system. However, in areas in places in Uganda for example, mini or micro grids are often not technically feasible due to the spread out nature of villages. Additionally, mini-grids cannot always accommodate higher electricity consuming appliances like a fridge. These aspects can be considered through an initial systems level approach to innovation.
Figure 17: Frugal innovation system
Conclusions Frugal innovation literature has promised and, in many cases, fulfilled lower cost and better performing solutions to many development challenges like electricity, water, transport and health (Annala et al., 2018; Numminen & Lund, 2017). However, many frugal innovations can be considered mere stop gap solutions that are a temporary solution to a more efficient infrastructure option. Frugal innovations like solar lanterns and solar home systems are
Frugal Innovation System
Actors (Consumer, beneficiaries,
government, private sector)
Context (Policy, Culture, Resources)
Task (Demand, Use)
Structure (Existing infrastructure/
technology)

154
examples of small scale stop gap solutions that provide many low income consumers with much needed electricity access. But on a larger scale small scale solar in its current form is not a cost effective solution nor does it address the growing energy needs in sub-Saharan Africa. The rise of the new middle class has implications beyond merely their potential in terms of purchasing power but also the increase in consumption. Copying western consumption patterns will not only result in an increase in demand for status products like electronics and cars, but also an increase in energy demand. Therefore, incorporating consideration for this increase in demand into frugal innovation design is important. Until frugal innovation takes a systems approach to innovation frugal innovation will remain small scale. Additionally, the illustrative case of solar electricity in Uganda highlights the future potential for frugal innovations to be cross sectoral. Electricity access has many spill over benefits for other sectors and development needs. Electricity at a health center could provide refrigeration for medicine or electricity can power water pumps or merely considering the balancing of electricity supply and demand in a village could result in a more efficient connection of small scale solar home systems. Unless frugal innovations can begin to connect sectors, they may remain small scale with limited longer term impact. Future research on frugal innovation should explore how a systems approach can be taken from the beginning of the design process. Frugal innovation should look beyond the mere simplification or use of new technology to lower costs but consider the context, task, and actors within the system the innovation is operating in. While frugal innovation as a design process has potential to lower resource use and contribute to the SDGs, broadening the perspective and in particular considering future demand may maximize frugal innovation’s sustainability impact.

155
References Agarwal, N., & Brem, A. (2012). Frugal and reverse innovation—Literature overview and case
study insights from a German MNC in India and China. 1–11. https://doi.org/10.1109/ICE.2012.6297683
Ahlborg, H., & Hammar, L. (2014). Drivers and barriers to rural electrification in Tanzania and Mozambique – Grid-extension, off-grid, and renewable energy technologies. Renewable Energy, 61, 117–124. https://doi.org/10.1016/j.renene.2012.09.057
Alcott, B. (2008). The sufficiency strategy: Would rich-world frugality lower environmental impact? Ecological Economics, 64(4), 770–786. https://doi.org/10.1016/j.ecolecon.2007.04.015
Annala, L., Sarin, A., & Green, J. L. (2018). Co-production of frugal innovation: Case of low cost reverse osmosis water filters in India. Journal of Cleaner Production, 171, S110–S118. https://doi.org/10.1016/j.jclepro.2016.07.065
Banerjee, A. V., & Duflo, E. (2008). What is Middle Class about the Middle Classes around the World? Journal of Economic Perspectives, 22(2), 3–28. https://doi.org/10.1257/jep.22.2.3
Belk, R. (2000). Consumption patterns of the new elite in Zimbabwe. Bensch, G., Peters, Jörg. (2010). Socio-economic impacts of rural electrification in Rwanda an
ex-ante assessment of GTZ activities. RWI. Bhatti, Y. A. (2012). What is Frugal, What is Innovation? Towards a Theory of Frugal
Innovation. SSRN Electronic Journal. https://doi.org/10.2139/ssrn.2005910 Bhatti, Y. A., & Ventresca, M. (2013). How Can ‘Frugal Innovation’ Be Conceptualized? SSRN
Electronic Journal. https://doi.org/10.2139/ssrn.2203552 Bhatti, Y., Ramaswami Basu, R., Barron, D., & Ventresca, M. J. (2018). Frugal Innovation:
Models, Means, Methods (1st ed.). Cambridge University Press. https://doi.org/10.1017/9781316986783
Birdsall, N. (2015). Does the Rise of the Middle Class Lock in Good Government in the Developing World? The European Journal of Development Research, 27(2), 217–229. https://doi.org/10.1057/ejdr.2015.6
Brem, A., & Wolfram, P. (2014). Research and development from the bottom up—Introduction of terminologies for new product development in emerging markets. Journal of Innovation and Entrepreneurship, 3(1), 9. https://doi.org/10.1186/2192-5372-3-9
Cheeseman, N. (2015). “No Bourgeoisie, No Democracy”? The Political Attitudes of the Kenyan Middle Class: Democracy in the African Middle Class. Journal of International Development, 27(5), 647–664. https://doi.org/10.1002/jid.3057
Chikweche, T., & Fletcher, R. (2014). “Rise of the middle of the pyramid in Africa”: Theoretical and practical realities for understanding middle class consumer purchase decision making. Journal of Consumer Marketing, 31(1), 27–38. https://doi.org/10.1108/JCM-10-2013-0729

156
Christensen, C. M. (2011). The innovator’s dilemma: The revolutionary book that will change the way you do business ; [with a new preface] (1. Harper Business paperback). Harper Business.
Deichmann, U., Meisner, C., Murray, S., & Wheeler, D. (2011). The economics of renewable energy expansion in rural Sub-Saharan Africa. Energy Policy, 39(1), 215–227. https://doi.org/10.1016/j.enpol.2010.09.034
Easterly, W. (2001). The Middle Class Consensus and Economic Development. Journal of Economic Growth, 6(4), 317–335. https://doi.org/10.1023/A:1012786330095
Electricity Regulatory Agency. (2014). Functions of ERA. Electricity Regulatory Agency. http://www.era.or.ug/index.php/about-us/2013-10-15-15-57-40/functions-of-era
Ernst, H., Kahle, H. N., Dubiel, A., Prabhu, J., & Subramaniam, M. (2015). The Antecedents and Consequences of Affordable Value Innovations for Emerging Markets: Affordable Value Innovations for Emerging Markets. Journal of Product Innovation Management, 32(1), 65–79. https://doi.org/10.1111/jpim.12171
Ger, G., & Belk, R. W. (1996). I’d like to buy the world a coke: Consumptionscapes of the “less affluent world.” Journal of Consumer Policy, 19(3), 271–304. https://doi.org/10.1007/BF00411411
Golumbeanu, R., & Barnes, D. (2013). Connection Charges and Electricity Access in Sub-Saharan Africa. The World Bank. http://elibrary.worldbank.org/doi/book/10.1596/1813-9450-6511
The Electricity Act, Pub. L. No. 42, 6 Act (1999). http://www.opm.go.ug/assets/media/resources/145/ELECTRICITY%20ACT%201999.pdf
Government of Uganda. (2007). The Renewable Energy Policy for Uganda. Rural Electrification Agency. http://www.rea.or.ug/index.php/policies-and-legislation
Government of Uganda. (2012). Rural Electrification Strategy and Plan 2013-2022 [Government report]. Ministry of Energy and Mineral Development. http://rea.or.ug/phocadownload/rural%20electrification%20strategy%20and%20plan%202013-2022.pdf
Guarín, A., & Knorringa, P. (2014). New Middle-Class Consumers in Rising Powers: Responsible Consumption and Private Standards. Oxford Development Studies, 42(2), 151–171. https://doi.org/10.1080/13600818.2013.864757
Hossain, M. (2017). Mapping the frugal innovation phenomenon. Technology in Society, 51, 199–208. https://doi.org/10.1016/j.techsoc.2017.09.006
Hossain, M. (2018). Frugal innovation: A review and research agenda. Journal of Cleaner Production, 182, 926–936. https://doi.org/10.1016/j.jclepro.2018.02.091
Hossain, M., Simula, H., & Halme, M. (2016). Can frugal go global? Diffusion patterns of frugal innovations. Technology in Society, 46, 132–139. https://doi.org/10.1016/j.techsoc.2016.04.005

157
Howell, R., van Beers, C., & Doorn, N. (2017). Value capture and value creation: The role of information technology in business models for frugal innovations in Africa. Technological Forecasting and Social Change. https://doi.org/10.1016/j.techfore.2017.09.030
Hyvärinen, A., Keskinen, M., & Varis, O. (2016). Potential and Pitfalls of Frugal Innovation in the Water Sector: Insights from Tanzania to Global Value Chains. Sustainability, 8(9), 888. https://doi.org/10.3390/su8090888
IEA. (2014). Africa Energy Outlook: A focus on energy prospects in Sub-Saharan Africa. International Energy Agency IEA.
Kaijuka, E. (2007). GIS and rural electricity planning in Uganda. Journal of Cleaner Production, 15(2), 203–217. https://doi.org/10.1016/j.jclepro.2005.11.057
Karekezi, S., & Kimani, J. (2004). Have power sector reforms increased access to electricity among the poor in East Africa? Energy for Sustainable Development, 8(4), 10–25. https://doi.org/10.1016/S0973-0826(08)60510-4
Karnani, A. (2007). The Mirage of Marketing to the Bottom of the Pyramid: How the Private Sector Can Help Alleviate Poverty. California Management Review, 49(4), 90–111. https://doi.org/10.2307/41166407
Karnani, A. (2009). Romanticising the poor harms the poor. Journal of International Development, 21(1), 76–86. https://doi.org/10.1002/jid.1491
Kharas, H. (2010). The Emerging Middle Class in Developing Countries (OECD Development Centre Working Papers No. 285). https://doi.org/10.1787/5kmmp8lncrns-en
Knorringa, P., Peša, I., Leliveld, A., & van Beers, C. (2016). Frugal Innovation and Development: Aides or Adversaries? The European Journal of Development Research, 28(2), 143–153. https://doi.org/10.1057/ejdr.2016.3
Kodila-Tedika, O., Asongu, S. A., & Kayembe, J. M. (2016). Middle Class in Africa: Determinants and Consequences. International Economic Journal, 30(4), 527–549. https://doi.org/10.1080/10168737.2016.1204340
Lee, K., Brewer, E., Christiano, C., Meyo, F., Miguel, E., Podolsky, M., Rosa, J., & Wolfram, C. (2016). Electrification for “Under Grid” households in Rural Kenya. Development Engineering, 1, 26–35. https://doi.org/10.1016/j.deveng.2015.12.001
Lee, K., Miguel, E., & Wolfram, C. (2018). Experimental evidence on the economics of rural electrification. University of California, Berkeley, NBER, and Energy Institute at the University of Chicago, Http://Www. Catherine-Wolfram. Com/Uploads/8/2/2/7/82274768/Repp-Jpe_2018-01-31-Final. Pdf.
Lee, L. Y.-T. (2013a). Household energy mix in Uganda. Energy Economics, 39, 252–261. https://doi.org/10.1016/j.eneco.2013.05.010
Lee, L. Y.-T. (2013b). Household energy mix in Uganda. Energy Economics, 39, 252–261. https://doi.org/10.1016/j.eneco.2013.05.010

158
Levänen, J., Hossain, M., Lyytinen, T., Hyvärinen, A., Numminen, S., & Halme, M. (2015). Implications of Frugal Innovations on Sustainable Development: Evaluating Water and Energy Innovations. Sustainability, 8(1), 4. https://doi.org/10.3390/su8010004
Madubansi, M., & Shackleton, C. M. (2006). Changing energy profiles and consumption patterns following electrification in five rural villages, South Africa. Energy Policy, 34(18), 4081–4092. https://doi.org/10.1016/j.enpol.2005.10.011
Martinot, E., Chaurey, A., Lew, D., Moreira, J. R., & Wamukonya, N. (2002). RENEWABLE ENERGY MARKETS IN DEVELOPING COUNTRIES*. Annual Review of Energy and the Environment, 27(1), 309–348. https://doi.org/10.1146/annurev.energy.27.122001.083444
Mawejje, J., Munyambonera, E., & Bategeka, L. (2012). Uganda’s Electricity Sector Reforms and Institutional Restructuring. Economic Policy Research Centre Research Series, 89. http://ideas.repec.org/p/ags/eprcrs/150239.html
Meagher, K. (2018). Cannibalizing the Informal Economy: Frugal Innovation and Economic Inclusion in Africa. The European Journal of Development Research, 30(1), 17–33. https://doi.org/10.1057/s41287-017-0113-4
Melber, H., & Nordiska Afrikainstitutet (Eds.). (2016). The rise of Africa’s middle class: Myths, realities and critical engagements. Zed Books.
Meyer, R., Eberhard, A., & Gratwick, K. (2018). Uganda’s power sector reform: There and back again? Energy for Sustainable Development, 43, 75–89. https://doi.org/10.1016/j.esd.2017.11.001
Miller, D. (2009). Selling solar: The diffusion of renewable energy in emerging markets. Earthscan.
Moner-Girona, M., Solano-Peralta, M., Lazopoulou, M., Ackom, E. K., Vallve, X., & Szabó, S. (2018). Electrification of Sub-Saharan Africa through PV/hybrid mini-grids: Reducing the gap between current business models and on-site experience. Renewable and Sustainable Energy Reviews, 91, 1148–1161. https://doi.org/10.1016/j.rser.2018.04.018
Murphy, P. M., Twaha, S., & Murphy, I. S. (2014). Analysis of the cost of reliable electricity: A new method for analyzing grid connected solar, diesel and hybrid distributed electricity systems considering an unreliable electric grid, with examples in Uganda. Energy, 66, 523–534. https://doi.org/10.1016/j.energy.2014.01.020
Myers, N., & Kent, J. (2003). New consumers: The influence of affluence on the environment. Proceedings of the National Academy of Sciences, 100(8), 4963–4968. https://doi.org/10.1073/pnas.0438061100
Narayan, N., Vega-Garita, V., Qin, Z., Popovic-Gerber, J., Bauer, P., & Zeman, M. (2020). The Long Road to Universal Electrification: A Critical Look at Present Pathways and Challenges. Energies, 13(3), 508. https://doi.org/10.3390/en13030508
Nari Kahle, H., Dubiel, A., Ernst, H., & Prabhu, J. (2013). The democratizing effects of frugal innovation: Implications for inclusive growth and state-building. Journal of Indian Business Research, 5(4), 220–234. https://doi.org/10.1108/JIBR-01-2013-0008

159
Nocera, D. G. (2012). Can We Progress from Solipsistic Science to Frugal Innovation? Daedalus, 141(3), 45–52. https://doi.org/10.1162/DAED_a_00160
Numminen, S., & Lund, P. D. (2017). Frugal energy innovations for developing countries - a framework: Frugal Energy Innovations for Developing Countries. Global Challenges, 1(1), 9–19. https://doi.org/10.1002/gch2.1012
Numminen, S., Lund, P. D., Yoon, S., & Urpelainen, J. (2018). Power availability and reliability of solar pico-grids in rural areas: A case study from northern India. Sustainable Energy Technologies and Assessments, 29, 147–154. https://doi.org/10.1016/j.seta.2018.08.005
Ordabayeva, N., & Chandon, P. (2011). Getting Ahead of the Joneses: When Equality Increases Conspicuous Consumption among Bottom-Tier Consumers. Journal of Consumer Research, 38(1), 27–41. https://doi.org/10.1086/658165
Pansera, M., & Owen, R. (2015). Framing resource-constrained innovation at the ‘bottom of the pyramid’: Insights from an ethnographic case study in rural Bangladesh. Technological Forecasting and Social Change, 92, 300–311. https://doi.org/10.1016/j.techfore.2014.10.004
Papaioannou, T. (2014). How inclusive can innovation and development be in the twenty-first century? Innovation and Development, 4(2), 187–202. https://doi.org/10.1080/2157930X.2014.921355
Peša, I. (2015). Homegrown or Imported? Frugal Innovation and Local Economic Development in Zambia. Southern African Journal of Policy and Development, 2(1), 15–25.
Peša, I. (2017). Sawdust pellets, micro gasifying cook stoves and charcoal in urban Zambia: Understanding the value chain dynamics of improved cook stove initiatives. Sustainable Energy Technologies and Assessments. https://doi.org/10.1016/j.seta.2017.02.010
Pisoni, A., Michelin, L., & Martignoni, G. (2018). Frugal approach to innovation: State of the art and future perspectives. Journal of Cleaner Production, 171, 107–126. https://doi.org/10.1016/j.jclepro.2017.09.248
Radjou, N., & Prabhu, J. C. (2014). Frugal innovation: How to do more with less (First edition). PublicAffairs.
Rao, B. C. (2013). How disruptive is frugal? Technology in Society, 35(1), 65–73. https://doi.org/10.1016/j.techsoc.2013.03.003
Ravallion, M. (2010). The Developing World’s Bulging (but Vulnerable) Middle Class. World Development, 38(4), 445–454. https://doi.org/10.1016/j.worlddev.2009.11.007
Ravishankar, M. N. (2016). A Bricolage Perspective on Technological Innovation in Emerging Markets. IEEE Transactions on Engineering Management, 63(1), 53–66. https://doi.org/10.1109/TEM.2015.2494501
Renewable Energy Investment Guide. (2012). GIZ, Kingdom of the Netherlands. Rosca, E., Arnold, M., & Bendul, J. C. (2016). Business models for sustainable innovation – an
empirical analysis of frugal products and services. Journal of Cleaner Production. https://doi.org/10.1016/j.jclepro.2016.02.050

160
Rosca, E., Reedy, J., & Bendul, J. C. (2018). Does Frugal Innovation Enable Sustainable Development? A Systematic Literature Review. The European Journal of Development Research, 30(1), 136–157. https://doi.org/10.1057/s41287-017-0106-3
Rural Electrification Agency. (2012). Annual Rural Electrification Report 2011/12. Rural Electrification Agency Uganda.
Sekantsi, L. P., & Okot, N. (2016). Electricity consumption–economic growth nexus in Uganda. Energy Sources, Part B: Economics, Planning, and Policy, 11(12), 1144–1149. https://doi.org/10.1080/15567249.2015.1010022
Sengendo, M. (2001). Photovoltaic Project for Rural Electrification-Uganda. ENERGIA News, 4(3). http://www.energia.org/fileadmin/files/media/EN112001_sengendo.pdf
Shimeles, A., & Ncube, M. (2015). The Making of the Middle-Class in Africa: Evidence from DHS Data. The Journal of Development Studies, 51(2), 178–193. https://doi.org/10.1080/00220388.2014.968137
Simula, H., Hossain, M., & Halme, M. (2015). Frugal and Reverse Innovations-Quo Vadis? Henri Simula, Mokter Hossain, Minna Halme," Frugal and Reverse Innovations-Quo Vadis.
Sovacool, B. K. (2011). Conceptualizing urban household energy use: Climbing the “Energy Services Ladder.” Energy Policy, 39(3), 1659–1668. https://doi.org/10.1016/j.enpol.2010.12.041
Suberu, M. Y., Mustafa, M. W., Bashir, N., Muhamad, N. A., & Mokhtar, A. S. (2013). Power sector renewable energy integration for expanding access to electricity in sub-Saharan Africa. Renewable and Sustainable Energy Reviews, 25, 630–642. https://doi.org/10.1016/j.rser.2013.04.033
Thurlow, J., Resnick, D., & Ubogu, D. (2015). Matching Concepts With Measurement: Who Belongs to Africa’s Middle Class? Journal of International Development, 27(5), 588–608. https://doi.org/10.1002/jid.3105
Tiwari, R., Fischer, L., & Kalogerakis, K. (2017). Frugal Innovation: An Assessment of Scholarly Discourse, Trends and Potential Societal Implications. In C. Herstatt & R. Tiwari (Eds.), Lead Market India (pp. 13–35). Springer International Publishing. http://link.springer.com/10.1007/978-3-319-46392-6_2
Tiwari, R., & Herstatt, C. (2012). Frugal innovation: A global networks’ perspective. Die Unternehmung : Swiss Journal of Business Research and Practice ; Organ Der Schweizerischen Gesellschaft Für Betriebswirtschaft (SGB), 66(3), 245–274.
Tiwari, R., Kalogerakis, K., & Herstatt, C. (2014). Frugal innovation and analogies some propositions for product development in emerging economies. http://nbn-resolving.de/urn:nbn:de:gbv:830-tubdok-12735
Ulsrud, K., Winther, T., Palit, D., & Rohracher, H. (2015). Village-level solar power in Africa: Accelerating access to electricity services through a socio-technical design in Kenya. Energy Research & Social Science, 5, 34–44. https://doi.org/10.1016/j.erss.2014.12.009
Umeme. (2019). Q3 2019 Umeme tariffs. https://www.umeme.co.ug/tariffs

161
Urpelainen, J., & Yoon, S. (2016). Solar products for poor rural communities as a business: Lessons from a successful project in Uttar Pradesh, India. Clean Technologies and Environmental Policy, 18(2), 617–626. https://doi.org/10.1007/s10098-015-1028-4
Üstüner, T., & Holt, D. B. (2010). Toward a Theory of Status Consumption in Less Industrialized Countries: Table 1. Journal of Consumer Research, 37(1), 37–56. https://doi.org/10.1086/649759
Veblen, T. (1899). The Theory of the Leisure Class. History of Economic Thought Books. Weyrauch, T., & Herstatt, C. (2017). What is frugal innovation? Three defining criteria. Journal
of Frugal Innovation, 2(1). https://doi.org/10.1186/s40669-016-0005-y Wietzke, F.-B., & Sumner, A. (2018). The Developing World’s “New Middle Classes”:
Implications for Political Research. Perspectives on Politics, 16(01), 127–140. https://doi.org/10.1017/S1537592717003358
Winterhalter, S., Zeschky, M. B., Neumann, L., & Gassmann, O. (2017). Business Models for Frugal Innovation in Emerging Markets: The Case of the Medical Device and Laboratory Equipment Industry. Technovation. https://doi.org/10.1016/j.technovation.2017.07.002
Wolde-Rufael, Y. (2005). Energy demand and economic growth: The African experience. Journal of Policy Modeling, 27(8), 891–903. https://doi.org/10.1016/j.jpolmod.2005.06.003
Zeschky, M. B., Winterhalter, S., & Gassmann, O. (2014). From Cost to Frugal and Reverse Innovation: Mapping the Field and Implications for Global Competitiveness. Research-Technology Management, 57(4), 20–27.
Zeschky, M., Widenmayer, B., & Gassmann, O. (2011). Frugal innovation in emerging markets. Research-Technology Management, 54(4), 38–45.

162
Conclusions
163
Summary of Main Findings
Business Models for Frugal Innovations The goal of the research was understanding how frugal innovations can overcome the tension between value capture and value creation for firms operating in emerging markets. Even with low cost products, reaching the very poor while maintaining profits in the context of poor institutions, low resources and fluctuating incomes is a challenge. Discussion of value creation and value capture requires a look at business models. In Chapter 2 the role for technological advancements like IT technologies in business models for frugal innovations was explored. IT has dramatically changed the landscape not only for innovation but also in business models in emerging markets. Three features of IT have allowed for new business models, lower cost innovations, and the potential for reaching a larger consumer base. Rapidly decreasing sensor costs, the externalities inherent in IT (for example the possibility for multiple platforms from one technology) and reduced transaction costs have played a role in both frugal innovations and new business models. The case of TAHMO demonstrated the role of IT in both the design of the frugal innovation and the diffusion process through TAHMO’s business model. TAHMO exploited the decrease in sensor prices through a co-creation approach to design an integrated weather station that utilized high tech but low cost sensors. Most importantly, TAHMO moved beyond mere frugality in the design but focused on a profitable model that would reduce the risk of weather stations being poorly maintained. TAHMO took a partnership approach from the start by working within the existing institutions (meteorological agencies) in each country. Additionally, TAHMO’s model depends on the externalities due to IT. TAHMO’s value creation is more than the weather station but generated through weather data. Weather data can be of value to more than public sector entities like met agencies but also telecom, mining, and insurance companies. Finally, TAHMO highlights the role of reduced transaction costs. Simplified weather data can now be available to small scale farmers through SMS alerts paid for by mobile money.
Consumer Heterogeneity and Purchase Decision Making While Prahalad’s initial work mostly assumed a group of consumers differentiated only by spending power, later work on consumers in emerging markets hints at a more heterogeneous group of consumers. Frugal innovation’s low costs are not enough to reach low income consumers therefore understanding consumer characteristics and what drives them to purchase low cost products at a certain moment in time has implications for firm strategy. In Chapters 3 and 4 the cases of Dutch Water Limited and Jibu were used to investigate two points related to consumers in emerging markets: 1) how consumers differ in characteristics based on their time of purchase and 2) understand what drives purchase behavior in emerging market consumers. DWL and Jibu provided two contrasting business cases in the struggle to provide low cost products that are typically provided by public infrastructure in markets without properly functioning drinking water infrastructure. While both companies have a stated social mission of offering low cost bottled water, minimizing environmental impact and reaching low income consumers (DWL) reaching the low income demographic is a struggle. Unlike DWL, Jibu explicitly targets the ‘missing middle’ as they identified this higher income group as a demographic that is still lacking clean drinking water but can afford Jibu’s products. While both companies were reaching mostly middle class consumers, income was not a differentiating

164
factor in the decision for consumers to purchase DWL or Jibu water. Additionally, due to DWL’s sharp price increase and the resulting significantly higher prices compared to competitors, it was initially assumed that income would be the main purchase driver. But across early, middle and late consumer groups there were minimal to no differences in income. Earlier consumers were more likely to be higher educated particularly in the case of DWL. The results suggested that education may be a more important differentiating factor for purchase than income which challenges the notion of a homogenous group of BoP consumers. In Chapter 4, a simple behavioral experiment with a group of non-consumers of Jibu and DWL water helped further expose what triggers purchase of low cost bottled drinking water. For both Rwanda and Kenya, the only statistically significant determinant of product purchase was having an experience with the product (free water sample). The focus of this paper was on more middle of the pyramid consumers as it was discovered that the sample better represented middle of the pyramid consumers. Particularly in the case of DWL in Kenya where their water is the highest priced on the market, product experience being the main driver of purchase suggested that consumers may not be driven only by price. The results presented two interesting implications: 1) consumers in emerging markets do not respond only to low price points but rather minimizing the risk of purchase can assist in the decision making process and 2) simply receiving information on a product can influence purchase decisions. Additionally, because price may not be the biggest driver of purchase, this result pointed to emerging market consumers being more conscious of quality and standards than earlier literature may have assumed.
Consumer Demand Early frugal innovation literature paid little attention to the role of demand in the design process or business model. Examples of Omo washing powder and other small scale solutions were criticized for penalizing low income consumers for paying more per unit than higher income consumers who can purchase higher quantities upfront (Karnani, 2007). Chapter 5 explored how frugal energy innovations could meet future energy demands in sub-Saharan Africa. Many cited examples of frugal innovations are solutions that have filled gaps left by the public sector and poorly functioning infrastructure. While solar lanterns and solar home systems offer a more cost effective service than traditional lighting sources like kerosene or diesel generators, on a per unit basis solar power is not cheaper than grid infrastructure. Focusing on Uganda, where much of the population particularly in rural areas is lacking grid connection highlighted a few important points for frugal innovation. First, most frugal innovations disregard the role of demand in their design. Solar home systems often cannot provide sufficient or affordable per unit power for higher power demands such as running a refrigerator. Second, current frugal energy solutions do not consider the whole system they are operating in. With rising incomes in most of sub-Saharan Africa and the rise of the ‘new middle class’ there is a need for frugal innovation to consider policy, demand, the end user, and future technological advancements from the beginning of the design process.
Research Questions Looking back at the main research question and sub-questions several conclusions can be drawn. Early literature on frugal innovation focused on definitions and single case studies, while this research attempts to provide quantitative insights into a consumer perspective on

165
frugal innovation. Firms operating in emerging markets are faced with the dual challenge of creating value for the end consumer or beneficiary while running a profitable business. Prahalad’s work first introduced the potential for firms in emerging markets but overlooked the specificities of how this group could be reached and more importantly whether the products being offered would provide longer term solutions to development challenges such as clean drinking water and energy. Therefore, this research explored how the tension between value capture and value creation can be overcome.
R1: How do business models affect value capture and value creation of frugal innovations?
All four cases highlighted the importance of the business model in achieving a balance between value capture and value creation. Business model innovation may be more important than product innovation in an emerging market and low resource setting. Business models in an emerging market setting need to consider pricing schemes that help distribute the up-front costs of a product. Distributing costs can be achieved through cross-subsidization of products either differentiating market segments or differentiating business models and margins for different products. Business models in emerging markets should also have a stronger partnerships approach such as working with NGOs. Finally, multiple revenue streams are important both from a profit perspective and the goal of keeping product prices low. First, as highlighted by TAHMO, the rise of IT particularly in Africa plays an important role in the business model. IT has reduced transaction costs, making pay as you go models (through mobile money payment) and dissemination of information (like SMS alerts for small scale farmers) easier. Additionally, IT has introduced the possibility to have multiple revenue streams. In TAHMO’s case their revenue is more than attempting sell weather stations but the value generated by weather data. The value of weather data is both value creating and a value capturing mechanism through its potential to generate revenue. Second, business model design can be a means to achieve frugality. DWL, Jibu and the solar case all offer products that may not be frugal innovations due to their high per unit costs compared to public infrastructure. But products can be made more affordable through a business model design that emphasizes reducing up-front costs. Jibu aimed to keep refill costs low and accepted low to zero margins into order to achieve this goal. The solar company made solar home systems affordable for more customers by operating as an electricity business and offering monthly use fees that were more accessible to low income customers. DWL struggled to maintain a customer base after a sharp tax increase that changed the market conditions and resulted in their water being the highest priced on the market. As a result, DWL had to change their revenue streams to maintain a profitable business and begin to offer higher margin product offerings like dispenser bottles and small single use bottles. DWL and Jibu illustrate an additional point for business models for frugal innovations. In an emerging market setting where income and market conditions are more volatile than in developed markets, business model flexibility is important. Jibu’s starting point was a three country pilot in order to come up with a model that would be easily scalable. To date the franchise model has allowed Jibu to quickly scale to four countries in the span of 5 years. DWL’s model was more technology driven through the existence of Hatenboer’s reverse osmosis technology and contacts on the Kenyan coast. While DWL was initially successful in creating a market for reusable jerry cans of drinking water, their model was less flexible to
166
accommodate the tax change and expand to new areas due to the high up-front costs of setting up a reverse osmosis purification plant. DWL was the only company in the market to fully comply with the change in tax law which resulted in TAHMO further illustrates the importance of business model flexibility. TAHMO adjusts their approach and their customers depending on the country specific needs. Ultimately, business models play an important role in achieving frugality and should consider three important aspects. First, business model innovation for frugal products is facilitated by IT. Pay as you go models are now more efficient through mobile money technology that reduces transaction costs. Second, keeping costs low for the consumer is achieved through some form of cross subsidization, dual business models or a pay as you go model. BoP consumers do have purchasing power but paying for the up-front costs of a product is out of reach for most. Finally, business model flexibility is critical in a low resource and higher risk setting like the BoP. Contextual factors like tax law, culture and the local market influence business model design. The case of DWL highlighted how a model with high initial investments and fixed assets (setting up the reverse osmosis purification plant) can be inflexible to changes like an abrupt change in taxes. Jibu and TAHMO had a more flexible approach that could be adapted to the local context. Jibu was also agnostic to the purification technology used which may make expansion to new markets easier. Finally, Jibu made the explicit choice to target a slightly higher income segment (middle class consumers) rather than struggle to reach the very poor. Their targeted approach perhaps allowed them to expand faster while still providing a basic good to a demographic that was lacking it.
R2: How do determinants of purchase decisions for emerging market consumers lead to value creation and value capture?
The second research question looked at purchase decision making for emerging market consumers and was addressed in chapters 3 and 4. The cases of DWL and Jibu highlighted three important points regarding preferences and decision making for consumers. First, income was not the main driver of purchase in either case, reinforcing earlier work that suggested that consumers purchase more on availability (supply) than demand for a product or low price points. Because frugal innovation as a concept has emphasized low costs, understanding that for at least products like clean drinking water price is not the only driver of purchase. Just like in developed markets, human capital (in this case education) plays a large role in purchase. A stronger effect than merely the purchasing power of the consumer. While the result holds for the cases of DWL and Jibu, it has larger implications for frugal innovation. A product may adequately meet a need and be at a low price point but without the human capital needed to perceive the product’s value, willingness to pay may still remain low. Second, consumers in emerging markets are still risk adverse and having an experience with a product can provide additional information that helps mitigate purchase risk aversion. This result again reinforces that there is a need to look beyond merely low price points when designing frugal innovations. Consumers are also concerned with quality and a marketing strategy that assists in providing information that can help mitigate purchase risk is effective. Provision of information relates to value creation in that it can change a consumer’s perception of the value in a product. In an emerging market setting this need to provide information may

167
be stronger due not only to risk aversion but lower access to markets and information than in a developed setting. Finally, the results also highlight the heterogeneity of consumers in their purchase decision making. Education was a key factor in the decision to purchase clean drinking water but this differed depending on when consumers purchased water (based on market entry of the company). However, later consumers were also more influenced by word of mouth information, suggesting that it is important to appropriately target the early group of consumers since they influence subsequent product purchase. Overall, purchase decision making for emerging market consumers is not a simple low cost calculation but consumers are influenced by their existing information (education level) and new information (such as product experience or word of mouth information from neighbours). Product quality is equally important in an emerging market setting as in a developed market which means that focus on designing low cost products is only one aspect of successfully creating and capture value.
R3: How will future demand influence frugal innovations? The final sub-question addressed deals with the role of rising consumption and increased future demand. While the starting point for the research was investigating frugal innovation, three of the cases are perhaps not truly frugal. The term frugal innovation has often been used loosely in literature to refer to innovations that address needs in emerging markets and reach supposed low income customers. Frugal innovation has overlap with other terms focusing on innovations for the poor such as inclusive, BoP, Jugaad, or resource scarce innovations. Yet many of the terms and in particular frugal innovation are applied loosely to cases of companies providing innovations addressing basic needs (water, health energy) without a clear understanding of their frugality. Jibu, DWL and the solar company are all outcomes of institutional, resource and cost constraints but their product offerings are not really affordable on a per unit basis. Consumers are being penalized for lacking access to public infrastructure and are instead forced to pay more per unit for electricity and clean drinking water. DWL, Jibu and the solar company overlook the role of demand in their innovations. Particularly for solar energy, at higher energy consumption levels solar homes systems cannot provide adequate power to power appliances like a fridge. Additionally, while through decreasing solar technology prices and innovative business models, solar energy can be made accessible to many lower income consumers it is still more expensive than grid electricity tariffs. The same per unit penalty applies to bottled drinking water. Tap water is far cheaper, yet in the context of Rwanda, Kenya, and Uganda unsafe and or inaccessible and unreliable. However, while tap water or electricity through the grid might be cheaper after the up-front investment is recovered, most BoP/emerging markets (like in East Africa) lack the resources for the up-front investment and without a sufficient number of consumers connecting to the grid or public water supply, the economies of scale aspect of large scale water and electricity infrastructure may be unachievable. Therefore, while small scale ‘stop gap’ solutions like bottled drinking water and off grid solar are more expensive on a per unit basis in the short term there may be a larger role for decentralized energy and water infrastructure when combined with appropriate investments and policy responses. Therefore, frugal innovations need to consider the role of demand and take a broader perspective that incorporates a system level view in the design.

168
Jibu and DWL additionally highlight the problem that companies face in value creation (in this case the goal of reaching low income consumers) with regards to reaching low income consumers. Both companies have a consumer base that would be more accurately described as new middle class. Jibu recognized the struggle to reach the BoP and instead targeted urban middle class consumers explicitly. New middle class consumers are rising in sub-Saharan Africa and their future consumption plays a large role in how frugal innovations may be designed to reach this demographic. Future frugal innovation should consider demand, existing and future infrastructure that the innovation will operate in, policy and context. These aspects can be considered at the beginning of the design process rather than providing ‘stop gap’ solutions like bottled drinking water and small scale solar energy. TAHMO is an example of taking a system level perspective to frugal innovation. The initial goal was to improve the existing weather station design and find a model that allowed a cheaper and lower maintenance solution to be quickly diffused across the continent. By considering the existing system and looking at potential partnerships from the beginning of the design process, TAHMO has perhaps moved beyond a stop gap measure to provide a design that is more frugal on a systems level than traditional weather stations.
Main Research Question: How can frugal innovations overcome the tension between value creation and value capture?
The four cases clearly highlight the inherent tension between value creation and value capture. While the cases address specific gaps in the market and unaddressed needs, filling a gap is not sufficient to create a profitable business, bring value to the end user, and ultimately contribute to sustainable local economic development. Emerging markets like Kenya, Uganda and Rwanda are quickly changing in terms of institutional conditions (such as tax law, policy such as promotion of renewable energy), consumers, and resources. Frugal innovation as a concept has brought the promise of a business led approach to providing needs in resource scarce settings. Yet, as the cases expose, frugal innovation alone will not provide a means for a business to contribute to local economic development and be financially sustainable. In order to bridge the gap between value creation and value capture there are a few key insights that can be drawn. First, considering a consumer perspective on value creation like the work of Priem, (2007) and Ratchford, (2001) may be a better business approach than the traditional resource based view in an emerging market setting. Value creation in low resource settings requires tapping into and increasing human capital which ultimately may increase willingness to pay. The exploration of Jibu and DWL’s consumers emphasizes the need to increase human capital. Education plays a stronger role than income in water purchase. Finding ways to increase potential consumers’ level of education about a product is a means to increase value creation. For both Jibu and DWL, not only did the education level of the consumer play a role (depending on time of purchase) in the decision to purchase water but also information about the product (either through marketing or word of mouth). Additionally, a targeted approach like providing a physical experience through a free sample is another means to increase value creation for the consumer and ultimately willingness to pay. To date, frugal innovation literature has focused primarily on low costs as a way to create value for consumers but this approach is limited because even with low costs, willingness to pay may be low when there is limited knowledge about the benefits of a product. Increasing the use value (or willingness to pay) to the consumer rather than merely decreasing the product price (exchange value) shifts the innovation focus

169
from mere product price reduction but business model innovation. ‘Frugal’ business models that look at frugality in all aspects such as increasing convenience to the consumer through the distribution model (i.e. lowering consumer transport and time costs), or increasing access to information or providing a product or set of products with multiple uses that may allow the consumer to increase their income is a means overcome the tension between value creation and value capture. The shift beyond mere product innovation is demonstrated through TAHMO. While the station design represents a clear reduction in costs and increased simplicity, implementation remains a challenge. Creating value in the case of TAHMO has primarily come through increasing the usefulness of the weather data and finding multiple stakeholders that can both benefit from and pay for the data. Finally, the business model of the solar case further exposes the need for frugality in the business model and increasing consumer value. Solar products were made more affordable through distributing the up-front costs and providing guaranteed maintenance. But beyond merely access to energy the majority of the company’s customers were small business owners who had captured value from access to electricity by increasing their business activities to include services like phone charging, movie projection or computer services. Second, while the co-creation oriented approaches of the BoP protocol (Simanis et al., 2008) also point to the need to create markets and co-create innovations, taking a consumer approach to value creation is more than mere market creation. Particularly in the case of DWL, a market for re-usable bottled drinking water was created and new companies entered the market with a similar model. In the initial stages their model was successful from a sales point of view, yet not entirely profitable. However, in spite of being a market leader, DWL has struggled to capture value due to inflexibility in their model. Jibu’s iterative approach through the use of three country pilots, and decentralized water purification has perhaps provided them more flexibility to cope with varying regulations in the countries they operate in. Additionally, Jibu’s L3C designation makes the social orientation of their company explicit allowing return on investment to be more than just financial returns but also impact returns. Although DWL also has a social mission, their market leader position, no corruption policy, and fixed assets (centralized purification plant) has made adaptation to the changes in tax law challenging, requiring the need to increase higher margin products for higher income consumers in order to boost revenue. Moreover, the four cases expose two different starting points for the design of a frugal innovation: technology driven versus demand driven. DWL’s approach was more technology driven with the starting point of having Hatenboer’s expertise in reverse osmosis technology. While the area that DWL operates has water with high salt content suggesting that RO technology is the appropriate choice, it is unclear whether there might have been other cheaper, more energy efficient and less waste producing alternatives if the distribution was decentralized (since salt content varied along the entire Kenyan coastal region). Jibu’s approach was more oriented around finding a solution for the potential demand for low cost clean drinking water for middle of the pyramid consumers in emerging markets. The demand driven approach can also be represented by the solar case. Consumers need to see the value in electricity before having willingness to pay for solar. In the case of solar, there is a clear link between income and higher energy use which from a business perspective has resulted in the rapid diffusion of off grid solar options in sub-Saharan Africa. But as incomes rise these solutions may be

170
inadequate for future energy demands. In the long run, a demand oriented (or demand creating) design approach to frugal innovation may better create and capture value. The four cases also highlight two different approaches to frugal innovation beyond the design. TAHMO’s starting point was designing a solution that was lower cost and simpler than the existing system. Beyond merely creating a cheaper and simpler design, TAHMO also designed within the system that the weather stations would be operating in. Rather than designing a weather station that was a stop gap solution, TAHMO partnered with local actors from the start and sought to create a solution that worked within the given institutional context but also shaped the future of weather monitoring. The cases of bottled drinking water and solar home systems present a contrasting approach. For DWL, the solar case and to a lesser extent Jibu, the design approach revolved more around providing a solution to a problem (clean drinking water or electricity access) through a business approach rather than ‘improving’ the existing system. Clean drinking water access is a problem due to aging and insufficient infrastructure. Bottled drinking water even if it attempts to remain low cost is still more expensive on a per unit basis than tap water. Even with social missions and unique business models, DWL and Jibu both offer solutions that could become unnecessary given functioning water infrastructure. The case of solar electrification shows a similar outcome. Solar home systems have in many cases reduced energy expenditures for the equivalent electricity usage and provide a safer and cleaner alternative to diesel generators and kerosene lanterns but at higher energy demand they are not affordable on a per unit basis. While, these solutions currently are more expensive on a per unit basis, there is potential for off grid options like solar and decentralized drinking water to have potential to provide needed infrastructure with the right policy support. Jibu’s integration with the public drinking water supply and decentralized purification approach might be a way to both run a profitable business, generate local entrepreneurship opportunities, and extend water access in a more affordable way than simply upgrading public drinking water infrastructure. Additionally, in many contexts these ‘off grid’ solutions like decentralized water purification or small scale solar could be solutions for consumers living a more nomadic lifestyle where access to electricity and clean drinking water are difficult. However, in the short term bottled drinking water is out of reach for the very low income consumers. Finally, the research exposes the importance of considering consumer demand in frugal innovation design. Early frugal innovation literature overlooks the so called frugality of products when faced with increased future consumption. Rising incomes, technological advancements like IT, and population growth will result in rapidly increasing consumption particularly when regions like sub-Saharan Africa follow the growth trajectory of western nations. Rising consumption particularly of energy and consumer electronics has severe implications for sustainable development. Frugal innovations in water, health and electricity may meet basic needs but on a larger scale are merely stop gap solutions to system level problems and infrastructure deficiencies.
Implications This thesis provides several main practical and theoretical implications for frugal innovation research and more generally research on businesses operating in emerging/BoP markets.

171
Theoretical Frugal innovation research has progressed to provide increasingly clear definitions of the concept, yet the application of the term to ‘stop gap’ innovations like small scale solar systems and bottled drinking water overlooks per unit costs and how in resource and institutionally deficient contexts low income consumers are often ‘penalized’ financially for purchasing small scale and per unit goods. Initial applications of the frugal innovation concept focused on multinationals altering their innovation process for resource scarce environments like GE’s low cost ultrasound device. However, as the term has gained ground its application has become broader to extend to innovations like small scale solar systems that are replacing public infrastructure. Therefore, the research exposes the need to both further unpack frugality and explore how these ‘stop gap’ innovations can be made more frugal. As a concept frugal innovation has important implications for sustainable development. Most cited frugal innovations are examples of products or systems that address basic needs with the goal of lower resource use, lower costs and yet high quality. The focus on lower resource use and low costs has implications not only for emerging markets but also the developed as consumers are increasingly more aware of resource use and are cost conscious. However, the longer term potential for frugal innovation and sustainable development is hindered without investigating consumption and ultimately taking a systems approach to frugal innovation design. Frugal innovations that move beyond mere product design but consider the consumer and how value creation can be maximized through the consumer, future demand and technological advancements and how these aspects fit within the context and system that they are operating in will have more impact. The issue of many frugal innovations being merely stop gaps can be addressed by further examining the consumer perspective on value creation and using a socio-technical systems approach to frugal innovation. From a theoretical perspective all four cases highlighted the importance of the business model and the need to increase consumer willingness to pay through the business model. Willingness to pay (or use value) can be increased through access to information and ultimately increasing education level about a product (like in the case of bottled water), ease of access through improved distribution systems or making a product multi use (like electrification providing income generating opportunities through phone charging services). Additionally, business models for frugal innovations and more broadly innovations designed for resource scare environments need to take an iterative and flexible approach like that adopted by Jibu and TAHMO. The institutional environment in emerging markets is rapidly changing and without an iterative and flexible approach a business can easily fail to adapt to changes. Jibu’s initial approach of conducting pilots in three countries may be a way to more easily scale up and adapt to local contexts rather than starting with a single pilot.
Policy All four of the cases studied represent innovations that are replacing services typically provided by the public sector and demonstrate how policy can play a role in frugal innovation. First, the two water cases highlight how small scale solutions are not really financially feasible in the long run and still exclude the very poor. In Rwanda, the government is tackling the problem of water supply and quality issues through new purification plants but in the short run there is still a demand for bottled drinking water particularly for middle income consumers. In all three countries under study there has been a push to eliminate and reduce single use plastic over the

172
last few years, which has resulted in either the ban or increase in VAT taxes on bottled drinking water. While from an environmental perspective these changes are positive, they have affected companies like DWL. Additionally, the initial tax increase came in the year prior to the 2017 presidential election, prompting speculation that the tax increase could have been a means to increase government revenue preceding the election. Ultimately, policy can play a role in either stimulating or suppressing private sector involvement in emerging markets. Consumers are concerned with quality standards, yet particularly in Uganda and Kenya there was a lack of proper certification on many bottled water brands leading to a high level of suspicion over bottled water quality. The issue of quality suggests an increased role for product standards and certification in emerging markets. Second, all four cases expose the lack of local manufacturing capabilities in East Africa. While Jibu and DWL had more value chain activities locally (production, distribution, sales) the purification technology was produced overseas (Hatenboer and Living Waters International). TAHMO has experimented with trying to at least work with local tech hubs for local assembly, but the sensors are still manufactured by foreign firms. Finally, solar technology while rapidly being diffused across the African continent is a complex case in the tension between local manufacturing and keeping costs low. Almost all solar products are manufactured in China due to the very low costs, then imported to Africa. In East Africa most countries have kept import taxes on solar products low or waived in order to keep prices low45. While the elimination or reduction of import taxes has allowed for rapid adoption of solar products, it also begs the question of how local manufacturing could be stimulated in sub-Saharan Africa. Particularly with regards to frugal innovation there may often be a tension between bringing more value chain activities locally and keeping product prices low. Third, the two water cases show how government policy can influence purchase decisions. Kenya, Uganda, and Rwanda have moved towards eliminating single use plastic which could be a factor in the increase in excise taxes on bottled water. However, while this policy may have positive implications for plastic waste it also overlooks companies like DWL that are offering re-usable bottled water options. Additionally, due to the lack of clean drinking water infrastructure there is still a demand for bottled drinking water which shows the need for an appropriate mix of policy that discourages single use plastic but does not decrease clean drinking water options. Moreover, while decentralized solutions in the short run fail to exploit the cost reducing nature of large scale economies of scale infrastructure, there may be a larger role of decentralized water and energy solutions (such as the franchise approach employed by Jibu) with the right investments and policy. Decentralized energy and water production do eliminate the high and out of reach investment costs with larger infrastructure therefore including investment costs into the per unit costs of grid electricity or tap water might present a different picture for decentralized innovations like Jibu, DWL and the solar company. Moreover, many technological innovations like large scale infrastructure are in place due to
45 https://solarmagazine.com/state-of-solar-equipment-import-trade-in-africa/

173
path dependency (i.e.: electricity infrastructure is cheaper per unit because the infrastructure is already in place). Therefore, policy that can shift Finally, the research exposes a shift in development policy from aid to trade and the potential for business oriented approaches to development. Particularly, in the Netherlands there has been a shift from pure aid oriented development approaches to seeking to foster development through business activities. The solar company’s registration as an NGO in the Netherlands yet explicit business and financial sustainability target approach reflects this change. Additionally, Jibu’s social impact and profit combined motives display how investment can be redirected to more employment generating activities in emerging markets. While all four cases demonstrated the struggle of entering emerging markets, they also perhaps display more long term promise given that a business approach ultimately results in more local employment. Therefore, continuing to explore the role for business in development and supporting both NGOs, businesses and hybrid organizations like Jibu and the solar company may be a wise policy move for western governments seeking to effectively use aid budgets.
Managerial Early literature on the BoP and emerging markets tended to define consumers on the basis of their purchasing power with varying cut off points for BoP versus new middle class. Purchase decisions for products related to health like clean drinking water are not solely driven by income therefore suggesting that low price points are not enough to reach low income consumers. Consumers differed in characteristics depending on their time of purchase which has implications for marketing. Firms operating in the BoP/emerging markets should be more targeted in the first consumers they market to both from the perspective of attracting early purchasers and also in gaining subsequent market share. While there were some contextual differences DWL and Jibu highlighted that earlier purchasers of clean drinking water were higher educated and tended to be purposefully searching for a clean drinking water alternative. Later consumers were more likely to have purchased on the basis of word of mouth information. The case of DWL in particular highlighted how BoP/emerging market consumers are concerned with quality. DWL had the highest priced water on the market yet still kept a stable consumer base due to their perceived higher quality and properly certified water. This result points to the need for products that meet proper certification and standards. Frugal innovation’s initial promise was value for money, and the cases of DWL and Jibu point to the need for frugal innovation to focus not only on low price points but also high quality. Finally, while price and purchasing power may not be the main drivers of product purchase, BoP/emerging market consumers are risk adverse. As demonstrated by the behavioral experiment on bottled drinking water, when some risk was mitigated by having an experience with a product, product purchase increased. Conducting expensive free sample campaigns may not be feasible for many firms in a BoP setting but the study also showed that simply gaining access to information about a product resulted in purchase. These results have three main managerial implications. First, marketing campaigns that target the less risk adverse and perhaps higher educated first users may pay off in terms of later product adoption from word of mouth referral. Related to first users, purchase is closely related to access to supply. Therefore, a distribution model that makes supply convenient to a consumer will increase purchase. Second, all of the cases highlight the importance of the business model and particularly business model flexibility. An entry approach that focuses beyond mere

174
product innovation (like DWL’s approach) may be more successful in the long run and allow for better scale up. Jibu and TAHMO’s approaches are more easily adapted to local conditions and sourced local expertise from the start. Finally, quality is valuable to emerging market consumers. DWL has maintained some market position due to their high quality products and proper certification. The importance of quality also holds for the solar company, where many consumers switched to their products after poor experiences with Chinese designed solar products.
Reflections and Future Research The starting point for this research was developing a more generalizable framework for the iterative process between frugal innovation and business models. Cases were selected as part of a larger research project and as was discovered during the course of the research, some of these cases may not be appropriately labelled as frugal innovations. Dutch Water Limited does represent a business innovating in an emerging market setting but the application of the term frugal innovation to bottled drinking water is not suitable. Even without the tax increase, per unit costs for bottled drinking water are high even with a western salary. Jibu, DWL and the solar case illuminate the perhaps overuse of the term frugal innovation to apply to innovations in emerging markets but not necessarily innovations that represent lower resource use and lower costs. While the three cases are providing goods and services that are lacking, the term frugal innovation is not descriptive of their products. From a methodological perspective, although the thesis made use of multiple case studies and a quantitative approach there are limitations to the generalizability of the results. A consumer was defined as merely a consumer of either Jibu or DWL water not as a consumer of bottled water. To account for this sampling bias, the focus of the two papers on DWL and Jibu was merely factors driving purchase of the two water brands, not bottled water in general. A study of the entire market for bottled water would have provided deeper insights into factors driving bottled water purchase but for the purpose of this research the focus was only on two companies with stated social missions. Given a larger dataset more advanced statistical tools such as the Heckman correction could have been used. Additionally, one of the research goals was to provide some initial insights into the role of context in frugal innovations. To investigate context cases, from three countries were selected. Particularly in the case of DWL and Jibu, the three country comparison provided some external validity. However, the results only hold for the subset of consumers from each company. Finally, the limitations of the work point to some future research lines. First, because the results showed that the two water companies are reaching a higher income group that would be more aptly described as middle class consumers, further research into the consumption patterns of this demographic is warranted. Research on the ‘new middle class’ in Sub-Saharan Africa in particular is a growing area of research (Chikweche & Fletcher, 2014; Melber & Nordiska Afrikainstitutet, 2016) but beyond the mixed quantitative cut off points for this group, there is limited understanding of how this group purchases and consumes. From an economic development standpoint, a growing middle class is a positive development but as prior research suggests in other emerging economies, demand for ‘status’ products like electronics or cars and simply energy may increase (Lange & Meier, 2009; Sovacool, 2011; Üstüner & Holt, 2010). Rising demand poses a problem from an environmental perspective but also presents an opportunity for companies entering emerging markets. Frugal innovation may play a larger role

175
in reaching the new middle class which may have spillover effects in allowing more lower income consumers access to grid or mini grid infrastructure through economies of scale impacts. Second, the rise in demand for products and resources in the sub-Saharan Africa exposes a second important area for future research. To date frugal innovation literature has been predominately focused on small scale solutions that provide better alternatives to for example traditional energy sources, unsafe drinking water or lack of healthcare. However, these small scale or ‘stop gap’ solutions may not be economical or sustainable in the future. Therefore, there is a need to take a systems approach to frugal innovation from the start of the design process and look for cross sectoral links to maximize value from the innovation. Technological advancements like the decreasing sensor prices exhibited in the TAHMO design or the drop in the price of solar technology may assist in creating more system wide solutions but frugal innovation should move beyond an isolated focus on the product. Expanding the socio-technical systems work of Geels, (2004) may be a theoretical lens to explore a systems approach to frugal innovation. While there is a growing body of work examining the role of the business model in frugal innovations (Rosca et al., 2016; Winterhalter et al., 2017), this is a further area for future research. The business model plays an important role in firms capturing profits and also in reaching lower income consumers through possible cross subsidization of products. More importantly, the role of the business model in actually increasing consumer willingness to pay (particularly by expanding consumer human capital (Priem, 2007b; Priem et al., 2012b; Ratchford, 2001b)) is an important yet not fully explored area of research within frugal innovation. Ultimately, the thesis points to the need to move beyond a purely technological and design focused approach to frugal innovation but further investigation of the consumption side of frugal innovation: demand, human capital, and financing models. By deepening the understanding of consumers in emerging markets, frugal innovations can better contribute to local economic development impact.

176
References Adkins, N. R., & Ozanne, J. L. (2005). Critical Consumer Education: Empowering the Low-
Literate Consumer. Journal of Macromarketing, 25(2), 153–162. https://doi.org/10.1177/0276146705280626
AfDB, A. (2016). African Development Report 2015-Growth, Poverty and Inequality Nexus: Overcoming Barriers to Sustainable Development. African Development Bank.
Agarwal, N., & Brem, A. (2012). Frugal and reverse innovation—Literature overview and case study insights from a German MNC in India and China. 1–11. https://doi.org/10.1109/ICE.2012.6297683
Agnihotri, A. (2012). Revisiting the Debate over the Bottom of the Pyramid Market. Journal of Macromarketing, 32(4), 417–423. https://doi.org/10.1177/0276146712451596
Ahlborg, H., & Hammar, L. (2014). Drivers and barriers to rural electrification in Tanzania and Mozambique – Grid-extension, off-grid, and renewable energy technologies. Renewable Energy, 61, 117–124. https://doi.org/10.1016/j.renene.2012.09.057
Alcott, B. (2008). The sufficiency strategy: Would rich-world frugality lower environmental impact? Ecological Economics, 64(4), 770–786. https://doi.org/10.1016/j.ecolecon.2007.04.015
Alur, S., & Schoormans, J. P. L. (2013a). Retailers and new product acceptance in India’s base of pyramid (BoP) markets: Propositions for research. International Journal of Retail & Distribution Management, 41(3), 189–200. https://doi.org/10.1108/09590551311306246
Alur, S., & Schoormans, J. P. L. (2013b). Retailers and new product acceptance in India’s base of pyramid (BoP) markets: Propositions for research. International Journal of Retail & Distribution Management, 41(3), 189–200. https://doi.org/10.1108/09590551311306246
Amit, R., & Zott, C. (2001). Value creation in E-business. Strategic Management Journal, 22(6–7), 493–520. https://doi.org/10.1002/smj.187
Annala, L., Sarin, A., & Green, J. L. (2018). Co-production of frugal innovation: Case of low cost reverse osmosis water filters in India. Journal of Cleaner Production, 171, S110–S118. https://doi.org/10.1016/j.jclepro.2016.07.065
Bachnik, K., & Szumniak-Samolej, J. (2013). Shared Value in Practice: TOMS Business Model. Chinese Business Review, 12(9), 639–645.
Banbury, C., Herkenhoff, L., & Subrahmanyan, S. (2015). Understanding Different Types of Subsistence Economies: The Case of the Batwa of Buhoma, Uganda. Journal of Macromarketing, 35(2), 243–256. https://doi.org/10.1177/0276146714528954
Banerjee, A., & Duflo, E. (Eds.). (2017). Handbook of economic field experiments. North-Holland, An imprint of Elsevier.

177
Banerjee, A. V., & Duflo, E. (2008). What is Middle Class about the Middle Classes around the World? Journal of Economic Perspectives, 22(2), 3–28. https://doi.org/10.1257/jep.22.2.3
Banerjee, A. V., & Duflo, E. (2011). Poor economics a radical rethinking of the way to fight global poverty. PublicAffairs. http://site.ebrary.com/id/10469207
Barney, J. (1991). Firm Resources and Sustained Competitive Advantage. Journal of Management, 17(1), 99–120. https://doi.org/10.1177/014920639101700108
Basu, R., Banerjee, P., & Sweeny, E. (2013). Frugal Innovation: Core Competencies to Address Global Sustainability. Journal of Management for Global Sustainability, 1(2), 63–82. https://doi.org/10.13185/JM2013.01204
Baud, I. (2016). Moving Towards Inclusive Development? Recent Views on Inequalities, Frugal Innovations, Urban Geo-Technologies, Gender and Hybrid Governance. The European Journal of Development Research, 28(2), 119–129. https://doi.org/10.1057/ejdr.2016.1
Bawa, K., & Shoemaker, R. (2004). The Effects of Free Sample Promotions on Incremental Brand Sales. Marketing Science, 23(3), 345–363. https://doi.org/10.1287/mksc.1030.0052
Bayart, J.-F., & Ellis, S. (2000). Africa in the world: A history of extraversion. African Affairs, 99(395), 217–267.
Belk, R. (2000). Consumption patterns of the new elite in Zimbabwe. Bensch, G., Peters, Jörg. (2010). Socio-economic impacts of rural electrification in Rwanda an
ex-ante assessment of GTZ activities. RWI. Bhaduri, S. (2016, May 26). Frugal Innovation by the small and the marginal: An alternative
discourse on innovation and development [Inaugural lecture “Prins Claus Chair”]. http://api.rsm.nl/files/index/get/id/27fea990-217c-11e6-967a-edf9559acbd6
Bhaduri, S., & Kumar, H. (2011). Extrinsic and intrinsic motivations to innovate: Tracing the motivation of ‘grassroot’ innovators in India. Mind & Society, 10(1), 27–55. https://doi.org/10.1007/s11299-010-0081-2
Bhatti, Y. A. (2012). What is Frugal, What is Innovation? Towards a Theory of Frugal Innovation. SSRN Electronic Journal. https://doi.org/10.2139/ssrn.2005910
Bhatti, Y. A., & Ventresca, M. (2013). How Can ‘Frugal Innovation’ Be Conceptualized? SSRN Electronic Journal. https://doi.org/10.2139/ssrn.2203552
Bhatti, Y., Ramaswami Basu, R., Barron, D., & Ventresca, M. J. (2018). Frugal Innovation: Models, Means, Methods (1st ed.). Cambridge University Press. https://doi.org/10.1017/9781316986783
Birdsall, N. (2010). The (indispensable) middle class in developing countries. Equity and Growth in a Globalizing World, 157.
Birdsall, N. (2015). Does the Rise of the Middle Class Lock in Good Government in the Developing World? The European Journal of Development Research, 27(2), 217–229. https://doi.org/10.1057/ejdr.2015.6
178
Bonsu, S. K., & Polsa, P. (2011). Governmentality at the Base-of-the-Pyramid. Journal of Macromarketing, 31(3), 236–244. https://doi.org/10.1177/0276146711407506
Bowman, C., & Ambrosini, V. (2000). Value Creation Versus Value Capture: Towards a Coherent Definition of Value in Strategy. British Journal of Management, 11(1), 1–15. https://doi.org/10.1111/1467-8551.00147
Brei, V., & Böhm, S. (2011). Corporate social responsibility as cultural meaning management: A critique of the marketing of ‘ethical’ bottled water. Business Ethics: A European Review, 20(3), 233–252. https://doi.org/10.1111/j.1467-8608.2011.01626.x
Brem, A., & Wolfram, P. (2014). Research and development from the bottom up—Introduction of terminologies for new product development in emerging markets. Journal of Innovation and Entrepreneurship, 3(1), 9. https://doi.org/10.1186/2192-5372-3-9
Brooks, A. (2017). What Class is the African Middle Class?: Henning Melber (ed.), The Rise of Africa’s Middle Class: Myths, Realities and Critical Engagements (London, Zed Books, 2016), 232 pp., £24.99, paperback, ISBN 978 1 78360 713 6. Journal of Southern African Studies, 43(6), 1309–1311. https://doi.org/10.1080/03057070.2017.1379698
Bughin, J., Chironga, M., Desvaux, G., Ermias, T., Jacobson, P., Kassiri, O., Leke, A., Lund, S., Wamelen, A. V., & Zouaoui, Y. (2016). Lions On The Move II: Realizing The Potential Of Africa’s Economies. McKinsey Global Institute. http://www.mckinsey.com/global-themes/middle-east-and-africa/lions-on-the-move-realizing-the-potential-of-africas-economies
Burt, Z., Njee, R. M., Mbatia, Y., Msimbe, V., Brown, J., Clasen, T. F., Malebo, H. M., & Ray, I. (2017). User preferences and willingness to pay for safe drinking water: Experimental evidence from rural Tanzania. Social Science & Medicine, 173, 63–71. https://doi.org/10.1016/j.socscimed.2016.11.031
Busse, M., Erdogan, C., & Mühlen, H. (2016). China’s Impact on Africa - The Role of Trade, FDI and Aid: China’s Impact on Africa. Kyklos, 69(2), 228–262. https://doi.org/10.1111/kykl.12110
Byrnes, J. P., Miller, D. C., & Schafer, W. D. (1999). Gender differences in risk taking: A meta-analysis. Psychological Bulletin, 125(3), 367.
Cameron, A. C., & Trivedi, P. K. (2009). Microeconometrics using Stata. Stata Press. Cantone, L., & Risitano, M. (2011). Building consumer-brand relationships for the customer
experience management. 1–33. Carù, A., & Cova, B. (2003). Revisiting Consumption Experience: A More Humble but
Complete View of the Concept. Marketing Theory, 3(2), 267–286. https://doi.org/10.1177/14705931030032004
Cavusgil, S. T., Deligonul, S., Kardes, I., & Cavusgil, E. (2018). Middle-Class Consumers in Emerging Markets: Conceptualization, Propositions, and Implications for International Marketers. Journal of International Marketing. https://doi.org/10.1509/jim.16.0021
Chatterjee, S. R. (2016). Rethinking Business Models for Flexible Configuration: Lessons from Disruptive Innovation I at the Bottom of the Pyramid (BOP). In Sushil, J. Connell, & J.
179
Burgess (Eds.), Flexible Work Organizations (pp. 181–193). Springer India. https://doi.org/10.1007/978-81-322-2834-9_12
Chaurey, A., Krithika, P. R., Palit, D., Rakesh, S., & Sovacool, B. K. (2012). New partnerships and business models for facilitating energy access. Energy Policy, 47, 48–55. https://doi.org/10.1016/j.enpol.2012.03.031
Cheeseman, N. (2015). “No Bourgeoisie, No Democracy”? The Political Attitudes of the Kenyan Middle Class: Democracy in the African Middle Class. Journal of International Development, 27(5), 647–664. https://doi.org/10.1002/jid.3057
Chesbrough, H. (2007). Business model innovation: It’s not just about technology anymore. Strategy & Leadership, 35(6), 12–17. https://doi.org/10.1108/10878570710833714
Chesbrough, H. (2010). Business Model Innovation: Opportunities and Barriers. Long Range Planning, 43(2–3), 354–363. https://doi.org/10.1016/j.lrp.2009.07.010
Chesbrough, H., Ahern, S., Finn, M., & Guerraz, S. (2006). Business Models for Technology in the Developing World: The Role of Non-Governmental Organizations. California Management Review, 48(3), 48–61. https://doi.org/10.2307/41166349
Chikweche, T., & Fletcher, R. (2011). Branding at the base of pyramid: A Zimbabwean perspective. Marketing Intelligence & Planning, 29(3), 247–263. https://doi.org/10.1108/02634501111129239
Chikweche, T., & Fletcher, R. (2012). Revisiting the marketing mix at the bottom of pyramid (BOP): From theoretical considerations to practical realities. Journal of Consumer Marketing, 29(7), 507–520. https://doi.org/10.1108/07363761211275018
Chikweche, T., & Fletcher, R. (2014). “Rise of the middle of the pyramid in Africa”: Theoretical and practical realities for understanding middle class consumer purchase decision making. Journal of Consumer Marketing, 31(1), 27–38. https://doi.org/10.1108/JCM-10-2013-0729
Chikweche, T., Stanton, J., & Fletcher, R. (2012). Family purchase decision making at the bottom of the pyramid. Journal of Consumer Marketing, 29(3), 202–213. https://doi.org/10.1108/07363761211221738
Christensen, C. M. (2011). The innovator’s dilemma: The revolutionary book that will change the way you do business ; [with a new preface] (1. Harper Business paperback). Harper Business.
Cohen, A., Zhang, Q., Luo, Q., Tao, Y., Colford, J. M., & Ray, I. (2017). Predictors of Drinking Water Boiling and Bottled Water Consumption in Rural China: A Hierarchical Modeling Approach. Environmental Science & Technology, 51(12), 6945–6956. https://doi.org/10.1021/acs.est.7b01006
Cook, J., Kimuyu, P., & Whittington, D. (2016). The costs of coping with poor water supply in rural Kenya: COPING COSTS OF POOR WATER. Water Resources Research, 52(2), 841–859. https://doi.org/10.1002/2015WR017468
Cunha, M. P. e, Rego, A., Oliveira, P., Rosado, P., & Habib, N. (2014). Product Innovation in Resource-Poor Environments: Three Research Streams: Product Innovation in
180
Resource-Poor Environments. Journal of Product Innovation Management, 31(2), 202–210. https://doi.org/10.1111/jpim.12090
Dahan, N. M., Doh, J. P., Oetzel, J., & Yaziji, M. (2010). Corporate-NGO Collaboration: Co-creating New Business Models for Developing Markets. Long Range Planning, 43(2–3), 326–342. https://doi.org/10.1016/j.lrp.2009.11.003
Dahlberg. (2017). The Untapped Potential of Decentralized Solutions to Provide Safe, Sustainable Drinking Water at Large Scale. www.safewaterentreprises.com
Datta, S., Miranda, J. J., Zoratto, L., Calvo-González, O., Darling, M., & Lorenzana, K. (2015). A behavioral approach to water conservation: Evidence from Costa Rica. The World Bank.
Davies, I. A., & Torrents, A. (2017). Overcoming Institutional Voids in Subsistence Marketplaces: A Zimbabwean Entrepreneurial Case. Journal of Macromarketing, 37(3), 255–267. https://doi.org/10.1177/0276146717698020
Davis, S., & Longoria, T. (2003). Harmonizing your touch points. Brand Packaging, 1. de Queiroz, J. T. M., Doria, M. de F., Rosenberg, M. W., Heller, L., & Zhouri, A. (2013).
Perceptions of bottled water consumers in three Brazilian municipalities. Journal of Water and Health, 11(3), 520–531. https://doi.org/10.2166/wh.2013.222
Deichmann, U., Meisner, C., Murray, S., & Wheeler, D. (2011). The economics of renewable energy expansion in rural Sub-Saharan Africa. Energy Policy, 39(1), 215–227. https://doi.org/10.1016/j.enpol.2010.09.034
Devoto, F., Duflo, E., Dupas, P., Parienté, W., & Pons, V. (2012). Happiness on Tap: Piped Water Adoption in Urban Morocco. American Economic Journal: Economic Policy, 4(4), 68–99. https://doi.org/10.1257/pol.4.4.68
Diallo, M. F., & Siqueira Jr, J. R. (2017). How previous positive experiences with store brands affect purchase intention in emerging countries: A comparison between Brazil and Colombia. International Marketing Review, 34(4), 536–558. https://doi.org/10.1108/IMR-07-2014-0224
Dolan, C., & Roll, K. (2013). Capital’s New Frontier: From “Unusable” Economies to Bottom-of-the-Pyramid Markets in Africa. African Studies Review, 56(3), 123–146.
Dos Santos, S., Adams, E. A., Neville, G., Wada, Y., de Sherbinin, A., Mullin Bernhardt, E., & Adamo, S. B. (2017). Urban growth and water access in sub-Saharan Africa: Progress, challenges, and emerging research directions. Science of The Total Environment, 607–608, 497–508. https://doi.org/10.1016/j.scitotenv.2017.06.157
Drucker, P. F. (2006). Innovation and entrepreneurship: Practice and principles (Reprint). HarperBusiness.
Dupas, P. (2011). Health Behavior in Developing Countries. Annual Review of Economics, 3(1), 425–449. https://doi.org/10.1146/annurev-economics-111809-125029
Easterly, W. (2001). The Middle Class Consensus and Economic Development. Journal of Economic Growth, 6(4), 317–335. https://doi.org/10.1023/A:1012786330095

181
Electricity Regulatory Agency. (2014). Functions of ERA. Electricity Regulatory Agency. http://www.era.or.ug/index.php/about-us/2013-10-15-15-57-40/functions-of-era
Ernst, H., Kahle, H. N., Dubiel, A., Prabhu, J., & Subramaniam, M. (2015). The Antecedents and Consequences of Affordable Value Innovations for Emerging Markets: Affordable Value Innovations for Emerging Markets. Journal of Product Innovation Management, 32(1), 65–79. https://doi.org/10.1111/jpim.12171
Espinosa-García, A. C., Díaz-Ávalos, C., González-Villarreal, F. J., Val-Segura, R., Malvaez-Orozco, V., & Mazari-Hiriart, M. (2015). Drinking Water Quality in a Mexico City University Community: Perception and Preferences. EcoHealth, 12(1), 88–97. https://doi.org/10.1007/s10393-014-0978-z
Francisco, J. P. S. (2014). Why households buy bottled water: A survey of household perceptions in the Philippines: Why households buy bottled water. International Journal of Consumer Studies, 38(1), 98–103. https://doi.org/10.1111/ijcs.12069
FRES. (2018). Foundation Rural Energy Services 2017 Annual Report [Annual Report]. Gebauer, H., Saul, C., Halidmann, M., & Kramer, S. (2017). When one business model is not
enough for a social business. Strategic Direction, 33(1), 10–12. https://doi.org/10.1108/SD-06-2016-0096
Geels, F. W. (2004). From sectoral systems of innovation to socio-technical systems. Research Policy, 33(6–7), 897–920. https://doi.org/10.1016/j.respol.2004.01.015
Gentile, C., Spiller, N., & Noci, G. (2007). How to Sustain the Customer Experience: European Management Journal, 25(5), 395–410. https://doi.org/10.1016/j.emj.2007.08.005
Ger, G., & Belk, R. W. (1996). I’d like to buy the world a coke: Consumptionscapes of the “less affluent world.” Journal of Consumer Policy, 19(3), 271–304. https://doi.org/10.1007/BF00411411
Geroski, P. A. (2000). Models of technology diffusion. Research Policy, 29(4–5), 603–625. https://doi.org/10.1016/S0048-7333(99)00092-X
Golumbeanu, R., & Barnes, D. (2013). Connection Charges and Electricity Access in Sub-Saharan Africa. The World Bank. http://elibrary.worldbank.org/doi/book/10.1596/1813-9450-6511
The Electricity Act, Pub. L. No. 42, 6 Act (1999). http://www.opm.go.ug/assets/media/resources/145/ELECTRICITY%20ACT%201999.pdf
Government of Uganda. (2007). The Renewable Energy Policy for Uganda. Rural Electrification Agency. http://www.rea.or.ug/index.php/policies-and-legislation
Government of Uganda. (2012). Rural Electrification Strategy and Plan 2013-2022 [Government report]. Ministry of Energy and Mineral Development. http://rea.or.ug/phocadownload/rural%20electrification%20strategy%20and%20plan%202013-2022.pdf

182
Goyal, S., & Sergi, B. S. (2015). Creating a formal market ecosystem for base of the pyramid markets—Strategic choices for social embeddedness. International Journal of Business and Globalisation, 15(1), 63. https://doi.org/10.1504/IJBG.2015.070224
Grady, C. A., Kipkorir, E. C., Nguyen, K., & Blatchley, E. R. (2015). Microbial quality of improved drinking water sources: Evidence from western Kenya and southern Vietnam. Journal of Water and Health, 13(2), 607. https://doi.org/10.2166/wh.2014.206
Griffith, D. A., & Jain, S. C. (2011). Handbook of research in international marketing. http://www.elgaronline.com/view/9781849803021.xml
GSMA. (2016). The Mobile Economy Africa 2016. GSMA. http://www.gsma.com/mobileeconomy/africa/
Guarín, A., & Knorringa, P. (2014). New Middle-Class Consumers in Rising Powers: Responsible Consumption and Private Standards. Oxford Development Studies, 42(2), 151–171. https://doi.org/10.1080/13600818.2013.864757
Hahn, R. (2009). The Ethical Rational of Business for the Poor – Integrating the Concepts Bottom of the Pyramid, Sustainable Development, and Corporate Citizenship. Journal of Business Ethics, 84(3), 313–324. https://doi.org/10.1007/s10551-008-9711-6
Hahn, R. (2012). Inclusive business, human rights and the dignity of the poor: A glance beyond economic impacts of adapted business models. Business Ethics: A European Review, 21(1), 47–63. https://doi.org/10.1111/j.1467-8608.2011.01640.x
Hall, J., Matos, S., Sheehan, L., & Silvestre, B. (2012). Entrepreneurship and Innovation at the Base of the Pyramid: A Recipe for Inclusive Growth or Social Exclusion?: Entrepreneurship and Innovation at the BOP. Journal of Management Studies, 49(4), 785–812. https://doi.org/10.1111/j.1467-6486.2012.01044.x
Hall, J., Matos, S. V., & Martin, M. J. C. (2014). Innovation pathways at the Base of the Pyramid: Establishing technological legitimacy through social attributes. Technovation, 34(5–6), 284–294. https://doi.org/10.1016/j.technovation.2013.12.003
Halme, M., Lindeman, S., & Linna, P. (2012). Innovation for Inclusive Business: Intrapreneurial Bricolage in Multinational Corporations: Intrapreneurial Bricolage in Multinational Corporations. Journal of Management Studies, 49(4), 743–784. https://doi.org/10.1111/j.1467-6486.2012.01045.x
Henrich, J. (2001). Cultural Transmission and the Diffusion of Innovations: Adoption Dynamics Indicate That Biased Cultural Transmission Is the Predominate Force in Behavioral Change. American Anthropologist, 103(4), 992–1013. https://doi.org/10.1525/aa.2001.103.4.992
Herrera, V. (2019). Reconciling global aspirations and local realities: Challenges facing the Sustainable Development Goals for water and sanitation. World Development, 118, 106–117. https://doi.org/10.1016/j.worlddev.2019.02.009
Hossain, M. (2016). Frugal Innovation: A Systematic Literature Review. Available at SSRN. Hossain, M. (2017). Mapping the frugal innovation phenomenon. Technology in Society, 51,
199–208. https://doi.org/10.1016/j.techsoc.2017.09.006

183
Hossain, M. (2018). Frugal innovation: A review and research agenda. Journal of Cleaner Production, 182, 926–936. https://doi.org/10.1016/j.jclepro.2018.02.091
Hossain, M., Simula, H., & Halme, M. (2016). Can frugal go global? Diffusion patterns of frugal innovations. Technology in Society, 46, 132–139. https://doi.org/10.1016/j.techsoc.2016.04.005
Howell, R. (2014). Harnessing Solar Power for Productive Use [Delft University of Technology]. http://resolver.tudelft.nl/uuid:7adc1bdb-88a6-4908-b4f5-b20c403ebb53
Howell, R., Sinha, K. M., Wagner, N., Doorn, N., & van Beers, C. (2020). Consumption of Bottled Water at the Bottom of the Pyramid: Who Purchases First? Journal of Macromarketing, 40(1), 31–50. https://doi.org/10.1177/0276146719866890
Howell, R., van Beers, C., & Doorn, N. (2017). Value capture and value creation: The role of information technology in business models for frugal innovations in Africa. Technological Forecasting and Social Change. https://doi.org/10.1016/j.techfore.2017.09.030
Hyvärinen, A., Keskinen, M., & Varis, O. (2016). Potential and Pitfalls of Frugal Innovation in the Water Sector: Insights from Tanzania to Global Value Chains. Sustainability, 8(9), 888. https://doi.org/10.3390/su8090888
IEA. (2014). Africa Energy Outlook: A focus on energy prospects in Sub-Saharan Africa. International Energy Agency IEA.
Ihtiyar, A., Barut, M., & Ihtiyar, H. G. (2019). Experiential marketing, social judgements, and customer shopping experience in emerging markets. Asia Pacific Journal of Marketing and Logistics, 31(2), 499–515. https://doi.org/10.1108/APJML-02-2018-0081
Jack, W., & Suri, T. (2011). Mobile Money: The Economics of M-PESA. National Bureau of Economic Research. https://doi.org/10.3386/w16721
Jagadale, S. R., Kadirov, D., & Chakraborty, D. (2018). Tackling the Subaltern Quandary: Marketing Systems of Dignity. Journal of Macromarketing, 38(1), 91–111. https://doi.org/10.1177/0276146717740680
Jaiswal, A. K., & Gupta, S. (2015). The influence of marketing on consumption behavior at the bottom of the pyramid. Journal of Consumer Marketing, 32(2), 113–124. https://doi.org/10.1108/JCM-05-2014-0996
K. Ojha, A. (2014). MNCs in India: Focus on frugal innovation. Journal of Indian Business Research, 6(1), 4–28. https://doi.org/10.1108/JIBR-12-2012-0123
Kaijuka, E. (2007). GIS and rural electricity planning in Uganda. Journal of Cleaner Production, 15(2), 203–217. https://doi.org/10.1016/j.jclepro.2005.11.057
Kang, M., Kawasaki, M., Tamada, S., Kamei, T., & Magara, Y. (2000). Effect of pH on the removal of arsenic and antimony using reverse osmosis membranes. Desalination, 131(1-3), 293-298.
Kaplinsky, R. (2011). Schumacher meets Schumpeter: Appropriate technology below the radar. Research Policy : Policy, Management and Economic Studies of Science, Technology and Innovation, 40(2, (3)), 193–203.

184
Kaplinsky, R. (2013). What Contribution Can China Make to Inclusive Growth in Sub-Saharan Africa?: China and Inclusive Growth in Sub-Saharan Africa. Development and Change, 44(6), 1295–1316. https://doi.org/10.1111/dech.12059
Kaplinsky, R., McCormick, D., & Morris, M. (2007). The impact of China on sub-Saharan Africa.
Karekezi, S., & Kimani, J. (2004). Have power sector reforms increased access to electricity among the poor in East Africa? Energy for Sustainable Development, 8(4), 10–25. https://doi.org/10.1016/S0973-0826(08)60510-4
Karlan, D., & Appel, J. (2014). More than good intentions improving the ways the world’s poor borrow, save, farm, learn, and stay healthy. Plume. http://rbdigital.oneclickdigital.com
Karnani, A. (2007). The Mirage of Marketing to the Bottom of the Pyramid: How the Private Sector Can Help Alleviate Poverty. California Management Review, 49(4), 90–111. https://doi.org/10.2307/41166407
Karnani, A. (2009). Romanticising the poor harms the poor. Journal of International Development, 21(1), 76–86. https://doi.org/10.1002/jid.1491
Kenya National Bureau of Statistics, Ministry of Health/Kenya, National AIDS Control Council/Kenya, Kenya Medical Research Institute, & National Council for Population and Development/Kenya. (2015). Kenya Demographic and Health Survey 2014. http://dhsprogram.com/pubs/pdf/FR308/FR308.pdf
Khanna, T., Palepu, K. G., & Sinha, J. (2005). Strategies that fit emerging markets. Harvard Business Review, 83(6), 63–74, 76, 148.
Kharas, H. (2010). The Emerging Middle Class in Developing Countries (OECD Development Centre Working Papers No. 285). https://doi.org/10.1787/5kmmp8lncrns-en
Knorringa, P., Peša, I., Leliveld, A., & van Beers, C. (2016). Frugal Innovation and Development: Aides or Adversaries? The European Journal of Development Research, 28(2), 143–153. https://doi.org/10.1057/ejdr.2016.3
Kodila-Tedika, O., Asongu, S. A., & Kayembe, J. M. (2016). Middle Class in Africa: Determinants and Consequences. International Economic Journal, 30(4), 527–549. https://doi.org/10.1080/10168737.2016.1204340
Kolk, A., Rivera-Santos, M., & Rufin, C. (2014). Reviewing a Decade of Research on the “Base/Bottom of the Pyramid” (BOP) Concept. Business & Society, 53(3), 338–377. https://doi.org/10.1177/0007650312474928
Kotler, P., Roberto, N., & Leisner, T. (2006). Alleviating Poverty: A Macro/Micro Marketing Perspective. Journal of Macromarketing, 26(2), 233–239. https://doi.org/10.1177/0276146706291039
Kranzbühler, A.-M., Kleijnen, M. H. P., Morgan, R. E., & Teerling, M. (2018). The Multilevel Nature of Customer Experience Research: An Integrative Review and Research Agenda: Customer Experience Research. International Journal of Management Reviews, 20(2), 433–456. https://doi.org/10.1111/ijmr.12140
185
Kremer, M., Leino, J., Miguel, E., & Zwane, A. P. (2011). Spring Cleaning: Rural Water Impacts, Valuation, and Property Rights Institutions*. The Quarterly Journal of Economics, 126(1), 145–205. https://doi.org/10.1093/qje/qjq010
Lancaster, K. J. (1966). A New Approach to Consumer Theory. Journal of Political Economy, 74(2), 132–157. https://doi.org/10.1086/259131
Lange, H., & Meier, L. (Eds.). (2009). The new middle classes: Globalizing lifestyles, consumerism and environmental concern. Springer.
Lapworth, D., Stuart, M., Pedley, S., Nkhuwa, D., & Tijani, M. (2017). A review of urban groundwater use and water quality challenges in Sub-Saharan Africa.
Lee, K., Brewer, E., Christiano, C., Meyo, F., Miguel, E., Podolsky, M., Rosa, J., & Wolfram, C. (2016). Electrification for “Under Grid” households in Rural Kenya. Development Engineering, 1, 26–35. https://doi.org/10.1016/j.deveng.2015.12.001
Lee, K., Miguel, E., & Wolfram, C. (2018). Experimental evidence on the economics of rural electrification. University of California, Berkeley, NBER, and Energy Institute at the University of Chicago, Http://Www. Catherine-Wolfram. Com/Uploads/8/2/2/7/82274768/Repp-Jpe_2018-01-31-Final. Pdf.
Lee, L. Y.-T. (2013). Household energy mix in Uganda. Energy Economics, 39, 252–261. https://doi.org/10.1016/j.eneco.2013.05.010
Levänen, J., Hossain, M., Lyytinen, T., Hyvärinen, A., Numminen, S., & Halme, M. (2015). Implications of Frugal Innovations on Sustainable Development: Evaluating Water and Energy Innovations. Sustainability, 8(1), 4. https://doi.org/10.3390/su8010004
London, T., Anupindi, R., & Sheth, S. (2010). Creating mutual value: Lessons learned from ventures serving base of the pyramid producers. Journal of Business Research, 63(6), 582–594. https://doi.org/10.1016/j.jbusres.2009.04.025
López-Calva, L. F., & Ortiz-Juarez, E. (2014). A vulnerability approach to the definition of the middle class. The Journal of Economic Inequality, 12(1), 23–47. https://doi.org/10.1007/s10888-012-9240-5
Luoto, J., Levine, D., & Albert, J. (2011). Information and Persuasion: Achieving Safe Water Behaviors in Kenya. SSRN Electronic Journal. https://doi.org/10.2139/ssrn.1980292
Luoto, J., Levine, D., Albert, J., & Luby, S. (2014). Nudging to use: Achieving safe water behaviors in Kenya and Bangladesh. Journal of Development Economics, 110, 13–21. https://doi.org/10.1016/j.jdeveco.2014.02.010
Lüthje, C., Herstatt, C., & Von Hippel, E. (2005). User-innovators and “local” information: The case of mountain biking. Research Policy, 34(6), 951–965.
Madubansi, M., & Shackleton, C. M. (2006). Changing energy profiles and consumption patterns following electrification in five rural villages, South Africa. Energy Policy, 34(18), 4081–4092. https://doi.org/10.1016/j.enpol.2005.10.011
Mair, J., & Marti, I. (2009). Entrepreneurship in and around institutional voids: A case study from Bangladesh. Journal of Business Venturing, 24(5), 419–435. https://doi.org/10.1016/j.jbusvent.2008.04.006

186
Makokha, M. Groundwater Quality Analyses along Kenyan Coastal Region, Case Study of Kilifi County. International Journal of Environment and Geoinformatics, 6(1), 1-14. https://doi.org/10.30897/ijegeo.466933
Marinakis, Y. D., Walsh, Prof. dr S. T., & Harms, dr. R. (2016). Catalyzing new product adoption at the base of the pyramid (public). 775–794. http://doc.utwente.nl/101405/
Marson, M., & Savin, I. (2015). Ensuring Sustainable Access to Drinking Water in Sub Saharan Africa: Conflict Between Financial and Social Objectives. World Development, 76, 26–39. https://doi.org/10.1016/j.worlddev.2015.06.002
Martinot, E., Chaurey, A., Lew, D., Moreira, J. R., & Wamukonya, N. (2002). RENEWABLE ENERGY MARKETS IN DEVELOPING COUNTRIES*. Annual Review of Energy and the Environment, 27(1), 309–348. https://doi.org/10.1146/annurev.energy.27.122001.083444
Mawejje, J., Munyambonera, E., & Bategeka, L. (2012). Uganda’s Electricity Sector Reforms and Institutional Restructuring. Economic Policy Research Centre Research Series, 89. http://ideas.repec.org/p/ags/eprcrs/150239.html
McEwan, C., Hughes, A., & Bek, D. (2015). Theorising middle class consumption from the global South: A study of everyday ethics in South Africa’s Western Cape. Geoforum, 67, 233–243. https://doi.org/10.1016/j.geoforum.2015.02.011
Meagher, K. (2018). Cannibalizing the Informal Economy: Frugal Innovation and Economic Inclusion in Africa. The European Journal of Development Research, 30(1), 17–33. https://doi.org/10.1057/s41287-017-0113-4
Melber, H., & Nordiska Afrikainstitutet (Eds.). (2016). The rise of Africa’s middle class: Myths, realities and critical engagements. Zed Books.
Meyer, R., Eberhard, A., & Gratwick, K. (2018). Uganda’s power sector reform: There and back again? Energy for Sustainable Development, 43, 75–89. https://doi.org/10.1016/j.esd.2017.11.001
Miller, D. (2009). Selling solar: The diffusion of renewable energy in emerging markets. Earthscan.
Ministry of Water and Irrigation. (2017). Water Boards. Ministry of Water and Irrigation. http://www.water.go.ke/?page_id=57
Moner-Girona, M., Solano-Peralta, M., Lazopoulou, M., Ackom, E. K., Vallve, X., & Szabó, S. (2018). Electrification of Sub-Saharan Africa through PV/hybrid mini-grids: Reducing the gap between current business models and on-site experience. Renewable and Sustainable Energy Reviews, 91, 1148–1161. https://doi.org/10.1016/j.rser.2018.04.018
Montgomery, N., Peredo, A., & Carlson, E. (2012). The BOP Discourse as Capitalist Hegemony. Academy of Management Proceedings, 2012(1), 14505. https://doi.org/10.5465/AMBPP.2012.274
Moser, S., & Mosler, H.-J. (2008). Differences in influence patterns between groups predicting the adoption of a solar disinfection technology for drinking water in Bolivia. Social Science & Medicine, 67(4), 497–504. https://doi.org/10.1016/j.socscimed.2008.04.002

187
Moyo, D. (2009). Dead Aid: Why Aid Is Not Working and How There Is a Better Way for Africa (First American Edition). Farrar, Straus and Giroux. http://gen.lib.rus.ec/book/index.php?md5=7c0be8ebcb61124c6c65559b2fd57b09
Munir, K., Ansari, S., & Gregg, T. (2010). Beyond the hype: Taking business strategy to the “bottom of the pyramid.” In B. Joel A.C. & J. Lampel (Eds.), The Globalization of Strategy Research (Vol. 27, pp. 247–276). Emerald Group Publishing Limited. http://www.emeraldinsight.com/doi/abs/10.1108/S0742-3322%282010%290000027012
Murphy, P. M., Twaha, S., & Murphy, I. S. (2014). Analysis of the cost of reliable electricity: A new method for analyzing grid connected solar, diesel and hybrid distributed electricity systems considering an unreliable electric grid, with examples in Uganda. Energy, 66, 523–534. https://doi.org/10.1016/j.energy.2014.01.020
Myers, N., & Kent, J. (2003). New consumers: The influence of affluence on the environment. Proceedings of the National Academy of Sciences, 100(8), 4963–4968. https://doi.org/10.1073/pnas.0438061100
Nakata, C., & Weidner, K. (2012). Enhancing New Product Adoption at the Base of the Pyramid: A Contextualized Model: New Product Adoption at the BOP. Journal of Product Innovation Management, 29(1), 21–32. https://doi.org/10.1111/j.1540-5885.2011.00876.x
Narayan, N., Vega-Garita, V., Qin, Z., Popovic-Gerber, J., Bauer, P., & Zeman, M. (2020). The Long Road to Universal Electrification: A Critical Look at Present Pathways and Challenges. Energies, 13(3), 508. https://doi.org/10.3390/en13030508
Nari Kahle, H., Dubiel, A., Ernst, H., & Prabhu, J. (2013). The democratizing effects of frugal innovation: Implications for inclusive growth and state-building. Journal of Indian Business Research, 5(4), 220–234. https://doi.org/10.1108/JIBR-01-2013-0008
National Institute of Statistics of Rwanda, Ministry of Finance and Economic Planning/Rwanda, Ministry of Health/Rwanda, & ICF International. (2016). Rwanda Demographic and Health Survey 2014-15. National Institute of Statistics of Rwanda, Ministry of Finance and Economic Planning/Rwanda, Ministry of Health/Rwanda, and ICF International. http://dhsprogram.com/pubs/pdf/FR316/FR316.pdf
Nocera, D. G. (2012). Can We Progress from Solipsistic Science to Frugal Innovation? Daedalus, 141(3), 45–52. https://doi.org/10.1162/DAED_a_00160
Nordhaus, W. D. (2007). Two Centuries of Productivity Growth in Computing. The Journal of Economic History, 67(01). https://doi.org/10.1017/S0022050707000058
Null, C., Kremer, M., Miguel, E., Hombrados, J. G., Meeks, R., & Zwane, A. P. (2012). Willingness to pay for cleaner water in less developed countries: Systematic review of experimental evidence. The International Initiative for Impact Evaluation (3iE).
Numminen, S., & Lund, P. D. (2017). Frugal energy innovations for developing countries - a framework: Frugal Energy Innovations for Developing Countries. Global Challenges, 1(1), 9–19. https://doi.org/10.1002/gch2.1012

188
Numminen, S., Lund, P. D., Yoon, S., & Urpelainen, J. (2018). Power availability and reliability of solar pico-grids in rural areas: A case study from northern India. Sustainable Energy Technologies and Assessments, 29, 147–154. https://doi.org/10.1016/j.seta.2018.08.005
Onjala, J., Ndiritu, S. W., & Stage, J. (2014). Risk perception, choice of drinking water and water treatment: Evidence from Kenyan towns. Journal of Water, Sanitation and Hygiene for Development, 4(2), 268. https://doi.org/10.2166/washdev.2014.131
Ordabayeva, N., & Chandon, P. (2011). Getting Ahead of the Joneses: When Equality Increases Conspicuous Consumption among Bottom-Tier Consumers. Journal of Consumer Research, 38(1), 27–41. https://doi.org/10.1086/658165
Pansera, M., & Owen, R. (2015). Framing resource-constrained innovation at the ‘bottom of the pyramid’: Insights from an ethnographic case study in rural Bangladesh. Technological Forecasting and Social Change, 92, 300–311. https://doi.org/10.1016/j.techfore.2014.10.004
Pansera, M., & Sarkar, S. (2016). Crafting Sustainable Development Solutions: Frugal Innovations of Grassroots Entrepreneurs. Sustainability, 8(1), 51. https://doi.org/10.3390/su8010051
Papaioannou, T. (2014). How inclusive can innovation and development be in the twenty-first century? Innovation and Development, 4(2), 187–202. https://doi.org/10.1080/2157930X.2014.921355
Patsiaouras, G., Saren, M., & Fitchett, J. A. (2015). The Marketplace of Life? An Exploratory Study of the Commercialization of Water Resources through the Lens of Macromarketing. Journal of Macromarketing, 35(1), 23–35. https://doi.org/10.1177/0276146714538454
Peiffer, C., & Englebert, P. (2012). Extraversion, vulnerability to donors, and political liberalization in Africa. African Affairs, 111(444), 355–378. https://doi.org/10.1093/afraf/ads029
Peletz, R., Kumpel, E., Bonham, M., Rahman, Z., & Khush, R. (2016). To What Extent is Drinking Water Tested in Sub-Saharan Africa? A Comparative Analysis of Regulated Water Quality Monitoring. International Journal of Environmental Research and Public Health, 13(3), 275. https://doi.org/10.3390/ijerph13030275
Pervez, T., Maritz, A., & De Waal, A. (2013). Innovation and social entrepreneurship at the bottom of the pyramid-A conceptual framework. South African Journal of Economic and Management Sciences, 16(5), 54–66.
Peša, I. (2015). Homegrown or Imported? Frugal Innovation and Local Economic Development in Zambia. Southern African Journal of Policy and Development, 2(1), 15–25.
Peša, I. (2017). Sawdust pellets, micro gasifying cook stoves and charcoal in urban Zambia: Understanding the value chain dynamics of improved cook stove initiatives. Sustainable Energy Technologies and Assessments. https://doi.org/10.1016/j.seta.2017.02.010
Piacentini, M., & Hamilton, K. (2013). Consumption lives at the bottom of the pyramid. Marketing Theory, 13(3), 397–400. https://doi.org/10.1177/1470593113489195

189
Pisoni, A., Michelin, L., & Martignoni, G. (2018). Frugal approach to innovation: State of the art and future perspectives. Journal of Cleaner Production, 171, 107–126. https://doi.org/10.1016/j.jclepro.2017.09.248
Prahalad, C. K. (2005). The fortune at the bottom of the pyramid. Wharton School Publishing. Prahalad, C. K. (2012). Bottom of the Pyramid as a Source of Breakthrough Innovations: BOP
as Source of Innovations. Journal of Product Innovation Management, 29(1), 6–12. https://doi.org/10.1111/j.1540-5885.2011.00874.x
Prahalad, C.K., & Ramaswamy, V. (2004). Co-creation experiences: The next practice in value creation. Journal of Interactive Marketing, 18(3), 5–14. https://doi.org/10.1002/dir.20015
Prahalad, Coimbatore K, & Hammond, A. (2002). Serving the world’s poor, profitably. Harvard Business Review, 80(9), 48–59.
Priem, R. L. (2007). A Consumer Perspective On Value Creation. Academy of Management Review, 32(1), 219–235. https://doi.org/10.5465/AMR.2007.23464055
Priem, R. L., Li, S., & Carr, J. C. (2012). Insights and New Directions from Demand-Side Approaches to Technology Innovation, Entrepreneurship, and Strategic Management Research. Journal of Management, 38(1), 346–374. https://doi.org/10.1177/0149206311429614
Prime, M. S., Bhatti, Y. A., Harris, M., & Darzi, A. (2016). Frugal Innovations for Healthcare: A Toolkit for Innovators. Academy of Management Proceedings, 2016(1), 12622. https://doi.org/10.5465/ambpp.2016.12622abstract
Quansah, F., Okoe, A., & Angenu, B. (2015). Factors Affecting Ghanaian Consumers’ Purchasing Decision of Bottled Water. International Journal of Marketing Studies, 7(5). https://doi.org/10.5539/ijms.v7n5p76
Radjou, N., & Prabhu, J. C. (2014). Frugal innovation: How to do more with less (First edition). PublicAffairs.
Rahman, M., Hasan, M. R., & Floyd, D. (2013). Brand Orientation as a Strategy That Influences the Adoption of Innovation in the Bottom of the Pyramid Market. Strategic Change, 22(3–4), 225–239. https://doi.org/10.1002/jsc.1935
Ramani, S. V., & Mukherjee, V. (2014). Can breakthrough innovations serve the poor (bop) and create reputational (CSR) value? Indian case studies. Technovation, 34(5–6), 295–305. https://doi.org/10.1016/j.technovation.2013.07.001
Ramani, S. V., SadreGhazi, S., & Duysters, G. (2012). On the diffusion of toilets as bottom of the pyramid innovation: Lessons from sanitation entrepreneurs. Technological Forecasting and Social Change, 79(4), 676–687. https://doi.org/10.1016/j.techfore.2011.06.007
Rao, B. C. (2013). How disruptive is frugal? Technology in Society, 35(1), 65–73. https://doi.org/10.1016/j.techsoc.2013.03.003
Ratchford, B. T. (2001). The Economics of Consumer Knowledge: Table 1. Journal of Consumer Research, 27(4), 397–411. https://doi.org/10.1086/319617

190
Rathi, S. S., & Chunekar, A. (2015). Not to buy or can be ‘nudged’ to buy? Exploring behavioral interventions for energy policy in India. Energy Research & Social Science, 7, 78–83. https://doi.org/10.1016/j.erss.2015.03.006
Ravallion, M. (2010). The Developing World’s Bulging (but Vulnerable) Middle Class. World Development, 38(4), 445–454. https://doi.org/10.1016/j.worlddev.2009.11.007
Ravishankar, M. N. (2016). A Bricolage Perspective on Technological Innovation in Emerging Markets. IEEE Transactions on Engineering Management, 63(1), 53–66. https://doi.org/10.1109/TEM.2015.2494501
Ray, S., & Kanta Ray, P. (2011). Product innovation for the people’s car in an emerging economy. Technovation, 31(5–6), 216–227. https://doi.org/10.1016/j.technovation.2011.01.004
Renewable Energy Investment Guide. (2012). GIZ, Kingdom of the Netherlands. Ritter, M., Velcine, C., Camille, E., Lantagne, D., & Guillaume, R.-K. (2017). Optimizing
Household Chlorination Marketing Strategies: A Randomized Controlled Trial on the Effect of Price and Promotion on Adoption in Haiti. The American Journal of Tropical Medicine and Hygiene, 97(1), 271–280. https://doi.org/10.4269/ajtmh.16-0820
Rosca, E., Arnold, M., & Bendul, J. C. (2016). Business models for sustainable innovation – an empirical analysis of frugal products and services. Journal of Cleaner Production. https://doi.org/10.1016/j.jclepro.2016.02.050
Rosca, E., Reedy, J., & Bendul, J. C. (2018). Does Frugal Innovation Enable Sustainable Development? A Systematic Literature Review. The European Journal of Development Research, 30(1), 136–157. https://doi.org/10.1057/s41287-017-0106-3
Rural Electrification Agency. (2012). Annual Rural Electrification Report 2011/12. Rural Electrification Agency Uganda.
Schlogl, L., & Sumner, A. (2014). How middle class are the ‘emerging middle’or ‘scooter class’ in Indonesia? A household asset approach to social stratification. Department of Economics, Padjadjaran University.
Schmitt, B. (1999). Experiential Marketing. Journal of Marketing Management, 15(1–3), 53–67. https://doi.org/10.1362/026725799784870496
Schmitt, B. (2010). Experience Marketing: Concepts, Frameworks and Consumer Insights. Foundations and Trends® in Marketing, 5(2), 55–112. https://doi.org/10.1561/1700000027
Schmitt, B., Joško Brakus, J., & Zarantonello, L. (2015). From experiential psychology to consumer experience. Journal of Consumer Psychology, 25(1), 166–171. https://doi.org/10.1016/j.jcps.2014.09.001
Schuster, T., & Holtbrügge, D. (2012). Market entry of multinational companies in markets at the bottom of the pyramid: A learning perspective. International Business Review, 21(5), 817–830. https://doi.org/10.1016/j.ibusrev.2011.09.007

191
Seelos, C., & Mair, J. (2007). Profitable Business Models and Market Creation in the Context of Deep Poverty: A Strategic View. Academy of Management Perspectives, 21(4), 49–63. https://doi.org/10.5465/AMP.2007.27895339
Sekantsi, L. P., & Okot, N. (2016). Electricity consumption–economic growth nexus in Uganda. Energy Sources, Part B: Economics, Planning, and Policy, 11(12), 1144–1149. https://doi.org/10.1080/15567249.2015.1010022
Sen, A. (2001). Development as freedom (12331845). Oxford University Press. http://www.loc.gov/catdir/toc/fy02/2001274375.html
Sengendo, M. (2001). Photovoltaic Project for Rural Electrification-Uganda. ENERGIA News, 4(3). http://www.energia.org/fileadmin/files/media/EN112001_sengendo.pdf
Shan, J., & Khan, M. (2016). Implications of Reverse Innovation for Socio-Economic Sustainability: A Case Study of Philips China. Sustainability, 8(6), 530. https://doi.org/10.3390/su8060530
Shaw, C., & Ivens, J. (2002). Building great customer experiences (Vol. 241). Springer. Sheth, J. N. (2011). Impact of Emerging Markets on Marketing: Rethinking Existing
Perspectives and Practices. Journal of Marketing, 75(4), 166–182. https://doi.org/10.1509/jmkg.75.4.166
Shimeles, A., & Ncube, M. (2015). The Making of the Middle-Class in Africa: Evidence from DHS Data. The Journal of Development Studies, 51(2), 178–193. https://doi.org/10.1080/00220388.2014.968137
Silvestre, B. S., & Neto, R. e S. (2014). Capability accumulation, innovation, and technology diffusion: Lessons from a Base of the Pyramid cluster. Technovation, 34(5–6), 270–283. https://doi.org/10.1016/j.technovation.2013.09.007
Simanis, E., Hart, S., DeKoszmovszky, J., Donohue, P., Duke, D., & Enk, G. (2008). BoP Protocol: Toward Next Generation BOP Strategy. Ann Arbor, University of Michigan.
Simanis, Eric, & Hart, S. (2008). Beyond selling to the poor: Building business intimacy through embedded innovation.
Simanis, Erik. (2011). Needs, needs, everywhere, but not a BoP market to tap. Next Generation Business Strategies for the Base of the Pyramid, 103–126.
Simester, D. (2017). Field Experiments in Marketing. In Handbook of Economic Field Experiments (Vol. 1, pp. 465–497). Elsevier. https://doi.org/10.1016/bs.hefe.2016.07.001
Simula, H., Hossain, M., & Halme, M. (2015). Frugal and Reverse Innovations-Quo Vadis? Henri Simula, Mokter Hossain, Minna Halme," Frugal and Reverse Innovations-Quo Vadis.
Singh, R., Gupta, V., & Mondal, A. (2012). Jugaad—From ‘Making Do’ and ‘Quick Fix’ to an Innovative, Sustainable and Low-Cost Survival Strategy at the Bottom of the Pyramid. International Journal of Rural Management, 8(1–2), 87–105. https://doi.org/10.1177/0973005212461995
192
Smilansky, S. (2009). Experiential marketing: A practical guide to interactive brand experiences. Kogan Page.
Smith, R. E., & Swinyard, W. R. (1983). Attitude-Behavior Consistency: The Impact of Product Trial versus Advertising. Journal of Marketing Research, 20(3), 257. https://doi.org/10.2307/3151829
Smith, S. M., & Beatty, S. E. (1987). External Search Effort: An Investigation Across Several Product Categories. Journal of Consumer Research, 14(1), 83–95. https://doi.org/10.1086/209095
Solimano, A. (2008). The middle class and the development process. ECLAC. Sovacool, B. K. (2011). Conceptualizing urban household energy use: Climbing the “Energy
Services Ladder.” Energy Policy, 39(3), 1659–1668. https://doi.org/10.1016/j.enpol.2010.12.041
Stead, M., MacKintosh, A. M., Findlay, A., Sparks, L., Anderson, A. S., Barton, K., & Eadie, D. (2017). Impact of a targeted direct marketing price promotion intervention (Buywell) on food-purchasing behavior by low income consumers: A randomized controlled trial. Journal of Human Nutrition and Dietetics, 30(4), 524–533. https://doi.org/10.1111/jhn.12441
Suberu, M. Y., Mustafa, M. W., Bashir, N., Muhamad, N. A., & Mokhtar, A. S. (2013). Power sector renewable energy integration for expanding access to electricity in sub-Saharan Africa. Renewable and Sustainable Energy Reviews, 25, 630–642. https://doi.org/10.1016/j.rser.2013.04.033
Subrahmanyan, S., & Tomas Gomez‐Arias, J. (2008). Integrated approach to understanding consumer behavior at bottom of pyramid. Journal of Consumer Marketing, 25(7), 402–412. https://doi.org/10.1108/07363760810915617
Thompson, J. D., & MacMillan, I. C. (2010). Business Models: Creating New Markets and Societal Wealth. Long Range Planning, 43(2–3), 291–307. https://doi.org/10.1016/j.lrp.2009.11.002
Thurlow, J., Resnick, D., & Ubogu, D. (2015). Matching Concepts With Measurement: Who Belongs to Africa’s Middle Class?: Who Belongs to Africa’s Middle Class? Journal of International Development, 27(5), 588–608. https://doi.org/10.1002/jid.3105
Tiwari, R., Fischer, L., & Kalogerakis, K. (2017). Frugal Innovation: An Assessment of Scholarly Discourse, Trends and Potential Societal Implications. In C. Herstatt & R. Tiwari (Eds.), Lead Market India (pp. 13–35). Springer International Publishing. http://link.springer.com/10.1007/978-3-319-46392-6_2
Tiwari, R., & Herstatt, C. (2012). Frugal innovation: A global networks’ perspective. Die Unternehmung : Swiss Journal of Business Research and Practice ; Organ Der Schweizerischen Gesellschaft Für Betriebswirtschaft (SGB), 66(3), 245–274.
Tiwari, R., Kalogerakis, K., & Herstatt, C. (2014). Frugal innovation and analogies some propositions for product development in emerging economies. http://nbn-resolving.de/urn:nbn:de:gbv:830-tubdok-12735

193
Tsaneva, M. (2013). The Effect of Risk Preferences on Household Use of Water Treatment. Journal of Development Studies, 49(10), 1427–1435. https://doi.org/10.1080/00220388.2013.790960
Ulsrud, K., Winther, T., Palit, D., & Rohracher, H. (2015). Village-level solar power in Africa: Accelerating access to electricity services through a socio-technical design in Kenya. Energy Research & Social Science, 5, 34–44. https://doi.org/10.1016/j.erss.2014.12.009
Umeme. (2019). Q3 2019 Umeme tariffs. https://www.umeme.co.ug/tariffs UNDP. (2008). Creating value for all: Strategies for doing business with the poor. Urpelainen, J., & Yoon, S. (2016). Solar products for poor rural communities as a business:
Lessons from a successful project in Uttar Pradesh, India. Clean Technologies and Environmental Policy, 18(2), 617–626. https://doi.org/10.1007/s10098-015-1028-4
Üstüner, T., & Holt, D. B. (2010). Toward a Theory of Status Consumption in Less Industrialized Countries: Table 1. Journal of Consumer Research, 37(1), 37–56. https://doi.org/10.1086/649759
van Beers, C., Knorringa, P., & Leliveld, A. (2012). 4 Frugal innovation in Africa: Tracking Unilever’s washing-powder sachets. In J.-B. Gewald, A. Leliveld, & I. Peša (Eds.), Transforming Innovations in Africa. BRILL. https://doi.org/10.1163/9789004245440_005
van de Giesen, N., Hut, R., & Selker, J. (2014). The Trans-African Hydro-Meteorological Observatory (TAHMO): The Trans-African Hydro-Meteorological Observatory. Wiley Interdisciplinary Reviews: Water, n/a-n/a. https://doi.org/10.1002/wat2.1034
Vásquez, W. F. (2017). Understanding bottled water consumption in a high-poverty context: Empirical evidence from a small town in Guatemala: Understanding bottled water consumption. International Journal of Consumer Studies, 41(2), 199–206. https://doi.org/10.1111/ijcs.12327
Vásquez, W. F., Mozumder, P., Hernández-Arce, J., & Berrens, R. P. (2009). Willingness to pay for safe drinking water: Evidence from Parral, Mexico. Journal of Environmental Management, 90(11), 3391–3400. https://doi.org/10.1016/j.jenvman.2009.05.009
Veblen, T. (1899). The Theory of the Leisure Class. History of Economic Thought Books. Viswanathan, M., Jung, K., Venugopal, S., Minefee, I., & Jung, I. W. (2014). Subsistence and
Sustainability: From Micro-Level Behavioral Insights to Macro-Level Implications on Consumption, Conservation, and the Environment. Journal of Macromarketing, 34(1), 8–27. https://doi.org/10.1177/0276146713499351
Viswanathan, M., & Rosa, J. A. (2010). Understanding subsistence marketplaces: Toward sustainable consumption and commerce for a better world. Journal of Business Research, 63(6), 535–537. https://doi.org/10.1016/j.jbusres.2009.06.001
von Zedtwitz, M., Corsi, S., Søberg, P. V., & Frega, R. (2015). A Typology of Reverse Innovation: A Typology of Reverse Innovation. Journal of Product Innovation Management, 32(1), 12–28. https://doi.org/10.1111/jpim.12181

194
Water Services Regulatory Board. (2014). Water Tariffs. WASREB. http://wasreb.go.ke/tariffs/index.php?wsp=5
Weyrauch, T., & Herstatt, C. (2017). What is frugal innovation? Three defining criteria. Journal of Frugal Innovation, 2(1). https://doi.org/10.1186/s40669-016-0005-y
Wheary, J. (2005). Measuring the middle: Assessing what it takes to be middle class. Dēmos. White, H. (2014). Current Challenges in Impact Evaluation. The European Journal of
Development Research, 26(1), 18–30. https://doi.org/10.1057/ejdr.2013.45 Whittington, D., Briscoe, J., Mu, X., & Barron, W. (1990). Estimating the Willingness to Pay
for Water Services in Developing Countries: A Case Study of the Use of Contingent Valuation Surveys in Southern Haiti. Economic Development and Cultural Change, 38(2), 293–311. https://doi.org/10.1086/451794
WHO/UNICEF Joint Water Supply and Sanitation Monitoring Programme, World Health Organization, & UNICEF. (2015). Progress on sanitation and drinking water.
Wietzke, F.-B., & Sumner, A. (2018). The Developing World’s “New Middle Classes”: Implications for Political Research. Perspectives on Politics, 16(01), 127–140. https://doi.org/10.1017/S1537592717003358
Winterhalter, S., Zeschky, M. B., & Gassmann, O. (2015). Managing dual business models in emerging markets: An ambidexterity perspective: Managing dual business models in emerging markets. R&D Management, n/a-n/a. https://doi.org/10.1111/radm.12151
Winterhalter, S., Zeschky, M. B., Neumann, L., & Gassmann, O. (2017). Business Models for Frugal Innovation in Emerging Markets: The Case of the Medical Device and Laboratory Equipment Industry. Technovation. https://doi.org/10.1016/j.technovation.2017.07.002
Wolde-Rufael, Y. (2005). Energy demand and economic growth: The African experience. Journal of Policy Modeling, 27(8), 891–903. https://doi.org/10.1016/j.jpolmod.2005.06.003
Wooldridge, J. M. (2010). Econometric analysis of cross section and panel data (2nd ed). MIT Press.
Wooldridge, J. M. (2016). Introductory econometrics: A modern approach (Sixth edition). Cengage Learning.
World Bank. (2016). World Development Report 2016: Digital Dividends. The World Bank. http://elibrary.worldbank.org/doi/book/10.1596/978-1-4648-0671-1
World Bank. (2019). World Bank Group Country Survey 2019. https://microdata.worldbank.org/index.php/catalog/3516/study-description
World Bank Group. (2020a). The World Bank in Kenya. https://www.worldbank.org/en/country/kenya/overview
World Bank Group. (2020b). The World Bank in Rwanda. https://www.worldbank.org/en/country/rwanda/overview

195
World Bank Group. (2020c). The World Bank in Uganda. https://www.worldbank.org/en/country/uganda/overview
World Bank (Washington, District of Columbia) (Ed.). (2019). Doing business 2020. World Bank Group.
Yuan, Y.-H. “Erin", & Wu, C. “Kenny". (2008). Relationships Among Experiential Marketing,
Experiential Value, and Customer Satisfaction. Journal of Hospitality & Tourism Research, 32(3), 387–410. https://doi.org/10.1177/1096348008317392
Yurdakul, D., Atik, D., & Dholakia, N. (2017). Redefining the bottom of the pyramid from a marketing perspective. Marketing Theory, 17(3), 289–303. https://doi.org/10.1177/1470593117704265
Zanello, G., Fu, X., Mohnen, P., & Ventresca, M. (2016). The Creation and Diffusion of Innovation in Developing Countries: A Systematic Literature Review. Journal of Economic Surveys, 30(5), 884–912. https://doi.org/10.1111/joes.12126
Zarantonello, L., Jedidi, K., & Schmitt, B. H. (2013). Functional and experiential routes to persuasion: An analysis of advertising in emerging versus developed markets. International Journal of Research in Marketing, 30(1), 46–56. https://doi.org/10.1016/j.ijresmar.2012.09.001
Zeschky, M. B., Winterhalter, S., & Gassmann, O. (2014). From Cost to Frugal and Reverse Innovation: Mapping the Field and Implications for Global Competitiveness. Research-Technology Management, 57(4), 20–27.
Zeschky, M., Widenmayer, B., & Gassmann, O. (2011). Frugal innovation in emerging markets. Research-Technology Management, 54(4), 38–45.

196
Appendix Appendix Tables from Chapter 3
Table A1: Selection of variables
Variable Description Related literature
Consumer category
Measured by time of purchase
Decision making authority Household head male (Byrnes et al., 1999; Chikweche et al., 2012; Cohen et al., 2017; de Queiroz et al., 2013)
Local information Received a recommendation from a friend or relative or contact with a company representative
(Chikweche and Fletcher, 2012; Lüthje, Herstatt, and Von Hippel 2005; Ramani et al. 2012; Subrahmanyan and Tomas Gomez-Arias 2008)
External information Purposeful search for bottled water (S. M. Smith & Beatty, 1987)
Wealth/Asset index PPI score (Francisco, 2014; Quansah et al., 2015; Vásquez, 2017)
Education level Categories of education (primary, secondary, university)
(Adkins & Ozanne, 2005; Quansah et al., 2015; Ramani et al., 2012; Subrahmanyan & Tomas Gomez‐Arias, 2008; UNDP, 2008)
Sales location DWL sales area (11 locations) where respondent is located or Jibu franchise where water was purchased, controls for local context
(Ernst et al., 2015)

197
Table A2: Frequencies of consumers per category by sales area/zone
Consumer Categories per area/zone
Panel A: Kenya Sales Areas Early Middle Late Total
Bamburi 19.83 7.22 12.04 13.50
Kilifi 1.65 4.12 9.26 4.91
Magongo 5.79 11.34 12.04 9.51
Mikindani 2.48 5.15 0.93 2.76
Mtwapa 28.93 15.46 23.15 23.01
Tudor 11.57 13.40 6.48 10.43
Ganjoni 2.48 14.43 13.89 9.82
Ukunda 3.31 1.03 3.70 2.76
VOK 11.57 9.28 8.33 9.82
Ratna 6.61 9.28 4.63 6.75
Mishomoroni 5.79 9.28 5.56 6.75
Total 100 100 100 100
Panel B: Uganda Zones Early Middle Late Total
Bugolobi 0.00 8.77 4.46 5.41
Downtown 6.25 1.75 1.79 2.16
Entebbe 0.00 0.00 5.36 3.24
Ggaba 0.00 1.75 7.14 4.86
Kabale 0.00 0.00 0.89 0.54
Kabuusu 6.25 0.00 2.68 2.16
Kamwokya 6.25 7.02 3.57 4.86
Kawempe 43.75 10.53 5.36 10.27

198
Kireka 0.00 7.02 4.46 4.86
Kisaasi 0.00 1.75 2.68 2.16
Kitooro 0.00 1.75 8.04 5.41
Lugala 0.00 1.75 9.82 6.49
Lweza 0.00 3.51 3.57 3.24
Makindye 0.00 5.26 3.57 3.78
Mbarara 0.00 3.51 3.57 3.24
Najjanankumbi 12.50 0.00 1.79 2.16
Namugongo 0.00 1.75 1.79 1.62
Namuwongo 6.25 36.84 19.64 23.78
Nansana 18.75 1.75 3.57 4.32
Ntinda 0.00 5.26 6.25 5.41
Total 100 100 100 100
Panel C: Rwanda Zones Early Middle Late Total
Gatsata 0.00 1.94 0.00 0.69
Gikondo 1.47 5.83 4.27 4.17
Kabeza 7.35 2.91 5.98 5.21
Kabuga 0.00 1.94 2.56 1.74
Kagugu 4.41 1.94 0.85 2.08
Kanombe 7.35 4.85 1.71 4.17
Kibagabaga 0.00 1.94 0.85 1.04
Kicukiro 7.35 9.71 6.84 7.99
Kimironko 22.06 15.53 5.13 12.85
Kimisagara 0.00 5.83 6.84 4.86

199
Kinamba 26.47 15.53 3.42 13.19
Masaka 0.00 1.94 3.42 2.08
Niboye 1.47 0.97 2.56 1.74
Nyamata 0.00 2.91 5.98 3.47
Nyamirambo 11.76 16.50 16.24 15.28
Rubavu 0.00 0.00 14.53 5.90
Ruyenzi 1.47 0.97 8.55 4.17
Rwamagana 0.00 0.00 2.56 1.04
Sonatube 2.94 2.91 2.56 2.78
Wherever 5.88 5.83 5.13 5.56
Total 100 100 100 100
Note: Shares of consumers are expressed in percentage terms.
Table A3: Logit model of DWL and Jibu consumers and non-consumers for Kenya and Rwanda
Kenya Rwanda
(1) (2) (3) (4)
Male household head 0.058 0.059 0.120** 0.147***
(0.062) (0.060) (0.049) (0.048)
PPI score 0.000 0.014***
(0.001) (0.002)
Low income group -0.002 -0.200***
(0.035) (0.055)
Education (Excluded category: No formal education and primary education)

200
Secondary 0.139*** 0.139*** 0.029 0.0347781
(0.033) (0.032) (0.047) (0.048)
University 0.172*** 0.171*** 0.098*** 0.127***
(0.033) (0.035) (0.037) (0.038)
Sales point/Location FE Yes Yes Yes Yes
Observations 630 630 572 572
Note: Standard errors clustered at the sales area level are in parentheses. ***/**/* indicates statistical significance at the 1/5/10% level.

201
Table A4: Results from multinomial logit of consumer categories using asset poor variable
Kenya Rwanda Uganda
(1) (2) (3) (4) (5) (6) (7) (8) (9) (10) (11) (12)
Early Consumers
Male household head 0.012 0.020 0.027 0.029 0.154*** 0.151*** 0.148*** 0.144*** 0.024 0.021 0.025 0.021
(0.060) (0.057) (0.054) (0.056) (0.036) (0.043) (0.045) (0.048) (0.038) (0.039) (0.033) (0.032)
Asset poor -0.059 -0.054 -0.050 -0.051 0.054 0.060 0.060 0.060 -0.004 -0.006 -0.002 -0.008
(0.067) (0.071) (0.069) (0.071) (0.060) (0.059) (0.059) (0.055) (0.043) (0.046) (0.045) (0.043)
Education (Excluded category: No formal education and primary education)
Secondary
-0.018 -0.014 -0.014
-0.025 -0.028 -0.036
0.003 0.018 0.020
(0.091) (0.097) (0.100)
(0.072) (0.072) (0.072)
(0.051) (0.050) (0.050)
University
0.059 0.078 0.082
0.010 0.011 0.008
-0.023 -0.014 -0.008
(0.093) (0.099) (0.103)
(0.045) (0.045) (0.043)
(0.025) (0.024) (0.023)
Received personal information about water
-0.104 -0.128*
-0.020 0.007
0.050 0.084
(0.068) (0.070)
(0.052) (0.065)
(0.063) (0.066)
Purposeful search
-0.071
0.119°
0.111***
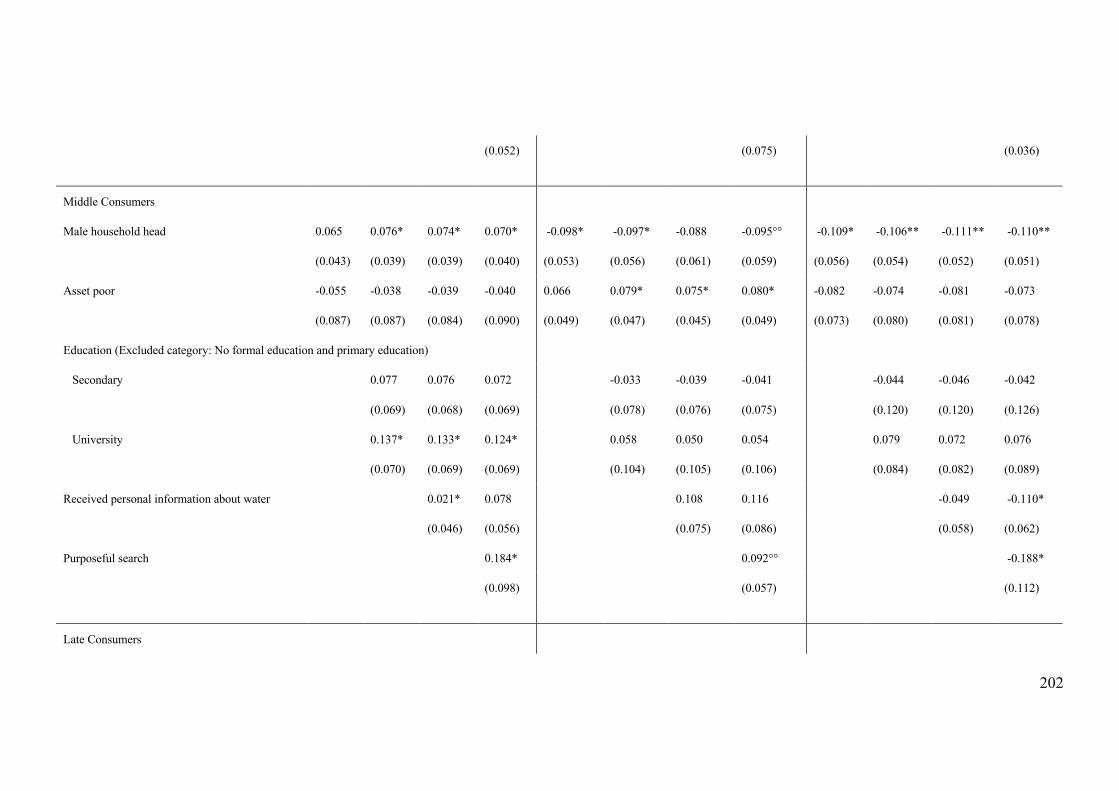
202
(0.052)
(0.075)
(0.036)
Middle Consumers
Male household head 0.065 0.076* 0.074* 0.070* -0.098* -0.097* -0.088 -0.095°° -0.109* -0.106** -0.111** -0.110**
(0.043) (0.039) (0.039) (0.040) (0.053) (0.056) (0.061) (0.059) (0.056) (0.054) (0.052) (0.051)
Asset poor -0.055 -0.038 -0.039 -0.040 0.066 0.079* 0.075* 0.080* -0.082 -0.074 -0.081 -0.073
(0.087) (0.087) (0.084) (0.090) (0.049) (0.047) (0.045) (0.049) (0.073) (0.080) (0.081) (0.078)
Education (Excluded category: No formal education and primary education)
Secondary
0.077 0.076 0.072
-0.033 -0.039 -0.041
-0.044 -0.046 -0.042
(0.069) (0.068) (0.069)
(0.078) (0.076) (0.075)
(0.120) (0.120) (0.126)
University
0.137* 0.133* 0.124*
0.058 0.050 0.054
0.079 0.072 0.076
(0.070) (0.069) (0.069)
(0.104) (0.105) (0.106)
(0.084) (0.082) (0.089)
Received personal information about water
0.021* 0.078
0.108 0.116
-0.049 -0.110*
(0.046) (0.056)
(0.075) (0.086)
(0.058) (0.062)
Purposeful search
0.184*
0.092°°
-0.188*
(0.098)
(0.057)
(0.112)
Late Consumers

203
Male household head -0.077 -0.095* -0.101* -0.099* -0.057 -0.054 -0.060 -0.049 0.086* 0.085* 0.086* 0.090*
(0.053) (0.057) (0.056) (0.056) (0.042) (0.044) (0.043) (0.047) (0.051) (0.050) (0.048) (0.048)
Asset poor 0.114° 0.092 0.089 0.091 -0.121** -0.140** -0.135** -0.140** 0.085 0.080 0.083 0.081
(0.073) (0.061) (0.062) (0.067) (0.049) (0.056) (0.055) (0.055) (0.082) (0.087) (0.091) (0.091)
Education (Excluded category: No formal education and primary education)
Secondary
-0.059 -0.062 -0.058
0.058 0.066 0.077
0.042 0.028 0.021
(0.094) (0.100) (0.094)
(0.068) (0.068) (0.065)
(0.111) (0.119) (0.127)
University
-0.196* -0.211* -0.206*
-0.068 -0.061 -0.063
-0.056 -0.058 -0.068
(0.109) (0.116) (0.113)
(0.124) (0.124) (0.122)
(0.084) (0.087) (0.091)
Received personal information about water
0.083 0.050
-0.088 -0.123**
-0.002 0.026
(0.062) (0.054)
(0.064) (0.059)
(0.063) (0.056)
Purposeful search
-0.113
-0.211***
0.077
(0.094)
(0.064)
(0.121)
Sales point/Location FE Yes Yes Yes Yes Yes Yes Yes Yes Yes Yes Yes Yes
Observations 274 274 274 274 278 278 278 278 161 161 161 161
Chi2 35.74 41.78 44.91 50.97 130.20 134.39 137.29 146.22 73.43 75.99 77.01 79.75
p-value 0.058 0.045 0.039 0.018 0.000 0.000 0.000 0.000 0.001 0.002 0.003 0.003

204
Note: ° Results from a multinomial logit regression. Standard errors are in parentheses. ***/**/* indicates statistical significance at the 1/5/10% level, respectively; p-value=12%, °° p-value=11
Pseudo R2 0.060 0.070 0.075 0.085 0.218 0.225 0.230 0.245 0.259 0.268 0.272 0.282

205
Acknowledgements The idea of doing a PhD has perhaps been in my mind since the final years of my bachelor and the realization that after years of resistance and insistence that I would not follow in the path of a professor father and teacher mother, I perhaps did get some of the educator genes so prevalent in my family. However, the path to getting a PhD has not been a very straight one for me, both my time at TU Delft and the opportunities leading up to the PhD, but I’m grateful for the experiences I gained along the way and the people who helped me reach this point. First, it’s worth mentioning the people at TU Delft who got me to this point. From my professors during my Engineering and Policy Analysis master who first sparked my interest in research and allowed me to focus my studies on development in East Africa. Particularly my master thesis supervisor Servaas Storm. I appreciate that in the midst of many students asking to be supervised him, he liked my idea and supported my ambitious plan to do my own field work in Uganda. Thanks to my supervisors: Cees, Neelke and Peter. From the start it was perhaps clear that I was not the typical PhD student and I’m sure this must have brought you some doubt and frustration. I appreciate that you gave me freedom to go my own direction with the project and put up with my restlessness and frustration of sitting in an office (and out of hours emails informing you that I won’t make it in person to a meeting thanks to sore legs from a marathon or a sprained ankle from climbing). I don’t think I could have done any other PhD project without the level of freedom yet prodding I was given to develop my own ideas and skills. Not to mention being allowed to spend a significant portion of the PhD in three different East African countries. I know I have been a difficult student at times, but I am grateful for the freedom, patience and support you gave me. Working on such an interdisciplinary project was both a source of frustration at times but also very rewarding and educational thanks to the many people I had a chance to work with both in East Africa and at CFIA. First, to my first officemate and colleague Haye. Although I am still not sure if I can grasp many of the ethical theories you have and your many ideas about the future of the world with regards to economics and politics, our conversations and brainstorm sessions were enlightening, inspiring and definitively stretched my mind. Thanks to you I definitely have a much deeper understanding of Dutch politics. To Elsie, I am super happy we managed to get more local knowledge on our team and our brainstorm sessions helped further develop my research. Kinsuk and Natascha: I’m really grateful we got connected and managed to collaborate throughout my PhD. I think we really managed to balance each other out, be efficient and come up with good ideas. It was a fruitful collaboration and I really appreciated both of your support during the field work and the quantitative work. To the rest of the CFIA group and private partners that came and went throughout the years: it was super nice to have the chance to interact with so many people from different backgrounds, share ideas, debate and brainstorm. I learned so much! Thanks to my colleagues at E & I and the TBM peer group. Although our socialization and interaction was limited due to me always being in and out of the country and doing sports in all my free time, it was nice to have social colleagues who could have engaging conversations besides work related stuff!

206
Thanks to my new colleagues at SafeCare! I feel super grateful that I got to join the team and even with remote work, feel so connected after just one year. It has been nice to bring my more theoretical knowledge to a practical setting and help improve quality of healthcare in Africa. Thanks also for helping me manage the busyness of the new job with finalizing the PhD. Looking forward to doing more impactful work with you, in person drinks, and hopefully more time spent in our country offices in the coming year! I was lucky to already have a great network of friends in the Netherlands at the start of my PhD and I’m glad I was able to grow these friendships and make new ones throughout the PhD. To anyone who hung out with me during these often frustrating 4 plus years, I’m glad I had so many smart, fun and interesting friends to grab drinks with, bounce ideas off, take spontaneous getaways or simply be silly. Maro-I don’t know if I would have survived living in this country for so long and the PhD if we hadn’t been lucky enough to be roommates our first year here. Thanks for all our funny miscommunications, laughs, support and adventures (even if you still refuse to actually be my friend…). Shea-thanks for (very easily) coercing me into running ultra-marathons, getting me into trouble at your wedding, always being willing to join me last minute on outdoor (frugal) adventures in remote places, offering your English skills to help me edit papers, and always providing me with a place to crash in a sunny place. To my climbing friends especially Shriya- thankful we connected and we could climb out our frustrations, climb in beautiful places, and solve the world’s problems over post climbing Thai food. Lorenzo-I’m glad we met and I had a buddy to do things like camp in freezing cold and rain or backpack through Italy during this last year of the pandemic. Taking up climbing was the best decision I made during the PhD. Finally to Remoka- lucky for me the PhD once again brought us to the same geographic locations from time to time whether it was dancing in Nairobi, running in remote Rwandan villages, eating burritos in Kigali, sitting on the back of my brakeless bike riding over the Erasmusbrug in Rotterdam, or you devouring all the cheese in my fridge in my tiny apartment. Thanks for always smacking me over the head and helping me laugh at myself. We both know you are the definition of frugal inspiration. Most importantly, to my family. To my (often annoying) brothers-thanks to you there is zero chance I will ever become arrogant after earning the Dr. title. Thankful for all of our wilderness escapades that kept me sane from the prison office life. Don’t worry even with a new title I will still happily sleep in a cubby hole in a van in Utah, camp and off road in the snow, go bike camping and more importantly continue to beat you in all games. Thanks mom and dad for rarely batting an eye when I decide to move strange places, for always encouraging me to be curious and explore my passions, and for pushing me to seek to make an impact with everything I do. Thanks to you making impact, loving nature, and staying curious will always be embedded in my life purpose.
Rachel Howell Rotterdam, Netherlands

207
Curriculum Vitae Rachel Howell was born in Lodi, California in the US on March 2nd, 1988. She completed high school in 2006 at Dexter High School in Dexter, Michigan. Her bachelor of science (cum laude) in Mechanical Engineering with minors in German and Humanitarian Engineering was completed during 2006-2010 at Valparaiso University. Before beginning further studies Rachel worked in a variety of capacities in South Korea (teacher) and Uganda (program manager of aid project). Her master of science was completed in 2014 in Engineering and Policy Analysis with a specialization in economics and finance at Delft University of Technology (studied 2012-2014). Prior to doctoral study Rachel did research at TU Delft on frugal innovation and worked as a consultant for a solar energy start up in Somaliland.

208
List of Publications and Presentations
Howell, R., van Beers, C., & Doorn, N. (2018). Value capture and value creation: The role of information technology in business models for frugal innovations in Africa. Technological Forecasting and Social Change, 131, 227-239. Howell, R., Sinha, K. M., Wagner, N., Doorn, N., & van Beers, C. (2019). Consumption of Bottled Water at the Bottom of the Pyramid: Who Purchases First? Journal of Macromarketing. https://doi.org/10.1177/0276146719866890 Paper presentation at EADI Nordic Conference August 2017, Bergen Norway. Poster presentation at DRUID conference June 2018, Copenhagen Denmark. Paper presentation at SEEDEC conference June 2019, Berkeley California. Paper presentation at MEIDE conference October 2019, Abidjan Ivory Coast. Paper presentation at Africalics conference October 2019, Dar es Salaam Tanzania.