delhi schools research
TRANSCRIPT
8/8/2019 Delhi Schools Research
http://slidepdf.com/reader/full/delhi-schools-research 1/15
International Journal of Educational Development 27 (2007) 205–219
Private schooling for low-income families: A census and
comparative survey in East Delhi, India
James TooleyÃ, Pauline Dixon
School of Education, Communication and Language Sciences, University of Newcastle Upon Tyne, Tyne NE1 7RU, England, UK
Abstract
A census and survey of schools in the slums of East Delhi, India, explored the nature and extent of private education
serving low-income families, and compared inputs to public and private schooling. Around two-thirds of all schools were
private unaided, with more unrecognised private than government schools. Teaching activity was found to be considerably
higher in private unaided than government schools, although teacher absenteeism was lowest in government schools. Most
inputs showed either comparable levels of provision in government and private unaided schools, or superiority in private
unaided schools. Possible implications are explored, concerning targeted vouchers, increased regulation and self-
regulation.
r 2006 Elsevier Ltd. All rights reserved.
Keywords: Comparative education; Development; Educational policy; Private education
1. Introduction
The existence of a low-cost private education
sector serving low-income families in developing
countries is widely reported in the international
development literature. The Oxfam Education Re-
port reports ‘y the notion that private schools are
servicing the needs of a small minority of wealthy
parents is misplaced y a lower cost private sector
has emerged to meet the demands of poor house-holds’ (Watkins, 2000, pp. 229–230). The Probe
Team (1999) researching villages in four north
Indian states reports that ‘even among poor families
and disadvantaged communities, one finds parents
who make great sacrifices to send some or all of
their children to private schools, so disillusioned are
they with government schools’ (p. 103). Dre ` ze and
Sen (2002) estimated that, even by 1994, some 30%
of all 6–14 year olds in rural areas were enrolled in
private schools, while 80% or more of this age
group attend private schools in urban areas,
including low-income families (p. 172). Reporting
on evidence from Haryana, Uttar Pradesh and
Rajasthan, De et al. (2002) note that ‘private
schools have been expanding rapidly in recent years’
and that these ‘now include a large number of primary schools which charge low fees’, in urban as
well as rural areas (p. 148). Alderman et al. (2001,
2003) report on similar findings from Pakistan. For
the poor in Calcutta (Kolkata) there has been a
‘mushrooming of privately managed unregulatedy
primary schools’ (Nambissan, 2003, p. 52). Re-
search in Haryana, India found that private
unrecognised schools ‘are operating practically in
every locality of the urban centres as well as in rural
ARTICLE IN PRESS
www.elsevier.com/locate/ijedudev
0738-0593/$- see front matterr 2006 Elsevier Ltd. All rights reserved.
doi:10.1016/j.ijedudev.2006.08.002
ÃCorresponding author. Tel.: +44 191 222 6374.
E-mail address: [email protected] (J. Tooley).
8/8/2019 Delhi Schools Research
http://slidepdf.com/reader/full/delhi-schools-research 2/15
areas’ often located adjacent to a government
school (Aggarwal, 2000, p. 20). In Uganda and
Malawi private schools have ‘mushroomed due to
the poor quality government primary schools’
(Rose, 2002, p. 6; Rose, 2003, p. 80), while a ‘large
increase’ of ‘fly-by-night’ private schools has beenreported in South Africa (Rose, 2002, p. 4). In
Kenya ‘the deteriorating quality of public education
y created demand for private alternatives’ (Baurer
et al., 2002).
Reasons given for this ‘mushrooming’ highlight
the low quality of government schools for the poor,
including problems of teacher absenteeism and lack
of teacher commitment. In government primary
schools in West Bengal it is reported that ‘teachers
do not teach’ and ‘teaching is the last priority for
the teachers’ (Rana et al., 2002, p. 64 and 67). The
Probe Team found that in their sample, only 53% of government schools was there any teaching going
on at all (The Probe Team, 1999). The Human
Development Report 2003 notes that in India and
Pakistan ‘poor households cited teacher absentee-
ism in public schools as their main reason for
choosing private ones.’ (UNDP, 2003, p. 112). A
comprehensive survey of teacher absenteeism con-
ducted by the World Bank in India (Kremer et al.,
2004) looked at a nationally representative sample
of 20 Indian states, involving 3750 schools.
Although public and private schools were investi-gated, like was not compared with like—urban and
rural government schools were compared with rural
private schools only. In government schools,
absenteeism rates were 25.2% in rural and 22.9%
in urban schools, while in the rural private schools,
absenteeism was about 22.8% (Kremer et al., 2004,
p. 5 and p. 9). In 257 government, mosque and
private schools in Pakistan there was an absence
rate of 20% when researchers physically checked the
attendance status of one randomly chosen teacher at
the school. In this same study the ‘official’ records
showed only an absence rate of 5% (Ali and Reed,
1994). Studies of government teacher absence in six
countries—Bangladesh, Ecuador, India, Indonesia,
Peru and Uganda—found teacher absence rates to
be between 11% and 27% (Chaudhury et al., 2004a;
Rogers et al., 2004, p.142; Akhamadi and Surya-
darma, 2000). A study in two rural districts of
Kenya found that government teachers were absent
nearly 30% of the time and present at school but
not physically in the classroom 12.4% of the
time (Glewwe et al., 2004). Studies from Papua
New Guinea and Zambia revealed absence rates of
15% and 17%, respectively (World Bank, 2004;
Habyarimana et al., 2004).
Public education for the poor is also reported to
suffer from inadequate conditions. One government
school highlighted by the World Development
Report 2004, in north Bihar, India, describe‘horrific’ conditions (World Bank 2003, p. 24).
Facilities in government primary schools in Calcut-
ta were reported ‘by no means satisfactory’ (Nam-
bissan, 2003, p. 20): of 11 primary schools only two
had safe drinking water for the children, nine had a
general toilet, and only five had a playground.
Listing major problems in their schools, head-
teachers included the lack of electricity, space and
furniture (p. 21). A study of 100 government
primary schools in Bangladesh found that 81%
had water, 39% electricity, 97% toilets, 76% a
playground and only 0.4% a library, while theaverage pupil–teacher ratio was 69:1. (Chaudhury et
al., 2004b). The Probe Team in India found that out
of 162 government primary schools, 59% had no
functional water supply, 89% had no toilets, and
only 23% had a library, 48% a playground. The
average pupil teacher ratio was 68:1 (The Probe
Team, 1999).
Finally, private schools in India provide (or
purport to provide) English medium instruction,
which is desired by parents; government schools
teach in state languages, not usually teachingEnglish until about Class 5 (Nambissan, 2003; De
et al., 2002). Moreover, in some countries public
schools have limited places, because of an increase
in the number of school-age population without an
increase in government spending (Rose, 2002;
Nwagwu, 1997).
However, whilst this literature indicates that one
of the reasons low-income parents send their
children to private schools is the perceived low
quality of public education, concerns are also
expressed about the quality of the private schools
to which parents turn as alternatives, especially
those that are not recognised by government. The
Oxfam Education Report, for instance, notes that
while ‘there is no doubting the appalling standard of
provision in public education systems’, the private
schools that poor parents are using instead are of
‘inferior quality’, offering ‘a low-quality service’
that will ‘restrict children’s future opportunities.’
(Watkins, 2000, p. 230). Nambissan (2003) notes
that in Calcutta, ‘the mushrooming of privately
managed unregulated pre-primary and primary
schoolsy
can have only deleterious consequences
ARTICLE IN PRESS
J. Tooley, P. Dixon / International Journal of Educational Development 27 (2007) 205–219206
8/8/2019 Delhi Schools Research
http://slidepdf.com/reader/full/delhi-schools-research 3/15
for the spread of education in general and among
the poor in particular’ (p. 52), for the quality of the
private schools is ‘often suspect’ (p. 15, footnote 25).
Save the Children, although noting that poor
parents in Nepal and Pakistan identify ‘irregularity,
negligence and indiscipline of the teachers, largeclass sizes and a lower standard of English learning’
as ‘the reasons why they decided against public
schools’ (Save the Children UK, South and Central
Asia, 2002, p. 8), is concerned that the private
schools they opt for offer ‘an extremely low
standard of education’ (p. 13). Finally, Rose
(2002) asks why poor parents in sub-Saharan Africa
are paying ‘for poor quality education, when they
could be getting fee-free schooling in the state
sector’? (p. 16); ‘the quality of education received is
debatable’ in the private sector (p. 7). However, the
evidence given about poor quality private provision,and the relative quality of public and private
provision for the poor in these sources is limited—
either suggesting that ‘little hard evidence’ is
available (Watkins, 2000, p. 230), or basing the
conclusion on the observation that private schools
employ low paid teachers, in low-quality accom-
modation, without comparing what is on offer in
the government alternative.
Our two-and a half year study (April 2003–Dec
2005) aimed to contribute to the understanding of
private school provision for the poor, and itsrelative quality vis-a ` -vis government provision,
through research in selected low-income areas in
India (Delhi, Hyderabad and Mahbubnagar), Gha-
na, Nigeria, Kenya and China. This paper reports
on some of the findings from Delhi, India only. It is
particularly concerned with exploring some of the
assumptions made about the nature of private
schooling for low-income families, and in compar-
ing the inputs in these (including facilities, teacher
commitment, etc.) with those in government schools
in the same areas. (Further research conducted
detailed comparisons of the achievement of students
in these schools, and pupil, parent and teacher
satisfaction, reported elsewhere).
2. Method
The research reported here, conducted during
October 2004, consisted of two main parts: a census
of schools and survey of inputs, aimed to discover
the extent of private schools in selected low-income
areas and to compare their inputs with government
schools serving the same populations.
In India, school management type is of three
kinds: government, private aided and private
unaided. Government schools are funded and
managed by some level of government, state or
local. Private aided schools are privately managed,
but usually have 100% of teacher salaries, plusother expenses, funded by government. Private
unaided schools are entirely privately managed
and privately funded. Private unaided schools are
of two types, recognised and unrecognised. The
former have purportedly met the regulatory require-
ments of the state. Unrecognised schools are in
effect operating in the informal sector of the
economy. They have either not applied for recogni-
tion, or have not succeeded in gaining recognition
from the government. The research was interested in
investigating all these school types.
After consultation with government officials andnon-government organisations working in the city,
the census was conducted in North Shahdara, East
Delhi, reported to be one of the poorest areas of the
city.1 North Shahdara covers an area of 40 km2, but
only the ‘‘notified slums’’ (according to the Census
of India, 2001) were researched, estimated to cover
about half this area. Permission was granted by
government officials for the research to be con-
ducted. A team of 20 researchers recruited from a
local non-government organisation were trained in
methods of gaining access to schools, the use of aninterview schedule for school managers and head-
teachers, and an observation schedule, which was
trialled to ensure reliability of observations made.
Given that we were particularly interested in finding
‘unrecognised’ private unaided schools, which are,
by definition, not on any official list, the researchers
were asked to physically visit every street and
alleyway in the area, during the morning of a
school day (except where it was indicated that a
school was operating in shifts, in which case they
returned to this school in the afternoon too),
looking for all schools, primary and secondary.
(Nursery-only schools were excluded from the
study, as were non-formal education provision,
such as learning centres and after-school clubs).
Government lists were used to check that all
government, private aided and recognised private
unaided schools were found.
When a school was located, the researcher called
unannounced and asked for a brief interview with
the headteacher or school manager, taking about
ARTICLE IN PRESS
1http://www.pratham.org/documents/northshahdara.doc.
J. Tooley, P. Dixon / International Journal of Educational Development 27 (2007) 205–219 207
8/8/2019 Delhi Schools Research
http://slidepdf.com/reader/full/delhi-schools-research 4/15
10 minutes. After this, the researchers asked to
make a school visit, where they checked the facilities
available in the school against a short check-list of
facilities, and visited Class 4, to observe the activity
of the teacher. This visit was made when a normal
lesson was timetabled—the researchers were in-structed to wait until such a lesson was scheduled if
there were other activities (assembly, break, sports,
etc.) taking place.
The total number of schools located (including
schools operating in shifts) was 265; in all schools
the researcher was able to ask at least some
of the questions on the short interview schedule.
Similarly, the researchers were able to answer
at least one of the questions on the observation
schedule in all 265 schools. (The tables below
indicate the exact numbers of observations
made for each question). Data discussed in Section3 below came from the interview, while data
discussed in Section 4 came from the observation
schedule.
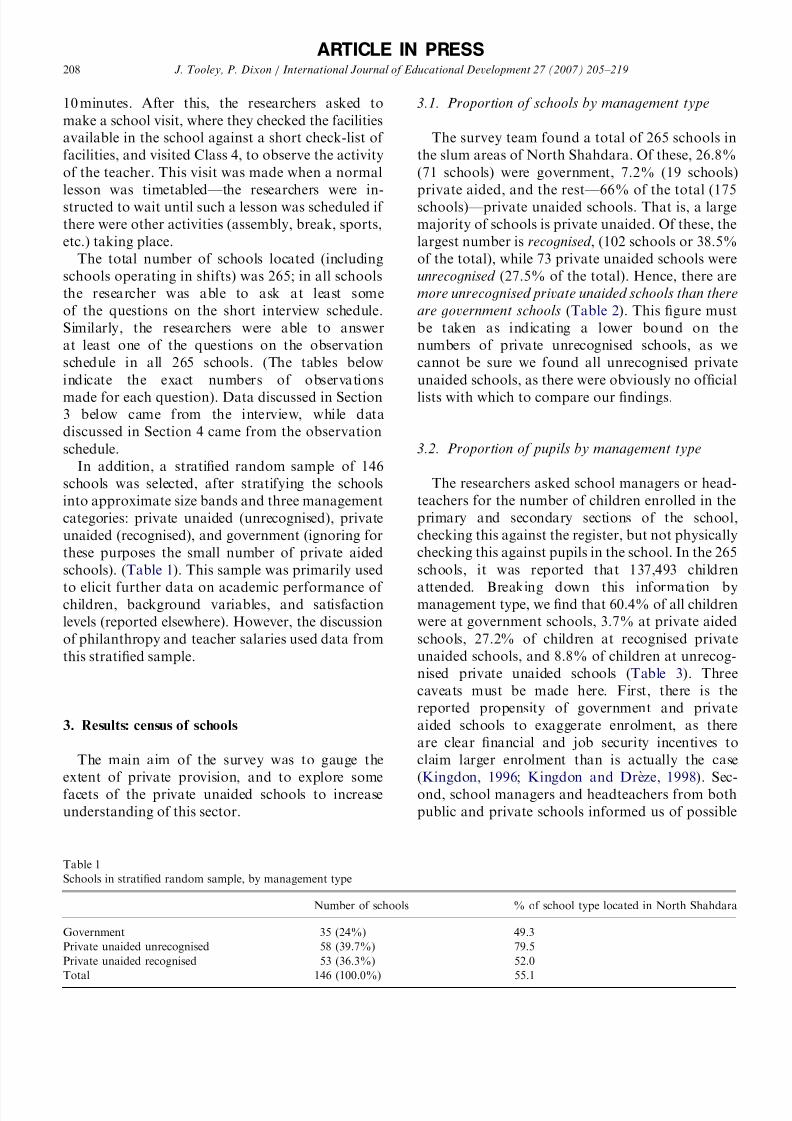
In addition, a stratified random sample of 146
schools was selected, after stratifying the schools
into approximate size bands and three management
categories: private unaided (unrecognised), private
unaided (recognised), and government (ignoring for
these purposes the small number of private aided
schools). (Table 1). This sample was primarily used
to elicit further data on academic performance of children, background variables, and satisfaction
levels (reported elsewhere). However, the discussion
of philanthropy and teacher salaries used data from
this stratified sample.
3. Results: census of schools
The main aim of the survey was to gauge the
extent of private provision, and to explore some
facets of the private unaided schools to increase
understanding of this sector.
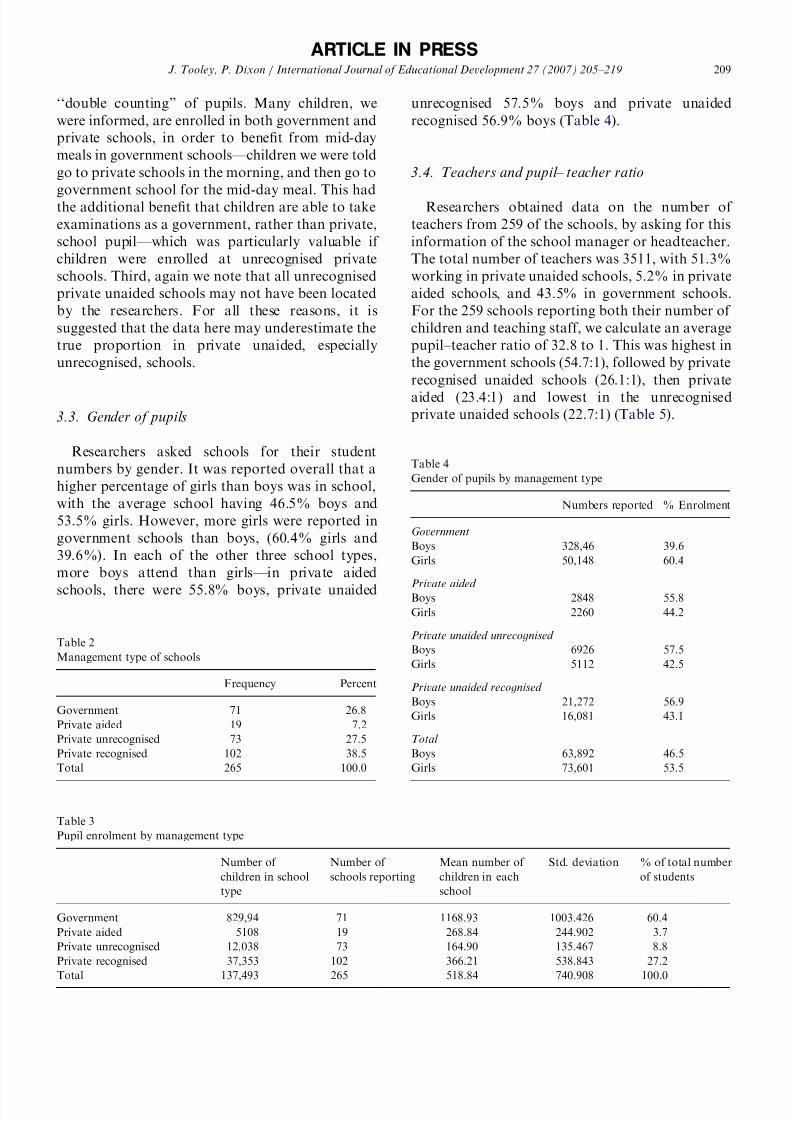
3.1. Proportion of schools by management type
The survey team found a total of 265 schools in
the slum areas of North Shahdara. Of these, 26.8%
(71 schools) were government, 7.2% (19 schools)
private aided, and the rest—66% of the total (175schools)—private unaided schools. That is, a large
majority of schools is private unaided. Of these, the
largest number is recognised , (102 schools or 38.5%
of the total), while 73 private unaided schools were
unrecognised (27.5% of the total). Hence, there are
more unrecognised private unaided schools than there
are government schools (Table 2). This figure must
be taken as indicating a lower bound on the
numbers of private unrecognised schools, as we
cannot be sure we found all unrecognised private
unaided schools, as there were obviously no official
lists with which to compare our findings.
3.2. Proportion of pupils by management type
The researchers asked school managers or head-
teachers for the number of children enrolled in the
primary and secondary sections of the school,
checking this against the register, but not physically
checking this against pupils in the school. In the 265
schools, it was reported that 137,493 children
attended. Breaking down this information bymanagement type, we find that 60.4% of all children
were at government schools, 3.7% at private aided
schools, 27.2% of children at recognised private
unaided schools, and 8.8% of children at unrecog-
nised private unaided schools (Table 3). Three
caveats must be made here. First, there is the
reported propensity of government and private
aided schools to exaggerate enrolment, as there
are clear financial and job security incentives to
claim larger enrolment than is actually the case
(Kingdon, 1996; Kingdon and Dre ` ze, 1998). Sec-
ond, school managers and headteachers from both
public and private schools informed us of possible
ARTICLE IN PRESS
Table 1
Schools in stratified random sample, by management type
Number of schools % of school type located in North Shahdara
Government 35 (24%) 49.3
Private unaided unrecognised 58 (39.7%) 79.5
Private unaided recognised 53 (36.3%) 52.0
Total 146 (100.0%) 55.1
J. Tooley, P. Dixon / International Journal of Educational Development 27 (2007) 205–219208
8/8/2019 Delhi Schools Research
http://slidepdf.com/reader/full/delhi-schools-research 5/15
‘‘double counting’’ of pupils. Many children, we
were informed, are enrolled in both government and
private schools, in order to benefit from mid-day
meals in government schools—children we were told
go to private schools in the morning, and then go to
government school for the mid-day meal. This hadthe additional benefit that children are able to take
examinations as a government, rather than private,
school pupil—which was particularly valuable if
children were enrolled at unrecognised private
schools. Third, again we note that all unrecognised
private unaided schools may not have been located
by the researchers. For all these reasons, it is
suggested that the data here may underestimate the
true proportion in private unaided, especially
unrecognised, schools.
3.3. Gender of pupils
Researchers asked schools for their student
numbers by gender. It was reported overall that a
higher percentage of girls than boys was in school,
with the average school having 46.5% boys and
53.5% girls. However, more girls were reported in
government schools than boys, (60.4% girls and
39.6%). In each of the other three school types,
more boys attend than girls—in private aided
schools, there were 55.8% boys, private unaided
unrecognised 57.5% boys and private unaided
recognised 56.9% boys (Table 4).
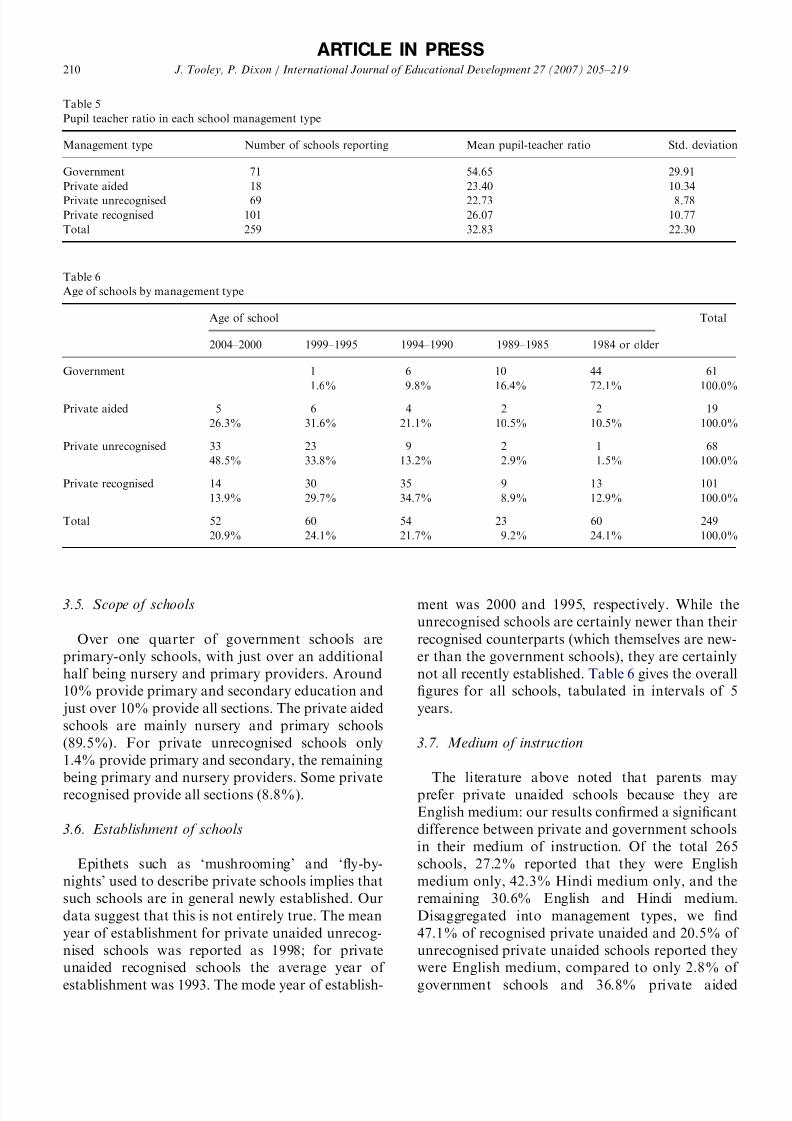
3.4. Teachers and pupil– teacher ratio
Researchers obtained data on the number of
teachers from 259 of the schools, by asking for this
information of the school manager or headteacher.
The total number of teachers was 3511, with 51.3%
working in private unaided schools, 5.2% in private
aided schools, and 43.5% in government schools.
For the 259 schools reporting both their number of
children and teaching staff, we calculate an average
pupil–teacher ratio of 32.8 to 1. This was highest in
the government schools (54.7:1), followed by private
recognised unaided schools (26.1:1), then private
aided (23.4:1) and lowest in the unrecognisedprivate unaided schools (22.7:1) (Table 5).
ARTICLE IN PRESS
Table 2
Management type of schools
Frequency Percent
Government 71 26.8
Private aided 19 7.2
Private unrecognised 73 27.5
Private recognised 102 38.5
Total 265 100.0
Table 3
Pupil enrolment by management type
Number of
children in school
type
Number of
schools reporting
Mean number of
children in each
school
Std. deviation % of total number
of students
Government 829,94 71 1168.93 1003.426 60.4
Private aided 5108 19 268.84 244.902 3.7
Private unrecognised 12,038 73 164.90 135.467 8.8
Private recognised 37,353 102 366.21 538.843 27.2
Total 137,493 265 518.84 740.908 100.0
Table 4
Gender of pupils by management type
Numbers reported % Enrolment
Government
Boys 328,46 39.6
Girls 50,148 60.4
Private aided Boys 2848 55.8
Girls 2260 44.2
Private unaided unrecognised
Boys 6926 57.5
Girls 5112 42.5
Private unaided recognised
Boys 21,272 56.9
Girls 16,081 43.1
Total
Boys 63,892 46.5
Girls 73,601 53.5
J. Tooley, P. Dixon / International Journal of Educational Development 27 (2007) 205–219 209
8/8/2019 Delhi Schools Research
http://slidepdf.com/reader/full/delhi-schools-research 6/15
3.5. Scope of schools
Over one quarter of government schools are
primary-only schools, with just over an additional
half being nursery and primary providers. Around
10% provide primary and secondary education and
just over 10% provide all sections. The private aided
schools are mainly nursery and primary schools
(89.5%). For private unrecognised schools only
1.4% provide primary and secondary, the remaining
being primary and nursery providers. Some private
recognised provide all sections (8.8%).
3.6. Establishment of schools
Epithets such as ‘mushrooming’ and ‘fly-by-
nights’ used to describe private schools implies that
such schools are in general newly established. Our
data suggest that this is not entirely true. The mean
year of establishment for private unaided unrecog-
nised schools was reported as 1998; for private
unaided recognised schools the average year of
establishment was 1993. The mode year of establish-
ment was 2000 and 1995, respectively. While the
unrecognised schools are certainly newer than their
recognised counterparts (which themselves are new-
er than the government schools), they are certainly
not all recently established. Table 6 gives the overall
figures for all schools, tabulated in intervals of 5
years.
3.7. Medium of instruction
The literature above noted that parents may
prefer private unaided schools because they are
English medium: our results confirmed a significant
difference between private and government schools
in their medium of instruction. Of the total 265
schools, 27.2% reported that they were English
medium only, 42.3% Hindi medium only, and the
remaining 30.6% English and Hindi medium.
Disaggregated into management types, we find
47.1% of recognised private unaided and 20.5% of
unrecognised private unaided schools reported they
were English medium, compared to only 2.8% of
government schools and 36.8% private aided
ARTICLE IN PRESS
Table 5
Pupil teacher ratio in each school management type
Management type Number of schools reporting Mean pupil-teacher ratio Std. deviation
Government 71 54.65 29.91
Private aided 18 23.40 10.34
Private unrecognised 69 22.73 8.78
Private recognised 101 26.07 10.77
Total 259 32.83 22.30
Table 6
Age of schools by management type
Age of school Total
2004–2000 1999–1995 1994–1990 1989–1985 1984 or older
Government 1 6 10 44 61
1.6% 9.8% 16.4% 72.1% 100.0%
Private aided 5 6 4 2 2 19
26.3% 31.6% 21.1% 10.5% 10.5% 100.0%
Private unrecognised 33 23 9 2 1 68
48.5% 33.8% 13.2% 2.9% 1.5% 100.0%
Private recognised 14 30 35 9 13 101
13.9% 29.7% 34.7% 8.9% 12.9% 100.0%
Total 52 60 54 23 60 249
20.9% 24.1% 21.7% 9.2% 24.1% 100.0%
J. Tooley, P. Dixon / International Journal of Educational Development 27 (2007) 205–219210
8/8/2019 Delhi Schools Research
http://slidepdf.com/reader/full/delhi-schools-research 7/15
schools. The majority of government schools were
Hindi medium (80.3%). Many of the private
unrecognised schools are Hindi medium (45.2%)
or provide both Hindi and English medium streams
(34.2%).
3.8. Fees in private unaided schools
The private unaided schools were found to charge
predominantly monthly fees. The researchers asked
school managers for details of these fees, checking
these where possible against written fee charges.
There is a statistically significant difference in the
fees charged in unrecognised and recognised
schools, with the former consistently lower than
the latter, at each level. For example, for pre-
primary grade, mean fees in recognised private
unaided schools are Rs. 190.25 (£2.442) per month,
compared to Rs. 92.55 (£1.19) per month in the
unrecognised schools. At primary grade, the samefigures are Rs. 227.60 (£2.92) compared to Rs.
124.45 (£1.60). The median figures may be a more
useful figure for comparison, given that a small
number of schools were found to be charging higher
fees than others. At the primary level, these were Rs.
100 (£1.28) for unrecognised and Rs. 192.50 (£2.47)
for recognised schools.
The minimum wage for Delhi is set at Rs. 90.00
(£1.15) per day (2001 figures, Labour Bureau,
Government of India, 2005) which translates to
about Rs. 2160 (£27.69) per month (assuming 24days work per month). That is, the median fees for
unrecognised schools are about 5% of the monthly
wage for a breadwinner on the minimum wage,
while recognised school fees are about 9%.
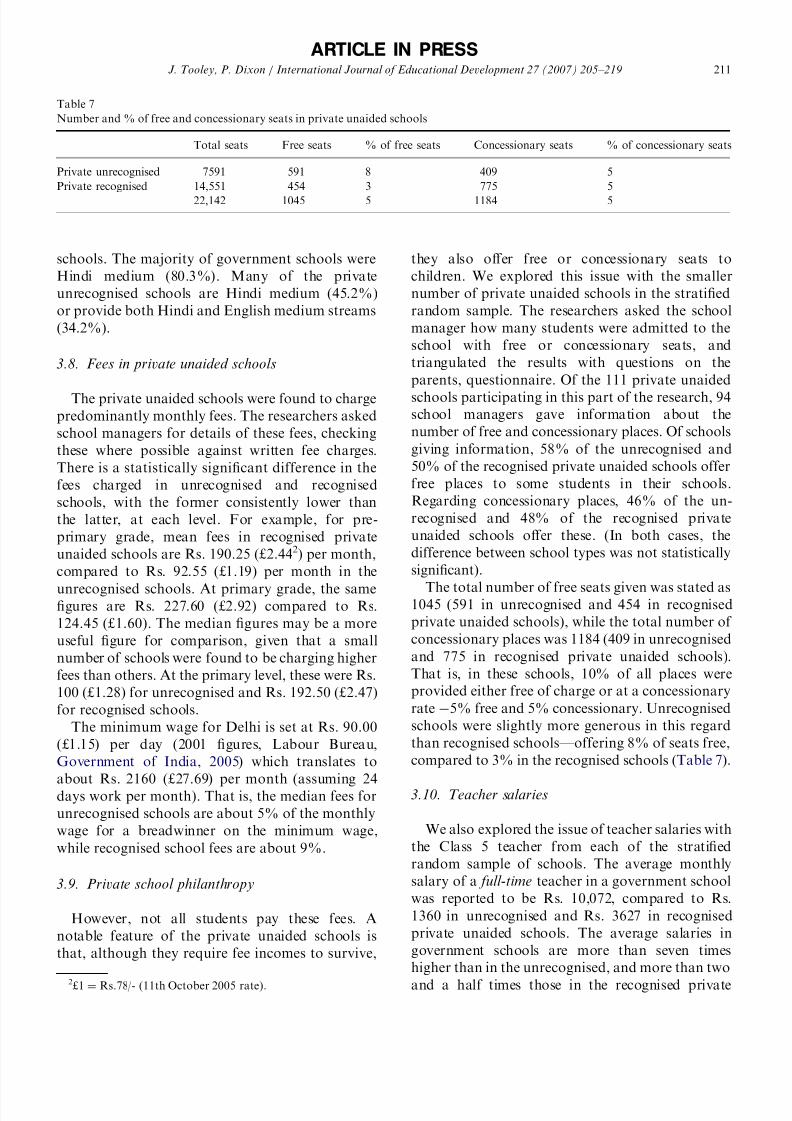
3.9. Private school philanthropy
However, not all students pay these fees. A
notable feature of the private unaided schools is
that, although they require fee incomes to survive,
they also offer free or concessionary seats to
children. We explored this issue with the smaller
number of private unaided schools in the stratified
random sample. The researchers asked the school
manager how many students were admitted to the
school with free or concessionary seats, and
triangulated the results with questions on the
parents, questionnaire. Of the 111 private unaided
schools participating in this part of the research, 94school managers gave information about the
number of free and concessionary places. Of schools
giving information, 58% of the unrecognised and
50% of the recognised private unaided schools offer
free places to some students in their schools.
Regarding concessionary places, 46% of the un-
recognised and 48% of the recognised private
unaided schools offer these. (In both cases, the
difference between school types was not statistically
significant).
The total number of free seats given was stated as1045 (591 in unrecognised and 454 in recognised
private unaided schools), while the total number of
concessionary places was 1184 (409 in unrecognised
and 775 in recognised private unaided schools).
That is, in these schools, 10% of all places were
provided either free of charge or at a concessionary
rate À5% free and 5% concessionary. Unrecognised
schools were slightly more generous in this regard
than recognised schools—offering 8% of seats free,
compared to 3% in the recognised schools (Table 7).
3.10. Teacher salaries
We also explored the issue of teacher salaries with
the Class 5 teacher from each of the stratified
random sample of schools. The average monthly
salary of a full-time teacher in a government school
was reported to be Rs. 10,072, compared to Rs.
1360 in unrecognised and Rs. 3627 in recognised
private unaided schools. The average salaries in
government schools are more than seven times
higher than in the unrecognised, and more than two
and a half times those in the recognised private
ARTICLE IN PRESS
Table 7
Number and % of free and concessionary seats in private unaided schools
Total seats Free seats % of free seats Concessionary seats % of concessionary seats
Private unrecognised 7591 591 8 409 5
Private recognised 14,551 454 3 775 5
22,142 1045 5 1184 5
2£1 ¼ Rs.78/- (11th October 2005 rate).
J. Tooley, P. Dixon / International Journal of Educational Development 27 (2007) 205–219 211
8/8/2019 Delhi Schools Research
http://slidepdf.com/reader/full/delhi-schools-research 8/15
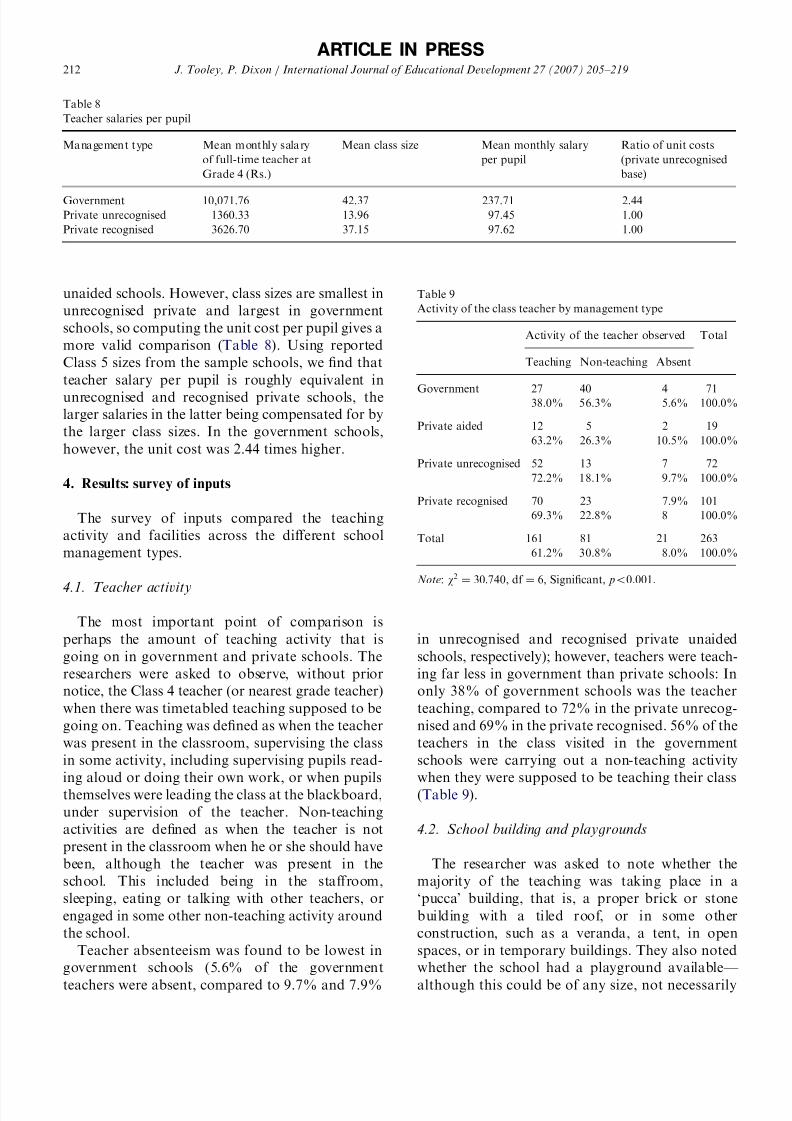
unaided schools. However, class sizes are smallest in
unrecognised private and largest in government
schools, so computing the unit cost per pupil gives a
more valid comparison (Table 8). Using reported
Class 5 sizes from the sample schools, we find that
teacher salary per pupil is roughly equivalent in
unrecognised and recognised private schools, thelarger salaries in the latter being compensated for by
the larger class sizes. In the government schools,
however, the unit cost was 2.44 times higher.
4. Results: survey of inputs
The survey of inputs compared the teaching
activity and facilities across the different school
management types.
4.1. Teacher activity
The most important point of comparison is
perhaps the amount of teaching activity that is
going on in government and private schools. The
researchers were asked to observe, without prior
notice, the Class 4 teacher (or nearest grade teacher)
when there was timetabled teaching supposed to be
going on. Teaching was defined as when the teacher
was present in the classroom, supervising the class
in some activity, including supervising pupils read-
ing aloud or doing their own work, or when pupils
themselves were leading the class at the blackboard,
under supervision of the teacher. Non-teaching
activities are defined as when the teacher is not
present in the classroom when he or she should have
been, although the teacher was present in the
school. This included being in the staffroom,
sleeping, eating or talking with other teachers, or
engaged in some other non-teaching activity around
the school.
Teacher absenteeism was found to be lowest in
government schools (5.6% of the government
teachers were absent, compared to 9.7% and 7.9%
in unrecognised and recognised private unaided
schools, respectively); however, teachers were teach-
ing far less in government than private schools: In
only 38% of government schools was the teacher
teaching, compared to 72% in the private unrecog-
nised and 69% in the private recognised. 56% of the
teachers in the class visited in the government
schools were carrying out a non-teaching activity
when they were supposed to be teaching their class
(Table 9).
4.2. School building and playgrounds
The researcher was asked to note whether the
majority of the teaching was taking place in a
‘pucca’ building, that is, a proper brick or stone
building with a tiled roof, or in some other
construction, such as a veranda, a tent, in open
spaces, or in temporary buildings. They also noted
whether the school had a playground available—
although this could be of any size, not necessarily
ARTICLE IN PRESS
Table 8
Teacher salaries per pupil
Management type Mean monthly salary
of full-time teacher at
Grade 4 (Rs.)
Mean class size Mean monthly salary
per pupil
Ratio of unit costs
(private unrecognised
base)
Government 10,071.76 42.37 237.71 2.44
Private unrecognised 1360.33 13.96 97.45 1.00
Private recognised 3626.70 37.15 97.62 1.00
Table 9
Activity of the class teacher by management type
Activity of the teacher observed Total
Teaching Non-teaching Absent
Government 27 40 4 7138.0% 56.3% 5.6% 100.0%
Private aided 12 5 2 19
63.2% 26.3% 10.5% 100.0%
Private unrecognised 52 13 7 72
72.2% 18.1% 9.7% 100.0%
Private recognised 70 23 7.9% 101
69.3% 22.8% 8 100.0%
Total 161 81 21 263
61.2% 30.8% 8.0% 100.0%
Note: w2¼ 30:740, df ¼ 6, Significant, po0.001.
J. Tooley, P. Dixon / International Journal of Educational Development 27 (2007) 205–219212
8/8/2019 Delhi Schools Research
http://slidepdf.com/reader/full/delhi-schools-research 9/15
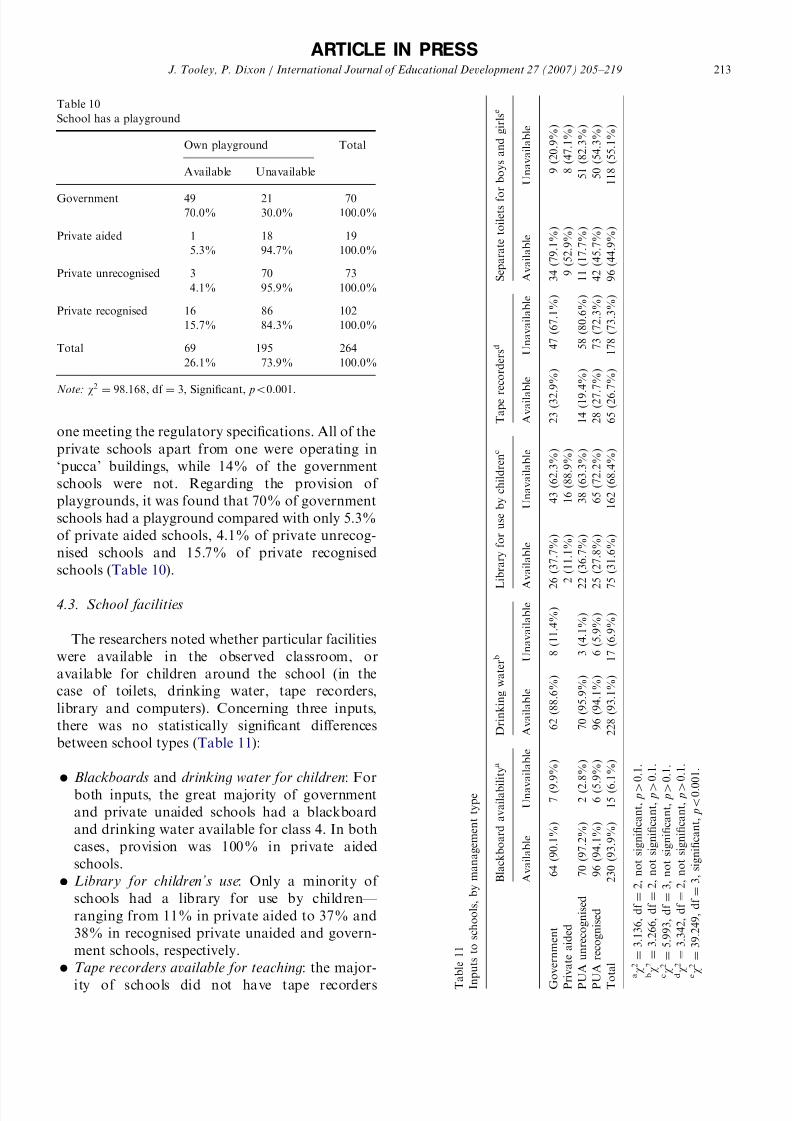
one meeting the regulatory specifications. All of the
private schools apart from one were operating in
‘pucca’ buildings, while 14% of the government
schools were not. Regarding the provision of
playgrounds, it was found that 70% of government
schools had a playground compared with only 5.3%
of private aided schools, 4.1% of private unrecog-
nised schools and 15.7% of private recognised
schools (Table 10).
4.3. School facilities
The researchers noted whether particular facilities
were available in the observed classroom, or
available for children around the school (in the
case of toilets, drinking water, tape recorders,
library and computers). Concerning three inputs,
there was no statistically significant differences
between school types (Table 11):
Blackboards and drinking water for children: For
both inputs, the great majority of government
and private unaided schools had a blackboard
and drinking water available for class 4. In both
cases, provision was 100% in private aided
schools.
Library for children’s use: Only a minority of
schools had a library for use by children—
ranging from 11% in private aided to 37% and
38% in recognised private unaided and govern-
ment schools, respectively.
Tape recorders available for teaching: the major-
ity of schools did not have tape recorders
ARTICLE IN PRESS
Table 10
School has a playground
Own playground Total
Available Unavailable
Government 49 21 7070.0% 30.0% 100.0%
Private aided 1 18 19
5.3% 94.7% 100.0%
Private unrecognised 3 70 73
4.1% 95.9% 100.0%
Private recognised 16 86 102
15.7% 84.3% 100.0%
Total 69 195 264
26.1% 73.9% 100.0%
Note: w2¼
98:
168, df ¼
3, Significant, po0.001.
T a
b l e 1 1
I n p u t s t o s c h o o l s , b y m a n a g e m e n t t y p e
B l a c k b o a r d a v a i l a b i l i t y a
D r i n k i n g w a t e r
b
L
i b r a r y f o r u s e b y c h i l d r e n c
T a p e r e c o r d e r s d
S e p a r a t e t o i l e t s f o
r b o y s a n d g i r l s e
A v a i l a b l e
U n a v
a i l a b l e
A v a i l a b l e
U n a v a i l a b l e A
v a i l a b l e
U n a v a i l a b l e
A v a i l a b l e
U n a v a i l a b l e
A v a i l a b l e
U n a v a i l a b l e
G o v e r n m e n t
6 4 ( 9 0 . 1 % )
7 ( 9 . 9 % )
6 2 ( 8 8 . 6 % )
8 ( 1 1 . 4 % ) 2
6 ( 3 7 . 7 % )
4 3 ( 6 2 . 3 % )
2 3 ( 3 2 . 9 % )
4 7 ( 6 7 . 1 % )
3 4 ( 7 9 . 1 % )
9 ( 2 0 . 9 % )
P r
i v a t e a i d e d
2 ( 1 1 . 1 % )
1 6 ( 8 8 . 9 % )
9 ( 5 2 . 9 % )
8 ( 4 7 . 1 % )
P U
A u n r e c o g n i s e d
7 0 ( 9 7 . 2 % )
2 ( 2 . 8 % )
7 0 ( 9 5 . 9 % )
3 ( 4 . 1 % )
2
2 ( 3 6 . 7 % )
3 8 ( 6 3 . 3 % )
1 4 ( 1 9 . 4 % )
5 8 ( 8 0 . 6 % )
1 1 ( 1 7 . 7 % )
5 1 ( 8 2 . 3 % )
P U
A r e c o g n i s e d
9 6 ( 9 4 . 1 % )
6 ( 5 . 9 % )
9 6 ( 9 4 . 1 % )
6 ( 5 . 9 % )
2
5 ( 2 7 . 8 % )
6 5 ( 7 2 . 2 % )
2 8 ( 2 7 . 7 % )
7 3 ( 7 2 . 3 % )
4 2 ( 4 5 . 7 % )
5 0 ( 5 4 . 3 % )
T o
t a l
2 3 0 ( 9 3 . 9 % )
1 5 ( 6 . 1 % )
2 2 8 ( 9 3 . 1 % )
1 7 ( 6 . 9 % )
7
5 ( 3 1 . 6 % )
1 6 2 ( 6 8 . 4 % )
6 5 ( 2 6 . 7 % )
1 7 8 ( 7 3 . 3 % )
9 6 ( 4 4 . 9 % )
1 1 8 ( 5 5 . 1 % )
a w 2 ¼
3 : 1 3 6 , d f ¼
2 , n o t s i g n i fi c a n t , p 4
0 . 1 .
b w 2 ¼
3 : 2 6 6 , d f ¼
2 , n o t s i g n i fi c a n t , p 4
0 . 1 .
c w 2 ¼
5 : 9 9 3 , d f ¼
3 , n o t s i g n i fi c a n t , p 4
0 . 1 .
d w 2 ¼
3 : 3 4 2 , d f ¼
2 , n o t s i g n i fi c a n t , p 4
0 . 1 .
e w 2 ¼
3 9 :
2 4 9 , d f ¼
3 , s i g n i fi c a n t , p o 0 . 0 0 1 .
J. Tooley, P. Dixon / International Journal of Educational Development 27 (2007) 205–219 213
8/8/2019 Delhi Schools Research
http://slidepdf.com/reader/full/delhi-schools-research 10/15
available in any school type—ranging from 67%
to 81% in government and private unaided
schools. (Only one private aided school had tape
recorders available for teaching).
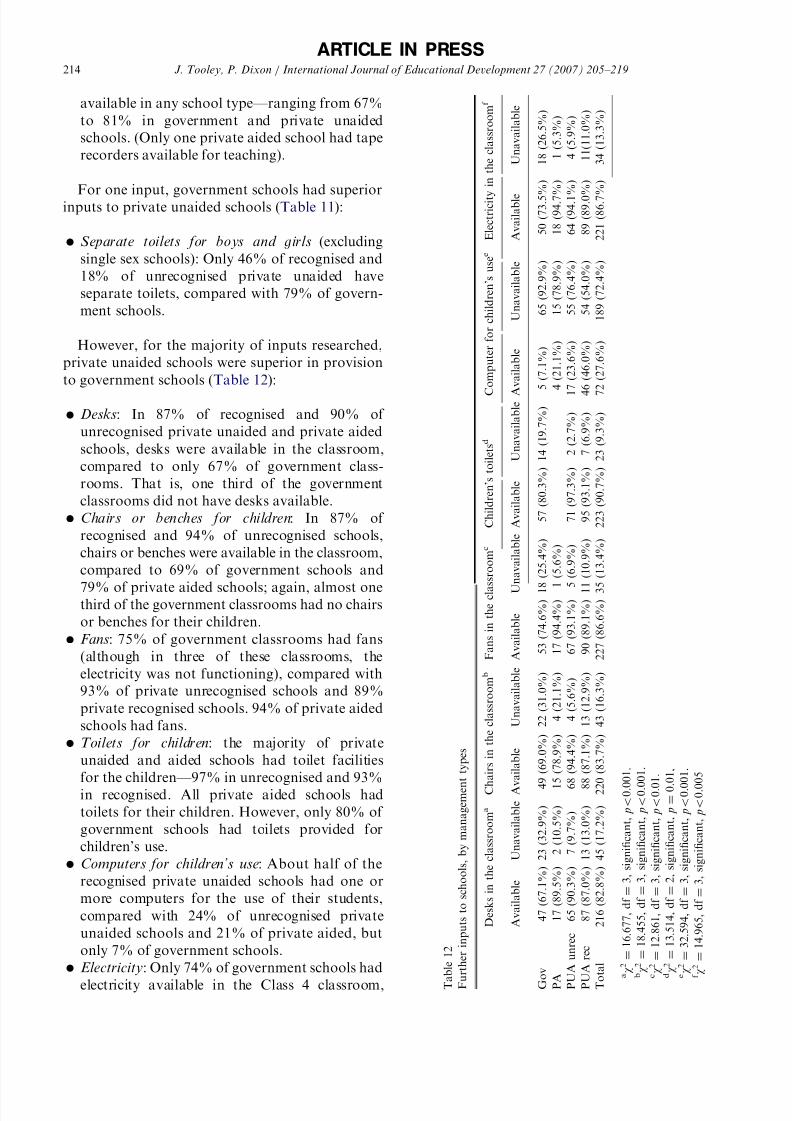
For one input, government schools had superiorinputs to private unaided schools (Table 11):
Separate toilets for boys and girls (excluding
single sex schools): Only 46% of recognised and
18% of unrecognised private unaided have
separate toilets, compared with 79% of govern-
ment schools.
However, for the majority of inputs researched,
private unaided schools were superior in provision
to government schools (Table 12):
Desks: In 87% of recognised and 90% of
unrecognised private unaided and private aided
schools, desks were available in the classroom,
compared to only 67% of government class-
rooms. That is, one third of the government
classrooms did not have desks available.
Chairs or benches for children: In 87% of
recognised and 94% of unrecognised schools,
chairs or benches were available in the classroom,
compared to 69% of government schools and
79% of private aided schools; again, almost onethird of the government classrooms had no chairs
or benches for their children.
Fans: 75% of government classrooms had fans
(although in three of these classrooms, the
electricity was not functioning), compared with
93% of private unrecognised schools and 89%
private recognised schools. 94% of private aided
schools had fans.
Toilets for children: the majority of private
unaided and aided schools had toilet facilities
for the children—97% in unrecognised and 93%
in recognised. All private aided schools had
toilets for their children. However, only 80% of
government schools had toilets provided for
children’s use.
Computers for children’s use: About half of the
recognised private unaided schools had one or
more computers for the use of their students,
compared with 24% of unrecognised private
unaided schools and 21% of private aided, but
only 7% of government schools.
Electricity: Only 74% of government schools had
electricity available in the Class 4 classroom,
ARTICLE IN PRESS
T a
b l e 1 2
F u
r t h e r i n p u t s t o s c h o o l s , b y m a n a g e m e n
t t y p e s
D e s k s i n t h e c l a s s r o o m a
C h
a i r s i n t h e c l a s s r o o m
b
F a n s i n t h e c l a s s r o o m c
C h i l d r e n ’ s t o i l e t s d
C
o m p u t e r f o r c h i l d r e n ’ s u s e e
E l e c t r i c i t y
i n t h e c l a s s r o o m
f
A v a i l a b l e
U n a v a i l a b l e A v
a i l a b l e
U n a v a i l a b l e A v a i l a b l e
U
n a v a i l a b l e A v a i l a b l e
U n a v a i l a b l e A
v a i l a b l e
U n a v a i l a b l e
A v a i l a b l e
U n a v a i l a b l e
G o v
4 7 ( 6 7 . 1 % ) 2 3 ( 3 2 . 9 % ) 4 9 ( 6 9 . 0 % ) 2 2 ( 3 1 . 0 % )
5 3 ( 7 4 . 6 % ) 1 8 ( 2 5 . 4 % )
5 7 ( 8 0 . 3 % ) 1 4 ( 1 9 . 7 % )
5 ( 7 . 1 % )
6 5 ( 9 2 . 9 % )
5 0 ( 7 3 . 5 % )
1 8 ( 2 6 . 5 % )
P A
1 7 ( 8 9 . 5 % )
2 ( 1 0 . 5 % ) 1 5 ( 7 8 . 9 % )
4 ( 2 1 . 1 % )
1 7 ( 9 4 . 4 % )
1 ( 5 . 6 % )
4 ( 2 1 . 1 % )
1 5 ( 7 8 . 9 % )
1 8 ( 9 4 . 7 % )
1 ( 5 . 3 % )
P U
A u n r e c
6 5 ( 9 0 . 3 % )
7 ( 9 . 7 % )
6 8 ( 9 4 . 4 % )
4 ( 5 . 6 % )
6 7 ( 9 3 . 1 % )
5 ( 6 . 9 % )
7 1 ( 9 7 . 3 % )
2 ( 2 . 7 % ) 1 7 ( 2 3 . 6 % )
5 5 ( 7 6 . 4 % )
6 4 ( 9 4 . 1 % )
4 ( 5 . 9 % )
P U
A r e c
8 7 ( 8 7 . 0 % ) 1 3 ( 1 3 . 0 % ) 8 8 ( 8 7 . 1 % ) 1 3 ( 1 2 . 9 % )
9 0 ( 8 9 . 1 % ) 1 1 ( 1 0 . 9 % )
9 5 ( 9 3 . 1 % )
7 ( 6 . 9 % ) 4 6 ( 4 6 . 0 % )
5 4 ( 5 4 . 0 % )
8 9 ( 8 9 . 0 % )
1 1 ( 1 1 . 0 % )
T o
t a l
2 1 6 ( 8 2 . 8 % ) 4 5 ( 1 7 . 2 % ) 2 2 0 ( 8 3 . 7 % ) 4 3 ( 1 6 . 3 % )
2 2 7 ( 8 6 . 6 % ) 3 5 ( 1 3 . 4 % ) 2 2 3 ( 9 0 . 7 % ) 2 3 ( 9 . 3 % ) 7 2 ( 2 7 . 6 % )
1 8 9 ( 7 2 . 4 % )
2 2 1 ( 8 6 . 7 % )
3 4 ( 1 3 . 3 % )
a w 2 ¼
1 6 :
6 7 7 , d f ¼
3 , s i g n i fi c a n t , p o 0 . 0 0 1 .
b w 2 ¼
1 8 :
4 5 5 , d f ¼
3 , s i g n i fi c a n t , p o 0 . 0
0 1 .
c w 2 ¼
1 2 :
8 6 1 , d f ¼
3 , s i g n i fi c a n t , p o 0 . 0 1 .
d w 2 ¼
1 3 :
5 1 4 , d f ¼
2 , s i g n i fi c a n t , p
¼ 0 . 0 1 ,
e w 2 ¼
3 2 :
5 9 4 , d f ¼
3 , s i g n i fi c a n t , p o 0 . 0 0 1 .
fw
2 ¼
1 4 :
9 6 5 , d f ¼
3 , s i g n i fi c a n t , p o 0 . 0 0 5
J. Tooley, P. Dixon / International Journal of Educational Development 27 (2007) 205–219214
8/8/2019 Delhi Schools Research
http://slidepdf.com/reader/full/delhi-schools-research 11/15
compared to 95% of the private aided, 94% of
the private unrecognised and 89% of the private
recognised schools.
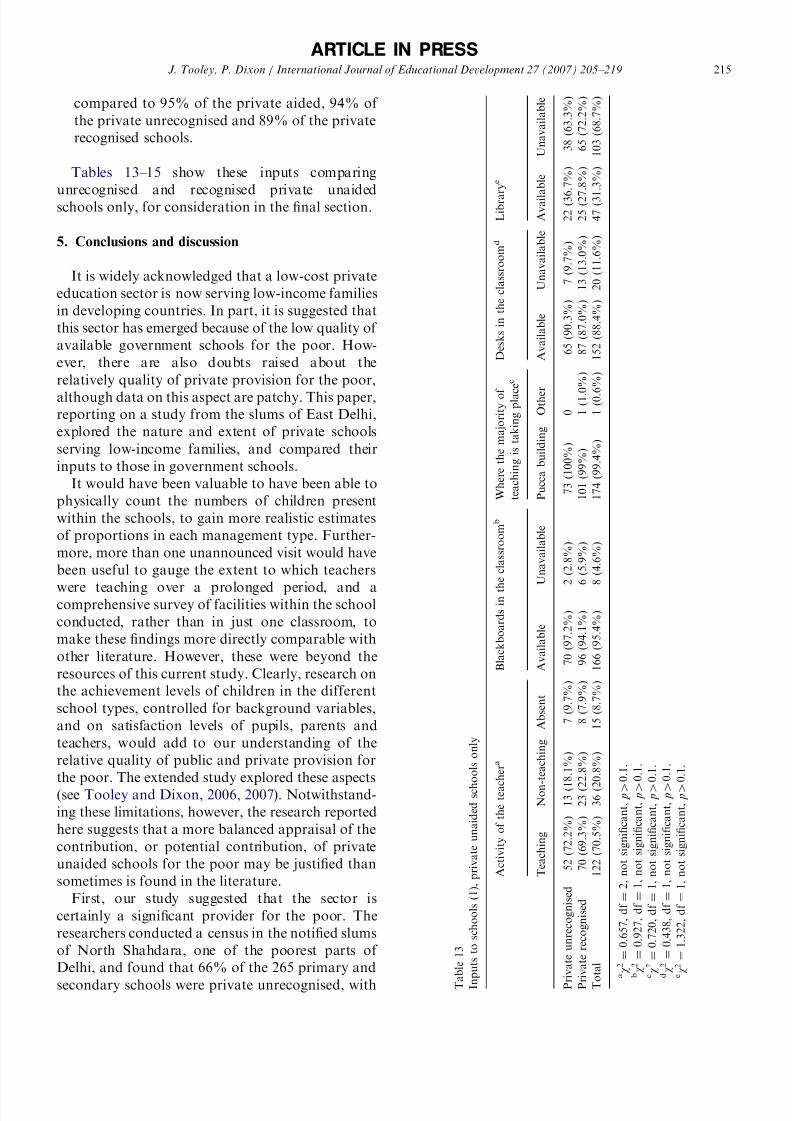
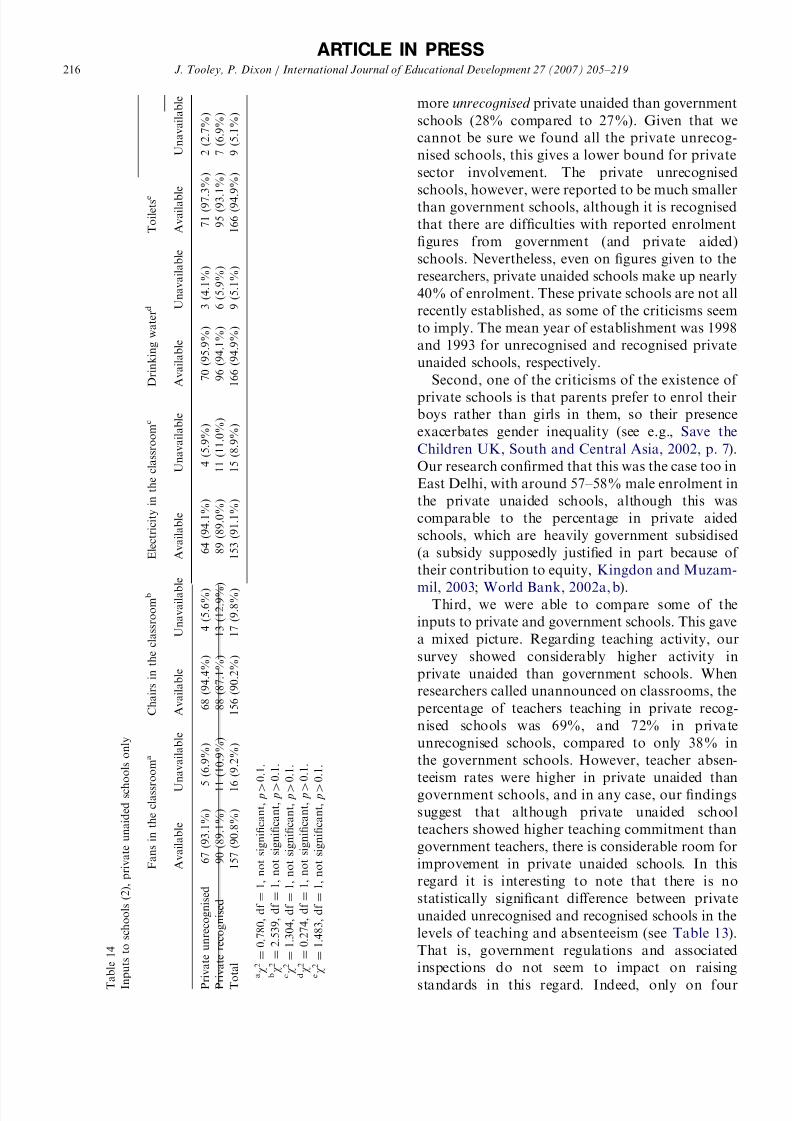
Tables 13–15 show these inputs comparing
unrecognised and recognised private unaidedschools only, for consideration in the final section.
5. Conclusions and discussion
It is widely acknowledged that a low-cost private
education sector is now serving low-income families
in developing countries. In part, it is suggested that
this sector has emerged because of the low quality of
available government schools for the poor. How-
ever, there are also doubts raised about the
relatively quality of private provision for the poor,
although data on this aspect are patchy. This paper,reporting on a study from the slums of East Delhi,
explored the nature and extent of private schools
serving low-income families, and compared their
inputs to those in government schools.
It would have been valuable to have been able to
physically count the numbers of children present
within the schools, to gain more realistic estimates
of proportions in each management type. Further-
more, more than one unannounced visit would have
been useful to gauge the extent to which teachers
were teaching over a prolonged period, and acomprehensive survey of facilities within the school
conducted, rather than in just one classroom, to
make these findings more directly comparable with
other literature. However, these were beyond the
resources of this current study. Clearly, research on
the achievement levels of children in the different
school types, controlled for background variables,
and on satisfaction levels of pupils, parents and
teachers, would add to our understanding of the
relative quality of public and private provision for
the poor. The extended study explored these aspects
(see Tooley and Dixon, 2006, 2007). Notwithstand-
ing these limitations, however, the research reported
here suggests that a more balanced appraisal of the
contribution, or potential contribution, of private
unaided schools for the poor may be justified than
sometimes is found in the literature.
First, our study suggested that the sector is
certainly a significant provider for the poor. The
researchers conducted a census in the notified slums
of North Shahdara, one of the poorest parts of
Delhi, and found that 66% of the 265 primary and
secondary schools were private unrecognised, with
ARTICLE IN PRESS
T a
b l e 1 3
I n p u t s t o s c h o o l s ( 1 ) , p r i v a t e u n a i d e d s c h o o l s o n l y
A c t i v i t y o f t h e t e a c
h e r a
B l a c k b o a r d s i n t h
e c l a s s r o o m
b
W h e r e t h e m a j o r i t y o f
t e a c h i n g i s t a k i n g p l a c
e c
D e s k s i n t h e c l a s s r o o m
d
L i b r a r y e
T e a c h i n g
N o n - t e a c h i n g
A b s e n t
A v a i l a b l e
U n a v a i l a b l e
P u c c a b u i l d i n g
O t h e r
A v a i l a b l e
U n a v a i l a b l e A v a i l a b l e
U n a v a i l a b l e
P r
i v a t e u n r e c o g n i s e d
5 2 ( 7 2 . 2 % ) 1 3 ( 1
8 . 1 % )
7 ( 9 . 7 % )
7 0 ( 9 7 . 2 % )
2 ( 2 . 8 % )
7 3 ( 1 0 0 % )
0
6 5 ( 9 0 . 3 % )
7 ( 9 . 7 % )
2 2 ( 3 6
. 7 % )
3 8 ( 6 3 . 3 % )
P r
i v a t e r e c o g n i s e d
7 0 ( 6 9 . 3 % ) 2 3 ( 2
2 . 8 % )
8 ( 7 . 9 % )
9 6 ( 9 4 . 1 % )
6 ( 5 . 9 % )
1 0 1 ( 9 9 % )
1 ( 1 . 0
% )
8 7 ( 8 7 . 0 % ) 1 3 ( 1 3 . 0 % )
2 5 ( 2 7
. 8 % )
6 5 ( 7 2 . 2 % )
T o
t a l
1 2 2 ( 7 0 . 5 % ) 3 6 ( 2
0 . 8 % )
1 5 ( 8 . 7 % ) 1 6 6 ( 9 5 . 4 % )
8 ( 4 . 6 % )
1 7 4 ( 9 9 . 4 % )
1 ( 0 . 6
% )
1 5 2 ( 8 8 . 4 % ) 2 0 ( 1 1 . 6 % )
4 7 ( 3 1
. 3 % ) 1 0 3 ( 6 8 . 7 % )
a w 2 ¼
0 : 6 5 7 , d f ¼
2 , n o t s i g n i fi c a n t , p 4
0 . 1 .
b w 2 ¼
0 : 9 2 7 , d f ¼
1 , n o t s i g n i fi c a n t , p 4
0 . 1 .
c w 2 ¼
0 : 7 2 0 , d f ¼
1 , n o t s i g n i fi c a n t , p 4
0 . 1 .
d w 2 ¼
0 : 4 3 8 , d f ¼
1 , n o t s i g n i fi c a n t , p 4
0 . 1 .
e w 2 ¼
1 : 3 2 2 , d f ¼
1 , n o t s i g n i fi c a n t , p 4
0 . 1 .
J. Tooley, P. Dixon / International Journal of Educational Development 27 (2007) 205–219 215
8/8/2019 Delhi Schools Research
http://slidepdf.com/reader/full/delhi-schools-research 12/15
more unrecognised private unaided than government
schools (28% compared to 27%). Given that we
cannot be sure we found all the private unrecog-
nised schools, this gives a lower bound for private
sector involvement. The private unrecognised
schools, however, were reported to be much smallerthan government schools, although it is recognised
that there are difficulties with reported enrolment
figures from government (and private aided)
schools. Nevertheless, even on figures given to the
researchers, private unaided schools make up nearly
40% of enrolment. These private schools are not all
recently established, as some of the criticisms seem
to imply. The mean year of establishment was 1998
and 1993 for unrecognised and recognised private
unaided schools, respectively.
Second, one of the criticisms of the existence of
private schools is that parents prefer to enrol theirboys rather than girls in them, so their presence
exacerbates gender inequality (see e.g., Save the
Children UK, South and Central Asia, 2002, p. 7).
Our research confirmed that this was the case too in
East Delhi, with around 57–58% male enrolment in
the private unaided schools, although this was
comparable to the percentage in private aided
schools, which are heavily government subsidised
(a subsidy supposedly justified in part because of
their contribution to equity, Kingdon and Muzam-
mil, 2003; World Bank, 2002a, b).Third, we were able to compare some of the
inputs to private and government schools. This gave
a mixed picture. Regarding teaching activity, our
survey showed considerably higher activity in
private unaided than government schools. When
researchers called unannounced on classrooms, the
percentage of teachers teaching in private recog-
nised schools was 69%, and 72% in private
unrecognised schools, compared to only 38% in
the government schools. However, teacher absen-
teeism rates were higher in private unaided than
government schools, and in any case, our findings
suggest that although private unaided school
teachers showed higher teaching commitment than
government teachers, there is considerable room for
improvement in private unaided schools. In this
regard it is interesting to note that there is no
statistically significant difference between private
unaided unrecognised and recognised schools in the
levels of teaching and absenteeism (see Table 13).
That is, government regulations and associated
inspections do not seem to impact on raising
standards in this regard. Indeed, only on four
ARTICLE IN PRESS
T a
b l e 1 4
I n p u t s t o s c h o o l s ( 2 ) , p r i v a t e u n a i d e d s c h o o l s o n l y
F a n s i n t h e c l a s s r
o o m a
C h a i r s i n t h e c l a s s r o o m
b
E l e c t r i c i t y i n t h e c l a s s r o o m c
D r i n k i n g w a t e r
d
T o i l e t s e
A v a i l a b l e
U n a v a i l a b l e
A v a i l a b l e
U n a v a i l a b l e
A v a i l a b l e
U n a v a i l a b l e
A v a i l a b l e
U n a v a i l a b l e
A v a i l a b l e
U n a v a i l a b l e
P r
i v a t e u n r e c o g n i s e d
6 7 ( 9 3 . 1 % )
5
( 6 . 9 % )
6 8 ( 9 4 . 4 % )
4 ( 5 . 6 % )
6 4 ( 9 4 . 1 % )
4 ( 5 . 9 % )
7 0 ( 9 5 . 9 % )
3 ( 4 . 1 % )
7 1 ( 9 7 . 3 % )
2 ( 2 . 7 % )
P r
i v a t e r e c o g n i s e d
9 0 ( 8 9 . 1 % )
1 1
( 1 0 . 9 % )
8 8 ( 8 7 . 1 % )
1 3 ( 1 2 . 9 % )
8 9 ( 8 9 . 0 % )
1 1 ( 1 1 . 0 % )
9 6 ( 9 4 . 1 % )
6 ( 5 . 9 % )
9 5 ( 9 3 . 1 % )
7 ( 6 . 9 % )
T o
t a l
1 5 7 ( 9 0 . 8 % )
1 6
( 9 . 2 % )
1 5 6 ( 9 0 . 2 % )
1 7 ( 9 . 8 % )
1 5 3 ( 9 1 . 1 % )
1 5 ( 8 . 9 % )
1 6 6 ( 9 4 . 9 % )
9 ( 5 . 1 % )
1 6 6 ( 9 4 . 9 % )
9 ( 5 . 1 % )
a w 2 ¼
0 : 7 8 0 , d f ¼
1 , n o t s i g n i fi c a n t , p 4
0 . 1 .
b w 2 ¼
2 : 5 3 9 , d f ¼
1 , n o t s i g n i fi c a n t , p 4
0 . 1 .
c w 2 ¼
1 : 3 0 4 , d f ¼
1 , n o t s i g n i fi c a n t , p 4
0 . 1 .
d w 2 ¼
0 : 2 7 4 , d f ¼
1 , n o t s i g n i fi c a n t , p 4
0 . 1 .
e w 2 ¼
1 : 4 8 3 , d f ¼
1 , n o t s i g n i fi c a n t , p 4
0 . 1 .
J. Tooley, P. Dixon / International Journal of Educational Development 27 (2007) 205–219216
8/8/2019 Delhi Schools Research
http://slidepdf.com/reader/full/delhi-schools-research 13/15
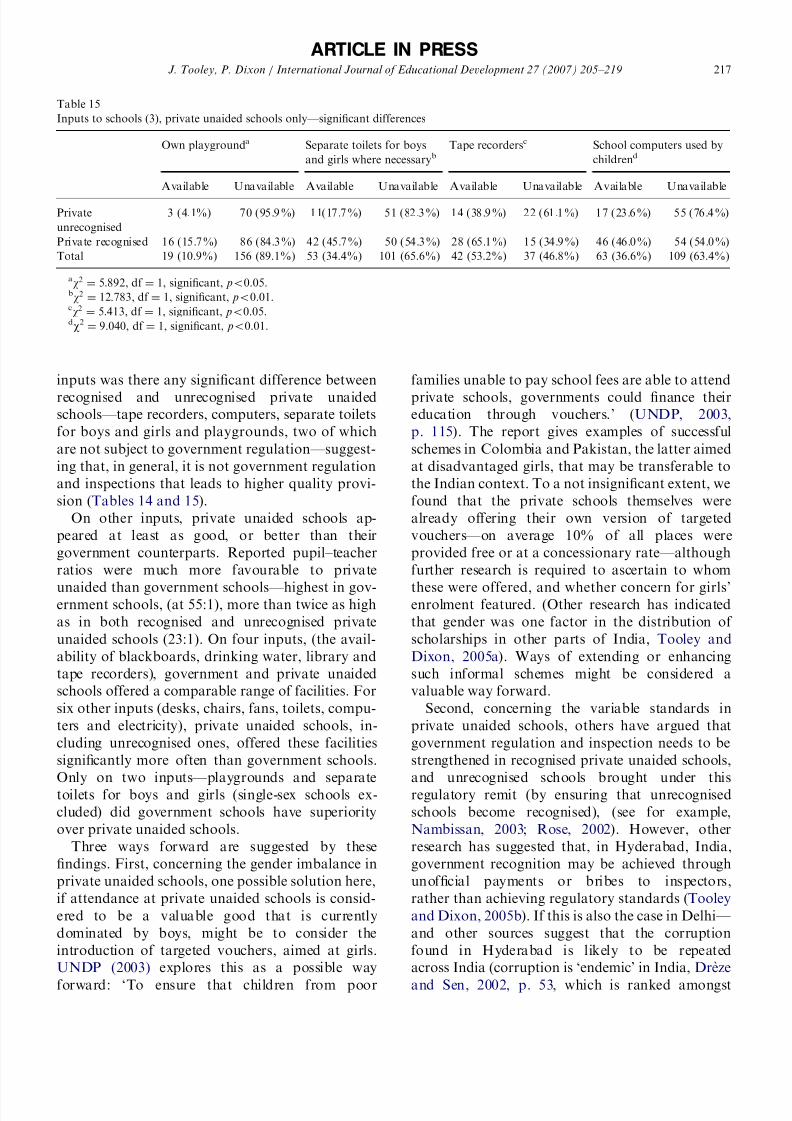
inputs was there any significant difference between
recognised and unrecognised private unaidedschools—tape recorders, computers, separate toilets
for boys and girls and playgrounds, two of which
are not subject to government regulation—suggest-
ing that, in general, it is not government regulation
and inspections that leads to higher quality provi-
sion (Tables 14 and 15).
On other inputs, private unaided schools ap-
peared at least as good, or better than their
government counterparts. Reported pupil–teacher
ratios were much more favourable to private
unaided than government schools—highest in gov-ernment schools, (at 55:1), more than twice as high
as in both recognised and unrecognised private
unaided schools (23:1). On four inputs, (the avail-
ability of blackboards, drinking water, library and
tape recorders), government and private unaided
schools offered a comparable range of facilities. For
six other inputs (desks, chairs, fans, toilets, compu-
ters and electricity), private unaided schools, in-
cluding unrecognised ones, offered these facilities
significantly more often than government schools.
Only on two inputs—playgrounds and separate
toilets for boys and girls (single-sex schools ex-
cluded) did government schools have superiority
over private unaided schools.
Three ways forward are suggested by these
findings. First, concerning the gender imbalance in
private unaided schools, one possible solution here,
if attendance at private unaided schools is consid-
ered to be a valuable good that is currently
dominated by boys, might be to consider the
introduction of targeted vouchers, aimed at girls.
UNDP (2003) explores this as a possible way
forward: ‘To ensure that children from poor
families unable to pay school fees are able to attend
private schools, governments could finance theireducation through vouchers.’ (UNDP, 2003,
p. 115). The report gives examples of successful
schemes in Colombia and Pakistan, the latter aimed
at disadvantaged girls, that may be transferable to
the Indian context. To a not insignificant extent, we
found that the private schools themselves were
already offering their own version of targeted
vouchers—on average 10% of all places were
provided free or at a concessionary rate—although
further research is required to ascertain to whom
these were offered, and whether concern for girls’enrolment featured. (Other research has indicated
that gender was one factor in the distribution of
scholarships in other parts of India, Tooley and
Dixon, 2005a). Ways of extending or enhancing
such informal schemes might be considered a
valuable way forward.
Second, concerning the variable standards in
private unaided schools, others have argued that
government regulation and inspection needs to be
strengthened in recognised private unaided schools,
and unrecognised schools brought under this
regulatory remit (by ensuring that unrecognised
schools become recognised), (see for example,
Nambissan, 2003; Rose, 2002). However, other
research has suggested that, in Hyderabad, India,
government recognition may be achieved through
unofficial payments or bribes to inspectors,
rather than achieving regulatory standards (Tooley
and Dixon, 2005b). If this is also the case in Delhi—
and other sources suggest that the corruption
found in Hyderabad is likely to be repeated
across India (corruption is ‘endemic’ in India, Dre ` ze
and Sen, 2002, p. 53, which is ranked amongst
ARTICLE IN PRESS
Table 15
Inputs to schools (3), private unaided schools only—significant differences
Own playgrounda Separate toilets for boys
and girls where necessarybTape recordersc School computers used by
childrend
Available Unavailable Available Unavailable Available Unavailable Available Unavailable
Private
unrecognised
3 (4.1%) 70 (95.9%) 11(17.7%) 51 (82.3%) 14 (38.9%) 22 (61.1%) 17 (23.6%) 55 (76.4%)
Private recognised 16 (15.7%) 86 (84.3%) 42 (45.7%) 50 (54.3%) 28 (65.1%) 15 (34.9%) 46 (46.0%) 54 (54.0%)
Total 19 (10.9%) 156 (89.1%) 53 (34.4%) 101 (65.6%) 42 (53.2%) 37 (46.8%) 63 (36.6%) 109 (63.4%)
aw
2¼ 5:892, df ¼ 1, significant, po0.05.
bw
2¼ 12:783, df ¼ 1, significant, po0.01.
cw
2¼ 5:413, df ¼ 1, significant, po0.05.
dw2¼ 9.040, df ¼ 1, significant, po0.01.
J. Tooley, P. Dixon / International Journal of Educational Development 27 (2007) 205–219 217
8/8/2019 Delhi Schools Research
http://slidepdf.com/reader/full/delhi-schools-research 14/15
the top ten most corrupt nations in the world
Mitra, 1998, Qp. 38), then this may not be an
immediate way of raising standards in private
unaided schools. Third, an alternative approach
(raised in Tooley and Dixon, 2005b), would be to
consider how private unaided schools could bebrought within systems of self-regulation and
accreditation to assist in school improvement, and
so enhance the learning experiences of students
within them.
References
Aggarwal, Y., 2000. Public and Private Partnership in Primary
Education in India: A Study of Unrecognised Schools in
Haryana. National Institute of Educational Planning and
Administration, New Delhi.Akhamadi, S.U., Suryadarma, D., 2000. When teachers are
absent: Where do they go and what is the impact on students?
SMERU Field Report. SMERU Research Institute,
Indonesia.
Alderman, H., Orazem, P.F., Paterno, E.M., 2001. School
quality, school cost and the public/private school choices of
low-income households in Pakistan. Journal of Human
Resources 36 (2), 304–326.
Alderman, H., Kim, J., Orazem, P.F., 2003. Design, evaluation,
and sustainability of private schools for the poor: the Pakistan
urban and rural fellowship school experiment. Economics of
Education Review 22, 265–274.
Ali, M., Reed, T., 1994. A school and Parental Survey of Book
Provision Issues in NWFP. International Book Development
Ltd.
Baurer, A., Brust, F., Hybbert, J., 2002. Entrepreneurship: a case
study in African enterprise growth, expanding private
education in Kenya: Mary Okelo and Makini Schools.
Columbia Business School. Chazen Web Journal of Interna-
tional Business, Fall.
Census of India, 2001. Primary Census Abstract: Haryana, Delhi
and Rajasthan, vol. 2. Government of India, Delhi.
Chaudhury, N., Hammer, J., Kremer, M., Muralidharan, K.,
Halsey Rogers, F., 2004a. Provider Absence in Schools and
Health Clinics (Available from: /http://worldbank.orgS
accessed October 2004].
Chaudhury, N., Hammer, J., Kremer, M., Mularidharan, K.,Rogers, H., 2004b. Roll Call Teacher Absence in Bangladesh.
World Bank, Washington, DC.
De, A., Majumdar, M., Samson, M., Noronha, C., 2002. Private
schools and universal elementary education. In: Govinda, R.
(Ed.), India Education Report: A Profile of Basic Education.
Oxford University Press, Oxford and New Delhi,
pp. 131–150.
Dre ` ze, J., Sen, A., 2002. India: Development and Participation,
second ed. Oxford University Press, New Delhi, Oxford.
Glewwe, P., Illias, N., Kremer, M., 2004. Teaching incentives.
National Bureau of Economic Research Working Paper.
Government of India, 2005. Labour Bureau, Minimum Wages,
(Available from /http://labourbureau.nic.in/wagetb/htmS)
accessed 10.10.05.
Habyarimana, J., Das, J., Dercon, S., Krishnan, P., 2004. Sense
and Absence: Absenteeism and Learning in Zambian Schools.
World Bank, Washington, DC.
Kingdon, G., 1996. Student achievement and teacher pay.
Discussion Paper, No. 74, STICERD, London School of
Economics, August.
Kingdon, G., Dre ` ze, J., 1998. Biases in educational statistics. TheHindu, 6 March.
Kingdon, G., Muzammil, M., 2003. The Political Economy of
Education in India: Teacher Politics in Uttar Pradesh. Oxford
University Press, New Delhi, Oxford, New York.
Kremer, M., Mularidharan, K., Chaudhury, N., Hammer, J.,
Rogers, H., 2004. Teacher Absence in India (Available
from: /http://econ.worldbank.org/files/36660_Absenteeism.
India.Schools.June.2004.pdf S accessed October 2004).
Mitra, C., 1998. The Corrupt Society: The Crimilization of India
from Independence to the 1990s. Viking Penguin India, New
Delhi, India.
Nambissan, G.B., 2003. Educational deprivation and primary
school provision: a study of providers in the city of Calcutta.
IDS Working Paper 187, Institute of Development Studies.Nwagwu, C.C., 1997. The environment of crises in the Nigerian
Education System. Comparative Education 33 (1), 87–95.
Rana, K., Rafique, A., Sengupta, A., 2002. The Delivery of
Primary Education: A Study in West Bengal. TLM Books and
Pratichi (India) Trust, Delhi.
Rogers, H.F., Lopez-Calix, J., Chaudhury, N., Hammer, J.,
Cordoba, N., Kremer, M., Muralidharan, K., 2004. Teacher
absence and incentives in primary education: results from a
national teacher tracking survey in Ecuador. Ecuador:
Creating Fiscal Space for Poverty Reduction: A Fiscal
Management and Public Expenditure Review vol. 2,
136–162 (Chapter 6).
Rose, P., 2002. Is the non-state education sector serving the needs
of the poor? Evidence from East and Southern Africa. Paper
prepared for DfID Seminar in preparation for 2004, World
Development Report.
Rose, P., 2003. From the Washington to the Post-Washington
Consensus: the influence of international agendas on educa-
tion policy and practice in Malawi. Globalisation, Societies
and Education 1 (1), 67–86.
Save the Children UK, South and Central Asia, 2002. Private
sector involvement in education: a perspective from Nepal
and Pakistan. Submission to ‘‘The Private Sector as Service
Provider and its Role in Implementing Child Rights’’, Office
of the High Commissioner for Human Rights, Geneva, 20
September.
The Probe Team, 1999. Public Report on Basic Education inIndia. Oxford University Press, Oxford and New Delhi.
Tooley, J., Dixon, P., 2005a. An inspector calls: the regulation of
‘budget’ private schools in Hyderabad, Andhra Pradesh,
India. International Journal of Educational Development 25,
269–285.
Tooley, J., Dixon, P., 2005b. Is there a conflict between
commercial gain and concern for the poor? Evidence from
private schools for the poor in India and Nigeria. Economic
Affairs 25 (2), 20–27.
Tooley, J., Dixon, P., 2006. ‘De Facto’ privatisation of education
and the poor: implications of a study from sub-Saharan
Africa and India, Compare 36(4).
Tooley, J., Dixon, P., 2007. Private education for low income
families: Research from a global research project. In:
ARTICLE IN PRESS
J. Tooley, P. Dixon / International Journal of Educational Development 27 (2007) 205–219218
8/8/2019 Delhi Schools Research
http://slidepdf.com/reader/full/delhi-schools-research 15/15
Srivastava, P., Walford, G. (Eds.), Private Schooling in Less
Economically Developed Countries: Asian and African
Perspective. Symposium Books, Didcot.
UNDP, 2003. Human Development Report 2003. United
Nations Development Programme, New York.
Watkins, K., 2000. The Oxfam Education Report. Oxfam in
Great Britain, Oxford.World Bank, 2002a. India, Karnataka: secondary education and
the new agenda for economic growth. Human Development
Sector Unit, South Asia Region, Report No. 24208-IN,
June 13.
World Bank, 2002b. India, Karnataka: financing education in the
context of economic restructuring. Human Development
Sector Unit, South Asia Region, Report No. 24207-IN,
June 13.
World Bank, 2003. Making Services Work for Poor People:
World Development Report 2004. World Bank/Oxford
University Press, Washington, DC/Oxford.World Bank, 2004. Papua New Guinea: Public Expenditure
and Service Delivery (Discussion Draft). World Bank,
Washington, DC.
ARTICLE IN PRESS
J. Tooley, P. Dixon / International Journal of Educational Development 27 (2007) 205–219 219