delineation of landslide slip surfaces using ground
TRANSCRIPT

Western Washington University Western Washington University
Western CEDAR Western CEDAR
WWU Graduate School Collection WWU Graduate and Undergraduate Scholarship
Fall 2003
Delineation of Landslide Slip Surfaces Using Ground Penetrating Delineation of Landslide Slip Surfaces Using Ground Penetrating
Radar as Compared and Contrasted with Existing Slip Surface Radar as Compared and Contrasted with Existing Slip Surface
Data: Evaluation of GPR for Landslide Slip Surface Determination Data: Evaluation of GPR for Landslide Slip Surface Determination
Michael E. (Michael Eric) Hutchinson Western Washington University, [email protected]
Follow this and additional works at: https://cedar.wwu.edu/wwuet
Part of the Geology Commons
Recommended Citation Recommended Citation Hutchinson, Michael E. (Michael Eric), "Delineation of Landslide Slip Surfaces Using Ground Penetrating Radar as Compared and Contrasted with Existing Slip Surface Data: Evaluation of GPR for Landslide Slip Surface Determination" (2003). WWU Graduate School Collection. 665. https://cedar.wwu.edu/wwuet/665
This Masters Thesis is brought to you for free and open access by the WWU Graduate and Undergraduate Scholarship at Western CEDAR. It has been accepted for inclusion in WWU Graduate School Collection by an authorized administrator of Western CEDAR. For more information, please contact [email protected].

Delineation of Landslide Slip Surfaces Using Ground Penetrating Radar as Compared and
Contrasted with Existing Slip Surface Data: Evaluation of GPR for Landslide Slip
Surface Determination
by
Michael E. Hutchinson, L.G., L.Hg.
Accepted in Partial Completion
of the Requirements for the Degree
Master of Science
_________Moheb A. Ghali, Dean of Graduate School
ADVISORY COMMITTEE_________
Chair, Bernard Housen, L.G.

MASTER’S THESIS
In presenting this thesis in partial fulfillment of the requirements for a master’s degree at Western Washington University, I agree that the Library shall make its copies freely available for inspection. I further agree that copying of this thesis project in whole or in part is allowable only for scholarly purposes. It is understood, however, that any copying or publication of this thesis for commercial purposes, or for financial gain, shall not be allowed without my written permission.
Signature

MASTER’S THESIS
In presenting this thesis in partial fulfillment of the requirements for a master’s degree at Western Washington University, I grant to Western Washington University the non-exclusive royalty-free right to archive, reproduce, distribute, and display the thesis in any and all forms, including electronic format, via any digital library mechanisms maintained by WWU. I represent and warrant this is my original work, and does not infringe or violate any rights of others. I warrant that I have obtained written permissions from the owner of any third party copyrighted material included in these files. I acknowledge that I retain ownership rights to the copyright of this work, including but not limited to the right to use all or part of this work in future works, such as articles or books. Library users are granted permission for individual, research and non-commercial reproduction of this work for educational purposes only. Any further digital posting of this document requires specific permission from the author. Any copying or publication of this thesis for commercial purposes, or for financial gain, is not allowed without my written permission.
Michael Hutchinson February 22, 2018

Surface Determination
Delineation of Landslide Slip Surfaces Using Ground Penetrating Radar as Compared and
Contrasted with Existing Slip Surface Data: Evaluation of GPR for Landslide Slip
A ThesisPresented to the Faculty of
Western Washington University
In Partial Completion of the Requirements for the Degree
Master of Science
byMichael E. Hutchinson, L.G., L.Hg.
December 2003

ABSTRACT
Ground penetrating radar (GPR) was used to investigate two landslides within the
South Puget Sound region to evaluate if this technology could be used to delineate slip
surface location. The internal structures of two landslides with similar stratigraphic and
geographic settings in the South Puget Sound Region were evaluated using GPR. For
the two landslides studied, results of prior geologic and geotechnical work identified the
location and extent of each landslide slip surface. Longitudinal and latitudinal GPR
transects were completed on each landslide mass to map subsurface radar reflection
amplitudes (radargrams) and times. To convert radar travel times to depths, radar
velocities were determined using common midpoint surveys. GPR data were compared
to previously collected geotechnical data characterizing the landslide mass using known
techniques. Results show a correlation between landslide slip surface location and high
amplitude reflectors displayed on radargrams on a landslide mass consisting
predominantly of sands and gravels providing optimum radar penetration. The GPR
technique was not successful on the landslide mass with higher silt content, which
resulted in a larger degree of radar wave attenuation.
iv
J

TABLE OF CONTENTS
LIST OF TABLES AND FIGURES............................................................................vi
INTRODUCTION........................................................................................................1
GENERAL 1
GROUND PENETRATING RADAR 2
STUDY AREA 6
Eldon Landslide 8
Tahuya Landslide 9
METHODOLOGY......................................................................................................10
INVESTIGATION...................................................................................................... 12
ELDON LANDSLIDE.................................................................................... 13
Eldon Transect Results 13
Eldon Transect Discussion 16
TAHUYA LANDSLIDE................................................................................ 17
T ahuya T ransect Results 17
Tahuya Transect Discussion 19
DISCUSSION AND CONCLUSIONS......................................................................20
REFERENCES........................................................................................................... 24
ABSTRACT................................................................................................................ iv
V

LIST OF TABLES AND FIGURES
Table 1 Typical Dielectric Constant, Electrical Conductivityand Velocity Observed in Common Geological Materials 26
Table 2 Common Midpoint Results 27
Figure 1 Simplified Diagram Showing Components of GPR System 28Figure 2 Typical Radargram Displayed as a Linscan and Oscilloscope Trace 29Figure 3 Location of Eldon and Tahuya Landslides in Washington State 30Figure 4 Location of Eldon Landslide 31Figure 5 Eldon Landslide Features 32Figure 6 Eldon Landslide Cross Section 33Figure 7 Location of Tahuya Landslide 34Figure 8 Tahuya Landslide Features 35Figure 9 Tahuya Landslide Cross Section 36Figure 10 Simplified CMP Diagram 37Figure 11 Eldon Landslide CMP Survey 38Figure 12 Eldon Landslide Transect A 39Figure 13 Eldon Landslide Transect B 40Figure 14 Eldon Landslide Transect C 41Figure 15 Eldon Landslide Transect D 42Figure 16 Eldon Landslide Transect E 43Figure 17 Eldon Landslide Transect F 44Figure 18 Eldon Landslide Transect G 45Figure 19 Eldon Landslide Transect H 46Figure 20 Eldon Landslide Transect N Winter Surveys 47Figure 21 Seasonal Comparisons Transects N and A 48Figure 22 Eldon Landslide Transect O Winter Survey 49Figure 23 Seasonal Comparisons Transects O and E 50Figure 24 Tahuya Landslide CMP Survey 51Figure 25 Tahuya Landslide Transect I 52Figure 26 Tahuya Landslide Transect J 53Figure 27 Tahuya Landslide Transect K 54Figure 28 Tahuya Landslide Transect L 55Figure 29 Tahuya Landslide Transect M 56

INTRODUCTION
GENERAL
In the United States annual economic losses due to landslides have been estimated
to range from $1 billion to $2 billion (Schuster, 1996). With continued housing
development in landslide-prone areas, landslide occurrence and monetary losses will
persist and most likely increase. Expedient evaluation and stabilization of landslides
helps to reduce their economic impact and can improve safety to life as well. Landslide
slip surface delineation is critical for proper mitigation design measures (Holtz and
Hubatka, 1996).
The slip surfaces of landslides are commonly characterized through the use of
subsurface exploration such as borings, test pits, etc., together with instrumentation such
as tiltmeters, inclinometers, extensometers and/or piezometers which offer discrete data at
specific locations. Borings and instrumentation for landslide monitoring and mitigation
are often sparse because of the high cost of these proven methods. The slip surface must
then be determined by interpretation of the data and extrapolation between measured
locations. Despite some advances in technology (e.g. inclinometers) further development
of new instrumentation technology for monitoring landslides and delineating slip surfaces
has been limited. The slow-paced gains in landslide monitoring have been attributed to
the following (Mikkelson, 1996):
• Geotechnical industry is small and highly specialized
• Support for research and development has dwindled

With new technologies developing slowly to characterize slip surfaces, and with
more development in landslide prone areas, there is a clear need for new techniques to
facilitate slip surface characterization. This project addresses one such technique that
could potentially generate three-dimensional constraints of landslide slip surfaces through
visual and numerical methods: ground penetrating radar (GPR).
GROUND PENETRATING RADAR
Ground penetrating radar (Figure 1) involves the transmission of high frequency
electromagnetic radio (radar) pulses into the earth and measuring the time elapsed
between transmission of the waves into the subsurface, reflection of a portion of the
incident waves off of a sub-surface discontinuity, and reception back at a surface antenna
(Conyers and Goodman, 1997). Reflected waves produce a radargram from single
oscilloscope traces (Figure 2). This relatively new technology, pioneered by Ulrickson
(1982), enables high-resolution mapping of bedrock and soil stratigraphy (Davis and
Arman, 1989). Typical GPR frequencies range from 15-1000 Mhz with corresponding
wavelengths of ~2 m to ~0.1 m. Portions of the wave are reflected at discontinuities in
the underground back to the surface and recorded (Grasmuck and Green, 1996).
Subsurface properties that produce reflections occur at the interfaces varying electrical
and magnetic properties. To characterize these reflections the relative dielectic constant
of the subsurface materials must be known. The dielectric constant can be thought of as a
measure of the ability of a material within an electromagnetic field to respond to
propagated electromagnetic waves (Olhoeft, 1981). A larger amplitude reflection will be
produced where there is a greater difference between the dielectric constants at an
2

interface (Conyers and Goodman, 1997). The magnitude of the reflection generated at an
interface can be quantified using equation (1) below if the dielectric constant is known
(Sellman et al., 1983; Walden and Hosken, 1985; Davis and Annan, 1989):
R=[(K,)"2-(K2)"']/[(K,)*'2+ (K2)''^] (1)
R = reflection coefficient
Ki = dielectric constant of overlying material
K2 = dielectric constant of underlying material
In order to generate a significant reflection, the change in dielectric constants
between two materials must occur across an interval of time appropriate for the radar
frequency being used. The degree to which the radar reflections can be detected is a
function of the original signal strength and the amplitude of the reflected waves. The
higher the amplitude, the more easily detectable the reflections become. Lower amplitude
reflections usually occur when there are only small differences in the dielectric constants
between layers (Conyers and Goodman, 1997). The arrival times and amplitudes of
reflected signals provide the information necessary to construct a subsurface image and
can be used to constrain the differences in subsurface physical properties that are
responsible for the reflection. These differences can be represented numerically, by the
reflection coefficients and visually, by the profiles.
Electrical properties of geological materials are primarily controlled by the water
content (Topp et al., 1980). Variations in the electrical properties of soils are usually
associated with volumetric water content, which, in turn, give rise to radar reflections. In
previous studies by Davis and Annan (1989), fresh water has been determined to have a
3

dielectric constant (unitless value) of approximately 80, saturated sand approximately 20-
30 and dry sand approximately 3-5 (Table 1) (Davis and Annan, 1989). Based on these
studies by Topp et al (1980), Davis and Annan (1989) and equation 1, a saturated/dry
interface will provide a prominent reflection.
Over the past 10 years, GPR studies in a wide variety of geomorphic and geologic
settings have revealed detailed stratigraphic information as well as information regarding
GPR uses and limitations. GPR studies have predominantly focused on the application of
GPR and not the theory of its operation. Davis and Annan (1989) describe GPR
concepts, electrical properties, radar system characteristics, equipment, methods and
interpretation in detail. Davis and Annan explain the relationship between the resolvable
thicknesses of a reflector as related to subsurface velocity at varying antennae velocities
and the thickness of a reflector. Future studies should provide further information
regarding the theory of GPR operation.
Applicable studies involving the application of GPR and its uses and limitations
in various geologic settings have been conducted. Jol (1995) demonstrated that the
vertical resolution of GPR increases with increasing radar frequency and that the depth of
penetration increases with decreasing radar frequency. Jol also concluded that the
resolvable thickness of a reflector is a function of the wavelength of the antennae and the
subsurface radar velocity. With decreasing antennae frequencies and material velocities
the overall thickness of the reflector would need to be increased to provide a reflection.
Jol determined a 200 MHz antennae was able to resolve a reflector of an approximate
thickness of 0.25 m with a subsurface velocity of 0.20 m/ns. Jol (1995) also
4

demonstrated that there is a correlation between increasing antennae frequencies and
depth penetration. Jol utilized a 25, 50, 100 and 200 MHz antennae in deltaic sediments
and visually interpreted radargrams showing that with increasing antennae frequencies the
return signal from a reflector increased but the overall depth penetration decreased while
the overall resolution increased.
Hruska and Hubatka (2000) describe the application of GPR to investigate
landslide slip surfaces in the Czech Republic, but their study lacked the detail for
development of a methodology for future investigations. Hruska and Hubatka determined
that geophysical methods provide information about the internal structure (cracks and
fissures) of landslides providing possible mitigation solutions.
Bamhardt and Kayen (2000) used GPR to investigate the internal structure of two
landslides in Anchorage, Alaska, that resulted from the 1964 earthquake. GPR data was
compared with previous investigations and it was determined that GPR reflection surveys
accurately reproduced subsurface geometry of horst and graben structures and imaged
finer scale images such as ground cracks and fissures. A pulseEKKO 100 GPR system
was used to collect 1000 meters of reflections profiles on two separate landslide masses
during this study. The stratigraphy of the subsurface materials in this study area consisted
of 1) glacial till unconformably overlying bedrock; 2) silty clay of the Bootlegger Cove
Formation resting on till or bedrock, and; 3) outwash sand and gravel on the surface
(Bamhardt and Kayen, 2000). This study was limited by the propagation of radar waves
into the subsurface and only provided information regarding the internal structure of the
5

landslide mass (horst and graben features) with no insight into landslide slip surface
location.
Bruno and Marlillier (2000) tested GPR using a 100 MHz antenna (no other
system information was provided) on a landslide in the Swiss Alps to help reveal
geologic structures and processes and thus help devise mitigation strategies. The geology
in this study area consisted of Jurassic shale and gypsum. This study found that GPR
profiling provided limited success due to the GPR signals being very “short” due to the
high conductivity of the subsurface and this technique is expected to be site dependent if
to be successfully applied to landslide evaluation. Bruno and Marlillier provided no
further information and the GPR section (not provided) was deemed unsatisfactory for
review.
Knight (2001) determined through review of numerous journal articles that GPR
offers a non-invasive geophysical technique to estimate hydrogeologic properties such as
water content, porosity, and permeability. Knight also determined that GPR can provide
useful information about large scale structures within the top few tens of meters of earth
but is limited in the ability to obtain accurate, quantitative information about subsurface
properties of interest at the required scale due to the spatial complexity of the subsurface.
Knight’s review does not expand on the limits of GPR and what is defined as “accurate,
quantitative information.”
STUDY AREA
The Puget Sound Lowland is a north-south trending structural depression
bordered on the west by the Olympic Mountains and the east by the Cascade Mountains
6

(Figure 3). Repeated glaciations during the Pleistocene have carved the Puget Lowlands
leaving thick deposits of glacial tills, glacio-lacustrine silts and clays, and glacio-fluvial
sands and gravels. These glacial deposits are underlain by Tertiary bedrock units
primarily associated with the Crescent terrane, a complex sequence of marine basalts and
terrestial and marine sedimentary rocks (Babcock, et al., 1994). Hillslopes in the area are
commonly oversteepened by erosion or landslides and have been deeply incised by
streams. Regional susceptibility to landslides mainly reflects low-strength, thin soils
underlain by relatively impermeable high-strength glacial sediments and/or bedrock. The
Puget Lowland is also characterized by abundant rain or combination of rain and snow.
Many landslide types occur in the Puget Lowland including falls and topples,
slides, spreads and flows. The purpose of this research is to evaluate GPR reflection
amplitudes for delineating slip surfaces of landslides in the Puget Lowland. The
objective of this project is to attempt to characterize known slip surfaces of landslides
typical within the Puget Lowland and determine the applicability of GPR. GPR may
provide discrete information regarding reflection amplitudes at the slip surfaces of
landslides and contribute to future research in the area of GPR and the delineation of slip
surfaces using this method.
To support this study drilling logs and inclinometer data for many landslides
within the Puget Sound Lowland were reviewed. Resources for the data included
GeoEngineers Inc., Washington State Department of Transportation and Mason County
Department of Public Works. Landslides with well-determined slip surfaces were
selected from the existing data and reports and are discussed further below.
7

Eldon Landslide
The Eldon Landslide (Figure 4) is in the southern portion of the Puget Lowland
located approximately 23 miles north of Shelton along State Route 101. The Eldon
landslide is approximately 300 meters long and is 73 meters wide near the headscarp and
128 meters wide near the toe (Figure 5). The project area consists of four distinct
engineering geologic units. These units (from stratigraphically lowest to highest) are:
Unit 4, Bedrock, consisting of fine grained basalt; Unit 3, Glacial Till, consisting of very
dense, dark brown to gray, silty sandy gravel with cobbles and boulders; Unit 2, Glacio-
lacustrine Silts and Clays consisting of stiff to very hard, dark gray, clayey silt to silty
clay; Unit 1, Glacial Outwash Sands and Gravels, consisting of loose to very dense,
brown to gray, sandy gravels and silty sands (Figure 6) (WSDOT, 2000).
The Eldon Landside was chosen for this study based on the detailed data
interpreting the landslide slip surface. During late winter 1980 a series of four test
borings were advanced within the landslide. Due to lack of project information in the
files, it is not clear what types of instrumentation were installed to monitor the landslide
at this time, although at least one of the borings had an inclinometer installed. In
February 1995, after renewed landslide activity, a series of new test borings were
advanced into the landslide. A total of six test borings at three locations were advanced
to determine subsurface conditions, obtain disturbed and undisturbed samples and to
install slope inclinometers and open standpipe piezometers to monitor ground movement
and groundwater, respectively. During the winter of 1998-1999 abnormally high
8

precipitation resulted in movement of the Eldon Landslide and catastrophic failures of
another two very large landslides adjacent to the site (WSDOT, 2000).
WSDOT found that movement within the landslide appears to be translational in
nature (sliding block). Based on monitoring of the slope inclinometers and recent
measurements of both the sheared slope inclinometers and piezometers the depth of the
failure surface ranges from 6 to 15 meters below ground surface (WSDOT, 2000).
The Eldon landslide took over 5 years to be characterized while nearby
catastrophic failures occurred indicating the need for expeditious characterizations of
landslide slip surfaces.
Tahuya Landslide
The Tahuya Landslide is in the southern portion of the Puget Lowland located
approximately 1 mile southeast of Tahuya, Washington (Figure 7). The Tahuya landslide
is approximately 110 meters long and is 150 meters wide near the headscarp and 340
meters wide near the toe (Figure 8). The soils consist of glacial outwash that are either in
situ or have been reworked as the result of slope processes and landslide activities (Figure
9).
The Tahuya Landslide was chosen for this study based on the detailed data
available delineating the landslide slip surface. The landslide is a complex rotational
slide with several smaller landslides that have coalesced to form a large feature. The
Tahuya landslide contrasts the Eldon landslide due to the higher silt content located in the
upper few meters and that it is a rotational feature compared to a translational feature.
9

Previous investigations (GeoEngineers, 1998) determine the undisturbed outwash
deposits located in the upper slope consist of loose sand with varying quantities of silt
and gravel in the upper 6 meters grading downward to very dense sand, gravel and very
hard silt. The mid-slope soils consist of landslide deposits to a depth of approximately 7
meters. The landslide deposits consist of loose, reworked sand, gravel and silt outwash
deposits. The landslide deposits rest on a hard, intact silt layer, which in turn overlies
undisturbed outwash deposits consisting of interbedded very dense silty gravel, clean to
silty sand and occasional silt beds. The thickness of individual beds is approximately 1 to
5 meters. The soil along the lower portion of the slope consists of loose to medium dense
soil near the surface, overlying very dense interbedded sand and gravel (GeoEngineers,
1998).
METHODOLOGY
In an attempt to develop an expeditious delineation method for slip surface
location, GPR transects were completed on the 2 displaced landslide masses. Transect
locations were chosen where previously completed roads and/or trails were located.
These transects were extended across the displaced landslide mass, flanks, crovm, and/or
toe of the landslides. GPR profiles were then compared against existing monitoring data
for reflections that exist at depths of known slip surfaces. Two transects for a single slide
were repeated during the winter months of 2002 to compare seasonal variations of the
reflected radar signals.
The Eldon and Tahuya landslides were surveyed with a Geophysical Survey
Systems, Inc. (GSSI) SIR-2000 GPR system. The system includes a transmitter, receiver.
10

respective cables and a control unit. A shielded 200MHz and unshielded 50 MHz
transmitter/receiver (antennae) were used. The transmitter sends a short pulse of
electromagnetic energy into the ground. The signal reflects off interfaces having
contrasting dielectric constants and returns to the receiver. The receiver measures the
two-way travel time of the signal in nanoseconds (ns). The return signals were post-
processed using RADAN-NT software (GSSI), and converted into images (radargrams)
that depict the reflections of radar waves in the subsurface.
Post-processing of 200 MHz transects for the Eldon landslide were performed
using a horizontal high-pass filter to remove visible bands of ringing. Ringing is
displayed as horizontal banding that appears in many GPR records. These bands can
obscure reflection data that would otherwise be visible (Conyers and Goodman, 1997).
Post-processing of 200 Mhz transect for the Tahuya transects was performed using a
range gain of 10 decibels to compensate for reduction in reflection amplitude.
Topography was surveyed using a total station and elevations were corrected during
radargram transect post processing.
A 50 MHz common midpoint (CMP) survey was performed on the Eldon and
Tahuya landslides to determine velocity of radar through the ground and determine an
appropriate scale for the completed transects. During a CMP survey, a reflection is
produced where a reflector is centered on a single point (Figure 10). The transmitter and
reflector are moved in opposite directions at equal intervals. By separating the transmitter
and receiver about a single point, the system will measure the travel time along multiple
paths with the travel times varying in a hyperbolic manner. By graphing the distance (x^)
11

versus return time (t^) the slope of the plotted reflector will give the velocity (v^). This
allows the conversion from travel time to depth (Figure 10). Dielectric constants,
electrical conductivities and velocity observed in common geologic materials were
determined by Davis and Annan (1989) (Table 1).
The electric permittivity controls radar wave velocity, while the electrical
conductivity has a large effect on attenuation of radar waves (Knight, 2001). High silt-
content soils will effectively have a higher electrical conductivity, lower velocity, and
greater attenuation (Davis and Annan, 1979). Limited radar signal loss based on
electrical conductivity, velocity, and attenuation are considered “low loss conditions”
(low attenuation). “Low loss conditions” are expressed mathematically by the inequality
a/coE <1 where a is electrical conductivity, co is angular frequency and s is dielectric
permittivity. This equation indicates that GPR cannot be used where conductivity is too
high; high values of a result in highly attentuated medium. Clay mineral content (high c)
on the order of 5-10% can reduce the penetration depth of radar to less than a meter
(Knight, 2001).
GPR transect profiles were reviewed and amplitude reflectors were noted and
marked and compared against existing boring data to evaluate correlation of GPR data
with confirmed conventional methods currently used for slip surface.
INVESTIGATION
ELDON LANDSLIDE
Eight GPR transects (A through H) using a 200 MHz antenna were completed on
September 07, 2002, on various areas of the landslide (Figure 5). A common midpoint
12

survey (CMP) was completed on October 25, 2002, using a 50 MHz antenna along
transect E (Figure 5). Two transects were repeated on February 15, 2003, to compare
seasonal variations of radar signals. The transects for this portion of the study were
transects A and E as completed on September 07, 2002.
Eldon Transect Results
CMP Survey
A hyperbolic reflection was seen at approximately 90 ns at 3.24 m of separation
extending to 140 ns at 14.31 m of separation (Figure 11). Calculation of subsurface
velocity using CMP surveys was completed as described. The CMP results indicate the
average velocity of subsurface material to be 0.129 m/ns. This would equate to a depth
scale of 12.9 m per 100 ns (Table 2). This average velocity was used for all subsurface
units and specific velocities for each unit were not determined.
Transect A
A 120 meter transect was completed approximately 85 meters upslope from the
toe of the landslide mass. Transect A was the longest and crossed the east flank of the
slide (Figure 5). Surface material consisted of a mixture of coarse sand and gravel. The
radargram display for this transect indicates a prominent reflector at approximately 6 to 8
meters below ground surface (bgs) (Figure 12). Where transect A crosses the south flank
of the landslide this prominent reflection loses strength.
TransectB
A 30 meter transect was completed approximately 85 to 115 meters upslope from
the toe of the landslide mass (Figure 5). Surface material consisted of a mixture of forest
13

duff and coarse sand and gravel. The radargram display for this transect indicates a
prominent reflector at approximately 6 to 8 meters bgs (Figure 13).
Transect C
A 45 meter transect was completed approximately 85 to 130 meters upslope from
the toe of the landslide mass (Figure 5). Surface material consisted of a mixture of forest
duff. The radargram display for this transect indicates a prominent reflector at
approximately 6 to 8 meters bgs (Figure 14).
TransectD
A 25 meter transect was completed approximately 125 meters upslope from the
toe of the landslide mass (Figure 5). Surface material consisted of a mixture of forest
duff The radargram display for this transect indicates a prominent reflector at
approximately 6 to 8 meters bgs (Figure 15).
TransectE
A 70 meter transect was completed approximately 140 meters upslope from the
toe of the landslide mass (Figure 5). Surface material consisted of a mixture of forest
duff. The radargram display for this transect indicates a prominent reflector at
approximately 6 to 8 meters bgs. Where transect E crosses the west flank this prominent
reflection loses strength (Figure 16).
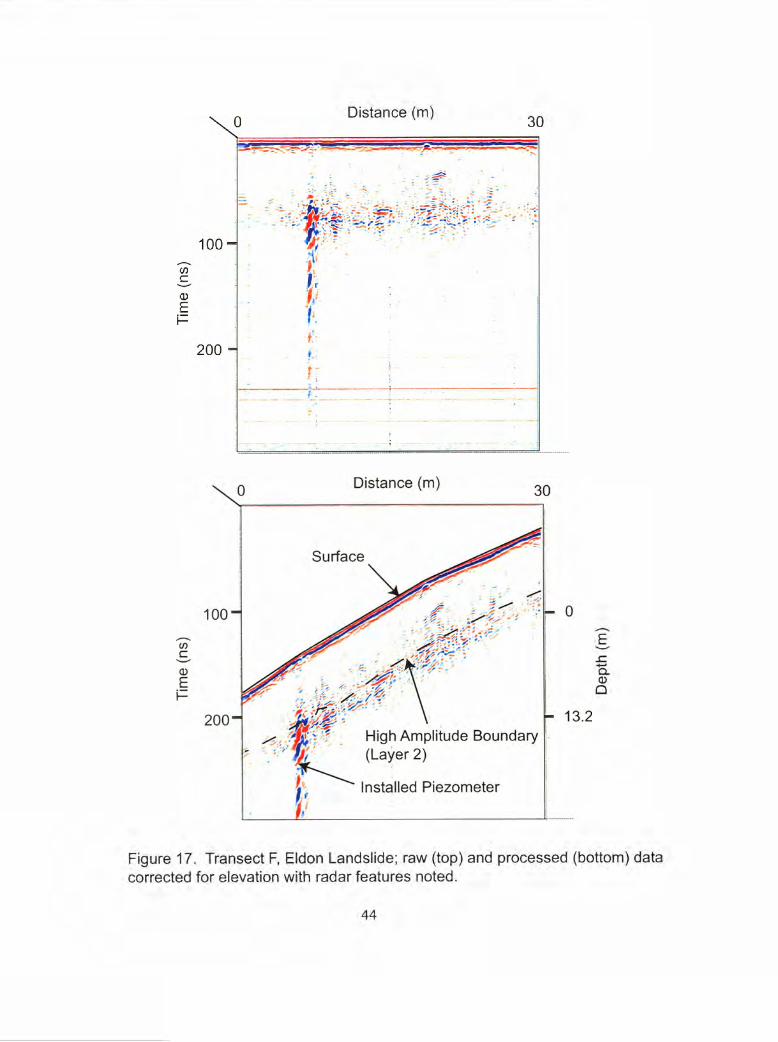
TransectF
A 30 meter transect was completed approximately 140 to 170 meters upslope
from the toe of the landslide mass (Figure 5). Surface material consisted of a mixture of
forest duff and coarse sand and gravel. The radargram display for this transect indicates a
14

reflector at approximately 6 to 8 meters bgs. A reflector can also be seen at the location
where a previously installed piezometer is located (Figure 17).
Transect G
A 30 meter transect was completed approximately 250 meters upslope from the
toe of the landslide mass (Figure 5). Surface material consisted of a mixture of forest
duff and coarse sand and gravel. The radargram display for this transect indicates a
reflector at approximately 6 to 8 meters bgs. A reflector can also been seen at the
location where a previously installed piezometer is located (Figure 18).
TransectH
A 15 meter was completed approximately 230 to 250 meters upslope from the toe
of the landslide mass (Figure 5). Surface material consisted of a mixture of forest duff
and coarse sand and gravel. The radargram display for this transect indicates a prominent
reflector at approximately 6 to 8 meters bgs (Figure 19).
Transect N Winter Survey
A 120 meter transect was completed approximately 85 meters upslope from the
toe of the landslide mass on February 15, 2002 to compare seasonal variations of the
radar signal. Transect N was a seasonal repeat of transect A. Surface material consisted
of a mixture of coarse sand and gravel. The radargram display for this transect indicates a
prominent reflector at approximately 6 to 8 meters below ground surface (bgs) similar to
the previous radargram. An overall brightening of the signal is visible as compared to
transect A. Where transect N crosses the south flank the prominent reflection loses
15

strength (Figure 20). A visual comparison of summer and winter surveys indicates an
overall brightening of the winter survey (Figure 21).
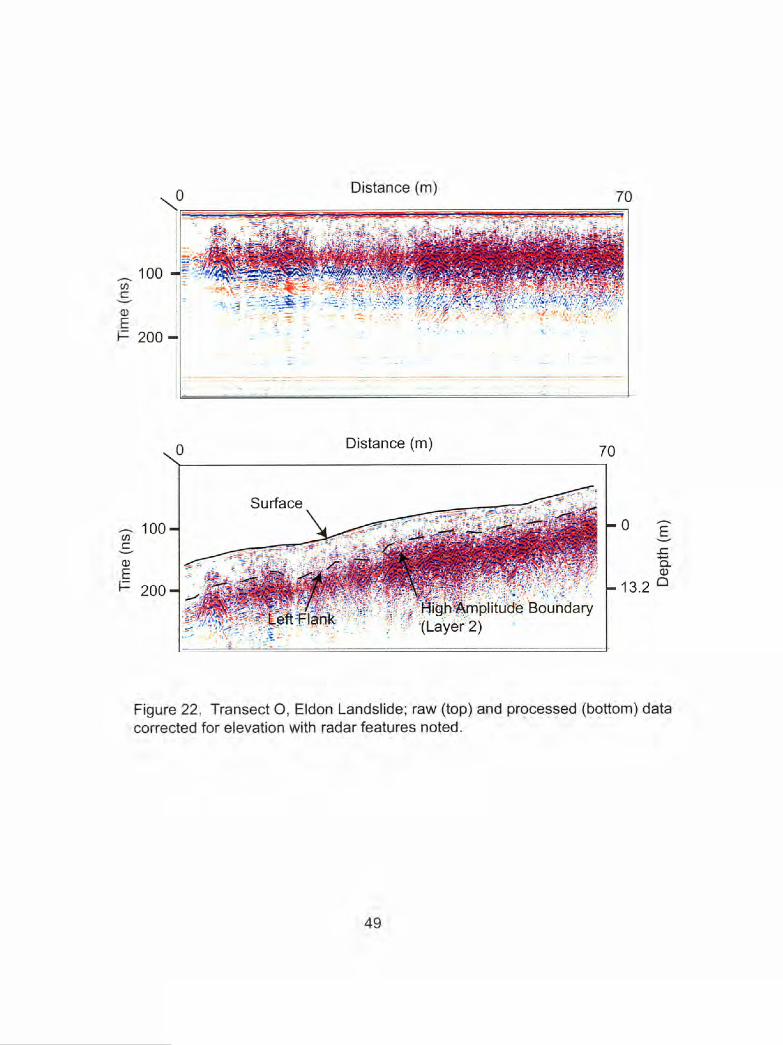
Transect O Winter Survey
A 70 meter transect was completed approximately 140 meters upslope from the
toe of the landslide mass on February 15, 2002 to compare seasonal variations of the
radar signal. Transect O was a seasonal repeat of transect E. An overall brightening of
the signal is visible as compared with transect E. Where transect O crosses the north
flank this prominent reflection is still visible as compared with the September 07, 2002
survey (Figure 22). A visual comparison of the seasonal transects displays a high
amplitude variation (Figure 23).
Eldon Transect Discussion
CMP survey results indicate a subsurface velocity of 0.129 m/ns. This value falls
well within the range expected for dry sands and gravels (Table 1). Transects A through
H all displayed a reflector at approximately 6 to 8 meters bgs. This reflector weakens
where Transect A crosses the east flank and Transect E crosses the west flank of the
disturbed landslide mass. Previous investigations by WSDOT (2000) have determined
the slip surface to be located at approximately 6 to 15 meters bgs in glaciolacustrine silts
and clays as previously described (Figure 6). These WSDOT findings of slip surface
location were based on the shearing of installed wells during WSDOT monitoring.
Based on available information the prominent radargram reflectors are attributable
to three possible subsurface conditions: 1) contact between outwash sand and gravels and
the underlying glaciolacustrine silts and clays; 2) perched groundwater on glaciolacustrine
16

silts and clays; 3) disturbed soils, with resulting changes in their material properties, at
landslide slip surface. Disturbed soils offer the most probable explanation for the cause
of these prominent reflectors due to the loss of reflection strength near the respective east
and west flanks of the landslide mass.
Winter transects display an overall “brightening” of the reflectors as compared
with the late summer transects. This overall “brightening” can be attributed to an overall
increase in the dielectric constant of the reflector and the seasonal change in water content
within the vadose zone in this area of the landslide.
TAHUYA LANDSLIDE
Five GPR transects (I through M) using a 200 MHz antenna were completed on
September 11, 2002, on various areas of the landslide (Figure 8). A common midpoint
survey (CMP) was completed on October 26, 2002 using a 50 MHz antenna along
transect I.
Tahuya Transect Results
CMP Survey
A hyperbolic reflection was seen at approximately 79 ns at 0.595 m of separation
extending to 100 ns at 7.3 m of separation (Figure 24). Calculation of subsurface velocity
using CMP surveys was completed as described. The CMP results indicate the average
velocity of subsurface material to be 0.114 m/ns (Table 2). This average velocity was
used for all subsurface units and specific velocities for each unit were not determined.
17

Transect I
A transect 55 meters in length was completed approximately 20 meters upslope from the
toe of the landslide mass (Figure 8). Transect I was the longest and started near the right
flank of the landslide mass. Surface material consisted of a mixture of coarse sand and
gravel. The radargram display for this transect indicates various linear reflectors in the
subsurface with a prominent positive amplitude reflection at approximately 7 meters bgs
(Figure 25).
TransectJ
A transect 15 meters in length was completed approximately 20 to 30 meters
upslope from the toe of the landslide mass (Figure 8). Surface material consisted of a
mixture of coarse sand and gravel. The radargram display for this transect indicates
various linear reflectors in the subsurface with a prominent positive amplitude reflection
at approximately 7 meters bgs (Figure 26).
Transect K
A transect 45 meters in length was completed approximately 30 meters upslope
from the toe of the landslide mass (Figure 8). Surface material consisted of a mixture of
coarse sand and gravel. The radargram display for this transect indicates a prominent
positive amplitude reflection at approximately 7 meters bgs (Figure 27).
TransectL
A transect 20 meters in length was completed approximately 15 to 35 meters
upslope from the toe of the landslide mass (Figure 8). Surface material consisted of a
18
mixture of coarse sand and gravel. The radargram display for this transect indicates a
prominent positive amplitude reflection at approximately 7 meters bgs (Figure 28).
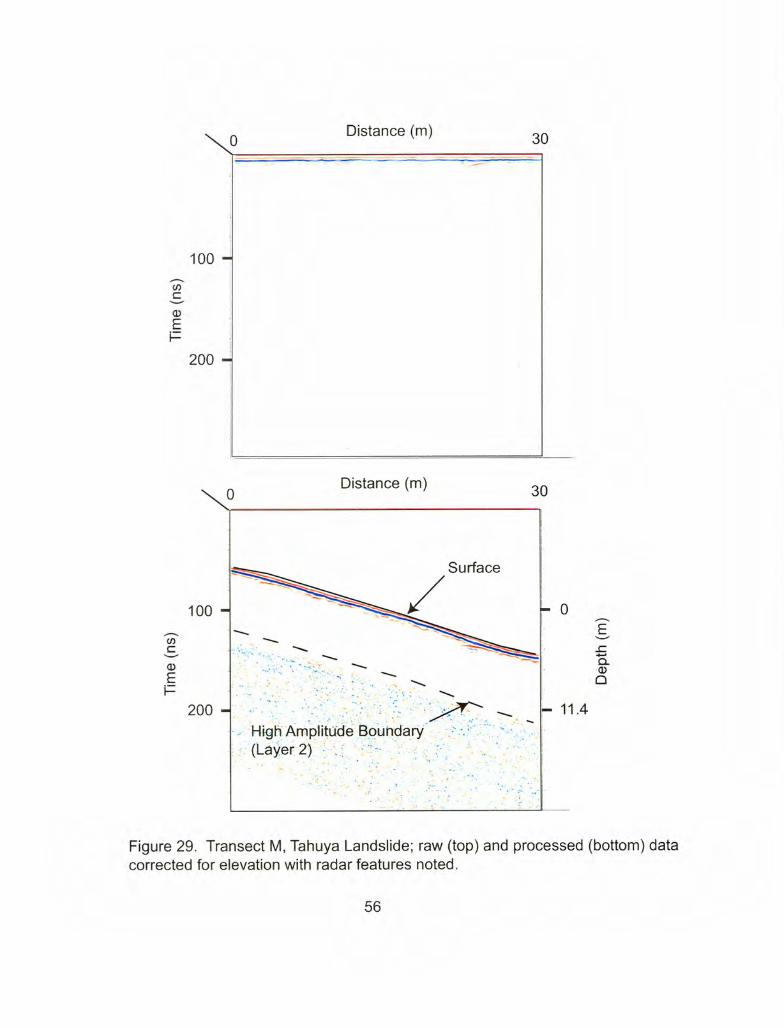
TransectM
A transect 30 meters in length was completed approximately 15 meters upslope
from the toe of the landslide mass (Figure 8). Surface material consisted of a mixture of
coarse sand and gravel. The radargram display for this transect indicates a prominent
positive amplitude reflection at approximately 7 meters bgs (Figure 29).
Tahuya Transect Discussion
CMP survey results indicate a subsurface velocity of 0.114 m/ns. This value falls
well within the range expected for materials predominantly consisting of silt (Table 1).
The higher silt content effectively lowers the subsurface velocity as compared with
sandy/gravel horizons.
Transects I through M all displayed a lack of internal reflectors until
approximately 7 meters depth, where the radar signal was lost. The reflectors are not as
prominent as the reflectors seen within the Eldon Landslide and are considered to highly
attenuated and the radar signal is essentially lost due to highly conductive soils (Ekes and
Hickin, 2001). Previous investigations by GeoEngineers (1998) have located a complex
landslide mass with the primary slip surface (depth to reworked soils as described by
GeoEngineers) located at approximately 7 meters bgs. These findings were based on
borings completed on the site in April of 1998 by GeoEngineers (Figure 23).
19

DISCUSSION AND CONCLUSIONS
Transects A through H completed on the Eldon landslide all displayed a radar
reflector at approximately 6 to 8 meters bgs. This reflector weakens where Transect A
crosses the east flank and Transect E crosses the west flank of the disturbed landslide
mass. Previous investigations by WSDOT (2000) have determined the slip surface to be
located at approximately 6 to 15 meters bgs in glaciolacustrine silts and clays as
previously described. Sands and gravels have been shown to have a lower dielectic
constant and electrical conductivity resulting in a lower attenuation. This lower
attenutation has a smaller effect on the radar signal as compared with silts and clays (Jol,
1989). Based on available information, prominent radargram reflectors located
approximately 10 meters bgs can be attributed to three possible subsurface conditions: 1)
contact between outwash sand and gravels and the underlying glaciolacustrine silts and
clays; 2) perched groundwater on glaciolacustrine silts and clays; 3) disturbed soils at
landslide slip surface. The weakened reflection at the flanks of the landslide mass in
transects A and E suggests that these reflections are disturbed soils located at the
landslide slip surface.
Transects N and O indicate that GPR can detect transient changes in material
properties such as water content. Winter surveys display an overall increase in reflection
amplitude of the reflected signal as compared to the late summer survey. Variations in
the electrical properties of soils are usually associated with changes in volumetric water
content which, in turn, give rise to radar reflections as previously noted (Davis and
Annan, 1989). This change that is seen in the winter surveys indicates future work could
20

be done to correlate an increase in water content (as discussed further in Knight, 2001 and
references therein), slip surface variation and landslide movement over time.
From the Tahuya slide, transects I through M all displayed a radar reflector at
approximately 6 to 8 meters bgs. Previous investigations determined the slip surface to
be located in the area of this study to be at approximately 7 meters bgs in loose sand,
gravel, with occasional silty soil blocks. This description of source material containing
“very hard silt” indicates a high probable silt fraction resulting in higher electrical
conductivities resulting in a greater attenuation. This reflector that is seen at
approximately 6 to 8 meters appears to be more of a weakened signal due to the suspected
high conductivity of the soils.
The comparison between the Tahuya and Eldon radargram data presents the
greatest insight into the limitations and strengths into the use of GPR on landslide slip
surface delineation. What is imaged is largely determined by the variation of dielectric
properties in the subsurface and the thickness of the resolvable layer. The range and
resolution of GPR decreases with the presence of conductive materials like clays, silts or
soils with conductive pore water (Davis and Annan, 1979).
The minimum detectable layer thickness (slip surface) and the accuracy with
which the depth to a reflecting interface can be determined is dependent on the antennae
wavelength and the properties of the sediment being measured (Jol 1995). Resolvable
thickness, as a function of radar wave velocity and wavelength, for velocities between
0.10 m/ns and 0.15 m/ns using an antennae frequency of 200 mHz are 0.15 meters and
0.20 meters, respectively (Jol, 1995). This is best described as the thickness of a layer
21

decreases the power reflected decreases. The roughness of the interface between the two
materials also affects the reflected signal power (Arman and Davis, 1977). Previous
investigations did not determine the thickness of each of the landslide slip surfaces. This
study determined that reflectors produced at the approximate location of the previously
located Eldon landslide slip surface are a minimum thickness of 0.15 meters.
Based on this information GPR will not be effective on discrete, smooth landslide
slip surfaces at depth, where there is attenuation due to highly conductive soils. For
complex slip surfaces where the slip surface thickness is greater than 0.25 meters, less
than 10 meters below ground surface, where low loss conditions exist, GPR with a 200
Mhz anteimae can effectively be utilized to locate landslide slip surface as shown in this
study.
CMP surveys only evaluated the velocity of the first overlying engineering
geologic unit. Limitations exist with conversions of travel time and depth in complex
stratigraphy and future studies should expand on underlying units and their velocities for
appropriate scaling. Techniques (as described in Conyers and Goodman (1997)) such as
stratigraphic correlations, transillumination methods and laboratory analyses of core
samples should be further conducted to expand the knowledge of the electromagnetic
properties of various subsurface materials. Further studies on landslide masses consisting
of sand and gravel should be further conducted near the flanks and headscarp to attempt
to view radargrams of subsurface features that propagate to the surface and provide
additional information regarding GPR and its uses and limitations. Studies should also be
conducted seasonally on landslide masses with installed piezometers to determine the
22

extent GPR can detect transient changes in water content and determine groundwater
elevations within landslide masses.
Further studies in landslide slip surface characterization using GPR can provide
cost effective techniques for slip surface determination in the geotechnical industry.
December of 2003 geotechnical consultants charge from $15,000 to $50,000 to determine
slip surface locations using proven methods (tiltmeters, inclinometers, extensometers
and/or piezometers). Based on the geotechnical industries current hourly rates, a GPR
survey can be conducted and evaluated for well under $5,000 (excluding initial
equipment investment which currently costs approximately $30,000). Future studies
combining techniques involving drilling, inclinometer installation and GPR surveys could
provide a combination of cost effective technologies to characterize landslide slip
surfaces. This combination of technologies could provide a large amount of data to be
evaluated and correlated for proper landslide mitigation.
23

REFERENCES
Babcock, R.S., Suczek, C.A., and Engebretson, D.C., 1994, The Crescent “Terrane”, Olympic Peninsula and Southern Vancouver Island: Bulletin - State of Washington, Department of Natural Resources, Report: 80, p 141-157.s
Bamhardt, W. A. and Kayen, R.E., 2000, Radar Structure of Earthquake-Induced, Coastal Landslides in Anchorage, Alaska: Environmental Geosciences, vol. 7, no.l, p. 38-45.
Bruno, F. and Marillier, F., 2000, Test of High Resolution Seismic Reflection and Other Geophysical Techniques on the Boup Landslide in the Swiss Alps: Surveys inGeophysics, vol. 21, no. 4 p. 333-348.
Conyers, L. and Goodman, D., 1997, Ground Penetrating Radar: An Introduction for Archeologists: Altamitra Press, Walnut Creek, CA, 223 p.
Davis, J.L. and Aiman, A.P., 1989, Ground Penetrating Radar for High Resolution Mapping of Soil and Rock Stratigraphy: Geophysical Prospecting, v. 37, p. 531-551.
Ekes, C. and Hickin, E.J., 2001, Ground Penetrating Radar Facies of the Paraglacial Cheekye Fan, Soutwestern British Columbia, Canada: Sedimentary Geology, v. 143, no.3-4, p. 199-217.
GeoEngineers, 1998, Geotechnical Engineering Services, North Shore Landslide Evaluation, Tahuya, Washington. 15 p.
Grasmuck, M., and Green, A., 1996, 3-D Georadar Mapping: Looking Into theSubsurface: Environmental and Engineering Geoscience, v. II, no. 2, p. 195-200.
Holtz, R.D. and Schuster, R.L., 1996, Stabilization of Soil Slopes. Landslides: Investigation and Mitigation: Transportation Research Board, Special Report 247, p. 439-473.
Hruska, J., and Hubatka, F., 2000, Landslides Investigation and Monitoring by a High Performance Ground Penetrating Radar System: Proceedings of the Eighth International Conference on Ground Penetrating Radar, SPIE, v. 4084, p. 688- 693.
Annan, A.P. and Davis, J.L., 1977. Radar Range Analysis for Geological Materials.Report of Activities, Geological Survey of Canada, Paper 77-IB, p. 117-124.
Jol, H..M., 1995, Ground Penetrating Radar Antennae Frequencies and TransmitterPowers Compared for Penetration, Depth, Resolution and Reflection Continuity:Geophysical Prospecting, v. 43, p. 693-709.
24
Jol, H.M. and Junck, M.B., 2000, High Resolution Ground Penetrating Radar Imaging (225-900Mhz) of Geomorphic and Geologic Settings: Examples From Utah, Washington and Wisconsin: Proceedings of the Eighth International Conference on Ground Penetrating Radar SPIE, v. 4084, p. 69-79.
Knight, R., 2001, Ground Penetrating Radar for Environmental Applications: Annual Review Earth Planet Science, v. 29, p. 229-255.
Mikkelsen, P.E., 1996, Field Instrumentation. Landslides: Investigation and Mitigation: Transportation Research Board, Special Report 247, p. 278-316.
Olhoeft, G.R., 1981, Physical Properties of Rocks and Minerals: McGraw Hill, New York. p. 257-330.
Sellman, P.V., Arcone S.S., and Delaney A.J., 1983, Radar Profiling of Buried Reflectors and the Groundwater Table: Cold Regions Research and Engineering Laboratory Report 83-11, p. 1-10.
Schuster, R.L., 1996, Socioeconomic Significance of Landslides. Landslides: Investigation and Mitigation: Transportation Research Board, Special Report 247, p. 12- 31
Topp, G.C., Davis, J.L. and Arman, A.P., 1980, Electromagnetic Determination of Soil Water Content: Measurements in Coaxial Transmission Lines: Water ResourcesResearch, no. 16, v.3., p. 574-582.
Ulrickson, C.P.F., 1982, Application of Impulse Radar to Civil Engineering [PH.D. thesis]: University of Technology, Lund, Sweden, 173 p.
Walden, A.T., and Hosken, W.J., 1985, An Investigation of the Spectral Properties of Primary Reflection Coefficients: Geophysical Prospecting, v. 33, p.400-435.
Washington State Department of Transportation, 2000, Eldon Landslide, Geotechnical Study of the Eldon Vicinity Landslide Adjacent to Hood Canal, Final Geotechnical Report, 9 p.
25

TABLE 1TYPICAL DIELECTRIC CONSTANT, ELECTRICAL CONDUCTIVITY AND
VELOCITY OBSERVED IN COMMON GEOLOGICAL MATERIALS^
Material K CT (mS/m) V (m/ns)
Air 1 0 0.3
Distalled Water 80 0.01 0.033
Fresh Water 80 0.5 0.033
Sea Water 80 30000 0.01
Dry Sand 3-5 0.01 0.15
Saturated Sand 20-30 0.1 - 1.0 0.06
Limestone 4-8 0.5-2 0.12
Shales 5-15 1 - 100 0.09
Silts 5-30 1 - 100 0.07
Clays 5-40 2-1000 0.06
Granite 4-6 0.01 - 1 0.13
Dry Salt 5-6 0.01 -1 0.13
Ice 3-4 0.01 0.16
Notes:^Adapted from Davis and Annan 1989
K - Dielectric Constant0 - Electrical ConductivityV - VelocityV = d{K)"^ where c is 3 x 10° m/s (Knight, 2001)
26

TABLE 2COMMON MIDPOINT SURVEY^
TAHUYA LANDSL DE
T (ns) D (m) T(ns)' D(m)^79 0.595 6241 0.354025
79 1.98 - 6241 3.9204
87.4 4.74 7638.76 22.4676
100 7.13 ' lOOOO 50.8369
- - " ' — --/
SLOPE^= 0.013 VEL0CITY3= 0.114 m/ns
ELDON LANDSLIDE
T (ns) D (m) T(ns)^ D{mf-
90 3.24 ‘ 8100 10.4976
96 6.21 r 9216 38.5641
109 8.91 11881 79.3881
121 11.61 14641 134.7921
140 14.31 / . 19600 204.7761
SLOPE^= 0.0168 VELOCITY3= 0.129 m/ns
Notes:T- time D - distance
^ As described in Davis and Annan 1977
Figure 11.Figure 24.(timef from hyperbola
® (distance)^ from hyperbola 'distance/time® Gradient of the slope is equal to Velocity^'^
27

28

(A)
(B)
Figure 2. (A) Typical radargram displayed as a linscan (B) Oscilloscope trace of single radar scan as highlighted in radargram.
29

from Sure! at scale of 1:24k.
All locations are approximate
Lambert Conformal Conic Washington State Plane South North American Datum 1983
i SCALE IN KILOMETER
16 l^—--^1
■i:>ACiricj , !
NOT TO SCALE
LOCATION OF ELDON AND TAHUYA LANDSLIDES IN WASHINGTON STATE
FIGURE 3
30

31


.J

TAHUYA LANDSLIDEI
AtSi^rsPoints
Data Source: Topography from SurelMaps at scale of 1 ;24k.
All locations are approximate.
iN0
Lambert Conformal Conic Washington State Plane South North American Datum 1983
SCALE IN KILOMETER
LOCATION OF TAHUYA LANDSLIDE
FIGURE 7
34

TRANSECT 1 (55m)

Li.O<<o9
§2
aLiiQC(O
-J30
o>
u.K
=>O
x
CDO_io111CD
oCN
ON-OCD
OLDO
o00oCsl
(■1'S’IAI ‘S
y313lAl) N
OI1V
A3
13
Q< cc_i tjj< H I- LU Z 2o
^N ^ LU§<
^CJ^
f—
0 ai01 m Q
-> Q
.<
COCO
-2roEXoi_Q.
CL
COErocw ooCO
®
2 o53 PCD
g
<D °
—
W
o .£ (/)
?0 UJ oCD
CD
8 o ^ 8^ §01 o
•*-» *+—
O
CD
z cx:

M Increasing offset ■<--------- 1--------- ► Increasing offset(iii) (ii) 0) (i) (ii) (iii)
(A) CMP sounding with (B) a time—distance (T-X) graph with normal movement and (C) the corresponding graph (Reynolds, 1997).
SIMPLIFIED CMP SOUNDING WITH TIME-DISTANCE GRAPH
FIGURE 10
37

0 0 Distance (m) 40
Figure 11. CMP survey results for Eldon Landslide along Transect E. (see Table 2 for distance versus time for reflector).
38

Dis
tanc
e (m
)
(Lu) Midaa CN
(SU) 8LUI1 (SU) 8LUI1
c_o03>0303
■o0O0i_i_oo03
•*—* 03
Eo
■4—*O
■O0ww0oo
x>c0'2.o
0
0;g"wX3c0_ico
LU
o0wc0
CM
0i—003
39
rada
r fea
ture
s not
ed.

Tim
e (ns
)0 Distance (m) 30
Figure 13. Transect B, Eldon Landslide; raw (top) and processed (bottom) datacorrected for elevation with radar features noted.
40
Dep
th (m
)

Tim
e (ns
) Ti
me (
ns)
Distance (m)45
Figure 14. Transect C, Eldon Landslide; raw (top) and processed (bottom) data corrected for elevation with radar features noted.
41
Dep
th (m
)

Distance (m) 25
Distance (m)25
100 -J.
(/)c(UE
200 -
Surface- 0
High^ti^littrd^e BGimdary
(Layer 2J
Q.0)Q
- 13.2
Figure 15. Transect D, Eldon Landslide; raw (top) and processed (bottom) datacorrected for elevation with radar features noted.
42

Tim
e (ns
) Ti
me (
ns)
Distance (m)70
Figure 16. Transect E, Eldon Landslide; raw (top) and processed (bottom) data corrected for elevation with radar features noted.
43
Dep
th (m
)
Distance (m)30
Figure 17. Transect F, Eldon Landslide; raw (top) and processed (bottom) datacorrected for elevation with radar features noted.
44
Dep
th (m
)

Tim
e (ns
) Ti
ime (
ns)
Distance (m)30
100-1
200
Figure 18. Transect G, Eldon Landslide: raw (top) and processed (bottom) datacorrected for elevation with radar features noted.
45
Dep
th (m
)

Distance (m)15
Figure 19. Transect H, Eldon Landslide; raw (top) and processed (bottom) datacorrected for elevation with radar features noted.
46

Dis
tanc
e (m
)
(LU) md0QC\J
^ 00
cg
'■4—*
03>030)
£
■o
o0
oo03
-4—'03
"Oe'
oo
■D0ww0oo
■Ocro'2o$ro0;g"wT3c0_lco
LU
O0wc0
0CN01 Z3C3)
(su) eiuii (su) 8LUI1
47
rada
r fea
ture
s not
ed.

Dis
tanc
e (m
) 12
0
(lu) ^}d^Q (Lu) MtdeaCM CM
OCO O
CO
cgCO ^> Q.0 o
.0 ^
O isf) CD
'— "O< 2o oCD(/) CJ) c c CD -F
"O O) CD ^
O ^ 2 CO
CD -*-* c/3 O C C2 0 I- 03
CM S
2 t13 CD03 T3IF ro
(su) eoiji (su) eoiji
48
Tim
e (ns
) Ti
me (
ns)
Distance (m)70
Figure 22. Transect O, Eldon Landslide; raw (top) and processed (bottom) data corrected for elevation with radar features noted.
49
Dep
th (m
)

Tim
e (ns
) Ti
me (
ns)
Distance (m) 700
Figure 23. Transect O (top) and transect E (bottom) data corrected for elevation. Overall brightening of winter survey (top).
50
Dep
th (m
) D
epth
(m)

Tim
e (ns
)0 0 Distance (m) 40
Figure 24. CMP survey results for Tahuya Landslide along Transect I (see Table 2 for distance versus time for reflector).
51

Tim
e (ns
) Ti
me (
ns)
Distance (m) 55
200-
nO
100-
Figure 25. Transect I, Tahuya Landslide; raw (top) and processed (bottom) data corrected for elevation with radar features noted.
52
Dep
th (m
)

Tim
e (ns
) Ti
me (
ns)
Distance (m)45
100 -
200 -
Figure 27. Transect K, Tahuya Landslide; raw (top) and processed (bottom) data corrected for elevation with radar features noted.
54
Dep
th (m
)

0Distance (m)
20
100
w
(DE
200 -
Q.<DQ
Figure 28. Transect L, Tahuya Landslide; raw (top) and processed (bottom) datacorrected for elevation with radar features noted.
55
Tim
e (ns
) (n
s)
Distance (m) 30
100
200
Figure 29. Transect M, Tahuya Landslide; raw (top) and processed (bottom) datacorrected for elevation with radar features noted.
56
Dep
th (m
)