deliverable c2.1: questionnaires for the general public
TRANSCRIPT

FINAL REPORT
Coordinated by:
12/2016
DELIVERABLE C2.1:
Questionnaires for the general public and
stakeholders (updated)


Deliverable C2.1: Questionnaires for the general public and stakeholders
AIRUSE LIFE 11 ENV/ES/584 1 / 26
Questionnaire for the public
1 Summary of questionnaire for the public .................................................................. 3
2 Information on survey respondents ........................................................................... 4
3 Commuting mode ...................................................................................................... 5
4 Information on air quality data .................................................................................. 6
5 Air quality perception................................................................................................ 7
6 Statements on air quality .................................................................... 10
7 Awareness of measures ........................................................................................... 12
8 Active involvement ................................................................................................. 13
Questionnaire for stakeholders
1 Information on stakeholders .................................................................................... 14
2 Air quality in South European countries ................................................................. 14
3 Compliance with the European legislation.............................................................. 15
4 Results achieved from air quality plans .................................................................. 15
5 Air quality concerns in South Europe ..................................................................... 16
6 Emission sources that need new or stringent standards .......................................... 16
7 Reasons why air quality problems persist ............................................................... 17
8 Priorities to be set by the European Commission ................................................... 17
ANNEX I: Air quality questionnaire for the general public .......................................... 18
ANNEX II: Questionnaire for stakeholders ................................................................... 24

Deliverable C2.1: Questionnaires for the general public and stakeholders
AIRUSE LIFE 11 ENV/ES/584 2 / 26

Deliverable C2.1: Questionnaires for the general public and stakeholders
AIRUSE LIFE 11 ENV/ES/584 3 / 26
Questionnaire for the public
1 Summary of questionnaire for the public
In the framework of the AIRSUE LIFE+ project “Testing and Development of Air
quality mitigation measures for Southern Europe” a public questionnaire was issued in
order to evaluate public perception on the Air Quality issue in Southern European cities,
causes and measures for improvement. The questionnaire was publicized through the
webpage www.airuse.eu and from the project participants to their social networks.
Therefore the participation to the survey was voluntary and results cannot be
extrapolated to the whole community. Totally 280 responses were collected: 73 in
SPAIN, 154 in GREECE, 13 in PORTUGAL and 40 in ITALY. Therefore results only
refer to this sample, and must not be intended as representative of the general
population.
Concerning commuting mode, walking is more frequently used in Barcelona when
compared to other cities, while private car is often used in Porto and Florence. There is
a lack of awareness among survey participants about information of air quality available
on the media. Most of survey responders do not know whether air quality information is
available in media other than internet. Participants characterize air quality in the
AIRUSE cities as Moderate (38-77%) or Bad (8-40%). In Barcelona, Athens, Porto and
Florence road traffic is perceived by participants clearly as the most important pollution
source followed by industry and waste incineration. In Milan the most important source
according to survey participants is residential heating, followed by road traffic and
industry. Agriculture is considered by participants to be a negligible emission source in
all AIRUSE cities. General agreement was found among survey responders on the
importance of improving public transport, move towards clean transportation, use
cycling and increase pedestrian zones for the improvement of air quality in cities. Wood
stoves are recognized by survey responders as a bad practice for domestic heating at all
cities. It should be also welcome the consensus among survey participants on the need
of prohibiting high polluting vehicles from circulating in the city centres, as Low
Emission Zones establish. Survey responders agree on the need of more pressure on
industrial emissions. Surprisingly 56 % of survey responders are not aware if the EURO
regulation on vehicles is applied in their city and 34% do not even the existence of such
regulation. Eleven % of survey responders still do not know that the electric/hybrid
vehicles can improve air quality. Most of survey responders (63%) do not know what
“Low Emission Zones” are. Street cleaning is known by participants as a measure to
reduce resuspension although not always seen as an effective one. European regulation
on power plants and industries are much less known by survey participants, and 70% of
them do not know whether these are applied in their city. At all cities, survey responders
declared their will to improve air quality in their city.

Deliverable C2.1: Questionnaires for the general public and stakeholders
AIRUSE LIFE 11 ENV/ES/584 4 / 26
2 Information on survey respondents
The age of survey responders was mostly within 19 and 65, being 53% of them between
26 and 40 year old. 58% of total responders were female. Level of education was high,
being 66% at least a university degree. Concerning profession, the most common ones
were education (14%), student (14%), Research & Development (11%), engineering
(11%) and administrative (10%). 74% of survey respondents were urban residents,
while 26% were living in suburban areas.
Table 1. Age of survey respondents
AGE %
< 18 3.6
19<25 13.2
26<40 53.2
41<65 28.9
65< 1.1
Total 100.0
Figure 1. Education and Profession of survey participants.
05
10152025303540
Pri
mar
y sc
ho
ol
Hig
h s
cho
ol
Tech
nic
al s
cho
ol
Bac
he
lor'
s d
egr
ee
Mas
ter'
s d
egre
e
Do
cto
ral d
egr
ee
Oth
er
%
Education
0
2
4
6
8
10
12
14
16
Ad
min
istr
ativ
eEd
uca
tio
nEn
gin
eeri
ng
Fin
ance
Lega
lLo
gist
ics
Man
age
me
nt
Mar
keti
ng
R&
DSa
les
Stu
den
tTe
chn
ical
Un
em
plo
yed
Oth
erM
issi
ng
%
Profession

Deliverable C2.1: Questionnaires for the general public and stakeholders
AIRUSE LIFE 11 ENV/ES/584 5 / 26
3 Commuting mode
Survey participants were asked about their frequency of use of several commuting
modes. The most common single commuting modes among all survey respondents were
private car, walking and subway, although public transport was the most frequent
answer as sum of tram, bus, train and subway.
Nevertheless results are quite different among AIRUSE cities. In Barcelona walking is
more frequently used instead of private cars, when compared to other cities, while
private car is more used than the whole public transport modes in Porto and Florence.
All cities Always Frequently Random Never Florence Always Frequently Random Never
Bus 9 27 43 21 Bus 6 19 56 19
Train 6 19 48 26 Train 6 28 41 25
Subway 18 34 33 15 Subway 0 3 0 97
Tram 1 6 36 57 Tram 0 6 38 56
Motorcycle 7 9 16 69 Motorcycle 16 19 31 34
Car 26 36 28 10 Car 28 47 22 3
Bicycle 3 14 28 55 Bicycle 3 19 50 28
Walking 23 54 21 2 Walking 13 47 38 3
Ferry 0 6 41 53 Ferry 0 0 6 94
Athens Always Frequently Random Never Milan Always Frequently Random Never
Bus 10 27 36 27 Bus 0 38 25 38
Train 7 16 47 30 Train 0 13 88 0
Subway 20 37 39 4 Subway 25 25 38 13
Tram 0 5 29 67 Tram 13 38 38 13
Motorcycle 5 10 15 71 Motorcycle 0 13 0 88
Car 31 39 23 7 Car 38 38 13 13
Bicycle 2 8 24 66 Bicycle 0 38 38 25
Walking 22 52 25 1 Walking 13 75 13 0
Ferry 0 11 68 21 Ferry 0 0 0 100
Barcelona Always Frequently Random Never Porto Always Frequently Random Never
Bus 8 29 53 10 Bus 8 31 46 15
Train 5 19 51 25 Train 8 38 38 15
Subway 23 42 30 4 Subway 8 38 46 8
Tram 1 3 56 40 Tram 0 15 15 69
Motorcycle 10 3 15 73 Motorcycle 0 8 0 92
Car 7 27 44 22 Car 54 31 15 0
Bicycle 4 23 27 45 Bicycle 0 15 23 62
Walking 33 56 8 3 Walking 15 77 8 0
Ferry 0 0 11 89 Ferry 0 8 0 92
Figure 2. Commuting modes of survey participants. Rows sum 100% of answers.
Numbers are rounded to integers.

Deliverable C2.1: Questionnaires for the general public and stakeholders
AIRUSE LIFE 11 ENV/ES/584 6 / 26
4 Information on air quality data
The survey participants were asked: Is information on air quality, specifically the
concentration of atmospheric particles, in your city routinely made available to the
public? How?
Considering all responses, there is a lack of awareness among survey responders about
information media used for air quality monitoring. Most of survey responders do not
know whether air quality information is available in media other than internet. This
result suggests the need for social awareness rising campaigns.
Table 2. Awareness of survey responders on routine air quality information. Numbers
are rounded to integers.
Yes No I am not aware
Broadcast media (i.e. TV) 38 25 38
Press (i.e. newspapers) 75 0 25
Information screens 25 0 75
Internet pages 88 0 13
APPs 0 13 88
Teletext 13 13 75
Telephone SMS free 0 25 75
Telephone SMS paying 0 25 75
Separating the responses by city, the following conclusions can be drawn:
- In Barcelona and Milan, the same general picture is true, but there is information
conflict on TV, newspapers and information screens. Most of survey
respondents (47-49%) in Barcelona state that in these 3 media, air quality
information does not exist (which is true) but others (less) survey respondents
believe the opposite. In Milan only 75% of survey responders know about
newspapers bulletin. Interestingly only 15% of participants in Barcelona know
about the Mobile APP on air quality, indicating again lack of knowledge on this
matter.
- In Porto, 46% of survey responders think that newspapers routinely do offer air
quality data, which is not the case.
- In Florence, there is conflict about information screens, since 37% of survey
responders think they do not exist while 28% think they do exist.

Deliverable C2.1: Questionnaires for the general public and stakeholders
AIRUSE LIFE 11 ENV/ES/584 7 / 26
5 Air quality perception
In general survey responders perceive air quality status in AIRUSE cities as Moderate
(38-77%) or Bad (8-40%). The “cleanest” perception is among survey respondents in
Porto, while the worst among survey respondents in Barcelona and Milan, the latter one
actually the most polluted city within AIRUSE. Very few among survey responders (0-
3%) declared not to be aware of the air quality status of their own city as a whole,
however many participants (13-25%, except Porto) did not declare aware about their
personal exposure to air pollutants. The rest of responders feel mostly very affected (8-
49%) by air pollution, except in Porto (62% feels affected a little).
Table 3. Percentage (rounded to integer) of survey responders on air quality status
perception.
% All cities Athens Barcelona Florence Milan Porto
Very bad 15 15 22 0 25 8
Bad 37 39 40 31 38 8
Moderate 42 41 34 53 38 77
Good 4 3 3 13 0 8
Very good 1 1 0 0 0 0
I am not aware 1 1 1 3 0 0
Table 4. Percentage (rounded to integer) of survey respondents on the way air pollution
affect their personal exposure. Columns sum 100% of answers.
% All cities Athens Barcelona Florence Milan Porto
Very affected 44 49 38 44 38 8
Affected a little 37 37 34 38 25 62
Not affected 4 1 6 0 13 31
I am not aware 16 13 22 19 25 0
When asked about the causes of bad air quality, assembling all cities, a real consensus
among survey responders was found only for road traffic, industry and waste
incineration as main source and agriculture as a negligible source. For other sources,
survey responses are spread over too different degrees of responsibility.
Analysing the city-specific results we can observe that:
In Athens the same pattern is observed for road traffic, industry and waste
incineration, although another higher concern is found for stubble burning.
Survey responders seem aware of the relative importance of natural sources such

Deliverable C2.1: Questionnaires for the general public and stakeholders
AIRUSE LIFE 11 ENV/ES/584 8 / 26
as African dust, sea salt or volcanoes and dust from construction. They agree on
considering less important airport and cooking emissions. Other sources such as
heating, harbour and power plants do not find consensus.
In Barcelona, road traffic is clearly the most important source according to
perception of survey responders, followed by industry and harbour. Heating and
Industry are considered by survey respondents as of secondary importance,
while negligible responsibility is attributed to agriculture, transboundary
pollution and stubble burning.
In Porto, similarly to Barcelona, road traffic and industry are the main concern
of the survey respondents, followed by heating and stubble burning. No concern
is placed on agriculture, cooking, transboundary pollution and power plants by
survey respondents.
In Florence road traffic is again the source of most concern among survey
respondents and with higher consensus. Heating, industry and airport are the
second most important sources according to survey responders, in spite of the
absence of Industrial and airport emissions in the AIRUSE source apportionment
study. No importance is attributed by survey respondents to agriculture, and
natural sources. No consensus among survey respondents is reached on waste
incineration.
In Milan the most important source for survey respondents is domestic and
residential heating, followed by road traffic and industry. Interestingly
agriculture is not considered of concern being probably the survey respondents
not aware of the actual high NH3 emissions from Po Valley, originating from
agriculture. Some higher importance is given by survey respondents to airport
emissions, with respect to other cities.
Table 5. Percentage (rounded to integer) of survey responses on causes of air pollution.
-
Responsibility according to survey
respondents +
Agriculture 54 26 13 5 2 0
Airport 11 23 25 15 15 10
Construction works 5 21 29 23 12 10
Cooking 18 33 24 18 6 2
Domestic heating 2 11 20 25 22 20
Harbour 17 17 14 19 20 14
Industry 8 11 12 20 19 29
Natural sources 13 21 27 17 13 8
Pollution from other countries 18 29 24 13 12 4
Power plants 7 19 18 18 19 19
Road traffic 0 1 3 8 14 74
Stubble burning 11 23 15 18 15 17
Waste incineration 5 14 20 17 17 26
AL
L C
ITIE
S

Deliverable C2.1: Questionnaires for the general public and stakeholders
AIRUSE LIFE 11 ENV/ES/584 9 / 26
-
Responsibility according to survey
responders
+
Agriculture 60 24 10 3 3 0
Airport 16 30 25 12 9 8
Construction works 4 18 31 22 12 12
Cooking 23 35 19 16 7 1
Heating 1 9 19 22 25 24
Harbour 12 18 16 21 21 12
Industry 14 16 12 17 12 29
Natural sources 5 14 27 23 19 12
Pollution from other countries 13 21 27 16 16 6
Power plants 6 18 13 18 21 24
Road traffic 0 1 3 6 14 75
Stubble burning 7 10 14 19 21 29
Waste incineration 3 10 17 15 19 37
- Responsibility according to survey
responders +
Agriculture 49 27 16 5 0 1
Airport 7 14 25 18 22 15
Construction works 8 16 32 25 14 5
Cooking 12 29 33 21 1 4
Heating 5 19 26 33 12 4
Harbour 3 14 12 21 27 23
Industry 0 5 10 27 25 33
Natural sources 19 30 32 12 1 5
Pollution from other countries 22 40 22 10 5 1
Power plants 1 15 26 21 19 18
Road traffic 0 0 1 7 11 81
Stubble burning 15 41 18 16 8 1
Waste incineration 8 19 26 21 16 10
-
Responsibility according to survey respondents +
Agriculture 47 28 19 6 0 0
Airport 0 16 28 19 28 9
Construction works 0 34 22 25 9 9
Cooking 6 38 31 22 3 0
Domestic Heating 0 3 22 19 34 22
Harbour 59 13 6 16 3 3
Industry 3 6 16 22 31 22
Natural sources 31 28 22 9 9 0
Pollution from other countries 25 38 19 9 9 0
Power plants 19 28 16 22 9 6
Road traffic 0 0 9 13 19 59
Stubble burning 19 44 19 13 3 3
Waste incineration 9 16 22 9 19 25
AT
HE
NS
B
AR
CE
LO
NA
F
LO
RE
NC
E

Deliverable C2.1: Questionnaires for the general public and stakeholders
AIRUSE LIFE 11 ENV/ES/584 10 / 26
-
Responsibility according to survey
responders
+
Agriculture 38 50 0 0 13 0
Airport 0 13 25 38 13 13
Construction works 0 13 38 25 25 0
Cooking 0 25 50 0 13 13
Heating 0 0 0 13 25 63
Harbour 100 0 0 0 0 0
Industry 0 0 13 25 50 13
Natural sources 25 50 25 0 0 0
Pollution from other countries 25 63 13 0 0 0
Power plants 0 25 50 13 13 0
Road traffic 0 0 0 25 25 50
Stubble burning 13 38 25 13 13 0
Waste incineration 0 25 13 50 0 13
-
Responsibility according to survey responders
+
Agriculture 38 31 15 15 0 0
Airport 0 23 23 23 23 8
Construction works 15 46 8 15 0 15
Cooking 31 23 8 23 15 0
Heating 0 15 8 46 8 23
Harbour 0 38 23 8 23 8
Industry 0 8 23 15 23 31
Natural sources 23 23 23 8 15 8
Pollution from other countries 31 23 15 8 15 8
Power plants 15 38 23 8 15 0
Road traffic 0 0 0 15 8 77
Stubble burning 15 23 8 38 15 0
Waste incineration 8 31 31 15 8 8
6 Statements on air quality
Survey participants were asked to agree/disagree on several clear statements on air
quality, causes and measures. Air pollution is clearly an issue for most of survey
responders and responsibility belongs to every single citizen. General agreement was
found among survey responders on the importance of improving public transport, force
clean transportation, increase cycling users and pedestrian zones for the improvement of
air quality in cities. Wood stove are recognized by most of survey respondents as a bad
practice for domestic heating at all cities, indicating that the public recognizes biomass
burning emissions as challenging in urban areas. It should be also welcome the
consensus among survey responders on the need of prohibiting high polluting vehicles
from circulating in the city centers, as Low Emission Zones establish. Survey
participants agree on the need of more pressure on industrial emissions, even if prices
MIL
AN
P
OR
TO

Deliverable C2.1: Questionnaires for the general public and stakeholders
AIRUSE LIFE 11 ENV/ES/584 11 / 26
may increase, and in controlling agricultural practices such as the open air burning of
stubble, which should be banned. Less agreement is observed among survey responders
on the effectiveness of some existing measures such as road cleaning activities, or
measures in harbors which seem not to satisfy the participants’ opinion. Waste
incineration seems accepted by survey responders in Athens and Florence, while most
of survey respondents is undecided in Milan, Barcelona and Porto.
“The increase of the use of public transport vs the private one should be the main tool to
improve urban air quality”
“Clean transportation should be promoted” “Bicycles and pedestrian transport should be used as a tool to improve air quality” “Polluting vehicles should be banned from the city centers” “Road cleaning may help to improve air quality”
“Clean fuels for domestic heating should be used” “Factories should switch to cleaner processes even if prices have to go up”
“Waste incinerators should be banned”
“Agricultural practices are natural and therefore do not have negative impact on air quality”
“Wood stoves do not have a negative impact on air quality since wood is a natural fuel”
“Open air burning is the best option to eliminate stubble generated”
“Industries are aware of their emissions and make efforts to reduce them”
“Ports and airports have applied corrective measures to improve air quality in nearby areas”
“Improving the environment is the responsibility of every citizen”
“I am actively involved in cleaning up the environment”
“The pollution is out of my control and I cannot do anything to change it”
“I am not interested in air pollution issues”
Athens Barcelona Florence Milan Porto
Athens Barcelona Florence Milan Porto
Athens Barcelona Florence Milan Porto
Athens Barcelona Florence Milan Porto
Athens Barcelona Florence Milan Porto
Athens Barcelona Florence Milan Porto
Athens Barcelona Florence Milan Porto
Athens Barcelona Florence Milan Porto
Athens Barcelona Florence Milan Porto
Athens Barcelona Florence Milan Porto
Athens Barcelona Florence Milan Porto
Athens Barcelona Florence Milan Porto
Athens Barcelona Florence Milan Porto
Athens Barcelona Florence Milan Porto
Athens Barcelona Florence Milan Porto
Athens Barcelona Florence Milan Porto
Athens Barcelona Florence Milan Porto

Deliverable C2.1: Questionnaires for the general public and stakeholders
AIRUSE LIFE 11 ENV/ES/584 12 / 26
7 Awareness of measures
Survey participants’ awareness of existing measures at EU, national and local level has
been checked. Fifty-six % of survey respondents are not aware if the EURO regulation
on vehicles is applied in their city and 34% do not even the existence of such regulation.
Five % of survey responders even believe that the EURO regulation does not apply.
Eleven % of survey responders still do not know that the electric/hybrid vehicles can
improve air quality. Most of survey responders (63%) do not know what Low Emission
Zones are. Street cleaning is known as measure, although as, already shown, not in all
cities survey responders believe it is efficient. European regulation on power plants and
industries are much less known by survey participants, and 70% of them do not know
whether these are applied in their city.
Table 6. Percentage of survey responders on awareness of measures to improve air
quality. Numbers are rounded to integers.
% Yes No I am not
aware
European regulation for vehicles
emissions 39 5 56
Electric, hybrid cars 54 12 34
Low emission zones 22 16 63
Street cleaning/washing 56 10 34
European regulation of emissions
from electricity production 19 8 74
European regulation of industrial
emissions 24 6 71
Separating survey responses by city, we can observe interesting results such as:
In Barcelona:
o 74% of survey responders do not know the EURO regulation on vehicles
o 70% of survey responders do not know what LEZs are, and 14% think
LEZ is applied in Barcelona (while is not)
In Athens:
o 80% of survey responders declare to know EURO regulation on vehicles,
but 49% does not know whether it applies to the city of Athens.
o 60% of survey responders do not know what LEZs are, and 26% think
LEZ is applied in Athens (while is not)
o 8-14% of survey responders believe that the European regulations
(power plants, industry and vehicles) do not apply to Athens
Deliverable C2.1: Questionnaires for the general public and stakeholders
AIRUSE LIFE 11 ENV/ES/584 13 / 26
In Porto:
o 92% of survey responders declare to know EURO regulation on vehicles,
but 77% does not know whether it applies to the city of Porto.
o 46% of survey responders do know what LEZs are, but only 8% know
that it is not applied in Porto
In Florence:
o 81% of survey responders declare to know EURO regulation on vehicles,
but 50% does not know whether it applies to the city of Florence.
o 28% of survey responders do know what LEZs are, but only 22% know
that it is applied in Florence
In Milan:
o 37% of survey responders do not know EURO regulation on vehicles
o 50% of survey responders know what LEZs are, but only 37% know that
it is applied in Milan
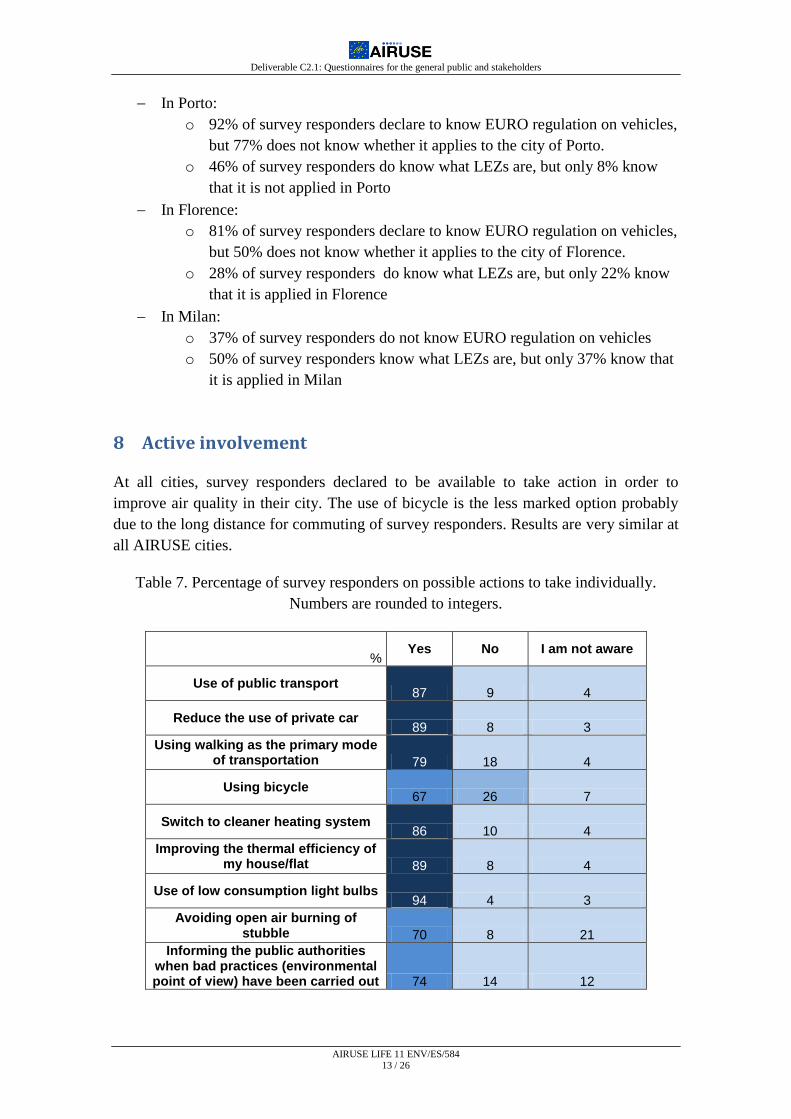
8 Active involvement
At all cities, survey responders declared to be available to take action in order to
improve air quality in their city. The use of bicycle is the less marked option probably
due to the long distance for commuting of survey responders. Results are very similar at
all AIRUSE cities.
Table 7. Percentage of survey responders on possible actions to take individually.
Numbers are rounded to integers.
% Yes No I am not aware
Use of public transport 87 9 4
Reduce the use of private car 89 8 3
Using walking as the primary mode of transportation 79 18 4
Using bicycle 67 26 7
Switch to cleaner heating system 86 10 4
Improving the thermal efficiency of my house/flat 89 8 4
Use of low consumption light bulbs 94 4 3
Avoiding open air burning of stubble 70 8 21
Informing the public authorities when bad practices (environmental point of view) have been carried out 74 14 12

Deliverable C2.1: Questionnaires for the general public and stakeholders
AIRUSE LIFE 11 ENV/ES/584 14 / 26
Questionnaire for stakeholders
1 Information on stakeholders
AIRUSE coordinator prepared a questionnaire destined to stakeholders directly
involved in air quality policy implementation. The objective was to survey the views of
stakeholders in South Europe on the successes and failures of the present European air
quality measures. The questionnaire consists of two major questions. The first question
refers to the air quality situation in the perspective area. The second question is
designed to learn about stakeholder opinions on the adequacy of EC measures with
respect to air quality protection. The stakeholders are asked to report on the causes of
EU limit values exceedances, improvements already achieved by air quality plans,
relevant air quality issues, emission sources that probably are not regulated, and
priorities to be set by EU and local authorities in the near future.
Selected stakeholders from Spain, Portugal, Italy and Greece were invited to participate
in the survey by e-mail. The team received 25 responses in total: 13 in SPAIN, 7 in
GREECE, 1 in PORTUGAL and 4 in ITALY.
2 Air quality in South European countries
The majority of the stakeholders consider air quality in rural and semi-urban areas
rather good or moderate. However, they state that the situation is different in urban
areas. All stakeholders agree that deterioration of air quality in urban areas is due to
road traffic followed by heavy oil combustion and biomass burning.
Another reason for the high concentrations episodes of PM in Southern Europe can be
found in the occurrence of African dust intrusions. These episodes can be very intense
in the Canary Islands, Spain and in South Greece as the corresponding stakeholders
mention.
Furthermore, in recent years, wood burning in small stoves for home heating has
constituted a major source of PM pollution in urban areas, in particular in Greece and
Italy (Po Valley). This is partly caused by high-energy prices, which induced low-
income households in particular to opt for cheaper alternatives.

Deliverable C2.1: Questionnaires for the general public and stakeholders
AIRUSE LIFE 11 ENV/ES/584 15 / 26
3 Compliance with the European legislation
All stakeholders stated that exceedances of the PM and NO2 limit values established by
the EC do occur while when taking into account the World Health Organization’s
(WHO) stricter guidelines, a high percentage of the urban population in Southern
Europe is exposed to excessive PM10 concentrations.
The stakeholders recognize that pollutant emissions were actually reduced in the last
decade, however this reduction have not always resulted in lower exposure to PM. The
share of the European urban population exposed to concentration levels of PM10 above
the values set by EU legislation remains high and showed only a minor decline in the
last decade.
4 Results achieved from air quality plans
Most of the stakeholders state that European measures and previous air quality plans
have provided positive results. All stakeholders clearly identify the positive effect of the
Large Combustion Plants and the IPPC & IED Directives, and sulphur content in fuels
(whether used on ships and road traffic), producing a significant reduction of SO2
emissions. These reductions were noticeable both in urban and industrial areas. Also the
effect of the EURO 4 and 5 standards on decreasing emissions of PM and CO from
vehicles is noticeable.
In cities where regional and local action plans were implemented to improve air quality,
beneficial effects were evidenced not only for gaseous pollutants but also for PM. An
example is the Barcelona’s municipal and metropolitan authorities that have set up a
body—the Committee for the Reduction of Air Pollution—tasked with drawing up and
implementing measures to reduce air pollution within the area. The Committee
constitutes a diverse and cross-cutting working group representing all the stakeholders,
including municipal authorities, business and financial interests, social actors, ecologists
and scientists as well as the transport and health sectors. An essential component of the
strategy aimed at improving air quality in Barcelona is to reduce traffic density. Key
measures that the Committee has undertaken include: the reduction of the public
transportation emissions, promotion of bicycle use, the promotion of electric vehicles,
regulation of private vehicle use (parking zones), use of porous pavement, street
washing to reduce resuspension.
Similarly stakeholders from Italy state that in Florence after the implementation of the
local air quality plan slight reductions on PM10 concentrations and NO2 emissions
were reported. The air quality plan of Florence is focused on the improvement of the
public transportation and the optimzation of the city´s traffic lines.
On the other hand, stakeholders in Greece report poor results of the local air quality
plans in the greek cities and especially in Athens. The improvement of air quality in the

Deliverable C2.1: Questionnaires for the general public and stakeholders
AIRUSE LIFE 11 ENV/ES/584 16 / 26
last decade is mostly attributed to the improvement of the car technology having as
consequence the reduction of vehicle emissions. Stakeholders also mention that the
EURO standards were more efficient than the local measures.
It is important to highlight that many stakeholders state that the economic crisis in
South European countries played a crucial role in the reduction of car emissions, and
subsequently to the improvement of air quality.
5 Air quality concerns in South Europe
All stakeholders believe that more can be done in a European level to tackle all air
quality problems. First of all, they believe that green and sustainable transport (use of
bike) should be promoted in all cities given the health effects caused from the vehicle
emissions. Many stakeholders stated that new pollutants like black carbon, BC should
be regulated due to its association with cardiovascular and respiratory diseases. Black
carbon is a good indicator/tracer of direct diesel emissions. Other pollutants like
volatile organic compounds VOCs, and particle number concentration also linked to
adverse health effects should be regulated.
Stakeholders are also concerned for the natural contributions to PM concentrations from
the frequent African dust intrusions in South Europe that cannot be controlled and
regulated.
Most of the stakeholders mention the increased risks from the use of residential biomass
burning in urban areas. They believe that these emissions should be regulated either by
controlling the market of biomass fuels and/or the stoves used.
In Italy there is also a concern on the boundary layer dynamics that can significantly
deteriorate air quality.
Stakeholders in Spain highlight the problem arising from resuspended particles that for
the moment are not studied separately but only as a whole.
6 Emission sources that need new or stringent standards
Concerning emission sources stakeholder´s opinion is that an in-depth study should be
undertaken to characterize emissions sources. In general, stakeholders highlight the
problems arising from the use of biomass burning for domestic heating. Aspects like the
economic crisis that caused changes in residential heating and the extensive use of
fireplaces and stoves, or the inefficient control (unregulated combustion processes)
should be carefully studied.
Stakeholders from Barcelona believe that shipping emissions should be regulated taking
into account the increase of tourism and cruisers.

Deliverable C2.1: Questionnaires for the general public and stakeholders
AIRUSE LIFE 11 ENV/ES/584 17 / 26
Some stakeholders suggest to give emphasis to the implementation of the current air
quality standards before establishing and regulating new emission sources.
Representatives from public platforms stated that diesel emissions should be better
regulated and EURO 6 standard should be revised
7 Reasons why air quality problems persist
The majority of stakeholders believe that air pollution problems mostly result from road
traffic and they could be solved if the transportation system becomes cleaner and more
energy efficient. They also consider wood burning as an emission source that
deteriorates air quality specifically in urban areas. Natural contributions from Africa are
also reported as one of the reason that air quality problems persist in areas affected
frequently by desert dust intrusions.
8 Priorities to be set by the European Commission
Regarding the priorities that the European Commission should set in the near future
there is a consensus between stakeholders. All stakeholders mention the necessity to
improve public transport by making it greener and more efficient. Biking is considered
as a measure to reduce air pollution in urban areas.
Other emission sources that need to be regulated include residential biomass burning
and shipping emissions are seen as of great relevance in areas close to ports.
Raising public awareness on air quality issues is crucial for most of the participated
stakeholders.

Deliverable C2.1: Questionnaires for the general public and stakeholders
AIRUSE LIFE 11 ENV/ES/584 18 / 26
ANNEX I: Air quality questionnaire for the general public

Deliverable C2.1: Questionnaires for the general public and stakeholders
AIRUSE LIFE 11 ENV/ES/584 19 / 26

Deliverable C2.1: Questionnaires for the general public and stakeholders
AIRUSE LIFE 11 ENV/ES/584 20 / 26

Deliverable C2.1: Questionnaires for the general public and stakeholders
AIRUSE LIFE 11 ENV/ES/584 21 / 26

Deliverable C2.1: Questionnaires for the general public and stakeholders
AIRUSE LIFE 11 ENV/ES/584 22 / 26

Deliverable C2.1: Questionnaires for the general public and stakeholders
AIRUSE LIFE 11 ENV/ES/584 23 / 26

Deliverable C2.1: Questionnaires for the general public and stakeholders
AIRUSE LIFE 11 ENV/ES/584 24 / 26
ANNEX II: Questionnaire for stakeholders

Deliverable C2.1: Questionnaires for the general public and stakeholders
AIRUSE LIFE 11 ENV/ES/584 25 / 26

Deliverable C2.1: Questionnaires for the general public and stakeholders
AIRUSE LIFE 11 ENV/ES/584 26 / 26

Final Report coordination team:
Project Manager: Xavier Querol
Scientific Manager: Angeliki Karanasiou
Administrative and Financial Management: Cristina de Vasconcelos
