deliverable d2.1 update suburban and regional rail market ... · renfe (15 regional divisions and...
TRANSCRIPT

Page 2 of 5
FOSTER RAIL
Future of Surface Transport Research Rail
Coordination and Support Action
Grant Agreement No 605734
Date of Annex I against which the assessment will be made: 23-05-2013
Deliverable D2.1
Update Suburban and Regional Rail Market Analysis
WP WP2 Rail Business Scenarios
Task Task 2.2 Update of the suburban and regional (passenger) rail market analysis
Dissemination level1 PU Due delivery date M6
Nature2 R Actual delivery date MXX
Deliverable lead beneficiary
UITP Deliverable responsible person
Yves AMSLER
Email [email protected]
Other contributors to the deliverable
UITP: Mihai Barcanescu, Laurent Dauby; Patrick Skoniezki; Akos Ersek; Brigitte Ollier
Suburban and Regional Railway Undertakings & Competent Authorities
Document Version Date Author(s)
V1 01/11/ 2013 Yves Amsler
V2 11/02/2015 UITP
1 Dissemination level: PU = Public, PP = Restricted to other programme participants (including the JU),
RE = Restricted to a group specified by the consortium (including the JU), CO = Confidential, only for members of the consortium (including the JU) 2 Nature of the deliverable: R = Report, P = Prototype, D = Demonstrator, O = Other

FOSTER RAIL / D2.1 Update of the suburban and regional (passenger) rail market analysis
Page 2 of 18
Table of Content
1. Executive Summary ................................................................................................................................. 3
2. List of Acronyms ...................................................................................................................................... 4
3. Description of Deliverable ....................................................................................................................... 5
4. Results and Analysis ............................................................................................................................... 6
4.1 Major characteristics of the Suburban and Regional Railway Market in Europe .............................. 6
4.1.1 Company Profile and Relationship with Authorities ....................................................................... 6
4.1.2 Staff: ............................................................................................................................................... 7
4.1.3 Turnover: ........................................................................................................................................ 7
4.1.4 Ownership of the assets of the company: ..................................................................................... 7
4.1.5 Scope of company activities (Company operating services only on the regional network or not) 7
4.1.6 Supply Data ................................................................................................................................... 8
4.1.7 Demand Data ................................................................................................................................. 9
4.1.8 Network Data ............................................................................................................................... 10
4.1.9 Rolling Stock Data ....................................................................................................................... 12
4.2 Changes brought in the 2005 questionnaire and organisation of the new survey .......................... 13
4.2.1 Changes in the questionnaire ...................................................................................................... 13
4.2.2 Organisation of the survey ........................................................................................................... 16
5. General Evolutions of the Regional and Suburban Market Segments ............................................. 17
6. Conclusion .............................................................................................................................................. 18
FOSTER RAIL / D2.1 Update of the suburban and regional (passenger) rail market analysis
Page 3 of 18
1. Executive Summary
FOSTER RAIL (Future of Surface Transport Research Rail) is a FP7 CSA project, with a lifetime of 3 years. It started in on the 1
st of May 2013, and it is aimed at supporting the work of ERRAC (the European Rail
Research Advisory Council). FOSTER RAIL was designed to cover the activities outlined by SST.2013.6-1 Strengthening the research and innovation strategies of the transport industries in Europe, in this particular case the activities and research of the rail European Technology Platform.
WP2 is dealing with the project work concerning the identification and analysis of rail business scenarios, against which the new FOSTER RAIL/ERRAC Strategic Rail Research and Innovation Agenda (SRRIA) will be measured.
The previous Strategic Rail Research Agendas (SRRAs) produced by ERRAC were based on business scenarios targeting a time horizon for 2020. These scenarios have been produced in 2002 and 2007. They are partially outdated and they need to be revised within WP2 work package of the new Coordination and Support Action of ERRAC called FOSTER RAIL, by taking also into account the new target date to be considered on the basis on the additional information available: 2050.
As part of WP2, task 2.2 “Update of the suburban and regional (passenger) rail market analysis” is making an update of the work performed for the first time in 2005 by UITP on behalf of ERRAC, the European Rail Research Advisory Council
3. This task is based on a survey and its overall objective is to get an accurate
overview of the importance of regional railway in Europe.
The update is necessary as since 2005, a number of changes occurred with regard to the institutional, technical and economic background of the “suburban and regional railways” rail market segment. This is why it has been planned to reset a survey as part of FOSTER RAIL.
The deliverable starts with the executive summary, followed by a description of the deliverable.
A subsequent chapter comprises the results of the survey to date, as well as the analysis derived from the gathered data. This is divided into a number of sections:
Types of companies;
Employed staff;
Turnover;
Ownership;
Company activities;
Technical and operational data on the operators’ side Data concerning their market;
Data on the infrastructure used;
Data on the rolling stock used;
The additional changes to the questionnaire and their expected value;
The way in which the new survey had been organised.
The following chapter presents a short overview of the situation and the general RSR trends identified by UITP, not just with the first results of the survey, but throughout the last years. This clear and concise overview is meant as a supporting, broader framework of analysis for the RSR survey data.
In its last chapter the deliverable provides the first conclusions.
This deliverable presents the changes brought in the questionnaire and in the organisation of the survey which has been launched in October 2013. This deliverable only presents the basis upon which the the Regional and Suburban report is being built, since the insufficient data collected the first months of the project did not allow for the production of an intermediary report The final results will therefore be presented
3 Suburban and Regional Railways Landscape in Europe. ERRAC, November 2006
FOSTER RAIL / D2.1 Update of the suburban and regional (passenger) rail market analysis
Page 4 of 18
in Deliverable D2.4.
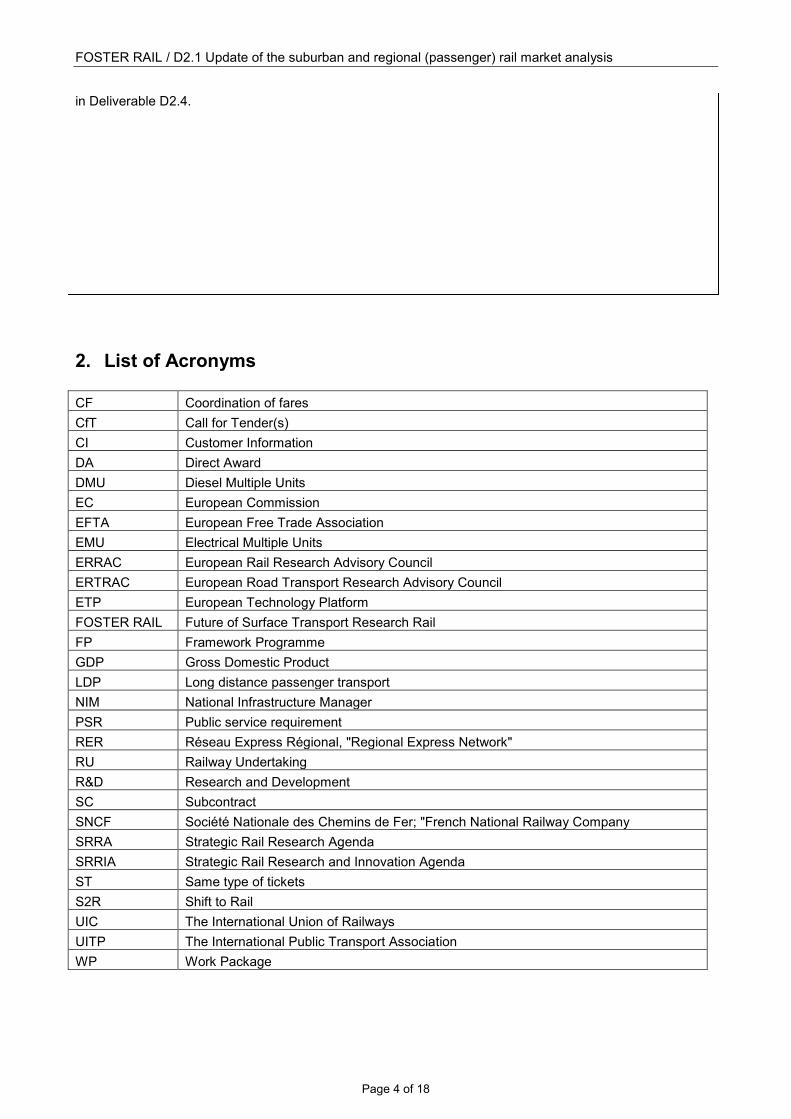
2. List of Acronyms
CF Coordination of fares
CfT Call for Tender(s)
CI Customer Information
DA Direct Award
DMU Diesel Multiple Units
EC European Commission
EFTA European Free Trade Association
EMU Electrical Multiple Units
ERRAC European Rail Research Advisory Council
ERTRAC European Road Transport Research Advisory Council
ETP European Technology Platform
FOSTER RAIL Future of Surface Transport Research Rail
FP Framework Programme
GDP Gross Domestic Product
LDP Long distance passenger transport
NIM National Infrastructure Manager
PSR Public service requirement
RER Réseau Express Régional, "Regional Express Network"
RU Railway Undertaking
R&D Research and Development
SC Subcontract
SNCF Société Nationale des Chemins de Fer; "French National Railway Company
SRRA Strategic Rail Research Agenda
SRRIA Strategic Rail Research and Innovation Agenda
ST Same type of tickets
S2R Shift to Rail
UIC The International Union of Railways
UITP The International Public Transport Association
WP Work Package

FOSTER RAIL / D2.1 Update of the suburban and regional (passenger) rail market analysis
Page 5 of 18
3. Description of Deliverable
Deliverable D2.1 is the first report produced by task 2.2 focusing on the “Update of the suburban and regional (passenger) rail market analysis” which had been performed by UITP in 2005-2006 on behalf of ERRAC and led to the ERRAC publication “Suburban and Regional Railways Landscape in Europe” published in November 2006
4.
This deliverable provides an overview of the survey launched in October 2013 to collect information on the main features of the “suburban and regional railway” market. This rail market segment is:
· one of the most promising in terms of potential development and alternative to private car (in line with EC White Paper perspective) for trips of the daily life between suburban areas and city centres (commuter and regional travel);
· one of the most fragile in terms of financial sustainability due to its high dependence on public funding: these services are operated under public service contracts following public service requirements, and they are often potentially or practically replaced by coach or bus services even if such services are less sustainable than rail services;
· one of the most fragmented which does not facilitate the data collection with a view towards technical harmonization of the characteristics of such rail systems.
The questionnaire used as a basis for the 2005 survey has been significantly revised in order to highlight the changes occurred in the meantime with regard to the institutional, technical and economic background of this rail market segment.
The deliverable recalls first the major characteristics of the suburban and regional railway market and then describes the changes in the questionnaire and organisation of the new survey in the clauses below.
4 as part of an FP6 research project called ERRAC SSA.
FOSTER RAIL / D2.1 Update of the suburban and regional (passenger) rail market analysis
Page 6 of 18
4. Results and Analysis
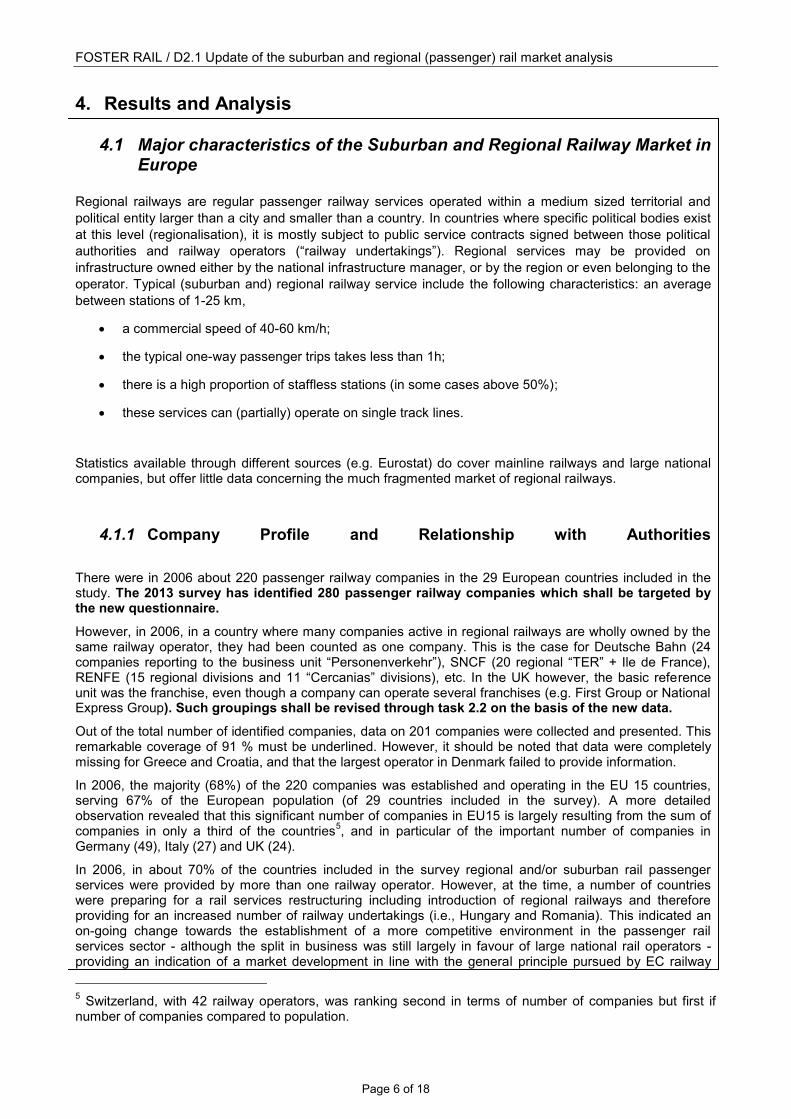
4.1 Major characteristics of the Suburban and Regional Railway Market in Europe
Regional railways are regular passenger railway services operated within a medium sized territorial and
political entity larger than a city and smaller than a country. In countries where specific political bodies exist
at this level (regionalisation), it is mostly subject to public service contracts signed between those political
authorities and railway operators (“railway undertakings”). Regional services may be provided on
infrastructure owned either by the national infrastructure manager, or by the region or even belonging to the
operator. Typical (suburban and) regional railway service include the following characteristics: an average
between stations of 1-25 km,
a commercial speed of 40-60 km/h;
the typical one-way passenger trips takes less than 1h;
there is a high proportion of staffless stations (in some cases above 50%);
these services can (partially) operate on single track lines.
Statistics available through different sources (e.g. Eurostat) do cover mainline railways and large national companies, but offer little data concerning the much fragmented market of regional railways.
4.1.1 Company Profile and Relationship with Authorities
There were in 2006 about 220 passenger railway companies in the 29 European countries included in the study. The 2013 survey has identified 280 passenger railway companies which shall be targeted by the new questionnaire.
However, in 2006, in a country where many companies active in regional railways are wholly owned by the same railway operator, they had been counted as one company. This is the case for Deutsche Bahn (24 companies reporting to the business unit “Personenverkehr”), SNCF (20 regional “TER” + Ile de France), RENFE (15 regional divisions and 11 “Cercanias” divisions), etc. In the UK however, the basic reference unit was the franchise, even though a company can operate several franchises (e.g. First Group or National Express Group). Such groupings shall be revised through task 2.2 on the basis of the new data.
Out of the total number of identified companies, data on 201 companies were collected and presented. This remarkable coverage of 91 % must be underlined. However, it should be noted that data were completely missing for Greece and Croatia, and that the largest operator in Denmark failed to provide information.
In 2006, the majority (68%) of the 220 companies was established and operating in the EU 15 countries, serving 67% of the European population (of 29 countries included in the survey). A more detailed observation revealed that this significant number of companies in EU15 is largely resulting from the sum of companies in only a third of the countries
5, and in particular of the important number of companies in
Germany (49), Italy (27) and UK (24).
In 2006, in about 70% of the countries included in the survey regional and/or suburban rail passenger services were provided by more than one railway operator. However, at the time, a number of countries were preparing for a rail services restructuring including introduction of regional railways and therefore providing for an increased number of railway undertakings (i.e., Hungary and Romania). This indicated an on-going change towards the establishment of a more competitive environment in the passenger rail services sector - although the split in business was still largely in favour of large national rail operators - providing an indication of a market development in line with the general principle pursued by EC railway
5 Switzerland, with 42 railway operators, was ranking second in terms of number of companies but first if
number of companies compared to population.
FOSTER RAIL / D2.1 Update of the suburban and regional (passenger) rail market analysis
Page 7 of 18
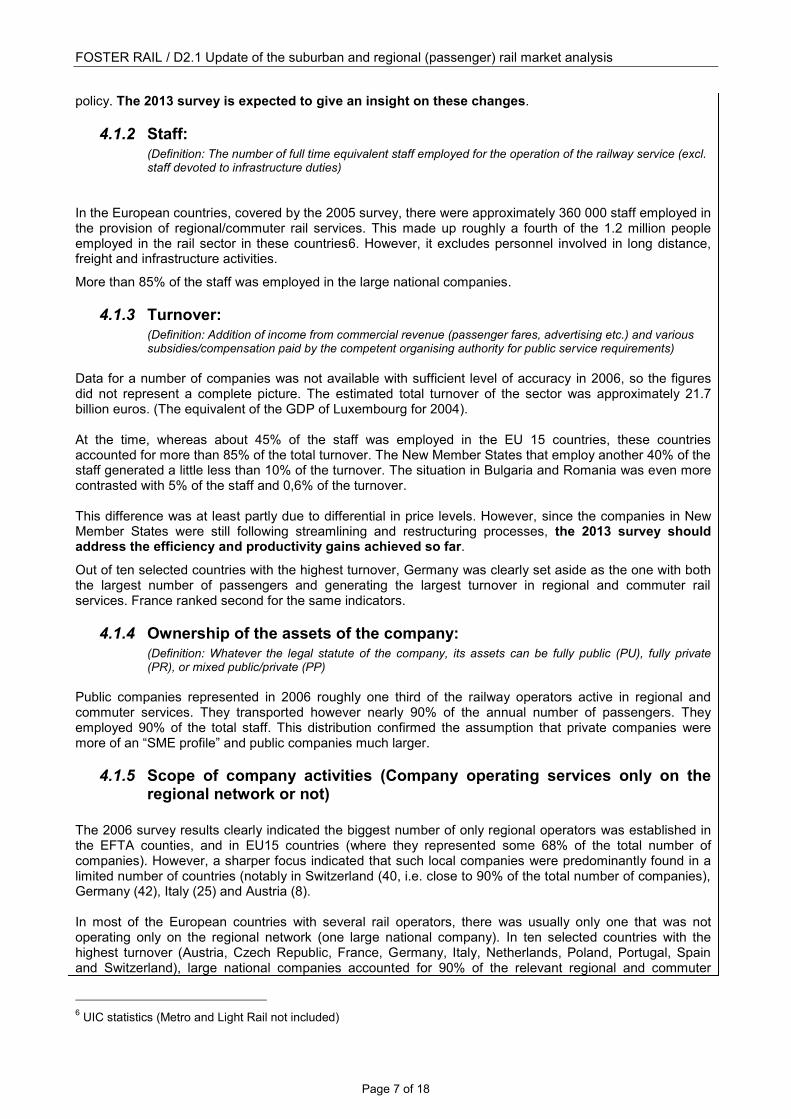
policy. The 2013 survey is expected to give an insight on these changes.
4.1.2 Staff: (Definition: The number of full time equivalent staff employed for the operation of the railway service (excl. staff devoted to infrastructure duties)
In the European countries, covered by the 2005 survey, there were approximately 360 000 staff employed in the provision of regional/commuter rail services. This made up roughly a fourth of the 1.2 million people employed in the rail sector in these countries6. However, it excludes personnel involved in long distance, freight and infrastructure activities.
More than 85% of the staff was employed in the large national companies.
4.1.3 Turnover: (Definition: Addition of income from commercial revenue (passenger fares, advertising etc.) and various subsidies/compensation paid by the competent organising authority for public service requirements)
Data for a number of companies was not available with sufficient level of accuracy in 2006, so the figures did not represent a complete picture. The estimated total turnover of the sector was approximately 21.7 billion euros. (The equivalent of the GDP of Luxembourg for 2004). At the time, whereas about 45% of the staff was employed in the EU 15 countries, these countries accounted for more than 85% of the total turnover. The New Member States that employ another 40% of the staff generated a little less than 10% of the turnover. The situation in Bulgaria and Romania was even more contrasted with 5% of the staff and 0,6% of the turnover. This difference was at least partly due to differential in price levels. However, since the companies in New Member States were still following streamlining and restructuring processes, the 2013 survey should address the efficiency and productivity gains achieved so far.
Out of ten selected countries with the highest turnover, Germany was clearly set aside as the one with both the largest number of passengers and generating the largest turnover in regional and commuter rail services. France ranked second for the same indicators.
4.1.4 Ownership of the assets of the company: (Definition: Whatever the legal statute of the company, its assets can be fully public (PU), fully private (PR), or mixed public/private (PP)
Public companies represented in 2006 roughly one third of the railway operators active in regional and commuter services. They transported however nearly 90% of the annual number of passengers. They employed 90% of the total staff. This distribution confirmed the assumption that private companies were more of an “SME profile” and public companies much larger.
4.1.5 Scope of company activities (Company operating services only on the regional network or not)
The 2006 survey results clearly indicated the biggest number of only regional operators was established in the EFTA counties, and in EU15 countries (where they represented some 68% of the total number of companies). However, a sharper focus indicated that such local companies were predominantly found in a limited number of countries (notably in Switzerland (40, i.e. close to 90% of the total number of companies), Germany (42), Italy (25) and Austria (8). In most of the European countries with several rail operators, there was usually only one that was not operating only on the regional network (one large national company). In ten selected countries with the highest turnover (Austria, Czech Republic, France, Germany, Italy, Netherlands, Poland, Portugal, Spain and Switzerland), large national companies accounted for 90% of the relevant regional and commuter
6 UIC statistics (Metro and Light Rail not included)

FOSTER RAIL / D2.1 Update of the suburban and regional (passenger) rail market analysis
Page 8 of 18
business in terms of turnover and about 70% in terms of transported passengers. They employed about 85% of the staff.
4.1.6 Supply Data
Annual vehicle kilometre (Definition: One vehicle corresponds either to one car, one wagon or trailer. Trains with inter-circulation are not considered as articulated elements and therefore each wagon should be considered as one vehicle)
In 2006, it proved to be impossible to draw a comprehensive picture of this parameter on European level, for lack of consistency of the data collected. Many companies had provided information on vehicle kilometre as it was specified in the survey. Just as many had provided the information expressed in train kilometre, another widely used indicator. It proved to be impossible to operate an accurate conversion from one indicator to the other without distorting the outcome to an unacceptable level of uncertainty.
Annual place kilometre (This question relates to seats or standing passengers)
Given the above mentioned difficulty, the 2006 survey concluded that perhaps a better indicator of the offer/supply would be expressed in seat*km. However, a too large proportion of responders had not provided this data. In addition, part of the provided information was expressed in seat kilometre and another part in place kilometre including standing passengers. It is expected that the 2013 survey shall clarify this issue.
Kind of passenger regional rail services provided: (Definition: The company may operate regional passenger services on commercial services and/or following public services requirements, as follows: - Services with public service requirements in relationship with one regional/local authority only (PSR1) - Services with public service requirements in relationship with more than one regional/local authority (PSR2) - Services operated on a full commercial basis (FCB)
Full commercial basis was found in 2006 only extremely rarely in the commuter and regional railway business (touristic lines were excluded from the survey). In the majority of cases, companies were operating their regional and commuter rail services with Public service requirements (and financial compensations) in relation to one authority. This was either the case of companies contracted by one regional or local authority for a given service supply (this was clearly predominant), or the case of large national companies contracted by one national authority for all their regional rail services (e.g. Belgium, Norway). Germany was in a complex situation: Länder had been responsible for organising and funding regional railway services since 1994. However, each Land was free to choose its own approach, and could “outsource” the daily tasks to ad-hoc sub-regional organisations (Regio, Verbund, Zwecksverbund etc.).
Other services provided by the company : (Definition: Other rail services include: freight service, bus and/or coach services and long-distance passenger services)
A considerable part (about 80% of the total number) of railway operators providing regional passenger rail services were also providing in 2006 other services, such as long distance passenger transport or freight transport. Out of these 80%, freight services come first, followed by bus and coach services and long distance passenger transport (LDP).
Regional passenger rail services operated in co-ordination with other public transport networks :
(Definition: The regional rail services may be operated with a certain level of co-ordination with other public transport services, i.e. long distance rail services or urban public transport services (metro, light rail, bus). The main types of co-ordinations are the co-ordination of fares (CF), the use of the same type of tickets (ST), the co-ordination of services in time and space (“rendez-
FOSTER RAIL / D2.1 Update of the suburban and regional (passenger) rail market analysis
Page 9 of 18
vous”), and the co-ordination or integration of information to customers (CI)
Out of the collected data in 2006, information on coordination of services was not available for about 35 companies. Other 140 companies however coordinated their regional rail services, with a variety of options of the type and level of coordination. The rail operators in Switzerland are all coordinating their activities on all levels specified in the survey – national, regional and urban. However, most of the other companies did not provide an answer to this question and therefore it was impossible to make a comparison on European level. It is expected that the 2013 survey shall collect better information on this topic. More data was collected concerning the type of coordination. The most frequent type of coordination was the coordination of information (96% of companies where data was available), followed by the coordination of fares (92%), the use of common tickets (91%) and the coordination of services in time and space (87%). Virtually all companies that coordinate their services did so in more than one aspect with the following exceptions: the UK, where there was only information coordination; Belgium, where only fares coordination existed; Ireland, where the only form of coordination was a common ticket. All four types of coordination had been put in place in the large majority of operators in Switzerland, in Austria and in Germany. Some companies in Sweden, Hungary, Italy and the Netherlands had also established a coordination of their services in all fields.
Public service contract: (Definition: Contract with public service requirements and subsidies paid to the operators to offset relevant operation deficit. This contract can be awarded directly (DA) by negotiation or following an open call for tenders (CfT). In some occurrence, an operator may deliver the service on behalf of another operator who has the contract (sub-contracting – SC)
The occurrences of absence of contracts or sub-contracting were very rare in 2006, which shall be confirmed in 2013. In EU-15 in 2006, contracts were roughly awarded for a half by tender and for half by direct award. Please note that a “contract unit” is irrespective of its business value. If specific data on contract value was available, the picture might look different. The 2013 survey should allow to analyse the evolution among the small companies of the part of “new entrants” (mainly powerful French and British groups) and “historic” undertakings, mainly based in Switzerland and Germany, but also in Austria, Italy and Spain.
Potential competition with liberalised cabotage services : (Definition: European legislation intends to liberalise international passenger rail services. This also includes the so-called cabotage traffic (i.e. passengers getting on and off the train on the same side of the border). Such services could be in competition with regional, subsidised services)
In 2006, less than 20% of companies stated that they would experience direct competition rising as a result of the liberalisation of international passenger rail services. It was mostly the case of large national companies that also operate services in border regions. However, only a small part of their business would be affected. There were very few cases of small companies that would face potential competition as a result of this development.
4.1.7 Demand Data
Annual number of passengers carried (Mio): The total number of passengers carried in 2006 was more than 6.8 billion. The passengers on regional or commuter trips represented by far the biggest part of all rail trips in Europe: they accounted for about
FOSTER RAIL / D2.1 Update of the suburban and regional (passenger) rail market analysis
Page 10 of 18
90% out of the total number of rail passengers (including long distance trips) and 50% of the total number of passenger kilometres per year
7 .
In 2006, in the acceding and candidate countries, whose population represented about 18% of the total population of the surveyed countries, the number of passengers did not exceed 174 million (or 3% of all passengers transported). However, if Turkey was not included in the group, then the figures were respectively 6% of the population and 2% of passengers carried per year. About 80% of the passengers using regional and commuter rail services were in EU15 states (whose population was about 67% of the total). This proportion was largely due to the significant number of passengers in Germany and France. A more detailed presentation of the yearly number of passengers transported ranked Germany first, with about 1.7 billion passengers, or roughly one quarter of the total, followed by France with 17%, the UK with 10% and Spain with 8%. Taking the population into account, the biggest “consumer” of rail services was by far Switzerland (with 49 trips per person yearly), followed by Luxembourg (27 trips) and Austria (25). France and Germany ranked equal with 21 trips per inhabitant per year. It is worth noting that the commuter and regional rail services around Paris (RER operated by SNCF and RATP) accounted for 1 billion trips yearly (respectively 570 million for SNCF and 430 million for RATP in 2004), i.e. 80 % of the total of France
8.
Annual passenger/km (Mio) The total number of annual passenger kilometres in Europe in 2006 was about 194 billion: 74% in EU 15 countries, 18% for new Member states, 5% for candidate countries and 4% for the EFTA countries. The aggregated average distance travelled was 25.2 km in EU-15 countries, 17.3 km in EFTA, 50.8 km in the New member states and 77 km in the candidate countries. In EU-15, the average was “pulled down” by the dominant weight of purely suburban data, and especially of Ile-de-France (nearly 15% of all passengers transported in Europe). Throughout the countries where data is available, the average distance was of about 27.9 km (weighted by the passengers carried annually). The majority of the countries presented an average distance of 20 to 30 km and a density of less than 200 persons per one kilometre of track line. When the average distance diminishes and the usage density increases, the services can be categorised as typically commuter rail service versus regional rail services.
4.1.8 Network Data
Number of lines operated: Many companies that completed the survey in 2006 did not provide data on the number of regional and commuter lines they operate.
Gauge: Standard (1453mm), Metric (1000mm), Other (specify) From a total of 188 000 km of track in 2006, 2 303 km were meter gauge (1.2%), and 26 900 of other
7 Comparison with UIC statistics (metro and light rail not included)
8 From a consumer perspective, RATP RER is an intermediate service between regional and urban rail services. As the
average trip length on RATP RER is over 10 km, RATP RER has been included in the survey. However, due to the density of the services and to the nature of the infrastructure, RATP RER cannot be regarded as part of the European “conventional rail” system covered by the Railway Packages.

FOSTER RAIL / D2.1 Update of the suburban and regional (passenger) rail market analysis
Page 11 of 18
gauge (14%), of which 17 900 km (9% of total) were the so-called Iberic gauge. Expectedly, standard gauge was dominant and represented some 80% of the total.
Track length (km): (Definition: The length of physical infrastructure is taken, irrelevant of the fact that one or several line(s) are using the same alignment over a certain distance)
The total track length was in 2006 approximately 185 000 kilometres. The densest networks (comparison of the track length in km with the total territory in km²) were to be found in (decreasing order) Switzerland, Germany, Czech Republic, Luxembourg, Hungary, Belgium, Austria, Slovenia. The least dense networks were the Finnish, the Swedish and the Irish, followed by Norway, Estonia and Turkey.
Separation of the regional network from the rest of the railway system: (Definition: The 2nd railway package specifies that Member States can exclude from the scope of Directive 2004/49 on Safety “networks that are “functionally” (FS) or “physically” separate (PS) from the rest of the railway system and intended only for the operation of local, urban or suburban passenger services, as well as railway undertakings operating solely on these networks”)
The notions of “physical” and “functional” separation may lack accuracy and 2006 results may be hesitant to some extent. However, at that date nearly 85% of the regional and commuter rail infrastructure was not separated from the European conventional rail system. Small railway companies tend to operate on lines that are not part of the European railway network. More detailed is expected from the 2013 survey due to the new possibilities offered to exclude lines from the scope of the Interoperability and Safety Directives.
Ownership of infrastructure: (Definition: In Europe, most railways infrastructure lies with the national infrastructure manager (NIM). However, some regional lines may deviate from this model, with the infrastructure owned by the operator (O) or in other hands (else)
The 2006 survey confirmed that only a very limited part of infrastructure lies in the hands of actors different from the National Infrastructure Managers established by Directive 91/440/EEC. Only 8% of the infrastructure belonged to railway operators, mainly due to historical reasons. Operator owned infrastructure was to be found mainly in Ireland, Luxembourg, Hungary, (where it represented 100% of the infrastructure, resulting from failure to implement European Directives), Lithuania (900 km out of 1 067 km), Switzerland (2 598 km, i.e. 46% of the entire infrastructure), Germany (1 955 km) and Austria (535km). Less than 1% belongs to other actors such as local authorities, etc. in Spain, Denmark, Italy, France.
Other operator on the line: (Definition: The European model of separation of infrastructure and rolling stock aims at allowing traffic from different operators to run on same infrastructure. However, this is not always the case. Please indicate if another operator, for passenger (P) or freight (F) traffic, is using the infrastructure)
On some 45 000 km (24%) of the total length of the European network (included in the 2006 survey), there were no other rail operators but the one providing regional and commuter rail transport. On about 10 000 km (5%) there was one or more other rail operator(s) transporting freight. On 9 500 km (5%) there was one or more rail operator(s) providing passenger services, and on 101 000 km (54%) of the network there was one or more operator(s) providing both freight and passenger services.
Station management: (Definition: The company may be in charge of the station management, e.g. passenger information, ticket sales etc., or this could be the responsibility of the infrastructure manager)
FOSTER RAIL / D2.1 Update of the suburban and regional (passenger) rail market analysis
Page 12 of 18
Information on station management was available in 2006 for 99 companies. Out of them, in 16% of the cases, the responsible for station management was the Infrastructure Manager, and in the rest of the cases it was the Operator. When the infrastructure belonged to the Infrastructure Manager, only in one third of the cases the IM was responsible for the management of stations as well, and in other two thirds it was up to the operator to fulfil this task.
4.1.9 Rolling Stock Data
Rolling stock type (Type and number of units per type: Locomotives, Unmotorised carriages (Single deck and Double deck) and Motorised carriages (Diesel multiple units - DMU and Electrical multiple units – EMU)
Survey respondents were asked in 2006 to provide data on number and type of their fleet used in the provision of regional and commuter services. In total, about 64 000 units (excluding locomotives) made up the “regional and commuter” fleet. Their distribution across the country groups was as follows: 64% in EU15, 24% in the new Member States, 12% equally split between Candidate countries and EFTA countries.
Many of the responses received in 2006 contained insufficient information on fleet numbers and the 2013 survey should help completing the picture. Looking at the type of rolling stock, by far prevailing were the single deck carriages (39% of the total fleet), followed by the Electric Multiple Units (24%). The un-motorised vehicles formed the largest part of the rolling stock in the Candidate countries (86%), the new Member States (80% of their fleet) and EFTA countries (75%). In EU 15 the single deck
carriages represented 29% of the rolling stock and double deck carriages accounted for another 15%9.
The large majority of double deck vehicles were operated in EU 15 countries (summarizing about 75% of all double deck vehicles in the surveyed countries). The largest share of EMUs was also to be found in EU15 countries where they represent about 44% of the fleet. If the DMUs were added, the result revealed a predominance of the multiple units (56% of the total fleet in EU15). Private companies largely owned and/or operated motorised carriages – more than 90% of their rolling stock was composed of EMUs (75%) or DMUs (close to 18%).
Rolling stock ownership : (Definition: Rolling asset belong either to operator or to organising authority. It can also be owned by the
operator, but purchased with public subsidies/support), or leased from a Rolling stock company. There are also cases of leased rolling stock)
Half of the companies responded in 2006 to this question. From the available data, the lions’s share remained the traditional operator ownership (nearly 90%) with public subsidies in half of the cases. Data on leasing was far from comprehensive. Large companies tended to have a variety of asset ownership models and schemes, but failed to provide details on their breakdowns in 2006.
9 The calculations exclude a large part of the data for Germany and Denmark. In both cases, the data on
rolling stock is only available in an aggregated way and not by type. Therefore, the tables below are generated with only limited portion of information available on fleet split in Germany, and no data on Denmark.

FOSTER RAIL / D2.1 Update of the suburban and regional (passenger) rail market analysis
Page 13 of 18
4.2 Changes brought in the 2005 questionnaire and organisation of the new survey
4.2.1 Changes in the questionnaire
As presented above, several questions did not get clear enough answers during the 2005 survey, and the market evolution since 2005 needs to be analysed in a context which has seen over recent years both a change in the EU railway legislation and a Europe wide economic crisis.
The introduction to the survey has been changed.
In most of the questions a reference has been added to the date when data has been produced.
o Chapter “Company profile and relationship with Authorities”
A question has been added about the “Territory/Main city(ies)/Urban area(s) served”. The purpose of the question is to identify quickly/easily the area and major conurbations served by the company. It has been asked also to specify if available the total land area (km2) and population served.
The question about operating services only on the suburban/regional network has been précised: “Yes: if mainline portion does not exceed 10% of train x kms”.
The question about other rail services provided by the company has been moved in this chapter from the chapter “Supply Data”, and a box “others” has been introduced.
Several questions have been added as follows:
Compliance of the company with the interoperability requirements: RU-Yes, RU-No, DL-Yes, DL-No
- Your company is or is not registered as a licensed Railway Undertaking (RU) in line with the Rail Interoperability and Safety legislation (RU-Yes, RU – No).
- Your drivers do or do not have a European Driver’s license (DL-Yes, DL – No).
Future evolution of the rail institutional framework:
Is a major change in your suburban/regional rail market highly probable within the next 5+ years?
Yes - No
If yes, please specify or provide a contact point (name, function, email and telephone):
o Chapter “Supply Data”
The questions about supply data have been reformulated as follows:
Annual train kilometers (Mio): Year:
- If available: Annual seat x kilometres (Mio): Year:
- If available: Annual place x kilometres (Mio): Year:
Range of capacity of the various train sets within your fleet
This question relates to offered capacity in seats and standing passengers of a train under normal operations. Please provide the basis for the calculation.
- Capacity of train sets with minimum capacity (number of passengers):
- Capacity of train sets with maximum capacity (number of passengers):
- Average train capacity of your fleet (number of passengers):
- Basis for the calculation of standing passengers:
Contractual category of passenger regional rail services provided: PSR1, PSR2, FCB
The company may operate regional passenger services on commercial services and/or following public services requirements, as follows:
- Suburban/Regional passenger services with public service requirements (PSR) in relationship with one regional/local authority only (type1: PSR1)
FOSTER RAIL / D2.1 Update of the suburban and regional (passenger) rail market analysis
Page 14 of 18
- Suburban/Regional passenger services with public service requirements (PSR) in relationship with more than one regional/local authority (type 2: PSR2)
- Suburban/Regional passenger rail services operated on a fully commercial basis (FCB)
Some questions have been added about the business environment:
Business environment and impact on supply:
o Did the economic crisis (2008-2013) affect your operations? Yes - No
If yes, please detail (e.g. in % of train x km, or km of line closure, or % of services cancelled… over a period you need to specify in comparison with a base year you need to specify as well). o Potential competition with open access services : European legislation is liberalizing passenger transport by rail. This may cover the so-called “cabotage” traffic (i.e. passengers getting on and off the train on the same side of the border). Such services could be in competition with regional services operated under public service requirements/contract. Do you believe that this outlook shall affect your business? Yes - No If yes, please comment if you wish.
o Chapter “Demand data”
Some questions have been added about the business environment:
Business environment and impact on patronage:
o Did the economic crisis (2008-2013) affect your level of demand (number of
passengers)? Yes - No
If yes, please give details of the order of magnitude in % …, over a period you need to specify in comparison with a base year you need to specify as well.
o Future evolution of the patronage (number of passengers) : G-Growth; F-Flat; D-Decrease Please give details of the order of magnitude in %: Please specify the starting year and period(s) considered (e.g. 5, 10, 20 years):
o Chapter “Network Data”
The question about the number of lines has been deleted, the question about network length has been reformulated, and several questions have been added or reformulated as follows:
Network length (km): Year: o Single track (km): o Double track (km): o More than double track: o Proportion of the network that is electrified:
Any comment?
Number of stations/stops served:
If available, specify how many stations/stops are used by other rail service providers: If available, specify how many stations/stops are connected with other means of public transport (either by bus, tram, light rail, metro or a mix): If you wish, please comment.
FOSTER RAIL / D2.1 Update of the suburban and regional (passenger) rail market analysis
Page 15 of 18
Exclusion of assets from the scope of the European Rail Technical Legislation: No, F-INF, P-INF, F-RS, P-RS, SC-INF, SC-RS, D-INF, D-RS
The European Rail Legislation (Safety Directive 2004/49/EC and Interoperability Directive 2008/57/EC) specifies that Member States may exclude some networks from the scope of the legislation (and especially “networks that are functionally separate from the rest of the railway system and intended only for the operation of local, urban or suburban passenger services, as well as railway undertakings operating solely on these networks”). The exclusion may be full (F-INF) or partial (P-INF) for infrastructure, full for Rolling Stock (F-RS). This legislation also allows for specific cases for infrastructure (SC-INF) or for Rolling Stock (SC-RS) as well as for derogations for infrastructure (D-INF) or for Rolling Stock (D-RS). If you wish, please comment.
Ownership of infrastructure: NIM-F, REG-F, REG-A, O, else (specify) In Europe, most railway infrastructure is under the responsibility of the national infrastructure manager (NIM-F). However, some regional lines may deviate from this model, with the region being full owner of the infrastructure (REG-F) or being given by the national Infrastructure Manager, through specific agreements, the responsibility for the management of the line (REG-A). In some cases the infrastructure is owned by the operator (O). Other cases (else) need to be specified…
Other operator on the line: No, P, F
The European model of separation of infrastructure and rolling stock aims at allowing traffic from different railway undertakings to run on the same infrastructure. However, this is not always the case. Please indicate if another railway undertaking, for passenger (P) or freight (F) traffic, is sharing the infrastructure. If you wish, please comment:
Station management: C-Yes, C-No, IM, IM-Out, C-Out, Other (specify)
The company may or may not be in charge of the station management (C-Yes, C-No), or this could be the responsibility of the infrastructure manager (IM), or it can be outsourced by the infrastructure manager (IM-Out) or by the company (C-Out). Other cases (Other) need to be specified. If you wish, please comment:
Business environment Do you foresee major changes in you network? No; YC–Yes Construction of new lines; YU–Yes Upgrade of existing lines; YD-Decommissioning of existing length. Please give details of network length at stake (km): If you wish, please comment:
o Chapter Rolling Stock Data
The question about Rolling Stock type has been précised and questions about business environment have been added or – with regard to orders for new rolling stock - slightly modified, as follows:
Rolling stock (number of units by types and age). Year:
- Locomotives: Diesel: -Electric:
- Non-motorised carriages (trailer cars):
- Single deck:
- Double deck:
- Diesel multiple unit - DMU:
- Single deck:
- Double deck:
- Electrical multiple unit - EMU:
- Single deck:
- Double deck:
FOSTER RAIL / D2.1 Update of the suburban and regional (passenger) rail market analysis
Page 16 of 18
Business environment and impact on fleet
o Did the economic crisis (2008-2013) affect your investment in Rolling Stock?
- Postponement of fleet increase: Yes - No
- Postponement of fleet renewal: Yes - No
- Postponement of fleet upgrades: Yes - No
If yes, please give details (reference to categories in 6.1):
o Orders for new rolling stock
- Ongoing orders (contract signed, not yet delivered):
- Planned for the next 3 years (2013-2016):
- Planned for after 2016 (please specify also the period):
o Chapter “Research and Innovation data”
This chapter has been simplified, and limited to a contact point for further more detailed contacts, as follows:
RESEARCH AND INNOVATION DATA
Does your company have a specific policy on research? YES - NO
If yes, can you please provide the name, function and contact details (email and telephone) of a contact point for further investigation?
Name:
Company/Function:
Email:
Phone number:
4.2.2 Organisation of the survey
UITP decided to organise the survey through an online tool called “Survey Monkey” which UITP is using now since a few years and which facilitates the answering and the analysis of results.
A total of 280 companies have been identified in the 28 Members States and in Switzerland, Norway, Bulgaria, Turkey, Serbia and Bosnia.
UITP also contacted CER for their support (contact points in major companies).
The survey is introduced by a message of UITP Secretary General Alain Flausch recalling the background and drawing the attention of the Company or in some cases Competent Authority about the following points:
“You will receive in a few moments a message from the on-line survey provider. We would like to draw your attention to the strategic importance and we hope that you will task your relevant staff to answer it. Attached is a paper version of the survey to help collect the information. Consolidated company answers should be made on-line.
Results of the survey will not be presented on an individual basis, but in an aggregated way, according to the pertinent classification resulting from the analysis of the results. We would appreciate your feedback by 1 December.
Participating operators will receive the full survey results when they are available and will therefore be able to have privileged access to this first-hand information and intelligence.”

FOSTER RAIL / D2.1 Update of the suburban and regional (passenger) rail market analysis
Page 17 of 18
5. General Evolutions of the Regional and Suburban Market Segments Even though the responses received until the initial deadline for the D2.1 publication were insufficient in order to present the situation of the RSR market in Europe, UITP had nevertheless started to make an overview of the evolutions of this rail segment during the past years, The aim of this overview was to provide a broader context for the RSR market study, in order to better understand the general trends and evolutions within the sector. Moreover, this information was part of a larger contribution meant as an input for D2.2. It is very difficult to collect and present global quantitative figures about Suburban and Regional rail market current status, and consequently about its evolution in the next thirty years. Waiting for the results of the current UITP survey, one can have a look at statistics produced either by Eurostat
10 or by national public
transport associations like VDV for Germany, UTP for France or ASSTRA for Italy. Looking backwards in the past thirty years, according to Eurostat it appears that after a period of huge growth of car ownership
11 in the last quarter of the 20th century in EU27 (e.g. from around 350 cars per 1000
Inhabitants in 1990 to an estimated 473 in 2009), the car ownership rate increase which was still of 1,9% per year from 1990 to 2005 in EU27 – and which is still increasing in the “new” Member States - has started to reduce in the more developed EU countries: EU15 faced a noticeable reduction of the motorization rate after 2001. In Germany for example, the car ownership rate decreased from 540 cars per 1000 inhabitants in 2001 to 525 in 2011, after a peak at 565 in 2006. In UK, over the same period, it increased from 437 in 2001 to 461 in 2006, and then decreased to 450 in 2011. According to Eurostat: “All of the top 20 regions with the highest motorisation rates [in 2009] were in EU15 Member States with half of them in Italy. A number of regions close to larger cities also reported high motorisation rates, suggesting a larger number of workers commuting by car. Examples of this included Flevoland in the Netherlands, Berkshire, Buckinghamshire and Oxfordshire in the United Kingdom, Attiki in Greece, as well as Burgenland and Niederösterreich in Austria. Several island regions also reported high motorisation rates, including Åland in Finland, the Illes Balears in Spain, Sicilia and Sardegna in Italy and Corse in France, as well as Malta and Cyprus, which had the highest and third highest motorisation rates of any regions within the Member States that joined the EU in 2004 or 2007 (the second highest was Lithuania). These relatively high figures for islands may, in part, be explained by a lack of alternative means for inland travel; for example, most of these islands have a relatively underdeveloped rail infrastructure or no rail services at all.” It is clear as well that the development of motorways in Europe can no longer follow the high growth rate of the last century, and that the decrease of the total length of the railway system in Europe - which has drastically reduced until the mid-90s – shall not follow the past trend any longer, while the rail performance is increasing thanks to electrification and to the modernisation of infrastructure and rolling stock.
Citing Eurostat again: “In March 2011 the European Commission adopted a White Paper titled ‘Roadmap to a single European transport area — Towards a competitive and resource efficient transport system’ (COM(2011) 144 final). This comprehensive strategy contains 40 specific initiatives for the next decade to build a competitive transport system that aims to increase mobility, remove major barriers in key areas and fuel growth and employment. The proposals also seek to reduce dramatically Europe’s dependence on imported oil and to cut carbon emissions, with a set of goals to be achieved for 2050, including:
no more conventionally-fuelled cars in cities;
[…]
a 50 % shift in medium-distance inter-city passenger and freight journeys away from roads to either rail or waterborne transport;
all of which should contribute to a 60 % cut in transport emissions by the middle of the century.
In October 2011, the European Commission made a proposal for a Regulation establishing the ‘Connecting Europe Facility’ (COM(2011) 665 final), which seeks to provide support for the creation of transport, energy
10
http://epp.eurostat.ec.europa.eu/statistics_explained/index.php/Eurostat_regional_yearbook 11
http://epp.eurostat.ec.europa.eu/tgm/table.do?tab=table&init=1&plugin=1&language=en&pcode=tsdpc340

FOSTER RAIL / D2.1 Update of the suburban and regional (passenger) rail market analysis
Page 18 of 18
and telecommunications infrastructure to interconnect Europe. In the transport sector, a Europe-wide ‘core’ network has been identified with corridors carrying freight and passenger traffic with high efficiency and low emissions. The conclusions of the European Council meeting on 7/8 February 2013 foresees, under the Multiannual Financial Framework, an allocation of EUR 23.1 billion for transport during the period 2014-20 in order to complete missing links and alleviate bottlenecks.”
Based on the above figures and statements, the potential for growth of suburban and regional rail appears to be very promising. As an example
12, from 1980 to 2010 the traffic of suburban and regional rail in France
(Transilien and TER) grew from 10 Billion passenger x km in 1980 to 24,4 in 2010, with all the growth from 1995 (25% growth in 25 years).
Doubling the market share of suburban and regional rail in the next decades– as was the objective set up by the ERRAC SRRA 2020 in 2002 – is still an ambitious but possible goal for 2030-2050 in comparison with 2000.
6. Conclusion
The suburban and regional railway market had been explicitly recognised as a European R&D target not only in ERRAC SRRA but also in ERRAC brochures and in the various Work Packages and tasks of FOSTER RAIL.
Suburban and regional rail is an important segment of the overall passenger rail market, as shown from the 2006 report “Suburban and Regional Railway Landscape in Europe” which has been summarized above. It has however to be more thoroughly analysed. Indeed it is currently an opening market in several European countries. It is also a challenging public transport market, notably for ensuring sustainable urban mobility, encouraging modal shift from private car and decongesting transport corridors providing access to major European cities. From the experience of the 2005 survey, it has been decided to update the survey under task 2.2 of FOSTER RAIL. The current deliverable D2.1 has presented the main features of the suburban and regional rail market, and has detailed the changes brought in the questionnaire as well as in the organisation of the survey through the use of an on-line tool. The survey has been launched in October. Unfortunately, the weak responses to the survey had determined UITP not to publish any data in this deliverable, except for some general ‘historic’ trends identified within the RSR market. All data will be presented in the final report – Deliverable D2.4. Its production is expected for June 2015.
12
http://www.ladocumentationfrancaise.fr/var/storage/rapports-publics/124000432/0000.pdf page 27