deliverable d3.3 design guidelines for the application of
TRANSCRIPT

This project has received funding from the European Union’s Horizon 2020 research and innovation programme under grant agreement No. 700748
LIQUEFACT Deliverable D3.3
Design guidelines for the application of soil characterisation and liquefaction risk assessment protocols
v. 1.0
1
LIQUEFACT
Assessment and mitigation of Liquefaction potential across Europe: a holistic
approach to protect structures/infrastructure for improved resilience to
earthquake-induced Liquefaction disasters.
H2020-DRA-2015
GA no. 700748
DELIVERABLE D3.3
Design guidelines for the application of soil characterisation and
liquefaction risk assessment protocols
Author(s): António Viana da Fonseca, Maxim Millen, Xavier Romão, Julieth Quintero, Sara Rios and Abdelghani Meslem.
Responsible Partner: University of Porto (UPorto)
Version: 1.0
Date: 31/12/2018
Distribution Level (CO, PU) PU
Ref. Ares(2020)622922 - 31/01/2020

This project has received funding from the European Union’s Horizon 2020 research and innovation programme under grant agreement No. 700748
LIQUEFACT Deliverable D3.3
Design guidelines for the application of soil characterisation and liquefaction risk assessment protocols
v. 1.0
2
DOCUMENT REVISION HISTORY
Date Version Editor Comments Status
31/12/2018 1 First Draft Draft
LIST OF PARTNERS
Participant Name Country
UPORTO Universidade do Porto Portugal
Istan-Uni Istanbul Universitesi Turkey
ULJ Univerza V Ljubljani Slovenia
UNINA Universita degli Studi di Napoli Federico II Italy
NORSAR Stiftelsen Norsar Norway
ARU Anglia Ruskin University Higher Education Corporation United Kingdom
UNIPV Università degli Studi di Pavia Italy
UNICAS Universita degli Studi di Cassino e del Lazio Meridionale Italy

This project has received funding from the European Union’s Horizon 2020 research and innovation programme under grant agreement No. 700748
LIQUEFACT Deliverable D3.3
Design guidelines for the application of soil characterisation and liquefaction risk assessment protocols
v. 1.0
3
CONTENTS EXECUTIVE SUMMARY ................................................................................................................................... 6
SCOPE AND PURPOSE .................................................................................................................................... 7
1. INTRODUCTION .............................................................................................................................. 8
2. CLASSIFICATION OF INFRASTRUCTURE AND SOIL DEPOSITS.............................................................. 9
2.1 KEY ASPECTS OF CLASSIFICATION OF INFRASTRUCTURE FOR LOSS AND RISK ASSESSMENT ........... 9
2.2 KEY ASPECTS OF CLASSIFICATION OF LIQUEFACTION FOR LOSS AND RISK ASSESSMENT .............. 10
2.3 CLASSIFICATION OF INFRASTRUCTURE ........................................................................................... 11
2.4 CLASSIFICATION OF SOIL PROFILE ................................................................................................... 14
REFERENCES................................................................................................................................................. 15
3. QUANTIFY THE SEISMIC HAZARD ................................................................................................... 17
REFERENCES................................................................................................................................................. 18
4. ASSESSMENT OF VULNERABILITY .................................................................................................. 19
4.1 THE EFFECTS OF LIQUEFACTION-INDUCED GROUND DEFORMATIONS ON THE PERFORMANCE OF
BUILDINGS ................................................................................................................................................... 20
4.2 METHODS TO QUANTIFY VULNERABILITY ....................................................................................... 22
4.3 DISCUSSION OF THE ROLE OF VULNERABILITY FUNCTIONS ............................................................ 23
REFERENCES................................................................................................................................................. 24
5. COMPUTATION OF LOSSES ............................................................................................................ 26
5.1. LOSS CALCULATION EXAMPLE CASE STUDY ......................................................................................... 29
REFERENCES................................................................................................................................................. 33
6. FINAL REMARKS ............................................................................................................................ 34

This project has received funding from the European Union’s Horizon 2020 research and innovation programme under grant agreement No. 700748
LIQUEFACT Deliverable D3.3
Design guidelines for the application of soil characterisation and liquefaction risk assessment protocols
v. 1.0
4
LIST OF FIGURES AND TABLES
FIGURES
Figure 2.1: Influence of liquefaction classification on uncertainty in fragility curves..................................... 11
Figure 2.2: Example of a building class from the GEM Building Taxonomy: attributes and associated levels of
detail ................................................................................................................................................................ 12
Figure 2.3: The SERA project BCIM model - sources of uncertainty that have to be included in the derivation
of vulnerability functions for a given building class where a limited number of attributes are known. ........ 14
Figure 2.4: Liquefact soil profile classification criteria .................................................................................... 14
Figure 2.5: Liquefact soil profile classes .......................................................................................................... 15
Figure 4.1. Behaviour of frame buildings with flexible shallow foundations due to differential vertical ground
settlements (Bird et al. 2006). ......................................................................................................................... 21
Figure 4.2. (a) Liquefaction-induced uniform vertical settlements of building with stiff shallow foundations;
(b) differential vertical settlements of building (rotation) with stiff shallow foundations (Bird et al. 2006). 21
Figure 4.3: Dynamic performance parameters and residual performance parameters used to quantify the
performance of a building. .............................................................................................................................. 22
Figure 4.4: Application of the macro-mechanism approach to assess vulnerability and losses ..................... 24
Figure 5.1: Obtaining probabilities from fragility curves ................................................................................ 29

This project has received funding from the European Union’s Horizon 2020 research and innovation programme under grant agreement No. 700748
LIQUEFACT Deliverable D3.3
Design guidelines for the application of soil characterisation and liquefaction risk assessment protocols
v. 1.0
5
TABLES
Table 2.1: Values of attributes of GEM Building Taxonomy used to describe European residential buildings
......................................................................................................................................................................... 13
Table 5.1: Building damage states and associated losses and probabilities ................................................... 30
Table 5.2: Foundation damage states and associated losses and probabilities ............................................. 30
Table 5.3: Combine performance damage states and associated losses and probabilities ........................... 30
Table 5.4: Combined building foundation damage states .............................................................................. 31
Table 5.5: Probabilities of each building-foundation damage state ............................................................... 31
Table 5.6: Losses associated to each building-soil damage state ................................................................... 32

This project has received funding from the European Union’s Horizon 2020 research and innovation programme under grant agreement No. 700748
LIQUEFACT Deliverable D3.3
Design guidelines for the application of soil characterisation and liquefaction risk assessment protocols
v. 1.0
6
EXECUTIVE SUMMARY
This report provides an overview of the key steps for assessing the risk of infrastructures that are exposed to
liquefaction and discusses key aspects related to the definition of exposure models (for infrastructures and
soil deposits), seismic hazard, vulnerability assessment and expected loss quantification. Each topic is
discussed in the context of liquefaction-induced ground deformations and their effect on the performance
of buildings, highlighting the necessary requirements as well as the existing approaches and their limitations.
Particular focus is given to features developed in LIQUEFACT. Among these, reference is made to the
equivalent soil profile scheme for classifying liquefaction susceptibility for loss assessment and that should
be combined with existing infrastructure taxonomies for the purpose of developing a combined exposure
model accounting for liquefaction susceptibility. Likewise, reference is also made to a novel procedure
presented for the calculation of losses accounting for liquefaction-induced ground deformations that is based
on a state-of-the-art approach for calculating probabilistic losses from a seismic vulnerability assessment
considering building, foundation and system damage states.
This project has received funding from the European Union’s Horizon 2020 research and innovation programme under grant agreement No. 700748
LIQUEFACT Deliverable D3.3
Design guidelines for the application of soil characterisation and liquefaction risk assessment protocols
v. 1.0
7
SCOPE AND PURPOSE
This document provides an overview of the key steps for assessing the risk of infrastructure that are exposed
to liquefaction. The main steps been classification of the soil deposit and the infrastructure of interest,
quantify the seismic hazard, assess the vulnerability of the infrastructure, compute the expected losses. The
document focuses on buildings, however, the discussion is applicable to other infrastructure (embankments,
pipelines, bridges).
The first chapter provides a brief overview of probabilistic seismic risk assessment. The key attributes of
exposure, hazard and vulnerability are covered.
The second chapter looks in detail at exposure and how to classify assets and soil liquefaction inside a loss
assessment framework. The classification schema for buildings adopted in this project is explained. The
equivalent soil profile scheme for classifying liquefaction susceptibility for loss assessment that was
developed in LIQUEFACT D3.2 is briefly explained.
The third chapter focuses on seismic hazard, discussing the steps in quantifying seismic hazard. Recent
advancements in seismic hazard quantification. The issues around multiple ground motion intensities
measures are discussed, which is particularly relevant to soil-liquefaction-foundation-structure interaction
problems where structural damage is typically best correlated to peak energy based intensity measures,
while liquefaction is more strongly correlated to cumulative energy-based intensity measures.
Chapter 4 presents the keys steps in vulnerability assessment and reviews the vulnerability assessment
procedure developed for assessing buildings on liquefiable soil deposits that was developed in LIQUEFACT
Deliverable 3.2.
Chapter 5 focuses on the calculation of losses. A novel procedure is developed to combine conditioned
fragility curves. A case study loss example calculation is presented that demonstrates how the exposure,
hazard and vulnerability steps are used in the assessment of building losses.

This project has received funding from the European Union’s Horizon 2020 research and innovation programme under grant agreement No. 700748
LIQUEFACT Deliverable D3.3
Design guidelines for the application of soil characterisation and liquefaction risk assessment protocols
v. 1.0
8
1. INTRODUCTION
Probabilistic seismic risk and loss assessment involves the estimation of the probability of damage and losses
resulting from potential future earthquakes. This damage and loss might occur to buildings, infrastructure,
people or even the environment. The risk/loss framework that is being developed by LIQUEFACT is applicable
for estimating damage and loss in built infrastructures such as residential, commercial and industrial
buildings. A probabilistic seismic risk and loss assessment will perform the calculation and convolution of
seismic hazard, vulnerability functions for the elements at risk, and the exposure model describing primarily
the location and value of the elements at risk, Equation (1.1).
SEISMIC RISK SEISMIC HAZARD VULNERABILITY EXPOSURE (1.1)
To perform a probabilistic seismic risk and loss assessment at the regional level, the elements at risk (i.e. the
built infrastructure) need to be formally clustered according to building classes which are then organized
using a spatial inventory system defining the exposure model. Vulnerability functions will therefore need to
be defined for each building class and seismic hazard needs to be mapped at a scale compatible with the
regional level assessment that needs to be performed. On the contrary, for a building-specific seismic risk
and loss assessment, there is no need for a formal exposure model (i.e. the exposure term of Equation (1.1)
becomes 1), the necessary vulnerability functions are also building-specific and the seismic hazard needs to
be that of the location of the building.

This project has received funding from the European Union’s Horizon 2020 research and innovation programme under grant agreement No. 700748
LIQUEFACT Deliverable D3.3
Design guidelines for the application of soil characterisation and liquefaction risk assessment protocols
v. 1.0
LIQUEFACT Project – EC GA no. 700748 9
2. CLASSIFICATION OF INFRASTRUCTURE AND SOIL
DEPOSITS
Most of the aspects related to the classification of infrastructures discussed in this section are solely relevant
for performing a probabilistic seismic risk and loss assessment at the regional level, given the level of
uncertainty about the real characteristics of those infrastructures. For a building-specific seismic risk and loss
assessment, it is expected that adequate and detailed information about the necessary characteristics of the
building is available or can be obtained based on detailed surveys of the building. The case study building
presented in the LIQUEFACT report D3.2 section 2.8 (Viana da Fonseca et al., 2018), presents the classification
of a single building, while the classification of an embankment class is shown in case study D3.2 chapter 3
(Viana da Fonseca et al., 2018).
2.1 KEY ASPECTS OF CLASSIFICATION OF INFRASTRUCTURE FOR LOSS AND
RISK ASSESSMENT
For performing a probabilistic seismic risk and loss assessment at a regional level, an exposure model of the
elements at risk needs to be developed. To ensure a full compatibility between the exposure model and the
fragility/vulnerability functions, it is necessary to classify these elements using a common language or
classification scheme, i.e. a taxonomy. The main classifications of European residential buildings that were
used in past risk assessment research and projects (e.g. RISK-UE, LESSLOSS) were reviewed in the European
FP7 research project NERA (Network of European Research Infrastructures for Earthquake Risk Assessment
and Mitigation) (Crowley et al., 2015). These classes of buildings were typically described with a simple
classification scheme (e.g. RC1L refers to low-rise reinforced concrete moment frames) that was not easy to
expand in order to include missing types of construction, such as those used for commercial and industrial
buildings. They did not make use of a comprehensive building taxonomy. To address this lack of flexibility,
the NERA project used the GEM Building Taxonomy (Brzev et al., 2013) to classify European residential
buildings.
The GEM Building Taxonomy is a uniform classification system supported by the Global Earthquake Model
(www.globalquakemodel.org) that can be applied to buildings across the globe. A genetic code (genome) that
is a unique description for a building or a building typology can be generated using this taxonomy. This code
is defined by 13 main attributes and each attribute corresponds to a specific building characteristic that
affects its seismic performance such as material, lateral load-resisting system, building height, etc. The
taxonomy is organized as a series of expandable tables and each attribute can be described by one or more
level of detail (Figure 2.2). The main benefit of the GEM Building Taxonomy is that it is expandable and
collapsible, and so it can be used to describe both the detailed attributes of a single building as well as the
general characteristics of a structural system used for a class of buildings. It is thus ideal for a risk framework
that should lay out the principles of damage and loss assessment for different scales of resolution, from site-
specific, to local, to national/continental (often also referred to as regional). Many of the attributes in the
taxonomy are also relevant for other natural hazards, and expansion of the taxonomy for use in flood, storms

This project has received funding from the European Union’s Horizon 2020 research and innovation programme under grant agreement No. 700748
LIQUEFACT Deliverable D3.3
Design guidelines for the application of soil characterisation and liquefaction risk assessment protocols
v. 1.0
LIQUEFACT Project – EC GA no. 700748 10
and volcano risk is being carried out in collaboration with the World Bank’s Global Facility for Disaster Risk
Reduction (GFDRR), the CIMA Foundation (International Centre on Environmental Modelling), and the British
Geological Survey.
A few attributes of the GEM building taxonomy are currently being modified and expanded for the purpose
of the European risk framework under development by the European H2020 research project SERA
(Seismology and Earthquake Engineering Research Infrastructure Alliance for Europe) (http://www.sera-
eu.org) for residential, commercial and industrial buildings. Among other aspects that have been identified
as requiring further developments (Crowley et al., 2017), reference is made to the classification of the
ductility of lateral load resisting systems and of the foundation systems. For example, the former should
include an attribute of the level of ductility enforced by the design code used at the time of construction
while the latter should be expanded to account for the foundation soil type in order to allow the soil-structure
interaction effects.
2.2 KEY ASPECTS OF CLASSIFICATION OF LIQUEFACTION FOR LOSS AND RISK
ASSESSMENT
A similar framework to the GEM framework for buildings was developed in LIQUEFACT Deliverable 3.2 for
classification of liquefaction potential for soil deposits (Viana da Fonseca et al., 2018). The classification uses
just three attributes, cyclic resistance, depth and height of a critical liquefiable layer. The attributes and
criteria for the classes were chosen to best capture the performance of a building on a liquefiable soil deposit
(Millen et al. 2019), but can be applied to other infrastructure such as embankments (see chapter 3 in Viana
da Fonseca et al., 2018). This classification scheme provides a simple extension to the building classification
to make a building-soil-profile classification.
Although the equivalent soil profile has physically measurable parameters, the classification system was
developed to quantify performance. The focus on performance is important since liquefaction can be both
beneficial to building performance (reduced seismic action) and detrimental (increased settlement and tilt).
If the classification system failed to isolate the beneficial and detrimental effects than the fragility curves that
would be developed would represent high levels of uncertainty (Figure 2.1 - right) since there would be a
large variation in performance. Whereas, optimal classification would clearly distinguish the behaviour of
different classes ((Figure 2.1 – left, Liq class 1 – liquefaction is detrimental, Liq class 2 – liquefaction is
beneficial).
The combination of the building and soil classes allows the influence of settlement, tilt, soil-foundation
impedance and dynamic site response to implicitly be accounted for in the performance of the building.
Alternative procedures such as Bird et al. (2006) consider liquefaction effects based on liquefaction intensity
measures (e.g. Liquefaction Severity Number (LSN) (Van Ballegooy 2015)) and require interaction factors or
utility functions between shaking damage and liquefaction damage to calculate the overall performance. The
development of interaction factors is non-trivial as the quantification of the major aspects of soil-structure
interaction is dependent on the position and height of the liquefiable layer, as well as the time at which
liquefaction occurs during a shaking event (Millen et al., 2019). These attributes are not explicitly considered

This project has received funding from the European Union’s Horizon 2020 research and innovation programme under grant agreement No. 700748
LIQUEFACT Deliverable D3.3
Design guidelines for the application of soil characterisation and liquefaction risk assessment protocols
v. 1.0
LIQUEFACT Project – EC GA no. 700748 11
in singular intensity measures and therefore large uncertainty in the performance can be expected.
Alternatively, assessment of liquefaction risk requires comparison of the anticipated level of loading (i.e.
earthquake-induced ground shaking) imposed on a soil deposit with the inherent resistance of the soil to
liquefaction. Since both loading and resistance can vary with depth, the potential for liquefaction must be
evaluated at different depths within the soil profile of interest.
Figure 2.1: Influence of liquefaction classification on uncertainty in fragility curves
2.3 CLASSIFICATION OF INFRASTRUCTURE
As referred by (Crowley et al., 2018), various building inventory databases have been developed at a global
scale, following different approaches and with distinct levels of accuracy and reliability. For example, Jaiswal
et al. (2010) developed a global building inventory database for the PAGER system, which provides a
distribution of building classes for urban and rural areas, at a national scale. This database harmonizes various
sources of information and applies mapping schemes to infer structural building types globally. This database
is open and publicly available. Another example is the Global Exposure Database (GED) from the Global
Earthquake Model (GEM) that provides a spatial inventory of residential buildings and population for the
purposes of seismic risk modelling and earthquake loss estimation (Gamba, 2014). Data is available at three
different geographical scales and the sources of information depend on the selected scale. The datasets used
to populate GED include the Database of Global Administrative Areas (GADM), the Global Rural-Urban
Mapping Project (GRUMP), the Gridded Population of the World (GPW), the Multiple Indicator Cluster
Surveys (MICS), UN Habitat’s Global Urban Observatory (GUO) data, United Nations statistics, PAGER building
inventory database, among others. The GED database is publicly available through the OpenQuake platform.
Another global initiative regarding building inventories is The World Housing Encyclopedia (WHE, 2014).
Detailed housing reports from all over the world are publically available and include information about the
building type, construction practice, average floor areas, average construction cost, and a qualitative
estimation of building’s vulnerability under seismic events. However, the WHE reports do not cover the
number of buildings in each country or the associated geographical distribution.

This project has received funding from the European Union’s Horizon 2020 research and innovation programme under grant agreement No. 700748
LIQUEFACT Deliverable D3.3
Design guidelines for the application of soil characterisation and liquefaction risk assessment protocols
v. 1.0
LIQUEFACT Project – EC GA no. 700748 12
.
Figure 2.2: Example of a building class from the GEM Building Taxonomy: attributes and associated levels of detail
Currently, as part of the European risk framework work package of the H2020 SERA project, further efforts
are being made to collect the latest building and population/dwelling census data across Europe at the
smallest possible administrative level, to involve structural engineers from a number of countries across
54
Each attribute has been described by one or more levels of detail, which will be referred to as Level 1, 2, 3,
etc., in this document. Attributes and associated details included in the GEM Building Taxonomy are presented
in Figure 4.2. It can be seen from the diagram that some attributes (e.g. Direction, Building Position within a
Block, etc.) have only one level of detail, while others (e.g. Roof) have five levels. Number of levels depends on
the complexity of specific building attribute. A brief description of each attribute level is outlined in Table 4.1,
and additional information and illustrations are provided in the online Glossary (see Section 4.7.2).
It should be noted that a few attributes provide information useful for other natural hazards. For example,
roof connections level in the Roof attribute may be useful for assessing risk of hurricane damage, and height
of ground floor level above grade (Height attribute) may be useful for assessing flooding risk.
Figure 4.2 GEM Building Taxonomy v2.0: attributes and associated levels of detail

This project has received funding from the European Union’s Horizon 2020 research and innovation programme under grant agreement No. 700748
LIQUEFACT Deliverable D3.3
Design guidelines for the application of soil characterisation and liquefaction risk assessment protocols
v. 1.0
LIQUEFACT Project – EC GA no. 700748 13
Europe in the development of the mapping schemes for residential buildings, and to further improve
different aspects of the NERA methodology. The development of the European residential exposure model
of the SERA project follows four main steps: i) definition of building classes, ii) mapping census data to
building classes, iii) mapping dwellings to building, and iv) estimation of replacement cost and number of
occupants. The starting point of the exposure model under development within SERA considers the attributes
presented in Table 2.1 as characteristics that can be assessed at a regional scale. In addition to these attribute
values, two additional values are expected to be included in the final version of the SERA exposure model.
These two additional values will address the characteristics of the structural design of the building (which will
reflect the expected level of ductility of the structure) and the level of the design seismic action.
Table 2.1: Values of attributes of GEM Building Taxonomy used to describe European residential buildings
ATTRIBUTE CODE LEVEL 1 VALUE CODE LEVEL 2 VALUE
MATERIAL OF LATERAL LOAD-RESISTING SYSTEM
CR Concrete, reinforced PC Precast concrete
MUR Masonry, unreinforced CB99 Concrete blocks, unknown type
MR Masonry, reinforced CL99 Fired clay unit, unknown type
MCF Masonry, confined ST99 Stone, unknown technology
MATO Material, other ADO Adobe blocks
ER Earth, reinforced
W Wood
S Steel
LATERAL LOAD-RESISTING SYSTEM
LWAL Wall DUCL Ductile, low
LDUAL Dual frame-wall DUCM Ductile, medium
LFM Moment frame DUCH Ductile, high
LFINF Infilled frame DNO Non-ductile
HEIGHT H Number of storeys above ground
HBET Range
HEX Exact number
The fragility/vulnerability functions of buildings classes are seen to depend on these collectable attributes
and their values. Still, these fragility/vulnerability functions also depend on information about other building
characteristics that are difficult or even impossible to collect at a regional scale. Among other aspects of the
risk framework under development by the SERA project, one of its key aspects is the ability to be able to
incorporate sources of uncertainty associated to the building class coming from attributes that are not
explicitly characterized. Since these additional attributes are unknown, building classes defined based on
available information (i.e. information that can be collected) can be seen as condensed building classes that
need to be unfolded so the contribution to the seismic vulnerability of the building class of the remaining
unknown attributes can be characterized. The association of these unfolded building class attributes with the

This project has received funding from the European Union’s Horizon 2020 research and innovation programme under grant agreement No. 700748
LIQUEFACT Deliverable D3.3
Design guidelines for the application of soil characterisation and liquefaction risk assessment protocols
v. 1.0
LIQUEFACT Project – EC GA no. 700748 14
information about the known attributes defines a Building Class Information Model (BCIM). The development
of the BCIM of a given building class is currently being carried out within the SERA project and will be able to
include the necessary information to compute the total variability of the fragility/vulnerability function
associated to that building class. Therefore, the BCIM can be integrated with the seismic risk and loss
framework developed by LIQUEFACT. The main aspects of the BCIM in terms of the relevant sources of
uncertainty due to attributes that are not explicitly characterized are illustrated in Figure 2.3.
Figure 2.3: The SERA project BCIM model - sources of uncertainty that have to be included in the derivation of vulnerability functions for a given building class where a limited number of attributes are known.
2.4 CLASSIFICATION OF SOIL PROFILE
The LIQUEFACT soil profile classification criteria are outlined in Figure 2.4 and produce the 22 classes in
Figure 2.5 using that criteria. A soil profile can either be classified using CPT, SPT, DMT, Vs logging or
laboratory data for a building specific study, or taken for macro-zonation maps using the procedures outlined
in section 2.3 of Deliverable 3.2 (Viana da Fonseca et al., 2018).
Figure 2.4: Liquefact soil profile classification criteria
Building Class
known
Typically # of storeys
Material & Year of construction
High-level attribute sub-
classes (geometry variables, materials)
Partially available
from building stock surveys
Lower level attribute sub-classes that were folded
Type of lateral load
resisting system, floor type,
construction quality,
details, designer assumptions
Unkown but
correlated with
known
Typically correlated
with the Year ofconstruction (design
class, seismic
intensity,…)

This project has received funding from the European Union’s Horizon 2020 research and innovation programme under grant agreement No. 700748
LIQUEFACT Deliverable D3.3
Design guidelines for the application of soil characterisation and liquefaction risk assessment protocols
v. 1.0
LIQUEFACT Project – EC GA no. 700748 15
Figure 2.5: Liquefact soil profile classes
The additional unclassified attributes for the soil profile, e.g. shear modulus, void ratio, permeability should
be obtained either directly through laboratory or field tests and correlations in literature for building specific
studies. Or for regional scale behaviour the values should be sampled through correlations that are consistent
with cyclic resistance, soil behaviour index and effective stress.
REFERENCES
Bird, J.F., Bommer, J.J., Crowley, H. and Pinho, R. (2006) Modelling liquefaction-induced building damage in earthquake loss estimation. Soil Dynamics and Earthquake Engineering 26(1), 15–30.
Brzev S., Scawthorn, C., Charleson, A., Allen, L., Greene, M., Jaiswal, K. and Silva, V. (2013), GEM Building Taxonomy Version 2.0. GEM Technical Report 2013-02 V1.0.0, 182 pp., GEM Foundation, Pavia, Italy, DOI: 10.13117/GEM.EXP-MOD.TR2013.02. Available from URL: https://www.globalquakemodel.org/single-post/2017/05/17/GEM-Building-Taxonomy-Version-20
BU-KOERI (2010) Earthquake loss estimation routine-ELER v3.0, Technical manual
Crowley H. Özcebe S., Spence R., Foulser-Piggott R., Erdik M. and Alten K.(2012) Development of a European Building Inventory Database. Proceedings of 15th World Conference on Earthquake Engineering, Lisbon, Portugal.
Crowley H., Colombi M. and Ozcebe S. (2015) D7.3 European Building Classification. NERA Deliverable 7.3, available from: https://www.orfeus-eu.org/other/projects/nera/NERA_D7.3.pdf
Crowley, H., Despotaki, V., Silva, V., Pitilakis, D., Pitilakis, K., Hancilar, U., Bursi, O., Wenzel, M., di Filippo, R. and Castro, J. (2017) D26.1 Taxonomy of European residential, commercial, industrial buildings and industrial plants. SERA Deliverable 26.1. Seismology and Earthquake Engineering Research Infrastructure Alliance for Europe.
Crowley, H., Rodrigues, D., Despotaki, V., Silva, V., Covi, P., Pitilakis, K., Pitilakis, D., Riga, E., Karatzetzou, A., Romão, X., Castro, J., Pereira, N. and Hancilar, U. (2018) D26.2 Methods for Developing European Residential Exposure Models. SERA Deliverable 26.1. Seismology and Earthquake Engineering Research Infrastructure Alliance for Europe.
Gamba, P. (2014) Global Exposure Database: Scientific Features, GEM Technical Report 2014-10 V1.0.0, 46 pp., GEM Foundation, Pavia, Italy, doi: 10.13117/GEM.EXP-MOD.TR2014.10.
Jaiswal, K. and Wald, D. (2008) Creating a global building inventory for earthquake loss assessment and risk management, U.S. Geological Survey Open-File Report-1160.
Jaiswal, K., Wald, D., and Porter, K. (2010) A Global Building Inventory for Earthquake Loss Estimation and Risk Management, Earthquake Spectra, 26(3), 731–748.

This project has received funding from the European Union’s Horizon 2020 research and innovation programme under grant agreement No. 700748
LIQUEFACT Deliverable D3.3
Design guidelines for the application of soil characterisation and liquefaction risk assessment protocols
v. 1.0
LIQUEFACT Project – EC GA no. 700748 16
Viana da Fonseca, A., Millen, M., Romão, X., Quintero, J., Rios, S., Ferreira, C., Panico, F., Azeredo, C., Pereira, N., Logar, J., Oblak, A., Dolšek, M., Kosič, M., Kuder, S., Logar, M., Oztoprak, S., Kelesoglu, M. K., Sargin, S., Oser, C., Bozbey, I., Flora, A., Billota, E., Prota, A., Di Ludovico, M., Chiaradonna, A., Modoni, G., Paolella, L., Spacagna, R., Lai, C.G., Shinde, S. and Bozzoni, F. (2018). Methodology for the liquefaction fragility analysis of critical structures and infrastructures: description and case studies. DELIVERABLE 3.2 of LIQUEFACT project “Assessment and mitigation of liquefaction potential across Europe: a holistic approach to protect structures / infrastructures for improved resilience to earthquake-induced liquefaction disasters” (www.liquefact.eu)
Millen, M., Ferreira, C., Quintero, J., Gerace, A. and Viana da Fonseca, A. (2019). Simplified equivalent soil profiles based on liquefaction performance. 7th International Conference on Earthquake Geotechnical Engineering. Rome, Italy.
Van Ballegooy, S., Wentz, F. and Boulanger Ross (2015). Evaluation of CPT-based Liquefaction Procedures at Regional Scale. Soil Dynamics and Earthquake Engineering.
WHE (2014) Housing Reports. World Housing Encyclopedia, available at http://db.world-housing.net/

This project has received funding from the European Union’s Horizon 2020 research and innovation programme under grant agreement No. 700748
LIQUEFACT Deliverable D3.3
Design guidelines for the application of soil characterisation and liquefaction risk assessment protocols
v. 1.0
LIQUEFACT Project – EC GA no. 700748 17
3. QUANTIFY THE SEISMIC HAZARD
Typically, hazard is defined in terms some ground motion intensity measure (IM) versus return period. The
choice of IM has a large impact on the level of uncertainty in the loss assessment (Luco and Cornell, 2007).
The recent study by Dashti and Karimi (2017) analysed the performance of different IMs on the liquefaction
hazard in the far-field and near shallow-founded structures, expressing liquefaction hazard in terms of peak
excess pore pressure ratio. The detailed study involved solid-fluid, fully-coupled, 3D nonlinear, dynamic finite
element simulations of structures founded on a layered soil profile, including a liquefiable layer, accounting
for the excess pore pressure redistribution and soil-structure interaction when evaluating the liquefaction
hazard and effects on structures. Results from this study indicate that the best IMs, in terms of efficiency,
sufficiency, and predictability, to estimate the peak excess pore pressure ratio are the spectral acceleration
at the fundamental period of the site (for far-field prediction), peak ground acceleration (for predictions at
the centre of a shallow foundation) and Arias Intensity (for predictions at the edge of a shallow foundation).
A companion study more focussed on estimating the performance of shallow-founded structures (Karimi and
Dashti, 2017) following the same detailed numerical approach concluded that IMs based on cumulative
absolute velocity (CAV) have significant potential to estimate some of the relevant response parameters.
However, even though such measures seem to have adequate characteristics in terms of efficiency,
sufficiency, and predictability for ground settlements, IMs based on spectral acceleration at a given period
still exhibit a better performance to represent structural response in terms of interstorey drifts (Karimi and
Dashti, 2017). Estimates of cumulative permanent settlements of structures are expected to be influenced
by the intensity, duration, and frequency content of the ground motion applied to the to the soil-structure
system, thus indicating they should correlate well with IMs such as CAV which is evolutionary with time. On
the other hand, peak values of interstorey drift in structures (which is not a cumulative demand parameter)
was, is expected to better correlate with IMs that quantify seismic intensity and frequency content, as
opposed to duration. As can be anticipated, this dichotomy casts several issues regarding the best approach
for ground motion selection in a situation where both types of response measures may be relevant.
Notwithstanding this issue, the selection of the most adequate IM for representing peak structural response
in situations where liquefaction or soil-structure interaction are not relevant is still an open debate.
Kostinakis et al. (2018) recently presented a review of several scalar IMs and concluded that no specific IM is
appropriate for all structures regardless of their features. Although they also address more advanced IMs,
such as those dedicated to the simulation of spatially distributed structures, they did not analyse a new
measure that is being increasingly used in regional risk assessments and that is planned to be used as one of
the IMs for the fragility/vulnerability models developed by the SERA project. This measure is the average
spectral acceleration, avgSa, defined as the mean of the log spectral accelerations at a set of periods of
interest (Kazantzi and Vamvatsikos, 2015):
1
1
1ln
N
i
i
avgSa Sa c TN
(3.1)

This project has received funding from the European Union’s Horizon 2020 research and innovation programme under grant agreement No. 700748
LIQUEFACT Deliverable D3.3
Design guidelines for the application of soil characterisation and liquefaction risk assessment protocols
v. 1.0
LIQUEFACT Project – EC GA no. 700748 18
where N is the number of periods used to compute avgSa and the ci terms are non‐negative values to
represent the range of selected periods as a function of the 1st mode period T1 (e.g. 0.2·T1 to 3·T1 with a
uniform period spacing of 0.01 s). This IM has been shown to be predicted with less uncertainty from the
ground motion prediction equation perspective, to be an efficient predictor of structural response and to be
sufficient with respect to ground motion properties affecting structural response (e.g. see (Eads et al., 2015,
Kazantzi and Vamvatsikos, 2015). Following the development of this IM, a conditional spectrum (CS) record
selection method based on avgSA was recently proposed (Kohrangi et al., 2018) that ensures an increased
efficiency and sufficiency in simultaneously estimating multiple structural response parameters using this IM.
Furthermore, recent research by Millen et al. (2019) presented a closed for solution for the cumulative
absolute strain energy (CASE) that was also showed to be an ideal candidate for assessing the triggering of
liquefaction. The closed form solution makes use of the nodal surface energy spectrum (NSES) and Millen et
al. (2019) proposes that the average of the NSES at the times corresponding to two times the shear wave
travel time from the surface would represent the optimal intensity measure for ground motion selection.
Unfortunately, no ground motion prediction equations exist for this parameter and therefore further
research is needed before it can be used for this purpose. However, the parameter scales to the power of
two as the amplitude scales, whereas intensity measures for superstructure damage (e.g. avSa) scale
proportional to amplitude. Therefore, scaling ground motions for superstructure damage causes a bias with
respect to the demand experienced by soil for liquefaction assessment.
Going back to the issue where estimates of both peak and cumulative demand parameters are required, it is
noted that the generalized conditional intensity measure (GCIM) approach proposed by Bradley (2010) could
be used to achieve a better correlation for cumulative demand parameters. The GCIM is a generalization of
the CS method for cases where non‐spectral ground motion IMs (e.g. record duration or Arias Intensity) are
important to the prediction of structural response. The focus of CS is on improving the sufficiency with
respect to spectral shape, while the GCIM enlarger this focus by seeking a sufficiency improvement with
respect to other ground motion characteristics that are relevant to the response.
REFERENCES
Bradley B.A. (2010) A generalized conditional intensity measure approach and holistic ground‐motion selection. Earthquake Engineering and Structural Dynamics; 39(12), 1321–1342.
Cornell C.A. and Krawinkler H (2000). Progress and challenges in seismic performance assessment, PEER Centre News 3(2):1-3.
Dashti, S. and Karimi, Z. (2017) Ground motion intensity measures to evaluate I: the liquefaction hazard in the vicinity of shallow-founded structures. Earthquake Spectra, 33(1), 241-276.
Eads, L., Miranda, E. and Lignos, D. G. (2015) Average spectral acceleration as an intensity measure for collapse risk assessment. Earthquake Engineering & Structural Dynamics, 44(12), 2057-2073.
Karimi, Z. and Dashti, S. (2017) Ground motion intensity measures to evaluate II: the performance of shallow-founded structures on liquefiable ground. Earthquake Spectra, 33(1), 277-298.
Kazantzi, A. K. and Vamvatsikos, D. (2015) Intensity measure selection for vulnerability studies of building classes. Earthquake Engineering & Structural Dynamics, 44(15), 2677-2694.

This project has received funding from the European Union’s Horizon 2020 research and innovation programme under grant agreement No. 700748
LIQUEFACT Deliverable D3.3
Design guidelines for the application of soil characterisation and liquefaction risk assessment protocols
v. 1.0
LIQUEFACT Project – EC GA no. 700748 19
Kohrangi, M., Bazzurro, P., Vamvatsikos, D. and Spillatura, A. (2018) Conditional spectrum based ground motion record selection using average spectral acceleration. Earthquake Engineering & Structural Dynamics, 47(1), 265-265.
Kostinakis, K., Fontara, I. K. and Athanatopoulou, A. M. (2018) Scalar structure-specific ground motion intensity measures for assessing the seismic performance of structures: a review. Journal of Earthquake Engineering, 22(4), 630-665.
Luco, N., and Cornell, C. A. (2007) Structure-specific scalar intensity measures for near-source and ordinary earthquake ground motions. Earthq Spectra 23:357–392
Millen, M., Ferreira, C., Quintero, J., Gerace, A. and Viana da Fonseca, A. (2019). Simplified equivalent soil profiles based on liquefaction performance. 7th International Conference on Earthquake Geotechnical Engineering. Rome, Italy.
4. ASSESSMENT OF VULNERABILITY

This project has received funding from the European Union’s Horizon 2020 research and innovation programme under grant agreement No. 700748
LIQUEFACT Deliverable D3.3
Design guidelines for the application of soil characterisation and liquefaction risk assessment protocols
v. 1.0
LIQUEFACT Project – EC GA no. 700748 20
4.1 THE EFFECTS OF LIQUEFACTION-INDUCED GROUND DEFORMATIONS ON
THE PERFORMANCE OF BUILDINGS
The LIQUEFACT D3.1 report by Viana da Fonseca et al. (2017) addressed the most influential liquefaction-
induced mechanisms relevant to the performance of buildings, including the initiation of liquefaction in the
free-field, the influence of the building on the initiation of liquefaction, the dynamic response of the soil, the
dynamic response of the structure and the structural damage mechanisms. The influence of liquefaction was
quantified into three aspects, permanent deformations, modification to seismic energy entering the building,
and modification to the soil-foundation impedance. The influence of all three aspects were directly tied to
the equivalent soil profile classification developed in Liquefact Deliverable 3.2 section 2.3 (Viana da Fonseca
et al., 2018), while the permanent deformation and in soil-foundation impedance are also strongly related to
the geometry, foundation and load of the building. The modification to ground surface acceleration due to
liquefaction is explored in section 2.7 (Viana da Fonseca et al., 2018), the influence on settlements and tilt is
explored in section 2.6 (Viana da Fonseca et al., 2018) and the influence on soil-foundation impedance is
discussed in section 2.2 (Viana da Fonseca et al., 2018).
The performance of a building is typically quantified in terms of collapse peak and residual inter-storey drift.
However, due to the significant damage at the foundation that can occur due to liquefaction, the foundation
tilt should also be considered as an additional performance parameter to capture the overall performance.
The foundation tilt can either be global tilt, difference in vertical displacement across the length of the
building divided by the length, or local foundation deformation, the vertical difference between two adjacent
footings divided by the distance between them. The magnitude and type of foundation deformation or tilting
depends the extent of liquefaction, spatial variability of the soil, asymmetric mass and stiffness of the
building, asymmetric loading from the ground motion and foundation type. Some of these parameters have
been explored in Deliverable 3.2 (Viana da Fonseca et al., 2018), while a more comprehensive study on the
parameters that influence tilt can be found in Bullock et al. (2018). The difference between global tilt and
local deformation is strongly governed by the building’s foundation type. In case of structures or
infrastructure facilities with shallow foundations, the distinction will be whether these are rigid or flexible.
Buildings resting on foundations that lack sufficient relative stiffness, compared to soft underlying soils, can
experience either differential movements (i.e. differential lateral spreading or differential vertical
settlements). In cases of buildings on flexible (i.e. unrestrained) foundations, columns and walls can move
independently (either under lateral spreading or vertical settlements), and thus differentially, and damage
occurs in the structural elements (Figure 4.1).

This project has received funding from the European Union’s Horizon 2020 research and innovation programme under grant agreement No. 700748
LIQUEFACT Deliverable D3.3
Design guidelines for the application of soil characterisation and liquefaction risk assessment protocols
v. 1.0
LIQUEFACT Project – EC GA no. 700748 21
(a) Rotational failure of columns (b) differential settlement at the centre of a multi-bay frame
Figure 4.1. Behaviour of frame buildings with flexible shallow foundations due to differential vertical ground settlements (Bird et al. 2006).
For rigid foundation systems, the deformation is primarily uniform settlement of structure (Figure 4.2a) or
global tilt (Figure 4.2b). The displacement is uniform and therefore does not results in damage to the
superstructure.
(a) (b)
Figure 4.2. (a) Liquefaction-induced uniform vertical settlements of building with stiff shallow foundations; (b) differential vertical settlements of building (rotation) with stiff shallow foundations (Bird et al. 2006).
The parameters used to quantify the performance of a building are highlighted in Figure 4.3, and were divided
into dynamic performance parameters and residual performance parameters. Dynamic performance
parameters involve the shear force in the beams (Vbeam) and columns (Vcolumn), the chord rotation in the beams
(θbeam) and columns (θcolumn) and the interstorey drift (θss,p). It is noted that, for columns, the exceedance of
limit values of shear force or ultimate chord rotation was considered collapse, while for beams, the
exceedance of limit values of shear force or ultimate chord rotation in a whole storey was considered
collapse. For the interstorey drift, damage states were defined for thresholds of 0.5%, 1%, 2% and 3%, and
above 3% while above 5% was considered collapse. Residual performance parameters involve maximum
residual interstorey drift θss,r and residual rotation of the foundation βf,r both at the local and global levels.

This project has received funding from the European Union’s Horizon 2020 research and innovation programme under grant agreement No. 700748
LIQUEFACT Deliverable D3.3
Design guidelines for the application of soil characterisation and liquefaction risk assessment protocols
v. 1.0
LIQUEFACT Project – EC GA no. 700748 22
Figure 4.3: Dynamic performance parameters and residual performance parameters used to quantify the performance of a building.
4.2 METHODS TO QUANTIFY VULNERABILITY
The vulnerability assessment process requires the building performance to be evaluated against hazard
intensity, typically with fragility curves or vulnerability curves. The hazard intensity is typical set using the
ground motion intensity measures previously discussed, and the performance is obtained by simulating the
building-soil system and calculating the performance criteria referred in the previous section (collapse, peak
local response, peak and residual interstorey drift, and foundation tilt). Building damage and performance
under liquefaction-induced ground deformations are a direct function of the properties of the structural
system but also of the type of foundation. With respect to the former, the exposure model and the BCIM are
expected to provide the necessary data for the simulations that need to be performed for a regional seismic
risk and loss assessment. However, for the latter, detailed information is not expected to be available and
will be very difficult to collect for a large portfolio of buildings. Therefore, assumptions need to be made and
an adequate model for the uncertainty of the foundation system needs to be added to the BCIM model
previously described. For a building-specific seismic risk and loss assessment, as referred before, it is
expected that adequate and detailed information about the necessary characteristics of the building,
including the foundation system, is available or can be obtained based on in situ surveys. Another viable
option is to perform a simulated design of the building based on the design codes at the date of construction,
this can be used to estimate unknown properties in the building as well as to size the foundation.
The assessment of vulnerability is directly tied to the classification used in the exposure model. The outlined
exposure model considers building-soil classes to implicitly capture the soil-structure interaction (SSI) effects
within the class. Compared to independent models of the soil and building that require some interaction
function to account for the influence of SSI and to account for the combination of shaking and liquefaction
induced damage. Since the building-soil system is part of a single class the system can be assessed either
directly through modelling the soil and the building in a single numerical or experimental model or in a

This project has received funding from the European Union’s Horizon 2020 research and innovation programme under grant agreement No. 700748
LIQUEFACT Deliverable D3.3
Design guidelines for the application of soil characterisation and liquefaction risk assessment protocols
v. 1.0
LIQUEFACT Project – EC GA no. 700748 23
modular approach where different macro-mechanisms are first quantified and then connected through
consideration of their interactions. The direct model is advantageous in that the interactions between all the
mechanisms are implicitly accounted for. However, it is practically impossible to capture experimentally a
detailed soil model and a detailed nonlinear structural model across a wide range of ground motions, even
with a centrifuge, due to scaling laws and costs of experiments. Numerically, a direct model is possible
although none of the widely used state-compatible constitutive models exist in any widely used software
that also contains suitable constitutive models for structural modelling. Therefore, a trade-off must be made
in reduced accuracy for the soil or structure. The direct approach is computationally demanding as stiff
structural elements often require a very small time step, while the large soil domain means there are many
elements to be assessed at each time step. Also, a direct approach does not benefit from generalising
behaviour, in that a change in one assumption would require the numerical model to be completely re-run.
In the case of embankments were the entire model is soil, then these drawbacks have a minimal impact, and
the procedure outlined for vulnerability assessment of embankments in Deliverable 3.2 (Viana da Fonseca et
al., 2018), successfully uses the direct modelling approach.
The alternative approach that was adopted for the performance of buildings was the macro-mechanism
approach. The macro-mechanism approach captures the macro behaviour of the soil profile and building
using submodels (e.g. pore pressure model, settlement model), and explicitly accounts for their interaction.
The main advantages of this approach are that it is numerical efficient, can include multiple different methods
at each modular step, can evaluate the uncertainties at each step. The full details of the macro-mechanism
approach is described and applied to a case study building in Part 2 of Deliverable 3.2 (Viana da Fonseca et
al., 2018).
4.3 DISCUSSION OF THE ROLE OF VULNERABILITY FUNCTIONS
In seismic risk and loss assessment studies, a vulnerability function is a mathematical model that expresses
building loss, often in terms of a ratio of cost of repair to cost of replacement, as a function of a ground
motion intensity measure (IM) that represents earthquake severity. Furthermore, this IM is usually selected
to be the same (or at least compatible) with the parameter that is used to represent earthquake hazard.
Traditionally, in seismic risk and loss assessment studies, analytical vulnerability functions (i.e. those based
on the numerical simulation of building models subjected earthquake loading) can be obtained using one of
two approaches (see Viana da Fonseca et al., 2017) for details and references cited therein). One of the
approaches involves the simulation of analytical fragility functions for multiple performance levels that are
then combined with consequence functions that express the expected level of loss for a given performance
level. However, currently, there is no consequence model explicitly accounting for liquefaction-induced
damage available in the literature. The second approach involves a procedure that derives storey-level
vulnerability functions. The vulnerability functions obtained by this approach express the repair cost of
components on a given storey as a function of storey-level demand (interstorey drift, peak floor acceleration,
or other measures of storey-level structural response). Although this approach was not originally developed
to account for liquefaction-induced losses, it was deemed easier to adapt it to include this additional loss
component. Nevertheless, it should be noted that adapting both approaches to account for liquefaction-

This project has received funding from the European Union’s Horizon 2020 research and innovation programme under grant agreement No. 700748
LIQUEFACT Deliverable D3.3
Design guidelines for the application of soil characterisation and liquefaction risk assessment protocols
v. 1.0
LIQUEFACT Project – EC GA no. 700748 24
induced losses involves a considerable level of uncertainty. Even though the building’s structural response
due to liquefaction-induced deformations can be quantified with an adequate level of reliability, determining
structural and non-structural performance, and consequently repair costs and losses, based on those
response parameters is still subjective and relies essentially on expert opinion due to insufficient data.
The procedure developed in LIQUEFACT D3.2 report is briefly outlined below in Figure 4.4. The first step is
the classification of the building-soil class. For the selected class either a single building and soil profile is
analysed, or if some of the parameters of the building or soil profile are unknown then a population of
representative buildings and soil profiles should be developed based on the selected building-soil class. The
macro-mechanism approach then considers a upward propagating ground motion and quantifies the time of
liquefaction (Step 2) and the modification due to liquefaction on the surface ground motion, soil-foundation
stiffness, and settlement (Steps 3-5 respectively). The results of steps 3-5 are used as inputs into the seismic
analysis of the building (Step 6), the process is repeated for different instances of the building-soil class and
for different ground motions and the performance is measured in terms of peak interstorey drift, residual
internstorey drift, foundation tilt, and collapse (Step 7). The results of step 7 are aggregated to develop
fragility curves (Step 8) which are then combined to compute the expected loss.
Figure 4.4: Application of the macro-mechanism approach to assess vulnerability and losses
REFERENCES
Bird, J.F., Bommer, J.J., Crowley, H. and Pinho, R. (2006) Modelling liquefaction-induced building damage in earthquake loss estimation. Soil Dynamics and Earthquake Engineering 26(1), 15–30.

This project has received funding from the European Union’s Horizon 2020 research and innovation programme under grant agreement No. 700748
LIQUEFACT Deliverable D3.3
Design guidelines for the application of soil characterisation and liquefaction risk assessment protocols
v. 1.0
LIQUEFACT Project – EC GA no. 700748 25
Bullock, Z., Dashti, S., Karimi, Z., Liel, A., Porter, K. and Franke, K. (2019). “Probabilistic Models for the Residual and Peak Transient Tilt of Mat-Founded Structures on Liquefiable Soils,” ASCE Journal of Geotechnical and GeoEnvironmental Engineering, 145(2).
Viana da Fonseca, A., Millen, M., Gómez-Martinez, F., Romão, X., Quintero, J., Gómez, F., Costa, P., Rios, S., Kosič, M., Dolšek, M., Logar, J., Oztoprak, S., Bozbey, I., Kelesoglu, K., Ozcep, F., Flora, A., Rasulo, A., Modoni, G. and Croce, P. (2017) State of the art review of numerical modelling strategies to simulate liquefaction-induced structural damage and of uncertain/random factors on the behaviour of liquefiable soils. DELIVERABLE 3.1 of LIQUEFACT project “Assessment and mitigation of liquefaction potential across Europe: a holistic approach to protect structures / infrastructures for improved resilience to earthquake-induced liquefaction disasters” (www.liquefact.eu)
Viana da Fonseca, A., Millen, M., Romão, X., Quintero, J., Rios, S., Ferreira, C., Panico, F., Azeredo, C., Pereira, N., Logar, J., Oblak, A., Dolšek, M., Kosič, M., Kuder, S., Logar, M., Oztoprak, S., Kelesoglu, M. K., Sargin, S., Oser, C., Bozbey, I., Flora, A., Billota, E., Prota, A., Di Ludovico, M., Chiaradonna, A., Modoni, G., Paolella, L., Spacagna, R., Lai, C.G., Shinde, S. and Bozzoni, F. (2018). Methodology for the liquefaction fragility analysis of critical structures and infrastructures: description and case studies. DELIVERABLE 3.2 of LIQUEFACT project “Assessment and mitigation of liquefaction potential across Europe: a holistic approach to protect structures / infrastructures for improved resilience to earthquake-induced liquefaction disasters” (www.liquefact.eu)

This project has received funding from the European Union’s Horizon 2020 research and innovation programme under grant agreement No. 700748
LIQUEFACT Deliverable D3.3
Design guidelines for the application of soil characterisation and liquefaction risk assessment protocols
v. 1.0
LIQUEFACT Project – EC GA no. 700748 26
5. COMPUTATION OF LOSSES
Typical seismic risk and loss assessment studies have been quantifying risk and losses according to the well
known Pacific Earthquake Engineering Research Centre (PEER) methodology or according to variations of this
approach that can be obtained by aggregating some of the steps (e.g. see Ramirez and Miranda (2009) for
additional background when a storey-based approach is used to define vulnerability functions). The PEER
methodology was developed to answer the need for communicating seismic risk to stakeholders involving
metrics that reflect seismic consequences and are different than the engineering terms usually adopted in
earthquake engineering. This methodology allows for the quantification, in probabilistic terms, of different
decision variables (DVs) such as monetary losses, repair time or number of fatalities. The basis of the PEER
methodology lies in the probabilistic characterization of several performance metrics along with the multiple
sources of uncertainty that are inherent to seismic assessment (e.g. the uncertainty about the hazard, the
ground motions representing a seismic scenario, the modelling and knowledge-based uncertainties of the
building components and properties). The PEER methodology can be summarized into the framing equation
representing the rate of a certain DV exceeding a value dv (Cornell and Krawinkler, 2000):
IM EDPDM
λ DV>dv = G DV|DM dG DM|EDP dG EDP|IM dλ IM (5.1)
where DM represents a damage measure, generally discretised into several damage states, EDP represents
measure of the structural response that can be correlated with DM, IM is a ground motion intensity measure
and G(∙) is the complementary cumulative distribution function. The numerical integration of Equation (5.1)
can be used to estimate the annual losses. A discrete solution of Equation (5.1) requires the quantification
of the expected loss value, E(L|IMi), for each ground motion intensity IMi, and, for the case where
liquefaction-induced damage is not accounted for, can be estimated from the proposal of Ramirez and
Miranda (2009), based on previous work by Aslani (2005):
| | , | | , |
| , |
i i i i i
i i
E L IM E L C R IM p C R IM E L C D IM p C D IM
E L C IM p C IM
(5.2)
where | ,i
E L C R IM , | ,i
E L C D IM and | ,i
E L C IM are the expected value of the losses for
IMi given that the structure is still reparable (without collapsing), the expected value of the losses for IMi
given that the structure is not reparable (without collapsing) and the expected value of the losses for IMi
given that the structure will collapse, respectively.
The event representing the case where the building did not collapse and is reparable C R corresponds to:

This project has received funding from the European Union’s Horizon 2020 research and innovation programme under grant agreement No. 700748
LIQUEFACT Deliverable D3.3
Design guidelines for the application of soil characterisation and liquefaction risk assessment protocols
v. 1.0
LIQUEFACT Project – EC GA no. 700748 27
max, max, max,1 1 1 1,
,
max, , max1 11,
1 1 max 1
max 1 max 1 max
m columns m columns n storeys
j j j
j j jj j i j m beams
n storeys n storeys
ss p j ssj
j ss pi ij m beams
C RV V
V V
,
, max1
1
n storeys
r j
ss ri
(5.3)
and represents the occurrence of damage states where the interstorey drift θss,p reaches thresholds θss,c of
0.5%, 1%, 2% and 3%. Therefore:
, ,1,
| max |i ss p j ss c ij n storeys
p C R pIM IM
(5.4)
However, the probabilities of having a reparable (R) and an irreparable (D) building without collapsing,
|i
p C R IM and |i
p C D IM , respectively, can be calculated by factorizing the corresponding
probability of demolition | ,i
p D C IM by the probability of collapse, |i
p C IM .
Finally, the expected value of the losses for a given ground motion intensity IMi can be quantified considering
a relative quantity, the loss ratio, defined by the ratio between the obtained losses and the cost of replacing
the structure. This implies that the loss ratio is 1.0 when the structure is considered irreparable or when
structural collapse is observed, and Equation (5.2) becomes:
| | , 1 | , 1 |
| , 1 | |
i i i i
i i i
E L IM E L C R IM p D C IM p C IM
p D C IM p C IM p C IM
(5.5)
If a loss ratio larger than 1.0 needs to be considered for the case where the structure is considered
irreparable, Equation (5.5) can be defined instead by:
| | , 1 | , 1 |
| , 1 | |
i i i i
i i i
E L IM E L C R IM p D C IM p C IM
p D C IM p C IM p C IMDRC
(5.6)
where factor DRC now represents the ratio between the demolition and reconstruction cost as a function of
the cost of constructing a new building.
In order to account for damage scenarios involving a combined building-foundation damage state, the event
corresponding to the case where the building did not collapse and is reparable C R is now considered to
involve the occurrence of a given building damage level and a given foundation damage level. Therefore,
Equation (5.3) now becomes:

This project has received funding from the European Union’s Horizon 2020 research and innovation programme under grant agreement No. 700748
LIQUEFACT Deliverable D3.3
Design guidelines for the application of soil characterisation and liquefaction risk assessment protocols
v. 1.0
LIQUEFACT Project – EC GA no. 700748 28
max, max, max,1 1 1 1,
,
max, , max1 11,
1 1 max 1
max 1 max 1 max
m columns m columns n storeys
j j j
j j jj j i j m beams
n storeys n storeys
ss p j ssj
j ss pi ij m beams
C RV V
V V
,
, max ,1 1
1 1
n storeys k foundations
r j f j
ss r f ri i
(5.7)
where βf is the rotation of the foundation and β f,r is the residual rotation of the foundation. Consequently,
Equation (5.4) becomes:
, , ,1, 1,
| max | max |i ss p j ss c i f j f c ij n storeys j n foundations
p C R p pIM IM IM
(5.8)
by assuming that the occurrence of a given building damage level and a given foundation damage level
defined by a certain threshold βf,c are independent (though not entirely true, as a strong motion would
typically damage the building and results in large settlement, see discussion in intensity measures in Section
3 above). For this combined building-foundation damage state, the expected value of the losses given that
the structure is still reparable (without collapsing) | ,i
E L C R IM was considered to be defined by:
,| , |i i ss p fE L C R IM p C R IM L (5.9)
where the loss factor ,ss p fL is defined by:
, , ,1, 1,, min | max , | max , ,ss p j ss c i f j f c ij n storeys j n foundationsss p f E L IM E L IML DRC
(5.10)
which amounts to saying that the expected value of the losses for a combined building-foundation damage
state is the sum of the expected losses from the reparable building damage with the expected losses from
the foundation damage, but always less than or equal to the demolition and reconstruction cost (represented
by the factor DCR), since they are assumed independent, factored by the probability of occurrence of the
combined damage state. It noted that the value of Equation (5.9) obtained by evaluating all the relevant
building damage levels and foundation damage levels and summing the values obtained for the damage state
combinations. Following these changes to account for damage scenarios involving a combined building-
foundation damage state, the expected value of the losses for a given ground motion intensity IMi can be
quantified according to Equation (5.6).
Quantifying the expected value of the losses for a given ground motion intensity IMi according to Equation
(5.6) requires the calculation of | ,i
p D C IM , |i
p C IM and | ip C R IM defined by Equation (5.8).
These quantities are directly obtained based on the statistical post-processing of the results of nonlinear
dynamic analyses of the structure (e.g. using counted data or by fitting fragility curves for each damage state).
This project has received funding from the European Union’s Horizon 2020 research and innovation programme under grant agreement No. 700748
LIQUEFACT Deliverable D3.3
Design guidelines for the application of soil characterisation and liquefaction risk assessment protocols
v. 1.0
LIQUEFACT Project – EC GA no. 700748 29
On the other hand, the terms , ,1,| max
ss p j ss cj n storeysL
and ,1,
| maxf j f cj n foundations
L
require the
definition of loss curves; the former a loss curve defining the expected loss for increasing levels of interstorey
drift and the former a loss curve defining the expected loss for increasing levels of foundation rotation. While
loss curves defining the expected loss for increasing levels of interstorey drift can be obtained based on
expected component loss levels (e.g. see (Ramirez and Miranda, 2009) and more recently (Papadopoulos et
al., 2018)), no approach has been defined so far to define loss curves defining the expected loss for increasing
levels of foundation rotation. Furthermore, there is limited information available on foundation repair costs
and the possibility of repairing the building foundations is also significantly dependent on the market.
Therefore, for the purpose of the research presented herein, it has been assumed here that the market is
willing to accept a repair cost of 30% of the total cost of the building, and that repair techniques would be
available to meet the market demand.
5.1. LOSS CALCULATION EXAMPLE CASE STUDY
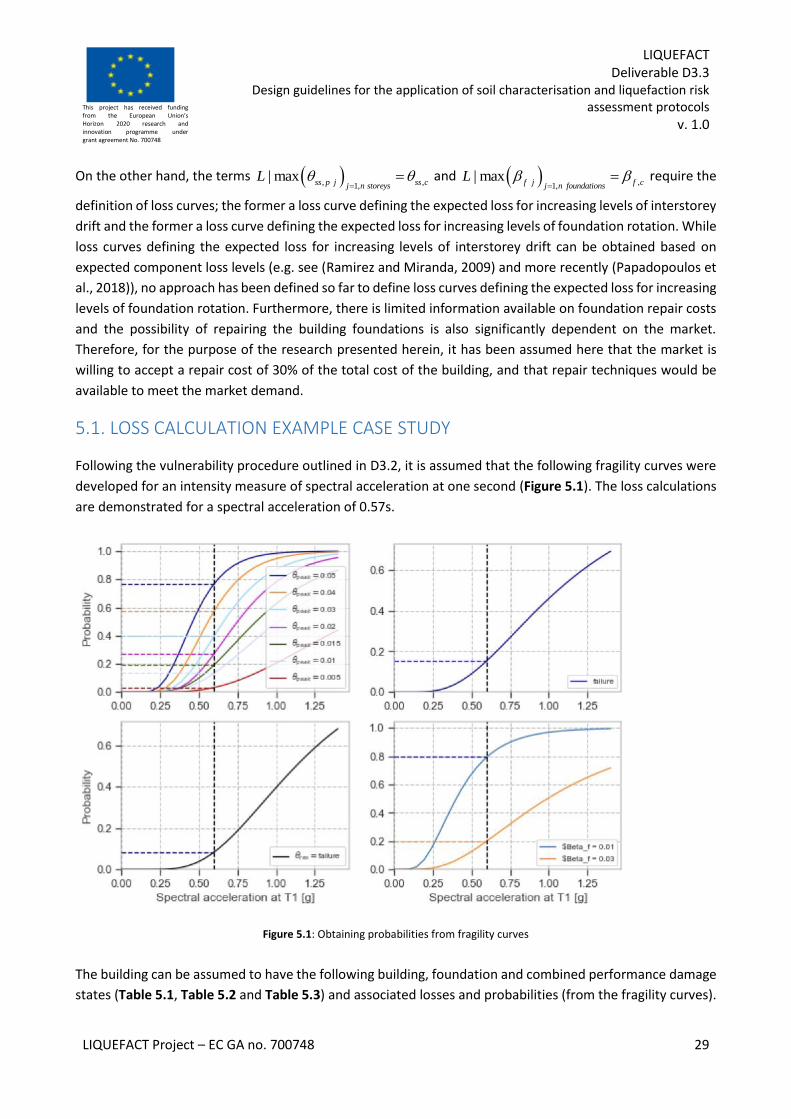
Following the vulnerability procedure outlined in D3.2, it is assumed that the following fragility curves were
developed for an intensity measure of spectral acceleration at one second (Figure 5.1). The loss calculations
are demonstrated for a spectral acceleration of 0.57s.
Figure 5.1: Obtaining probabilities from fragility curves
The building can be assumed to have the following building, foundation and combined performance damage
states (Table 5.1, Table 5.2 and Table 5.3) and associated losses and probabilities (from the fragility curves).

This project has received funding from the European Union’s Horizon 2020 research and innovation programme under grant agreement No. 700748
LIQUEFACT Deliverable D3.3
Design guidelines for the application of soil characterisation and liquefaction risk assessment protocols
v. 1.0
LIQUEFACT Project – EC GA no. 700748 30
The building losses are based on tables of losses vs peak drift for different number of storeys, building types
and building uses from research by Ramirez, C. M., & Miranda, E. (2009). However, in the original research
the drift was de-aggregated into drift sensitive and floor acceleration sensitive components. If no floor
acceleration data is available then the floor acceleration sensitive data will be merged with the non-structural
drift sensitive components. The merge floor ensures that the sum of losses equals 1 at drift of 5%.
In this example values are taken from page B-20 of Ramirez, C. M., & Miranda, E. (2009) and no floor
accelerations were considered so values are merged.
Table 5.1: Building damage states and associated losses and probabilities
Damage state Loss % Probability
BD_DS1 0 0.1
BD_DS2 0.1 0.15
BD_DS3 0.2 0.15
BD_DS4 0.35 0.1
BD_DS5 0.5 0.1
BD_DS6 0.7 0.1
BD_DS7 0.9 0.15
BD_DS8 1.0 0.15
Total 1
Table 5.2: Foundation damage states and associated losses and probabilities
Damage state Loss % Probability
FD_DS1 0 0.4
FD_DS2 0.3 0.3
FD_DS3 1.0 0.3
Total 1
Table 5.3: Combine performance damage states and associated losses and probabilities

This project has received funding from the European Union’s Horizon 2020 research and innovation programme under grant agreement No. 700748
LIQUEFACT Deliverable D3.3
Design guidelines for the application of soil characterisation and liquefaction risk assessment protocols
v. 1.0
LIQUEFACT Project – EC GA no. 700748 31
Damage state Loss % Probability
Residual drift limit
100 0.7
Collapse 100 0.4
The combine damage for each of the building-foundation damage states is produced in Table 5.4(Equation
(5.11)), ensuring that the sum of the damage does not exceed the demolition and replace cost (Ldemo), in
this case it is set to 1.0.
𝐿 [𝐷𝑆𝐼𝐷𝑅𝑖∩ 𝐷𝑆𝐹𝐷𝑗
] = min (𝐿[𝐷𝑆𝐼𝐷𝑅𝑖] + 𝐿 [𝐷𝑆𝐹𝐷𝑗
] , 𝐿𝑑𝑒𝑚𝑜) (5.11)
Table 5.4: Combined building foundation damage states
FD_DS1 FD_DS2 FD_DS2
BD_DS1 0 0.3 1
BD_DS2 0.1 0.4 1
BD_DS3 0.2 0.5 1
BD_DS4 0.35 0.65 1
BD_DS5 0.5 0.8 1
BD_DS6 0.7 1 1
BD_DS7 0.9 1 1
BD_DS8 1 1 1
The probability of each building-foundation damage state is computed in Table 5.5 (Equation (5.12)).
𝑃 [𝐷𝑆𝐼𝐷𝑅𝑖∩ 𝐷𝑆𝐹𝐷𝑗
] = 𝑃[𝐷𝑆𝐼𝐷𝑅𝑖] ∙ 𝑃 [𝐷𝑆𝐹𝐷𝑗
] (5.12)
Table 5.5: Probabilities of each building-foundation damage state
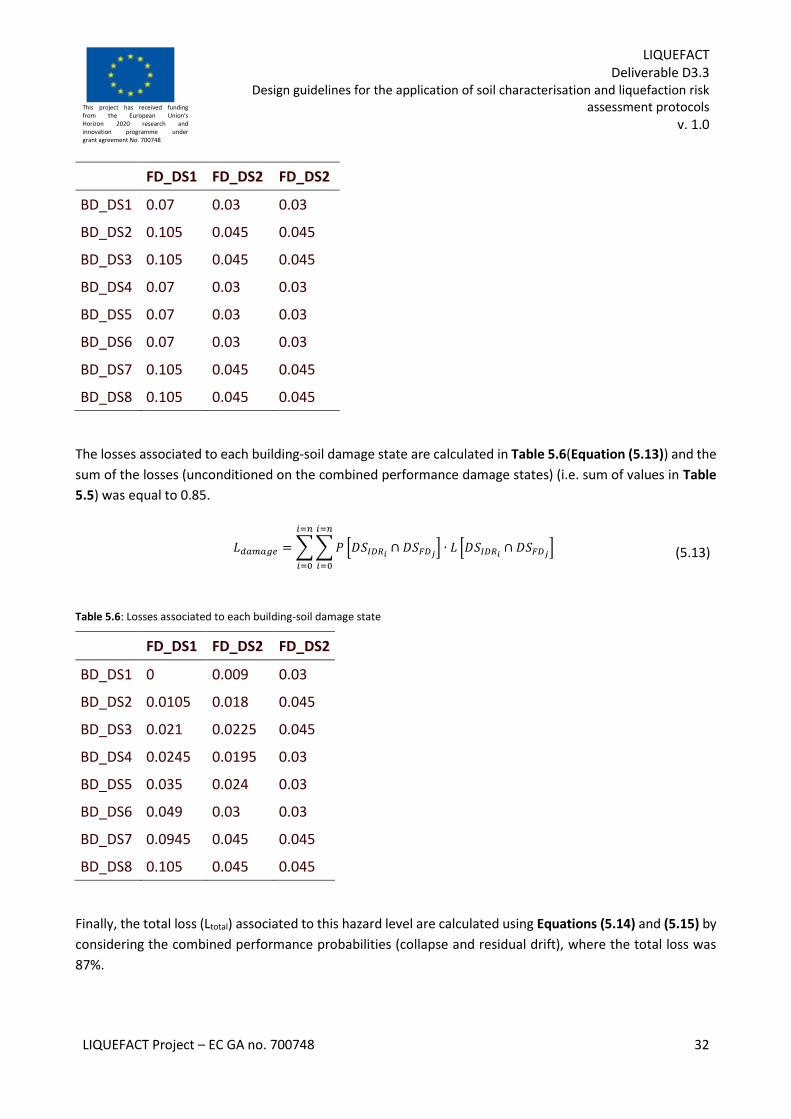
This project has received funding from the European Union’s Horizon 2020 research and innovation programme under grant agreement No. 700748
LIQUEFACT Deliverable D3.3
Design guidelines for the application of soil characterisation and liquefaction risk assessment protocols
v. 1.0
LIQUEFACT Project – EC GA no. 700748 32
FD_DS1 FD_DS2 FD_DS2
BD_DS1 0.07 0.03 0.03
BD_DS2 0.105 0.045 0.045
BD_DS3 0.105 0.045 0.045
BD_DS4 0.07 0.03 0.03
BD_DS5 0.07 0.03 0.03
BD_DS6 0.07 0.03 0.03
BD_DS7 0.105 0.045 0.045
BD_DS8 0.105 0.045 0.045
The losses associated to each building-soil damage state are calculated in Table 5.6(Equation (5.13)) and the
sum of the losses (unconditioned on the combined performance damage states) (i.e. sum of values in Table
5.5) was equal to 0.85.
𝐿𝑑𝑎𝑚𝑎𝑔𝑒 = ∑ ∑ 𝑃 [𝐷𝑆𝐼𝐷𝑅𝑖∩ 𝐷𝑆𝐹𝐷𝑗
] ∙ 𝐿 [𝐷𝑆𝐼𝐷𝑅𝑖∩ 𝐷𝑆𝐹𝐷𝑗
]
𝑖=𝑛
𝑖=0
𝑖=𝑛
𝑖=0
(5.13)
Table 5.6: Losses associated to each building-soil damage state
FD_DS1 FD_DS2 FD_DS2
BD_DS1 0 0.009 0.03
BD_DS2 0.0105 0.018 0.045
BD_DS3 0.021 0.0225 0.045
BD_DS4 0.0245 0.0195 0.03
BD_DS5 0.035 0.024 0.03
BD_DS6 0.049 0.03 0.03
BD_DS7 0.0945 0.045 0.045
BD_DS8 0.105 0.045 0.045
Finally, the total loss (Ltotal) associated to this hazard level are calculated using Equations (5.14) and (5.15) by
considering the combined performance probabilities (collapse and residual drift), where the total loss was
87%.

This project has received funding from the European Union’s Horizon 2020 research and innovation programme under grant agreement No. 700748
LIQUEFACT Deliverable D3.3
Design guidelines for the application of soil characterisation and liquefaction risk assessment protocols
v. 1.0
LIQUEFACT Project – EC GA no. 700748 33
𝐿𝑡𝑜𝑡𝑎𝑙 = 𝐿𝑑𝑎𝑚𝑎𝑔𝑒(1 − 𝑃𝑑𝑒𝑚𝑜)(1 − 𝑃𝑐𝑜𝑙𝑙𝑎𝑝𝑠𝑒) + 𝐿𝑑𝑒𝑚𝑜𝑃𝑑𝑒𝑚𝑜(1 − 𝑃𝑐𝑜𝑙𝑙𝑎𝑝𝑠𝑒) + 𝐿𝑐𝑜𝑙𝑙𝑎𝑝𝑠𝑒𝑃𝑐𝑜𝑙𝑙𝑎𝑝𝑠𝑒 (5.14)
𝐿𝑡𝑜𝑡𝑎𝑙 = 0.85(1 − 0.07)(1 − 0.04) + 1.0 ∙ 0.07(1 − 0.04) + 1.0 ∙ 0.04 = 0.87 (5.15)
REFERENCES
Aslani, H. (2005) Probabilistic earthquake loss estimation and loss disaggregation in buildings. PhD Dissertation. Stanford University.
Cornell C.A. and Krawinkler H (2000). Progress and challenges in seismic performance assessment, PEER Centre News 3(2):1-3.
Papadopoulos, A. N., Vamvatsikos, D. and Kazantzi, A. K. (2018) Development and application of FEMA P-58 compatible story loss functions. Earthquake Spectra, doi: /10.1193/102417EQS222M.
Ramirez, C. and Miranda, E. (2009) Building-specific loss estimation methods and tools for simplified performance based earthquake engineering. Report Nº 171. John A. Blume earthquake engineering research center. Stanford University. Stanford, California, USA.

This project has received funding from the European Union’s Horizon 2020 research and innovation programme under grant agreement No. 700748
LIQUEFACT Deliverable D3.1
State of the art review of numerical modelling strategies to simulate liquefaction-induced structural damage and of uncertain/random factors on the
behaviour of liquefiable soils v. 1.0
LIQUEFACT Project – EC GA no. 700748 34
6. FINAL REMARKS
This report provided an overview of the key steps for assessing the risk of infrastructures that are exposed
to liquefaction. Key aspects related to the definition of exposure models in a situation where liquefaction
effects may be relevant was discussed and an equivalent soil profile scheme for classifying liquefaction
susceptibility was analysed. This classification scheme should then be combined with existing infrastructure
taxonomies for the purpose of developing a combined exposure model accounting for liquefaction
susceptibility. Other important aspects relevant to the topic of ground motion selection for earthquake loss
assessment were discussed, namely addressing the issues around multiple ground motion intensities
measures in soil-liquefaction-foundation-structure interaction problems. Given the differences in the
relevant intensity measures depending on the type of damage under consideration (structural damage is
typically best correlated to peak energy based intensity measures, while liquefaction is more strongly
correlated to cumulative energy-based intensity measures), an approach that would be able to account for
the information associated to both types of intensity measures was also discussed. Finally, reference is made
to the novel procedure presented for the calculation of losses accounting for liquefaction-induced ground
deformations that is based on a state-of-the-art approach for calculating infrastructure losses probabilistic
seismic loss assessment. The information that is needed to implement such procedure is discussed,
highlighting current limitations of available data and a case study loss example calculation is presented that
demonstrates the applicability of the procedure.