delivering bi through microsoft office system 2007 rafal lukawiecki strategic consultant, project...
Post on 21-Dec-2015
222 views
TRANSCRIPT
Delivering BI Through Microsoft Office System 2007Rafal LukawieckiStrategic Consultant, Project Botticelli [email protected]
2
Objectives
• Understand how knowledge workers interact with a BI system
• Review Excel, Visio, and Sharepoint/PerformancePoint Server
This seminar is based on a number of sources including a few dozen of Microsoft-owned presentations, used with permission. Thank you to Marin Bezic, Kathy Sabourin, Aydin Gencler, Bryan Bredehoeft, and Chris Dial for all the support. Thank you to Maciej Pilecki for assistance with demos.
The information herein is for informational purposes only and represents the opinions and views of Project Botticelli and/or Rafal Lukawiecki. The material presented is not certain and may vary based on several factors. Microsoft makes no warranties, express, implied or statutory, as to the information in this presentation.
Portions © 2009 Project Botticelli Ltd & entire material © 2009 Microsoft Corp. Some slides contain quotations from copyrighted materials by other authors, as individually attributed or as already covered by Microsoft Copyright ownerships. All rights reserved. Microsoft, Windows, Windows Vista and other product names are or may be registered trademarks and/or trademarks in the U.S. and/or other countries. The information herein is for informational purposes only and represents the current view of Project Botticelli Ltd as of the date of this presentation. Because Project Botticelli & Microsoft must respond to changing market conditions, it should not be interpreted to be a commitment on the part of Microsoft, and Microsoft and Project Botticelli cannot guarantee the accuracy of any information provided after the date of this presentation. Project Botticelli makes no warranties, express, implied or statutory, as to the information in this presentation. E&OE.
3
Excel 2007
4
Excel + Excel Services
• Excel• Ad-hoc analytics• New BI features:
• Deep Analysis Services integration• Data Mining
• Excel Services• Part of MOSS 2007• A ‘real’ server product – security, perf, scale• Scenarios
• One version of the truth• BI• Server based calculations
5
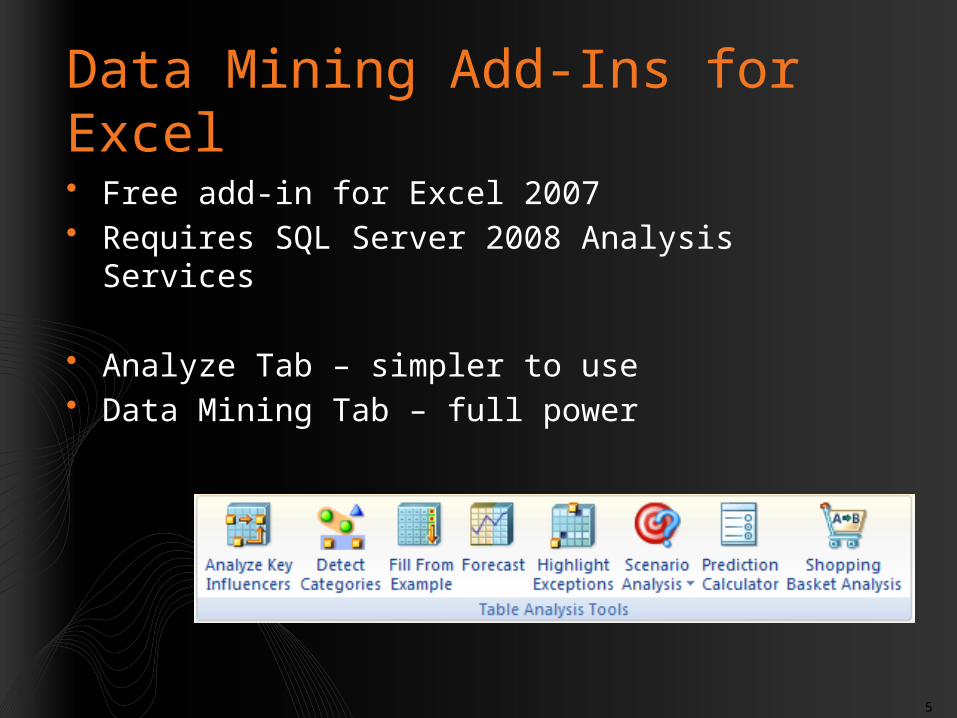
Data Mining Add-Ins for Excel
• Free add-in for Excel 2007• Requires SQL Server 2008 Analysis Services
• Analyze Tab – simpler to use• Data Mining Tab – full power
6
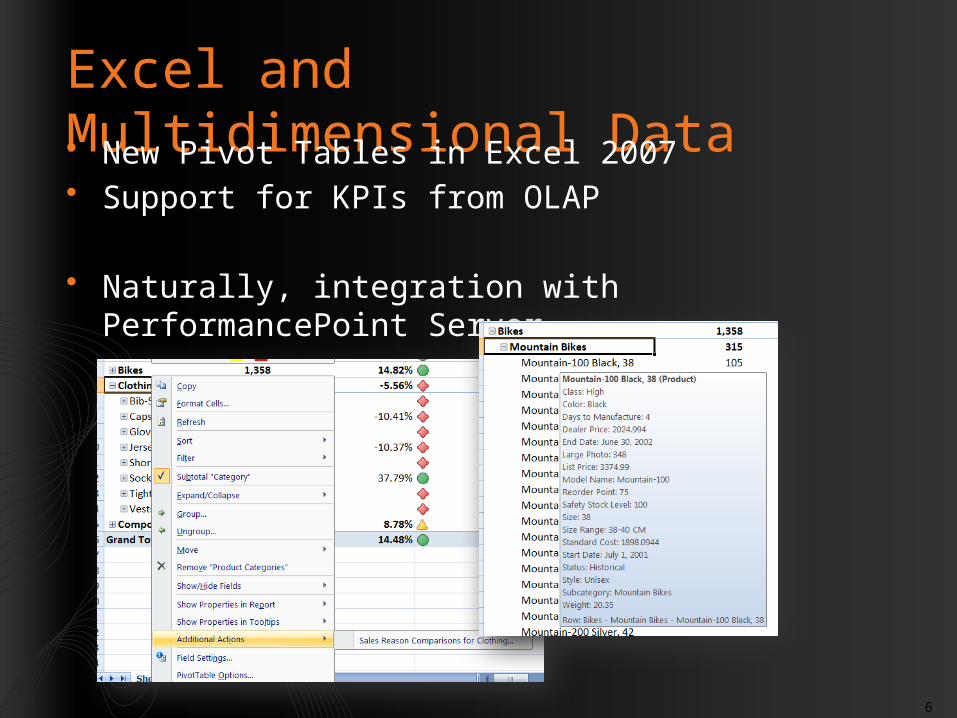
Excel and Multidimensional Data• New Pivot Tables in Excel 2007• Support for KPIs from OLAP
• Naturally, integration with PerformancePoint Server
7
1. Pivot Reports for Multidimensional Analysis2. Market Basket Analysis3. Finding Outliers with Data Mining
Demo
8
SharePoint Performance Services
9
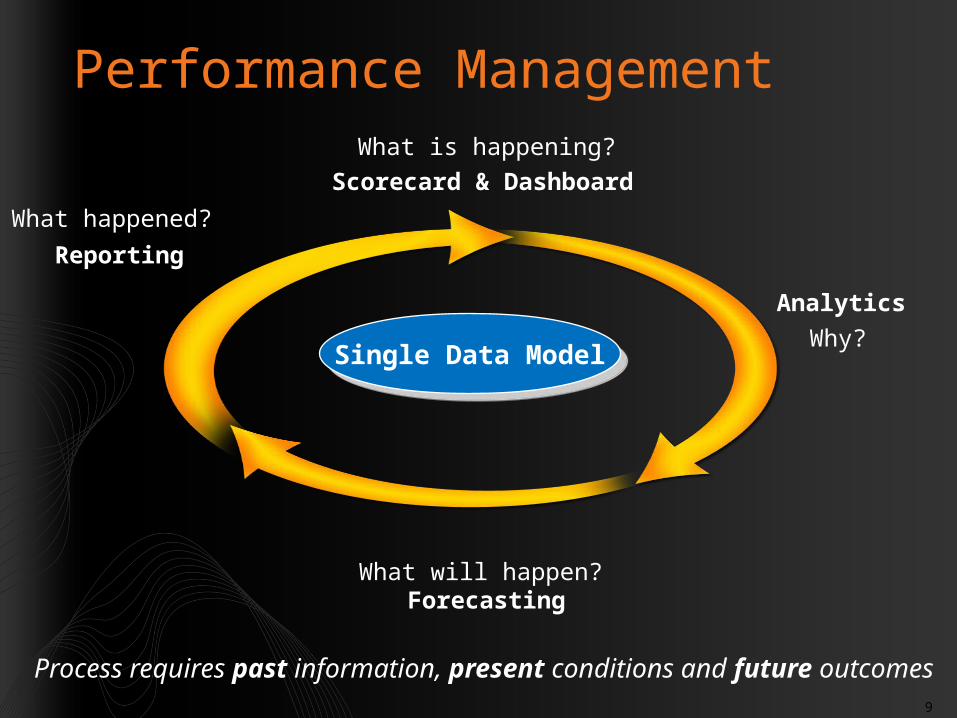
Single Data ModelSingle Data Model
Performance Management
ForecastingWhat will happen?
Process requires past information, present conditions and future outcomes
Reporting
What happened?
Scorecard & Dashboard
What is happening?
Analytics
Why?
10
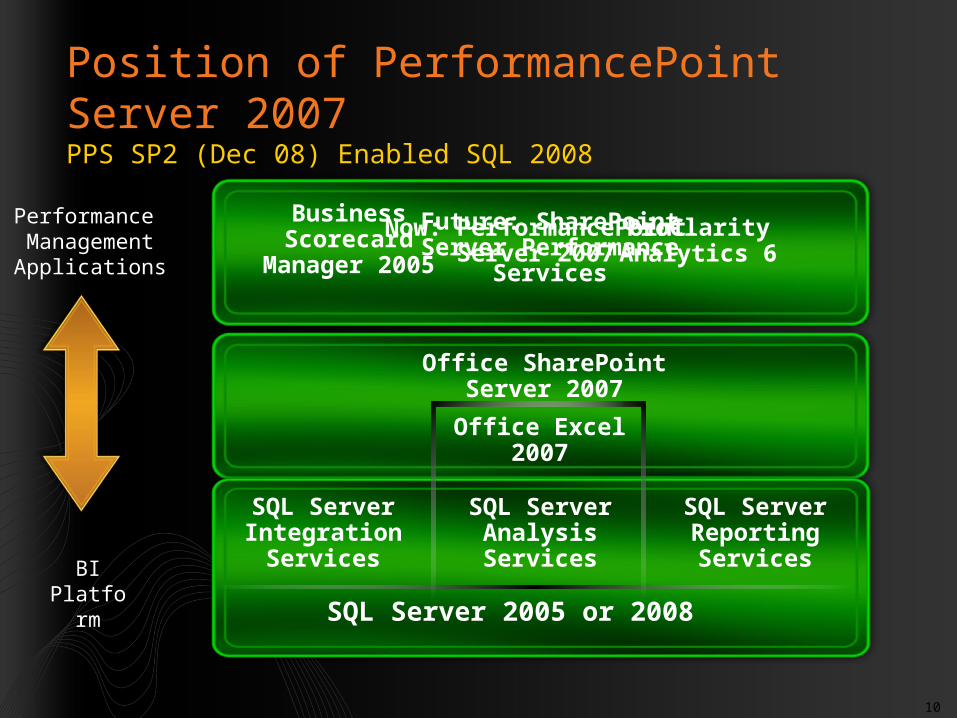
Office SharePoint Server 2007
SQL Server 2005 or 2008
SQL Server Integration
Services
SQL Server Reporting ServicesBI
Platform
Performance ManagementApplications
Position of PerformancePoint Server 2007PPS SP2 (Dec 08) Enabled SQL 2008
SQL Server Analysis Services
Office Excel 2007
Business Scorecard
Manager 2005
ProClarity Analytics 6
Now: PerformancePoint
Server 2007
Future: SharePoint Server Performance
Services
11
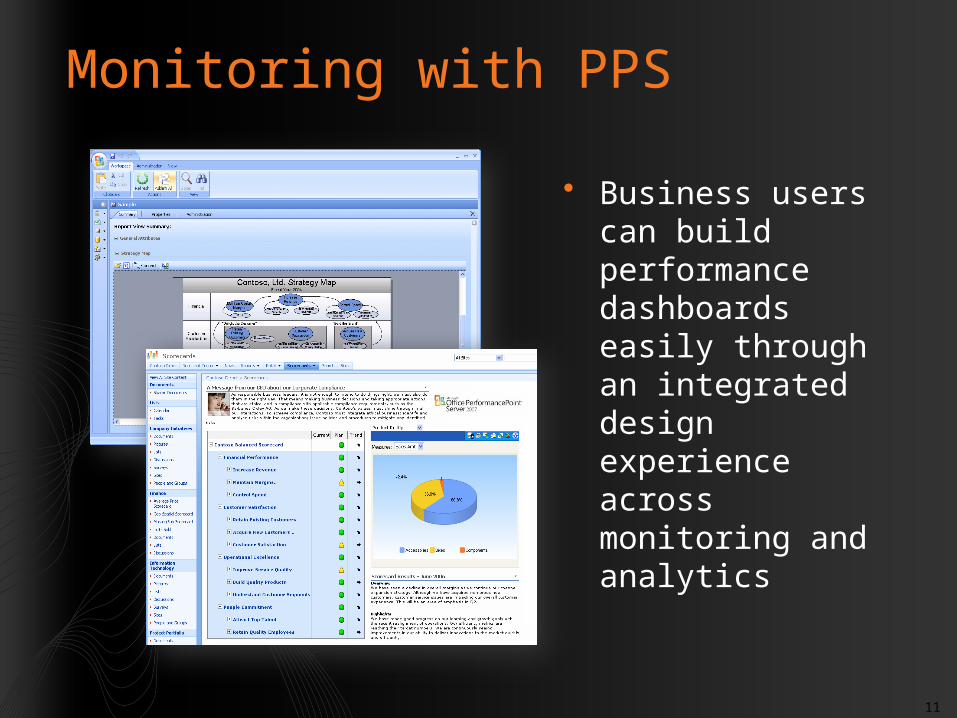
Monitoring with PPS
• Business users can build performance dashboards easily through an integrated design experience across monitoring and analytics
12
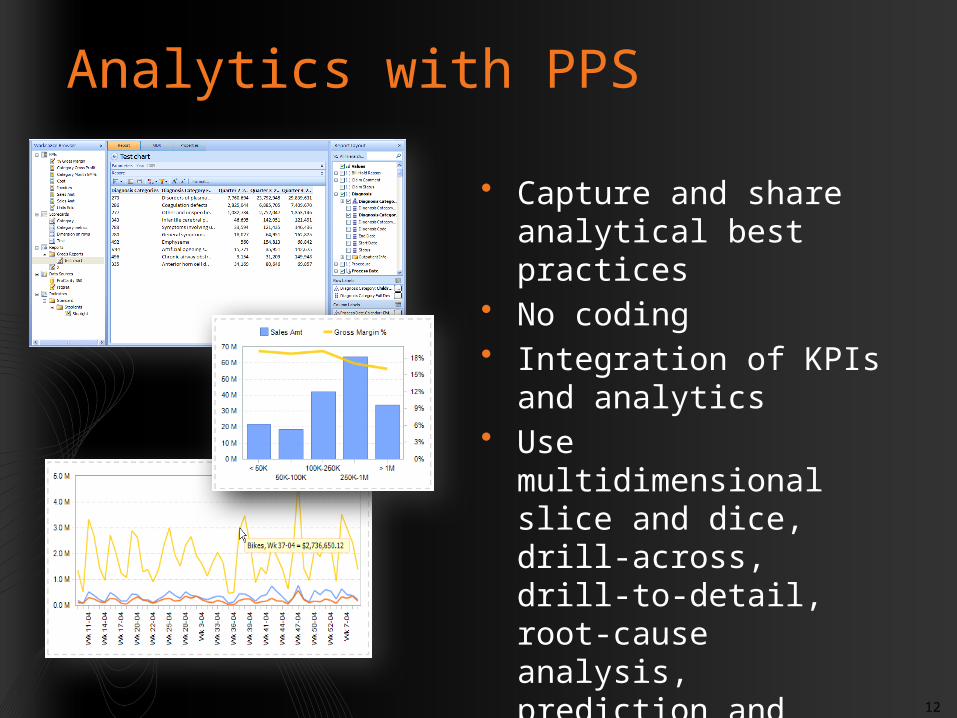
Analytics with PPS
• Capture and share analytical best practices
• No coding• Integration of KPIs and
analytics• Use multidimensional
slice and dice, drill-across, drill-to-detail, root-cause analysis, prediction and centralized business logic definitions
13
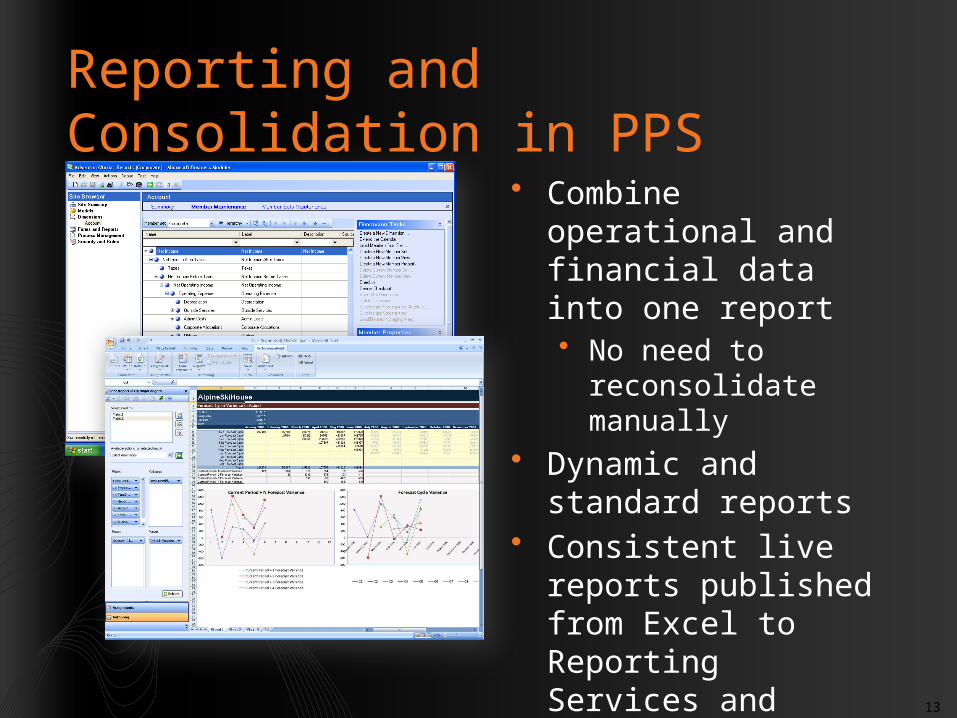
Reporting and Consolidation in PPS
• Combine operational and financial data into one report• No need to
reconsolidate manually
• Dynamic and standard reports
• Consistent live reports published from Excel to Reporting Services and Microsoft Office Server
14
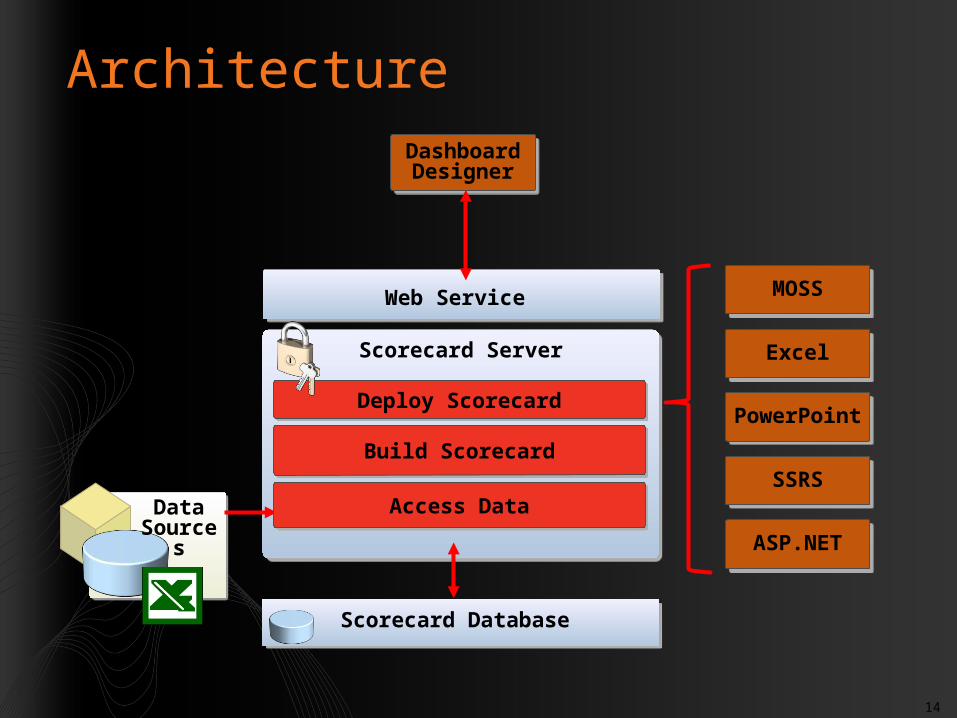
Architecture
DataSources
Scorecard Server
Deploy ScorecardDeploy Scorecard
Web Service
DashboardDesigner
DashboardDesigner
MOSSMOSS
Build ScorecardBuild Scorecard
Scorecard Database
Access DataAccess Data
ExcelExcel
PowerPointPowerPoint
SSRSSSRS
ASP.NETASP.NET
15
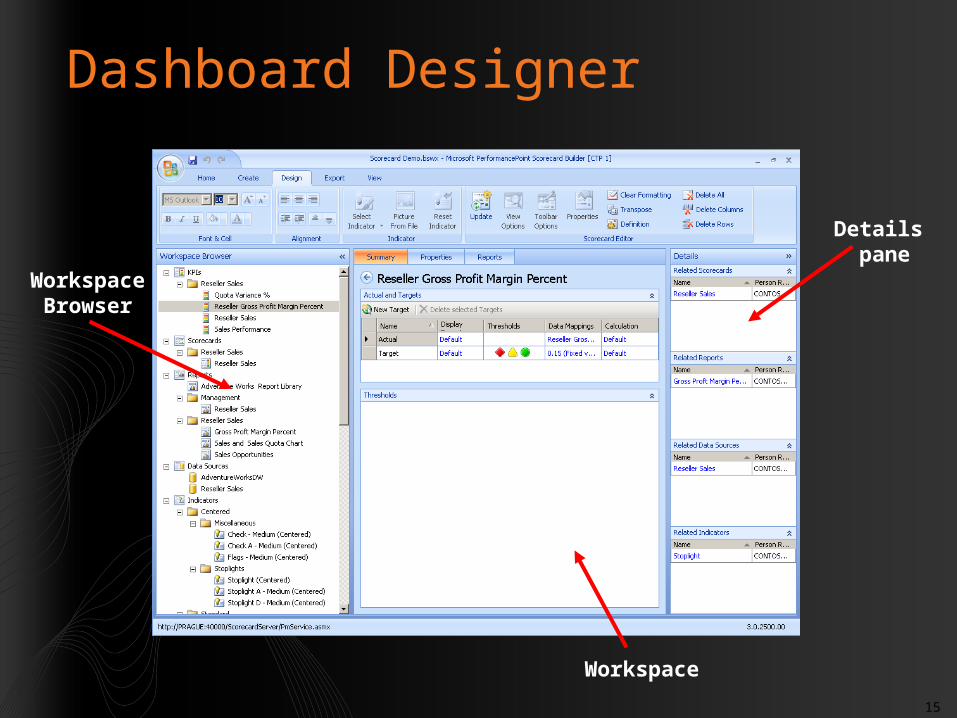
Dashboard Designer
Details pane
WorkspaceBrowser
Workspace
16
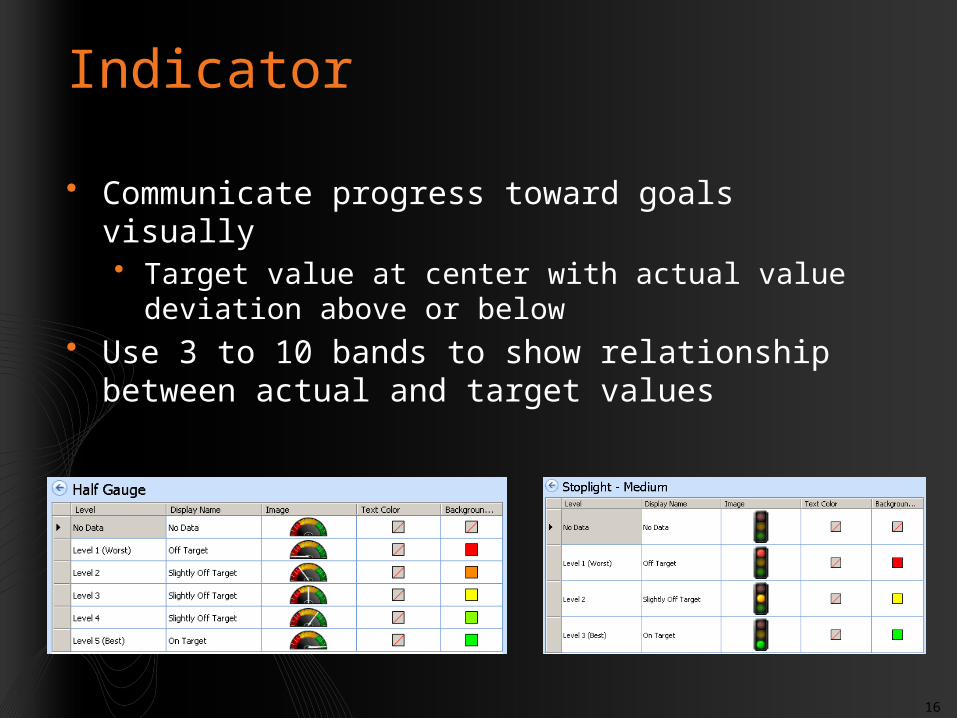
Indicator
• Communicate progress toward goals visually• Target value at center with actual value deviation
above or below• Use 3 to 10 bands to show relationship between
actual and target values
17
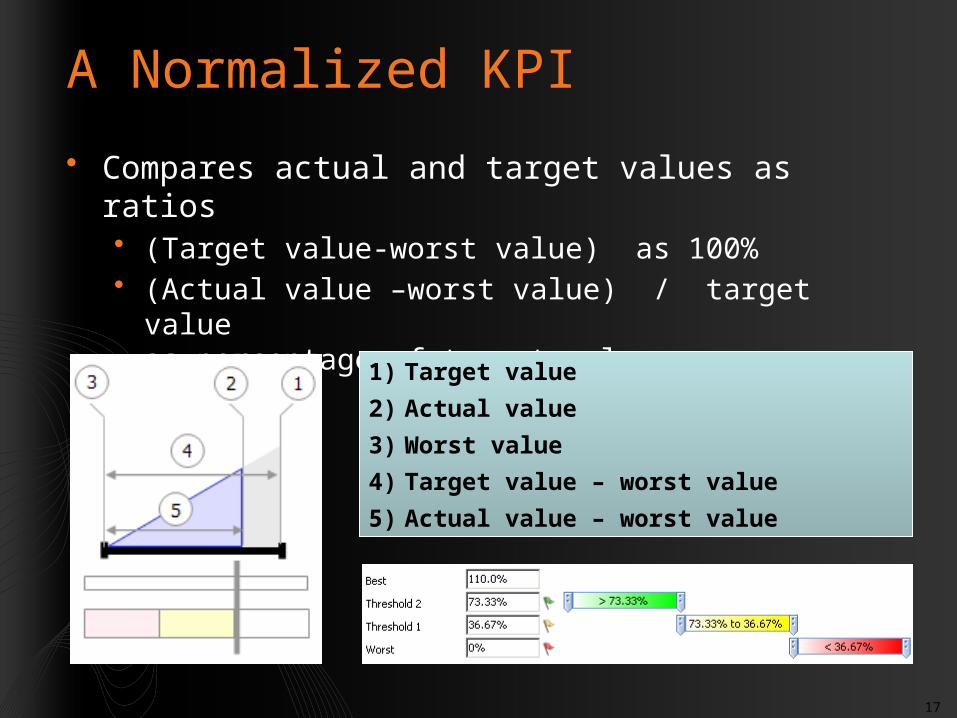
A Normalized KPI
• Compares actual and target values as ratios• (Target value-worst value) as 100%• (Actual value –worst value) / target value
as percentage of target value
1) Target value
2) Actual value
3) Worst value
4) Target value – worst value
5) Actual value – worst value
18
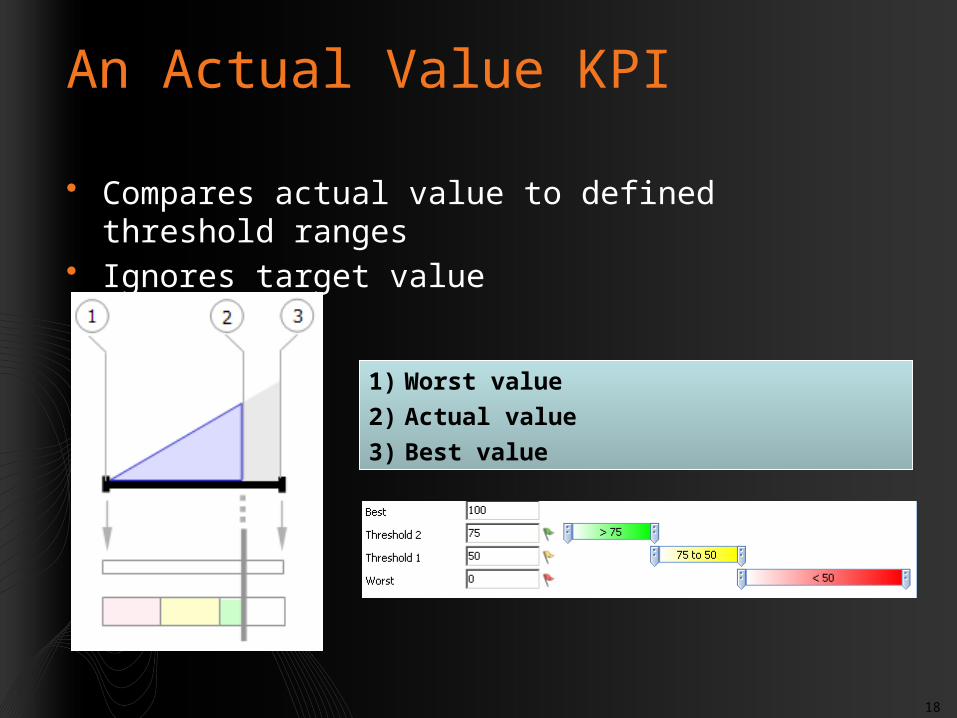
An Actual Value KPI
• Compares actual value to defined threshold ranges
• Ignores target value
1) Worst value
2) Actual value
3) Best value
19
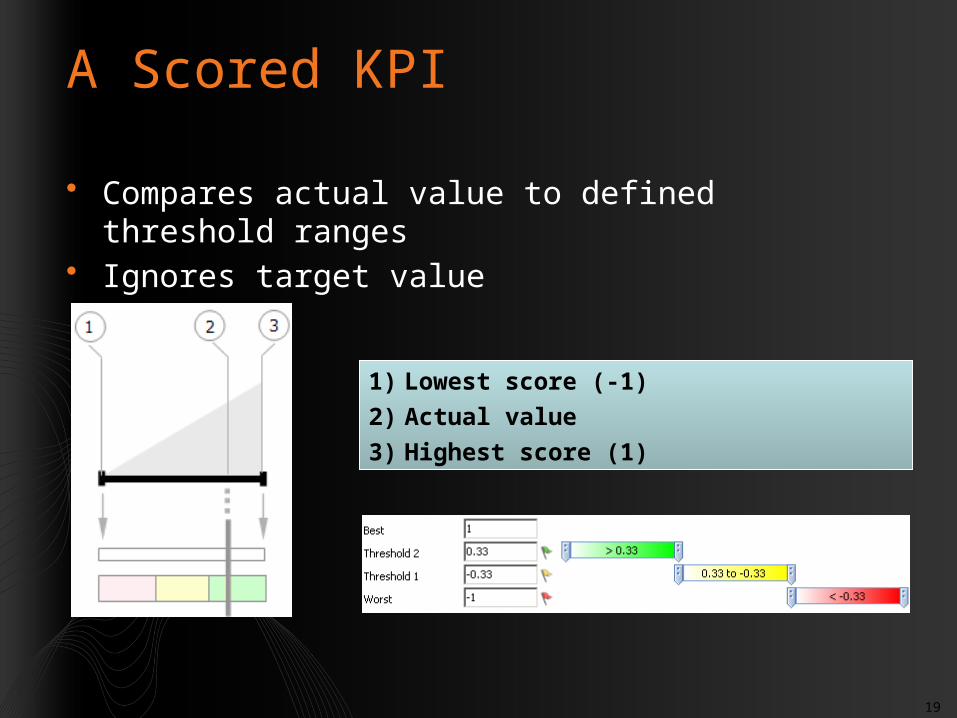
A Scored KPI
• Compares actual value to defined threshold ranges
• Ignores target value
1) Lowest score (-1)
2) Actual value
3) Highest score (1)
20
Developing a Dashboard
• Choose a dashboard layout• Assign elements to a dashboard zone• Add filters• Preview the dashboard• Deploy to SharePoint
21
Building a Dashboard, Scorecard, and a KPI Using PerformancePoint Server
Demo
22
Visualising BI with Microsoft Visio
23
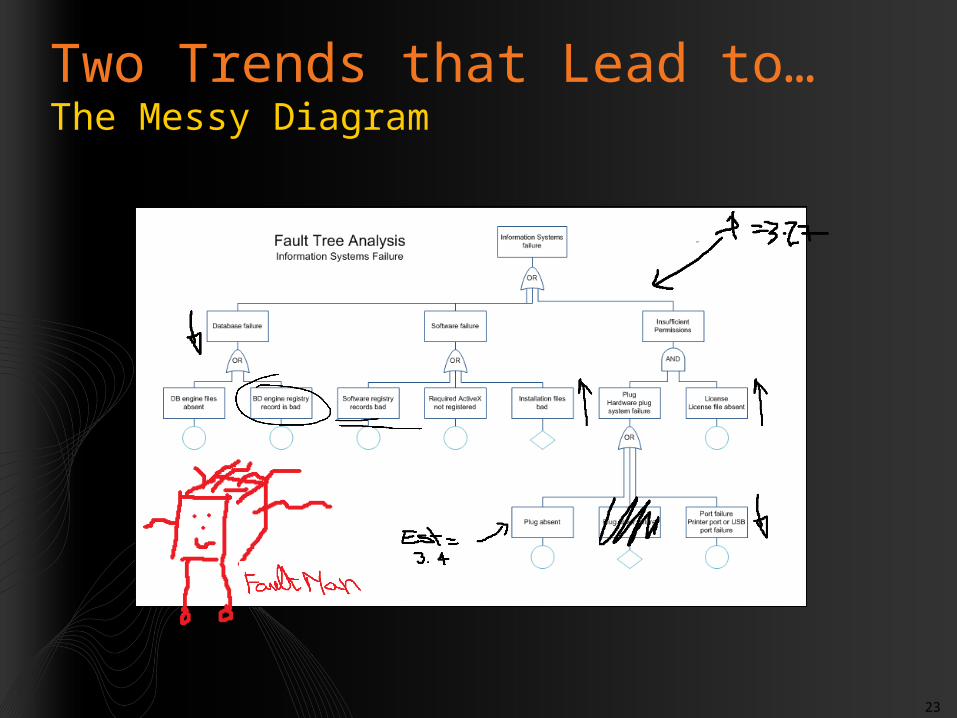
Two Trends that Lead to…The Messy Diagram
24
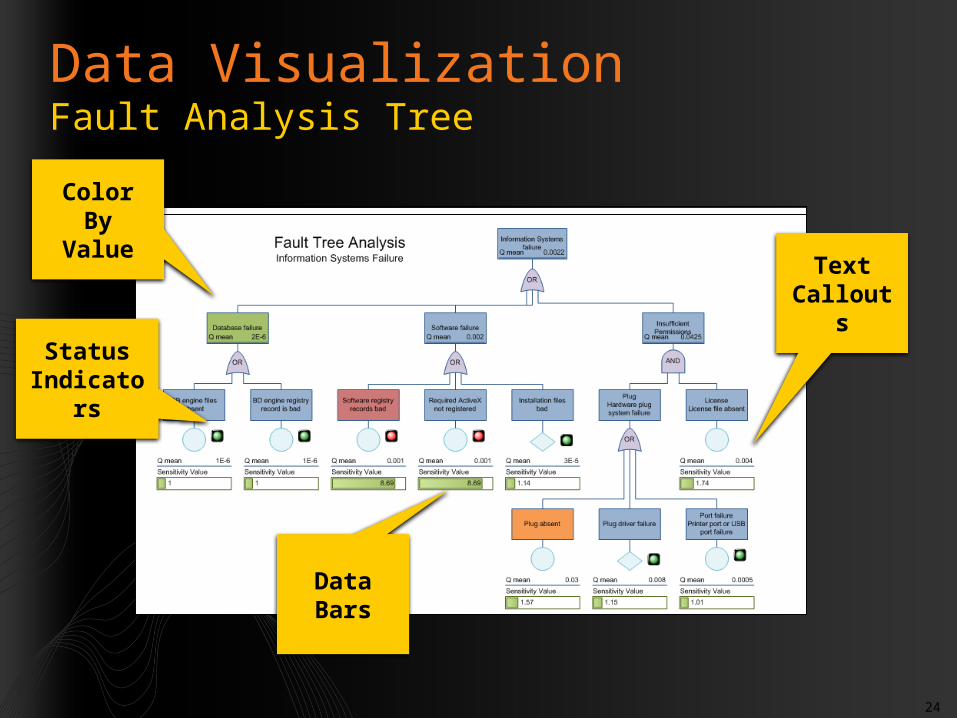
Data VisualizationFault Analysis Tree
Status Indicator
s
Color By Value
Text Callouts
Data Bars
25
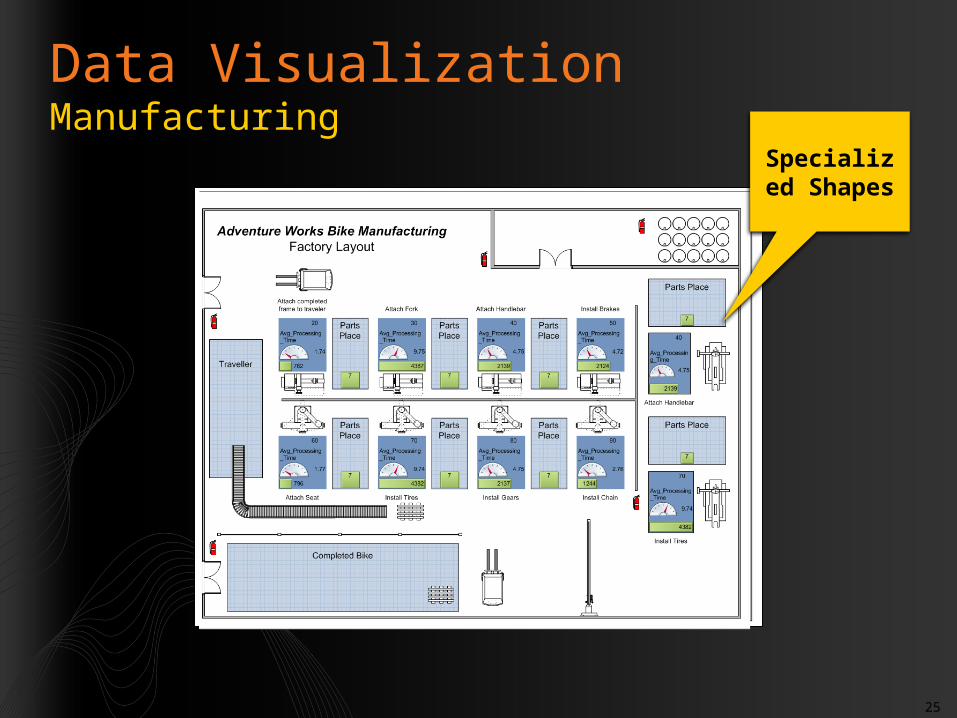
Data VisualizationManufacturing
Specialized Shapes
26
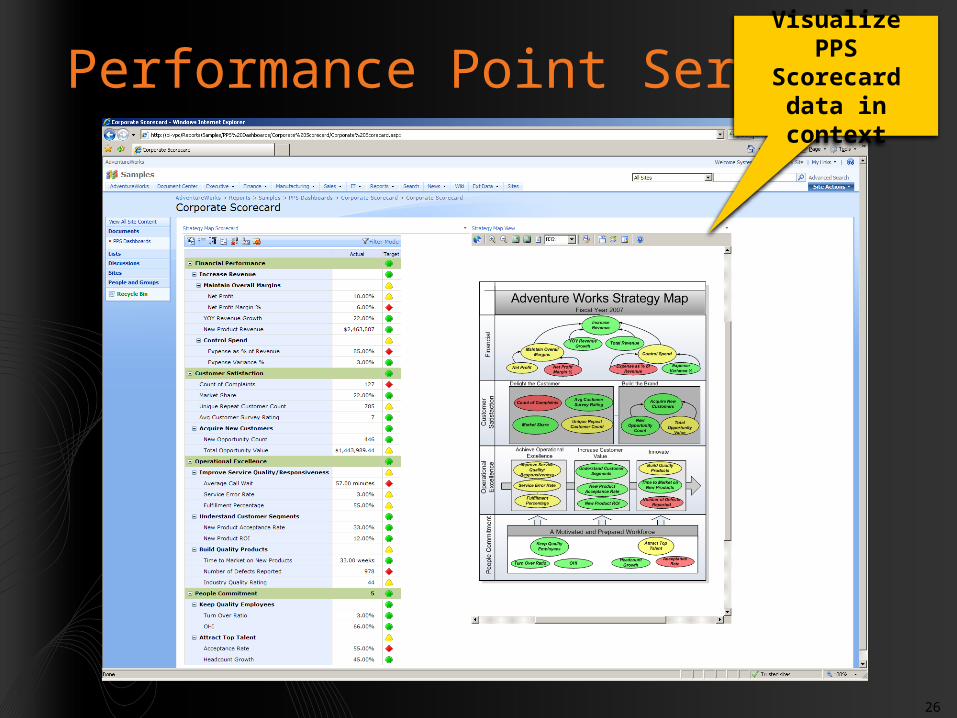
Performance Point ServerVisualize
PPS Scorecard
data in context

27
Conclusions
28
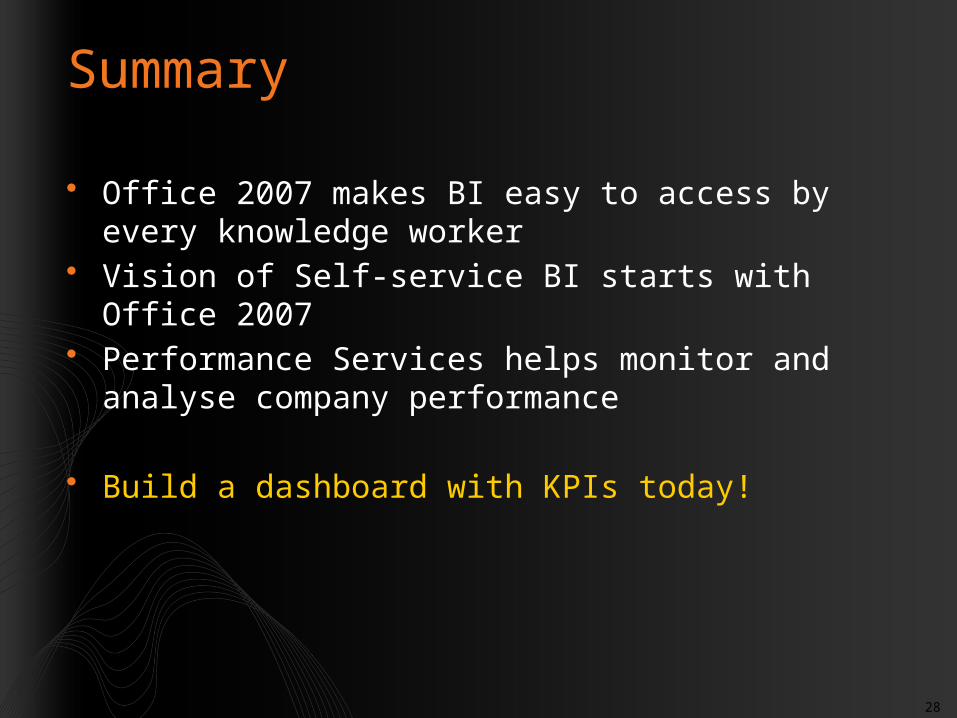
Summary
• Office 2007 makes BI easy to access by every knowledge worker
• Vision of Self-service BI starts with Office 2007• Performance Services helps monitor and analyse
company performance
• Build a dashboard with KPIs today!
29
© 2009 Microsoft Corporation & Project Botticelli Ltd. All rights reserved.
The information herein is for informational purposes only and represents the opinions and views of Project Botticelli and/or Rafal Lukawiecki. The material presented is not certain and may vary based on several factors. Microsoft makes no warranties, express, implied or statutory, as to the information in this presentation.
Portions © 2009 Project Botticelli Ltd & entire material © 2009 Microsoft Corp. Some slides contain quotations from copyrighted materials by other authors, as individually attributed or as already covered by Microsoft Copyright ownerships. All rights reserved. Microsoft, Windows, Windows Vista and other product names are or may be registered trademarks and/or trademarks in the U.S. and/or other countries. The information herein is for informational purposes only and represents the current view of Project Botticelli Ltd as of the date of this presentation. Because Project Botticelli & Microsoft must respond to changing market conditions, it should not be interpreted to be a commitment on the part of Microsoft, and Microsoft and Project Botticelli cannot guarantee the accuracy of any information provided after the date of this presentation. Project Botticelli makes no warranties, express, implied or statutory, as to the information in this presentation. E&OE.