delivering disciplined...
TRANSCRIPT

DeliveringDelivering Disciplined Growth
Bank of America Merrill Lynch 16th
Annual Canada Mining Conference
Toronto, ONSeptember 9-10, 2010

Cautionary Statement on Forward‐Looking Information
All statements, other than statements of historical fact, contained or incorporated by reference in this presentation, including any information as to the future financial or operatingperformance of Kinross, constitute “forward‐looking information” or “forward‐looking statements” within the meaning of certain securities laws, including the provisions of the Securities Act(Ontario) and the provisions for “safe harbour” under the United States Private Securities Litigation Reform Act of 1995 and are based on reviewed harbour expectations, estimates andprojections as of the date of this presentation. Forward‐looking statements include, without limitation, possible events, opportunities, statements with respect to possible events oropportunities, the future price of gold and silver, the estimation of mineral reserves and resources and the realization of such estimates, the timing and amount and costs of estimated future
d ti t d it l dit d l t d i i ti iti itti ti li fl t ti i t f dditi l it l t l tiproduction, expected capital expenditures, development and mining activities, permitting time lines, currency fluctuations, requirements for additional capital, government regulation,environmental risks, unanticipated reclamation expenses, title disputes or claims. The words “plan”, “expects”, “does not expect”, “is expected”, “budget”, “scheduled”, “estimates”,“forecasts”, “targets”, “opportunity”, “intends”, “anticipates”, “does not anticipate”, or “believes”, or variations of such words and phrases or statements that certain actions, events or results“may”, “could”, “would”, “should”, “might”, or “will be taken”, “occur”, or “be achieved” and similar expressions identify forward‐looking statements. Forward‐looking statements arenecessarily based upon a number of estimates and assumptions that, while considered reasonable by Kinross as of the date of such statements, are inherently subject to significant business,economic and competitive uncertainties and contingencies. The estimates and assumptions of Kinross contained in this presentation, which may prove to be incorrect, include, but are notlimited to, the various assumptions set forth herein, as well as: (1) that Kinross will complete the proposed business combination transaction with Red Back in accordance with the terms andconditions of the arrangement agreement (the “Arrangement”); (2) the accuracy of management’s assessment of the effects of the successful completion of the Arrangement; (3) the accuracyg g ( g ) ( ) y g p g ( ) yof Kinross and Red Back’s mineral reserve and mineral resource estimates; (4) that Kinross will complete the acquisition of the Dvoinoye deposit; (5) that production at the Dvoinoye deposit willcommence in 2013, consistent with management’s expectations; (6) that production at each of the Cerro Casale, Fruta del Norte and Lobo Marte properties will commence in 2014, consistentwith management’s expectations; (7) the accuracy of management’s assessments of the growth of gold resources and gold production in West Africa; (8) the viability of the Tasiast and Chiranomines, and the development and expansion of Tasiast and Chirano mines on a basis consistent with Kinross and Red Back’s current expectations; and (9) the viability of Red Back’s explorationproperties and permitting the development and expansion of such properties on a basis consistent with Kinross and Red Back’s current expectations. Statements representing management’sfinancial and other outlook have been prepared solely for purposes of expressing their current views regarding the Company’s financial and other outlook and may not be appropriate for anyother purpose. Many of these uncertainties and contingencies can affect, and could cause, Kinross’ actual results to differ materially from those expressed or implied in any forward‐lookingstatement made by or on behalf of Kinross There can be no assurance that forward looking statements will prove to be accurate as actual results and future events could differ materiallystatement made by, or on behalf of, Kinross. There can be no assurance that forward looking statements will prove to be accurate, as actual results and future events could differ materiallyfrom those anticipated in such statements. All of the forward‐looking statements made in this presentation are qualified by these cautionary statements and those made in our filings with thesecurities regulators of Canada and the U.S., including but not limited to those cautionary statements made in the “Risk Factors” section of our most recently filed Annual Information Form, the“Risk Analysis” section of our most recently filed Management’s Discussion and Analysis, in the “Statements Regarding Forward‐Looking Information “ and “Risk Factors” sections of ourManagement Information Circular dated August 16, 2010 and mailed to Kinross shareholders in connection with the Arrangement, and the “Cautionary Statement on Forward‐LookingInformation” in our news release regarding the Arrangement dated August 2, 2010, to which readers are referred and which are incorporated by reference in this presentation, and all of whichqualify any and all forward‐looking statements made in this presentation. These factors are not intended to represent a complete list of the factors that could affect Kinross or the Arrangementor the combined company resulting therefrom. Kinross disclaims any intention or obligation to update or revise any forward‐looking statements or to explain any material difference betweensubsequent actual events and such forward‐looking statements, except to the extent required by applicable law.
Other information
Where we say “we”, “us”, “our”, the “Company”, or “Kinross” in this presentation, we mean Kinross Gold Corporation and/or one or more or all of its subsidiaries, as may be applicable. Wherewe say Red Back in this presentation, we mean Red Back Mining Inc. and/or one or more or all of its subsidiaries, as may be applicable.
The technical information about the Company’s mineral properties contained in this presentation has been prepared under the supervision of Mr. Rob Henderson, an officer of the Companywho is a “qualified person” within the meaning of National Instrument 43‐101.
This presentation does not constitute an offer of any securities for sale
2
This presentation does not constitute an offer of any securities for sale.

Kinross’ EvolutionKinross
Tomorrow
Next wave of growth through project developmentKinross Today
• 8 operating mines• Focus in core regions• $937.2 mm cash flow (‘09)
2011 ‐ 2012• 3rd ball mill at Paracatu• Maricunga ExpansionKinross
• Non‐operated JVs• Various geographies
$937.2 mm cash flow ( 09)• ~$695 mm cash on hand*• $12.0 bn market cap• Margin: $530/oz. (‘09)• Proven track record
• Dvoinoye2013 – 2015+
• Tasiast Expansion**• Lobo‐Marte
Yesterday
• $154 mm cash flow (’04)• $54 mm cash on hand• $2.4 bn market cap• Margin : $161/oz. (‘04)
Proven track record• Investment strategy
Lobo‐Marte• Fruta del Norte• Cerro Casale• White Gold
3*As at June 30, 2010.** Subject to the completion of the Kinross‐Red Back combination announced August 2, 2010
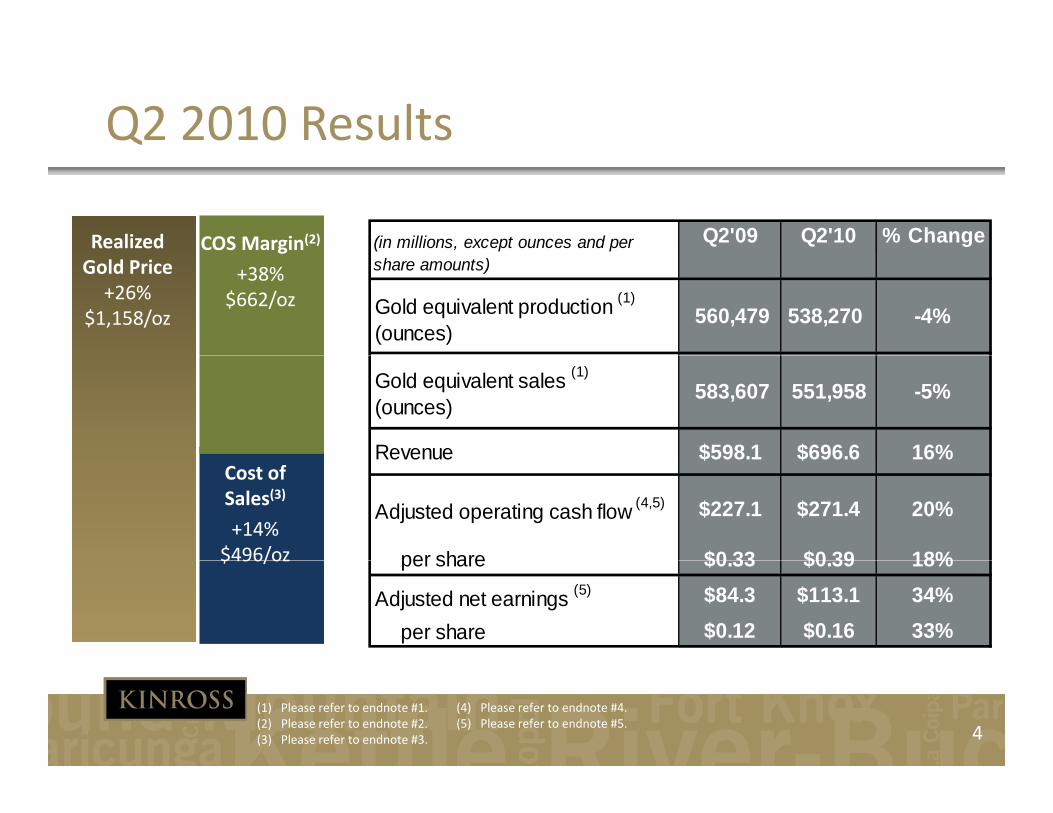
Q2 2010 Results
Realized COS Margin(2) (in millions, except ounces and per Q2'09 Q2'10 % ChangeGold Price+26%
$1,158/oz
g
+38%$662/oz
share amounts)
Gold equivalent production (1)
(ounces)560,479 538,270 -4%
Gold equivalent sales (1)
(ounces)583,607 551,958 -5%
Revenue $598.1 $696.6 16%Cost of Sales(3)
+14%$496/oz
Revenue $598.1 $696.6 16%
Adjusted operating cash flow (4,5) $227.1 $271.4 20%
per share $0 33 $0 39 18%$496/oz per share $0.33 $0.39 18%
Adjusted net earnings (5) $84.3 $113.1 34%
per share $0.12 $0.16 33%
4(1) Please refer to endnote #1.(2) Please refer to endnote #2.(3) Please refer to endnote #3.
(4) Please refer to endnote #4.(5) Please refer to endnote #5.

Growing Cash Flow per Share
• Record high operating cash flow(5) in 2009 (+35% vs. 2008)
• 5‐yr CAGR: 25%
$
$1.36
(US$)
H1’09 vs. H1’10
$0.80
$1.01
ow per Sha
re (
$0.64$0.71
$0.45$0.51 $0.56
usted Ca
sh Flo
FY'04 FY'05 FY'06 FY'07 FY'08 FY'09
Adju
H1'09 H1'10
5(4) Please refer to endnote #5.

Paracatu Continues to Perform Ahead of Plan
85 772
108,421117,472 118,101
$750
$900
ounces)
85,772
$600
$750
Sales ($/oz)
prod
uction
(o
$450 Cost of S
ld equ
ivalen
t
$300
Q3'09 Q4'09 Q1'10 Q2'10
Gol
6

Completed Acquisition of Dvoinoye, Russia
• Acquiring 100% of the Dvoinoye deposit and Vodorazdelnaya concession
o Transaction closed August 2010
• Initiated construction of an all‐weather roadDvoinoye deposit & VodorazdelnayaInitiated construction of an all‐weather road
• Constructed a temporary camp
• Selected engineering firm to commence concept
yconcession
~90 kmand pre‐feasibility studies
• Received government approval for 2010 and 5‐year exploration programs
Kupol mine
• Spending $5 mm in exploration and $15 mm in development in 2010
7

A new high‐growth pure‐gold senior producer
Combination with Red Back
A new high growth, pure gold senior producer
8

Major Gold Discoveries: 1997‐2008
80
90
3 000
3,500
oz.)
ding
50
60
70
2 000
2,500
3,000
cove
ries
(MM
te S
tage
Spe
n d
30
40
50
1,000
1,500
2,000
of M
ajor
Au
Dis
c
Gra
ssro
ots
+ La
(US
$ M
M)
0
10
20
-
500
1,000
Year
Ave
rage
o
ar A
vera
ge o
f G
1997 1998 1999 2000 2001 2002 2003 2004 2005 2006 2007 2008 3 Y
3 Ye
a
Total Au Ounces Discovered (3 yr. Avg) Gold Exploration Spending (3 yr. Avg)
10 5 6 5 2 3 7 5 08 2# of Major Gold Discoveries
9Source: Metals Economics Group and Company estimates
Total Au Ounces Discovered (3 yr. Avg) Gold Exploration Spending (3 yr. Avg)
High‐Growth, Pure‐Gold Senior Producer
Red Back+Kinross
=A new high‐growth,
pure‐gold senior producer
10

High‐Growth, Pure‐Gold Senior Producer
• Top‐quality assets in expanding districts
Tasiast & ChiranoKinross
• 8 gold mining operations Top quality assets in expanding districts• Operating mines with significant upside
potential through further exploration• West African operating expertise
+8 gold mining operations• 4 high‐quality growth projects• Financial capacity to build new mines• Exploration and mine development expertise• Proven expansion track record
=• Proven expansion track record
A new high‐growth, pure‐gold senior producer
Pro forma gold production of ~2.6 – 2.7 mm oz Au in 2010 (6,7)
High‐quality production growth of ~47% to ~3.9 mm oz by 2015 (consensus of pro forma analyst estimates)(8)
E l ti f d hi hl ti ld di t i t
Exploration focused on highly‐prospective gold districts Permitting experience, proven track record and well‐established CSR programs Dedicated project development team to expand existing operations and build new mines Combined market capitalization of ~US$18 billion* ‐ listed on TSX and NYSE
11* Based on the NYSE closing price on July 30, 2010(6) Please refer to endnote #6.(7) Please refer to endnote #7.(8) Based on equity analyst consensus. Please refer to endnote #8.

Summary Transaction Terms
Consideration Offered
• Implied value of C$30.50 per Red Back common share at the time of announcement• 21% premium based on 20‐day volume‐weighted average price• Transaction values Red Back at US$7 1 billion(i)• Transaction values Red Back at US$7.1 billion( )
Structure
• Plan of arrangement unanimously supported by both Boards of Directors and management• 1.778 Kinross common shares and 0.11 of a Kinross warrant per Red Back common share• Warrant has a 4‐year term with an exercise price of US$21.30 per sharey p p• Tax‐deferred roll‐over option for Canadian holders of Red Back
Other Terms
• Red Back directors and senior officers have agreed to voting lock‐ups and Kinross will vote its 9.3% interest
Other Terms • Typical conditions including non‐solicitation, right‐to‐match and reciprocal break fees payable(ii)
• President & CEO and Chairman of Red Back to join Kinross’ Board of Directors
C diti• 66 2/3% Red Back shareholder approval
50% Ki h h ld lConditions • >50% Kinross shareholder approval• Customary regulatory and court approvals
Indicative Timetable
• Kinross and Red Back circulars have been mailed• Kinross and Red Back shareholder meetings to be held September 15, 2010
12(i) On a fully‐diluted basis; excludes the warrant consideration and the 9.3% interest already owned by Kinross(ii) Break fees consist of C$217 mm payable to Kinross or C$250 mm payable to Red Back under certain circumstances

Kinross and Red Back: A Winning Combination
• Red Back’s unique assets complement Kinross’ skill set and portfolio
o Tasiast is a world‐class growth asset in a new fast‐growing gold district
o Kinross has the experience and financial strength to optimize Red Back’s assets
• Enhanced growth profile at Kinross drives superior investment propositionEnhanced growth profile at Kinross drives superior investment proposition
o Pure‐gold producer with a strong track record of delivering value
o High‐quality production growth of ~47% to ~3.9 mm oz by 2015 (pro forma consensus estimates)(8)
o Accelerated cash flow growth from high‐margin assetsg g g
• Combined company is greater than the sum of the parts
o Assets and skill sets are complementary, resulting in enhanced value‐creation opportunities for shareholdersshareholders
o Kinross expertise and development teams can accelerate development of Tasiast
o Combination is expected to be accretive to NAV and will be strongly accretive to CFPS once the Tasiast plant is complete
13(8) Based on equity analyst consensus. Please refer to endnote #8.

Focused in the Best Gold Districts
Fort Knox DvoinoyeHigh‐grade epithermal districtStrong North American asset base in the TintinaFort Knox
White Gold
Kettle River‐Buckhorn
Dvoinoye
Kupol
High grade epithermal district with exploration upsidegold belt, Nevada and
Washington
Round Mountain
TasiastCornerstone assets in a
Fruta del Norte
CrixasParacatu
Chiranohighly prospective region
Substantial production base and major
La CoipaMaricunga
Cerro CasaleLobo‐Marte
base and major development pipeline
14
‐ Operating mine ‐ Development project

Strongly Enhances Existing Growth Profile
Consensus of Equity Analysts’ Production Estimates(8)Total
Red Back
0 91.03 0
3.2
3.73.9
Kinross
0.5 0.60.7
0.8
0.92.6 – 2.7
2.93.0
n (m
m oz)
2.2 2.3 2.3 2.42.8 2.9
Prod
uctio
2010e 2011e 2012e 2013e 2014e 2015e
15(8) Based on equity analyst consensus. Please refer to endnote #8.

Kinross Project Portfolio
d
2010 2011 2012 2013 2014
Paracatu 3rd Ball Mill
Paracatu Desulphurization
Maricunga SART Plantg
Paracatu 4th Ball Mill
Maricunga Optimization
Dvoinoye
Tasiast
L b M tLobo‐Marte
Fruta del Norte
Cerro Casale
16

Extensive Due Diligence by Kinross
• Multiple site visits to Tasiast and Chirano by Kinross geologists, engineers, members of the executive team and Board of Directors
• Independent analysis conducted by Kinross includes:
o Metallurgical testing
o Modeling of options for optimal mining and processing scenarios
o Twinning of drill holes
• Received third party opinions on the geologic potential, mining operations and engineering of
i iexpansion scenarios
• Fairness opinions from four leading financial institutions
17

What Red Back Adds to Kinross
• Two well‐established gold mines in West AfricaTasiast
o 2010e gold production of 445k oz to 465k oz(7)
o Growth potential to 1 mm oz of annual production by 2015 based on analyst consensus estimates(8)
Chirano
• Significant exploration upside: o Only 8 km out of 70 km of strike length has been
explored at Tasiast
• ~US$730 million in cash(9)
• Cash flow growth and leverage to gold price
• Well respected management team with proven• Well‐respected management team with proven West African experience
18(7) Please refer to endnote #7.(8) Based on equity analyst consensus. Please refer to endnote #8.(9) Please refer to endnote #9.
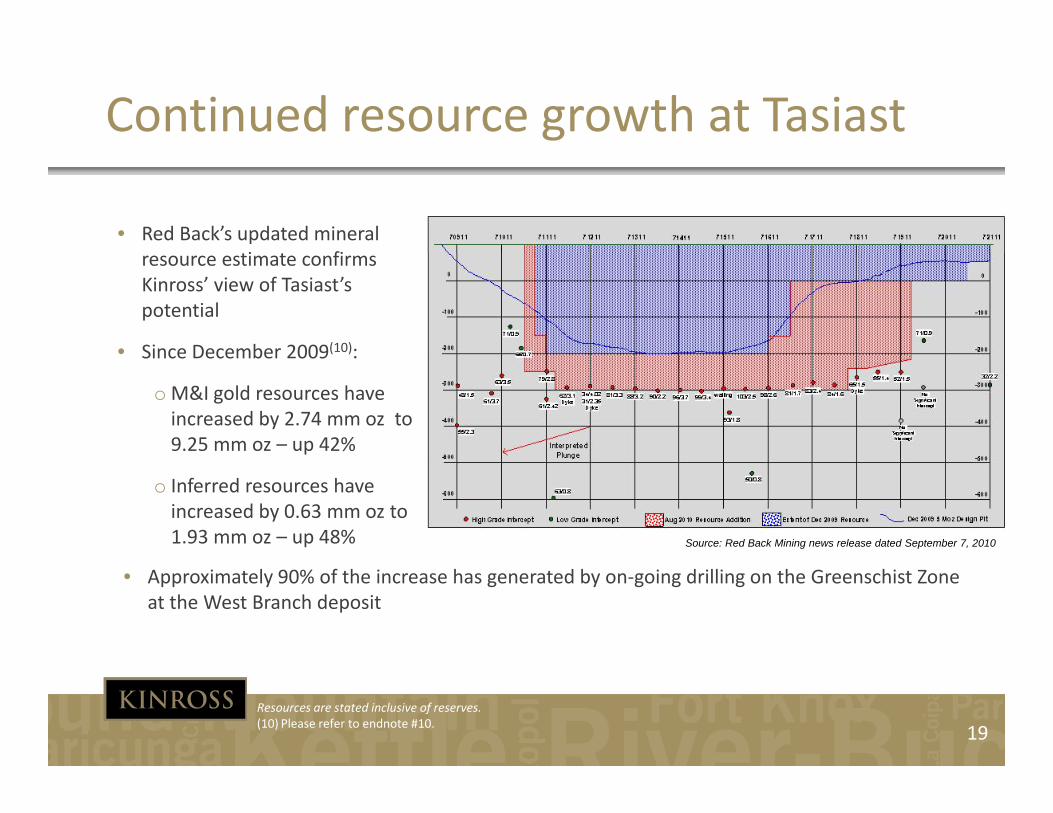
Continued resource growth at Tasiast
• Red Back’s updated mineral i firesource estimate confirms
Kinross’ view of Tasiast’spotential
• Since December 2009(10):Since December 2009 :
o M&I gold resources have increased by 2.74 mm oz to 9.25 mm oz – up 42%
o Inferred resources have increased by 0.63 mm oz to 1.93 mm oz – up 48% Source: Red Back Mining news release dated September 7, 2010
• Approximately 90% of the increase has generated by on‐going drilling on the Greenschist Zone at the West Branch deposit
19Resources are stated inclusive of reserves.(10) Please refer to endnote #10.

Increasing Grades and Widths at Depth
20Source: Red Back Mining July 2010 corporate presentation, website and news releases dated April 12, 2010 and July 21, 2010

Tasiast: District Potential
• First mine in a highly prospective ld b l
C23 +
gold belt
o Continuity of geology
o Simple stratigraphy
O l 8 k f 70 k t ik l th i
TasiastTrend
• Only 8 km of 70 km strike length in unexplored Archean greenstone belt tested to date
o Multiple untested geochem
TasiastWestTrend
70 km
targets on parallel trends
o (e.g. Pantaloon)
o 6,300 km2 contiguous land position held by Red Back
ImkebdeneTrend
PantaloonTrend
position held by Red Back
• No serious gold competitors in the district or country
Legend
‐ License Boundary
‐ Tasiast Mine
Source: Red Back Mining July 2010 corporate presentation and website
21

Tasiast: District Upside
• Kinross’ preliminary estimate, based on 6 months of extensive geological and technical due diligence:
o 350 – 425 million tonnes grading 1.5 – 1.8 g/t Au(11)
• The Greenschist Zone is characterized by consistently thick intervals average ~60 toThe Greenschist Zone is characterized by consistently thick intervals average 60 to 100 m wide, grading 1.5 – 3.0 g/t
• Geological modeling by Kinross indicates that the zone plunges south – consistent with mineralization in other ore bodies mined along the 8 km Tasiast depositwith mineralization in other ore bodies mined along the 8 km Tasiast deposit
• Kinross believes that gold mineralization will continue laterally and at depth in the same direction
• Geologic architecture is analogous to trap sites for major gold deposits in similar greenstone belt settings – ie. Kalgoorlie, Timmins
22(11) Please refer to endnote #11.

District Potential – 82 x 25 km Achaean Greenstone Belt
Tasiast Geology(i) Timmins Geology with Major Au Mines & Au Occurrences(ii)
Tasiast
Fractured ownership withEntire district
25 km 25 km
Fractured ownership with >30 public companies and >100 prospectors holding significant property claims
controlled byRed Back
(i) Source: Red Back Mining February 2010 Technical Presentation, available on Red Back’s website.(ii) Source: Ontario Geological Survey 23

No Geographic Constraints to Expansion
C
B
A
24
A

Kinross’ Expansion Plans for Tasiast
• Kinross development program for Tasiast currently envisions:
C t ti f ill i i it f 10k t d tl t 60k t do Construction of a new mill, increasing capacity from 10k tpd currently to 60k tpdo Larger mining fleet, tailored to scale of the expanded operationo Expected to be complete within 36 months; new mill to start‐up in Q4 2013
• After closing Kinross will leverage its experienced Project Development teams to:• After closing, Kinross will leverage its experienced Project Development teams to:
o Accelerate exploration program
Kinross to significantly increase the number of drill rigs at Tasiast In fill and step out drilling to delineate higher grade at depth In‐fill and step out drilling to delineate higher grade at depth Q3 2010 – update on exploration activities / progress February 2011 ‐ update to NI 43‐101 reserve and resource statement
o Fast‐track engineering and project development worko Fast track engineering and project development work
Scoping study – December 2010 Feasibility study ‐ July 2011
o Commence community relations and permitting activities
25
o Commence community relations and permitting activities

Illustrative Tasiast Expansion Timeline
ExplorationInfill and Step‐Out DrillingInfill and Step‐Out Drilling
Regional ExplorationRegional ExplorationRegional ExplorationRegional Exploration
Scoping StudyScoping Study
FeasibilityFeasibility
Engineering & Procurement
EIAEIA
Long Lead Time ItemsLong Lead Time Items
Construction & Commissioning Commissioning
Detailed EngineeringDetailed Engineering
Site Preparation & ConstructionSite Preparation & Construction
2010 2011 2012 2013 2014
Commissioning
Production Expanded ProductionExpanded Production
26

Immediate Benefit to Red Back Shareholders
• Premium of 21% to the pre‐announcement market price ‐ based on 20‐day VWAP• Continued participation in asset potential through Kinross share ownership• Superior leverage to gold through a pure‐play producer
Value Creation
• Exposure to Kinross’ balanced project portfolio of 8 operating mines• Exposure to Kinross balanced project portfolio of 8 operating mines• Tasiast and Chirano complement Kinross’ future growth from its portfolio of 4 high‐
quality projectsDiversification
Seasoned exploration and development team with proven track record• Seasoned exploration and development team with proven track record• Combination brings stronger financial and technical platform to realize full potential of
Red Back’s assets• Kinross track record of successful acquisition integration
Benefit from Kinross Expertise
• Fifth‐largest global gold producer by market capitalization• Greater access to capital markets• Improved trading liquidity and NYSE exposure
Broadened Investor Base
27
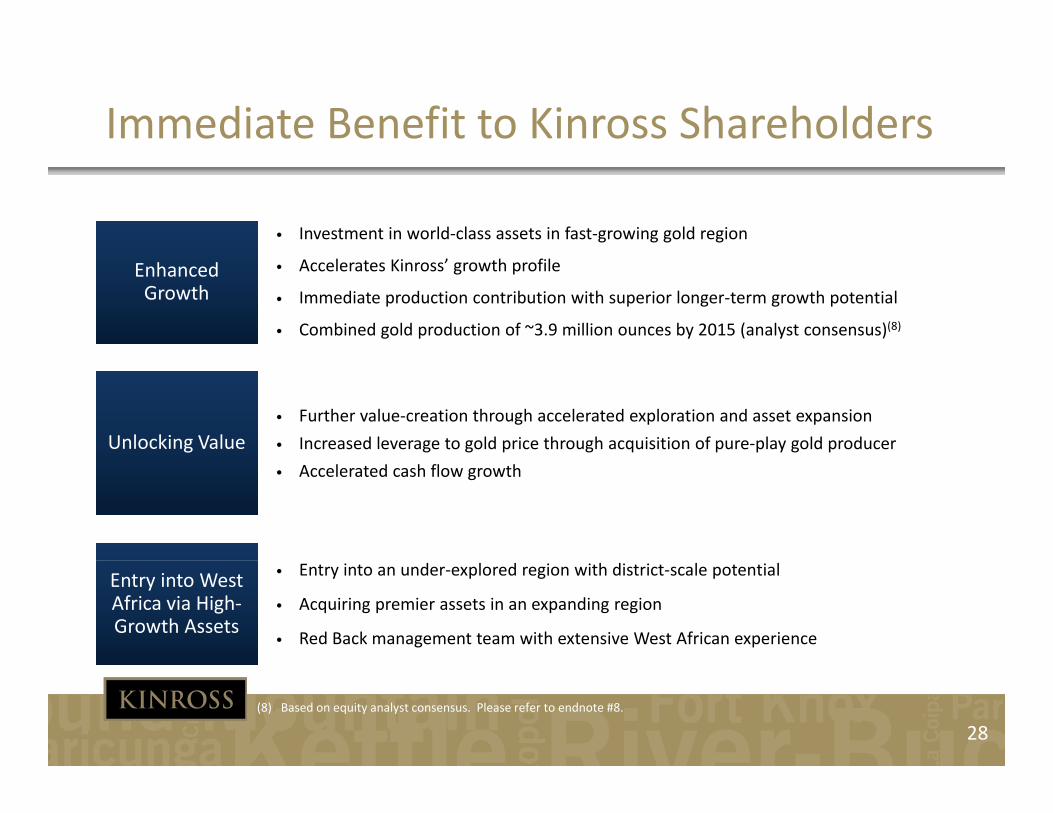
Immediate Benefit to Kinross Shareholders
• Investment in world‐class assets in fast‐growing gold region
• Accelerates Kinross’ growth profile
• Immediate production contribution with superior longer‐term growth potential
• Combined gold production of ~3.9 million ounces by 2015 (analyst consensus)(8)
Enhanced Growth
• Further value‐creation through accelerated exploration and asset expansion
• Increased leverage to gold price through acquisition of pure‐play gold producerUnlocking Value• Accelerated cash flow growth
• Entry into an under‐explored region with district‐scale potential
• Acquiring premier assets in an expanding region
• Red Back management team with extensive West African experience
Entry into West Africa via High‐Growth Assets
28(8) Based on equity analyst consensus. Please refer to endnote #8.

Kinross and Red Back: A Winning Combination
Transformational combination driven by world‐class producing assets, expansion y p g , popportunities and development projects
Accelerates Kinross’ growth as a pure‐play senior gold producer Creates stronger technical and financial platform to realize full potential of Red
Back’s assets
Premium offer provides immediate value creation and risk diversification for Red
Premium offer provides immediate value‐creation and risk‐diversification for Red Back shareholders
Red Back shareholders benefit from Kinross’ track record of delivering value
Expected to be accretive to NAV and strongly accretive to CFPS once assets reach
their full potential
29

Valuation
30

Bank of America Merrill Lynch: P / NAV
2.5
2.0 2.0
1.71 61.6
1.5
AEM GG NEM ABX KGC AUY
31Source: Bank of America Merrill Lynch research – September 4, 2010

Bank of America Merrill Lynch: P / 2010e CFPS
13.8
10.99.6
8 9 8 98.9 8.9
7.4
GG AEM NEM ABX KGC AUY
32Source: Bank of America Merrill Lynch research – September 4, 2010

Key Objectives for 2010
Declare increased reserves
Complete Lobo Marte pre feasibility study
Complete Lobo‐Marte pre‐feasibility study
Close sale of 25% of Cerro Casale
Complete 18,000 drill program at Fruta del Norte
Complete investment in Red Back Mining
Complete acquisition of Underworld Resources
Final feasibility study for Cerro Casale
Complete Maricunga Expansion feasibility study (H1 2010)
Close Dvoinoye acquisition
Close and integrate Red Back acquisition
g q
Delivery and construction of 3rd ball mill at Paracatu
Complete metallurgical testing and finalize pre‐feasibility study at Lobo‐Marte
Advance Fruta del Norte pre‐feasibility study
33
Advance Fruta del Norte pre feasibility study

Appendix
34
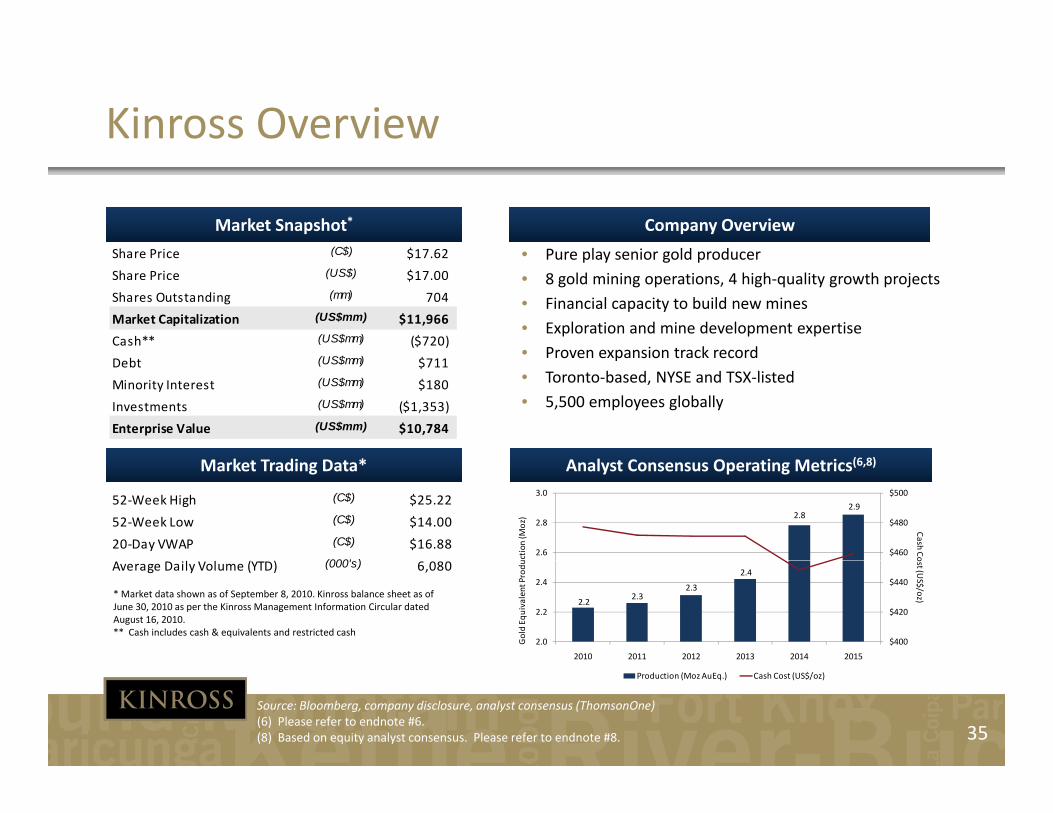
Kinross Overview
Company Overview
• Pure play senior gold producer
Market Snapshot*
Share Price (C$) $17 62 • Pure play senior gold producer• 8 gold mining operations, 4 high‐quality growth projects• Financial capacity to build new mines• Exploration and mine development expertise• Proven expansion track record
Share Price (C$) $17.62
Share Price (US$) $17.00
Shares Outstanding (mm) 704
Market Capitalization (US$mm) $11,966
Cash** (US$mm) ($720)$ Proven expansion track record
• Toronto‐based, NYSE and TSX‐listed• 5,500 employees globally
(6 8)
Debt (US$mm) $711
Minority Interest (US$mm) $180
Investments (US$mm) ($1,353)
Enterprise Value (US$mm) $10,784
Market Trading Data* Analyst Consensus Operating Metrics(6,8)
2.8 2.9
$460
$480
$500
2.6
2.8
3.0
Cash Co
uction
(Moz)
52‐Week High (C$) $25.22
52‐Week Low (C$) $14.00
20‐Day VWAP (C$) $16.88(000' )
2.2 2.3
2.3
2.4
$400
$420
$440
2.0
2.2
2.4
2010 2011 2012 2013 2014 2015
ost (US$/oz)
Gold Eq
uivalent ProduAverage Daily Volume (YTD) (000's) 6,080
* Market data shown as of September 8, 2010. Kinross balance sheet as of June 30, 2010 as per the Kinross Management Information Circular dated August 16, 2010.** Cash includes cash & equivalents and restricted cash
35
Production (Moz AuEq.) Cash Cost (US$/oz)
Source: Bloomberg, company disclosure, analyst consensus (ThomsonOne)(6) Please refer to endnote #6.(8) Based on equity analyst consensus. Please refer to endnote #8.

Red Back Overview
Company Overview
E i ld d i h W Af i i i
Market Snapshot*
h (C$) $ • Emerging gold producer with West African operating expertise
• Two operating mines with significant upside potential through further exploration
• Top‐quality assets in expanding districts
Share Price (C$) $30.65
Share Price (US$) $29.59
Shares Outstanding (mm) 257
Market Capitalization (US$mm) $7,595
Cash** (US$mm) ($732)
• Vancouver‐based and TSX‐listed
( 8)
Debt (US$mm) ‐‐
Minority Interest (US$mm) $4
Investments (US$mm) ‐‐
Enterprise Value (US$mm) $6,867
Market Trading Data* Analyst Consensus Operating Metrics(7,8)
0.6
0.7
0.8 0.9
$460
$480
$500
0.6
0.8
1.0
Cash(Moz)
52‐Week High (C$) $31.93
52‐Week Low (C$) $10.96
20‐Day VWAP (C$) $29.30
Average Daily Volume (YTD) (000's) 2 6390.5
$400
$420
$440
0.0
0.2
0.4
h Cost (US$/oz)
Gold Prod
uctio
n (Average Daily Volume (YTD) (000 s) 2,639
* Market data shown as of September 8, 2010 and based on the Bank of Canada noon rate of 1.0359 C$/US$. Red Back balance sheet as of June 30, 2010 as per the Kinross Management Information Circular dated August 16, 2010.** Cash includes cash & equivalents and restricted cash
36
2010 2011 2012 2013 2014
Gold Production (Moz) Cash Cost (US$/oz)
Source: Bloomberg, company disclosure, analyst consensus (ThomsonOne)(7) Please refer to endnote #7.(8) Based on equity analyst consensus. Please refer to endnote #8.

Red Back: A History of Delivering Resource Growth
• West African intermediate producer with two producing assets
• Continued near‐term resource increases anticipated at Tasiast
• Large, underexplored land package in highly prospective, emerging gold district
Hi f D li i Mi l R
2.5InferredMeasured & IndicatedP & P b bl
Asset Overview
TASIAST (100%)
• Open pit gold mine in
History of Delivering Mineral Resource Growth (10)
2.0
2.6
5.3
1 3
1.6
2.6Proven & Probable Open pit gold mine in
Mauritania
• First mine in a highly prospective gold district
TasiastMauritania
Chirano
0.9 1.8 2.0 2.1 2.74.6
7.3 8.1
1.8 0.9 1.0 1.61.91.4 1.4 1.4
1.9 1.3
2003 2004 2005 2006 2007 2008 2009 Current
CHIRANO (100%)(6)
• Established open pit / underground gold mine in Ghana
ChiranoGhana
37(10) Please refer to endnote #10.

Mining‐Friendly Jurisdictions
Ghana Mauritania
• Constitutional democratic republic
Political• Gained independence from Britain in 1957
• Seen as a model for political and economic reform in Africa
• Democratic government
• Gained independence from France in 1960
• Arabic and French spokenSocial • English is commonly spoken and US Dollars accepted
Arabic and French spoken
• US Dollar and Euro are commonly accepted
Legal
• Modern mining law and a well developed public bureaucracy devoted to the industry
F i i t t d id t t t f
• Government actively promotes mining in the country
• Foreign investment code provides same treatment of foreign investors and guarantees capital repatriation
• Mining laws have been in place since 1977
• Resource based economy with a mining‐friendly environment
• EIU forecasts that Ghana’s economy will grow by 6 0%
• Resources are a large component of the economy within a mining‐friendly environment
Economic• EIU forecasts that Ghana s economy will grow by 6.0% in 2010
• Foreign gold producers operating in country include Gold Fields, Newmont, AngloGold, Golden Star
• Foreign companies operating in country include Total, Elf Aquitaine, First Quantum and Petronas
38

Red Back – West African Growth Platform
# Producing Mine
# Exploration / Development Project
1
3
54
4
1) Tasiast (Robinson) – Au2) Guelb Moghrein (First Quantum) – Cu/Co/Au 3) Askaf (Sphere Minerals) – Iron Ore4) Guelb el Aouj (Sphere Minerals) – Iron Ore5) Lebtheinia (Sphere Minerals) – Iron Ore6
6) Guelb El Rhein (SNIM) – Iron Ore
(Red Back) ‐ Au
TasiastMauritania
1 MAURITANIA5 1
1) Atar International Airport
2) Nouadhibou International Airport
3) Nouakchott International Airport
4) Port Minéralier
5) Nouakchott Deep Sea Port
Infrastructure#2
3
4 Railway
2
5Tasiast
Chirano 5) Nouakchott Deep-Sea Port
Key Mauritania Stats:• Religion: 100% Muslim
• Language: Arabic (official and national), French also prevalent
• Population: 3 3 millionKey Ghana Stats:
ChiranoGhana
• Population: 3.3 million
• Capital: Nouakchott
• Currency: Ouguiya (MRO), US dollars also accepted
• Religion: 69% Christian, 16% Muslim
• Language: English (official), Asante, Ewe
• Population: 23.9 million
• Capital: Accra
• Currency: Ghanian cedi (GHC)
39Source: Company Disclosure, African Economic Outlook, Aircraft Charter World, Metals Economic Group, CIA World Factbook

Tasiast ‐ A World‐Class Gold Deposit
• Open‐pit mine located in Mauritania, ~300 km north of the capital city of Nouakchottcapital city of Nouakchott
• Commercial production commenced in January 2008
• 2.5 Mtpa CIL mill and 4.5 Mtpa dump leach operation
• 2010e production(7): ~205‐215k oz at ~$375‐400/oz
• Road access to mine and small air strip on site
• Situated in remote flat sparsely populated desert• Situated in remote, flat, sparsely populated desert
• Highly prospective, underexplored gold belt
• Only 8 km of 70 km strike length tested Tonnes(000)
Grade(g/t)
Cont’d Au (mm oz )y g
• 3,074 drill holes completed to date (418,073 m)
(000) (g/t) (mm oz.)
2P Reserves(10) 115,200 1.4 5.03
M&I Resources (10) 195,250 1.47 9.25
Inferred(10) 41,200 1.5 1.93
d i l i f
40(7) Please refer to endnote #7.(10) Please refer to endnote #10.
Resources are stated inclusive of reserves.
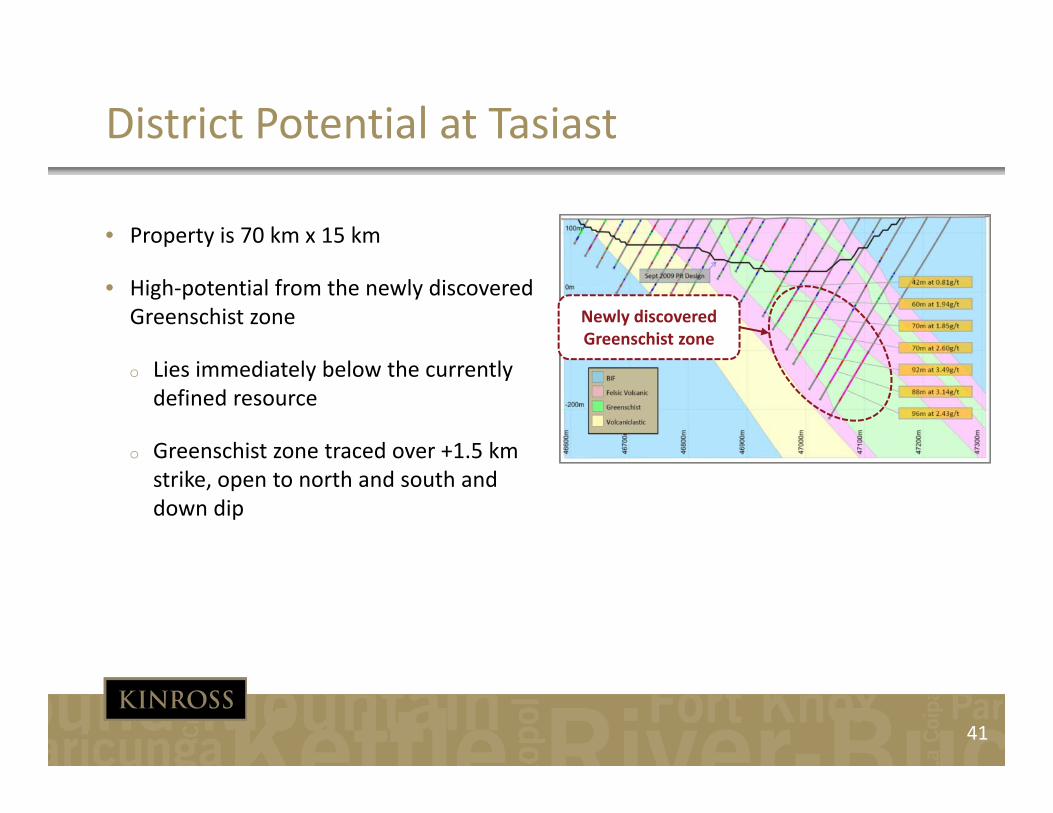
District Potential at Tasiast
• Property is 70 km x 15 km
• High‐potential from the newly discovered Greenschist zone Newly discovered
Greenschist zone
o Lies immediately below the currently defined resource
o Greenschist zone traced over +1.5 kmo Greenschist zone traced over 1.5 km strike, open to north and south and down dip
41

Chirano ‐ Expanding Gold Mine in Ghana
• Established open‐pit and underground mining operation Tasiast
located in Ghana’s Western region• 90% owned by Red Back; Government of Ghana holds a
10% carried interest• Nine open pits and two recently discovered underground
Chirano
• Nine open‐pits and two recently‐discovered underground deposits
• Akwaaba in production; Paboase in development• 2010e production of ~240‐250 k oz, expansion potential2010e production of 240 250 k oz, expansion potential
to ~300‐350 k oz by 2013(7)
• Current estimated mine life of 10+ years• ~100% resource growth since 2005
Tonnes(000)
Grade(g/t)
Cont’d Au (mm oz)
2P Reserves* 33,200 2.1 2.24
M&I Resources* 41,700 2.5 3.34S R d B k Mi i J l 2010 i d b i
42(7) Please refer to endnote #7.
*Source: Red Back Mining 2009 Annual Information Form (excludes Paboase update contained in the news release dated July 19, 2010). Resources are stated inclusive of reserves.
Inferred * 12,600 3.2 1.30 Source: Red Back Mining July 2010 corporate presentation and website
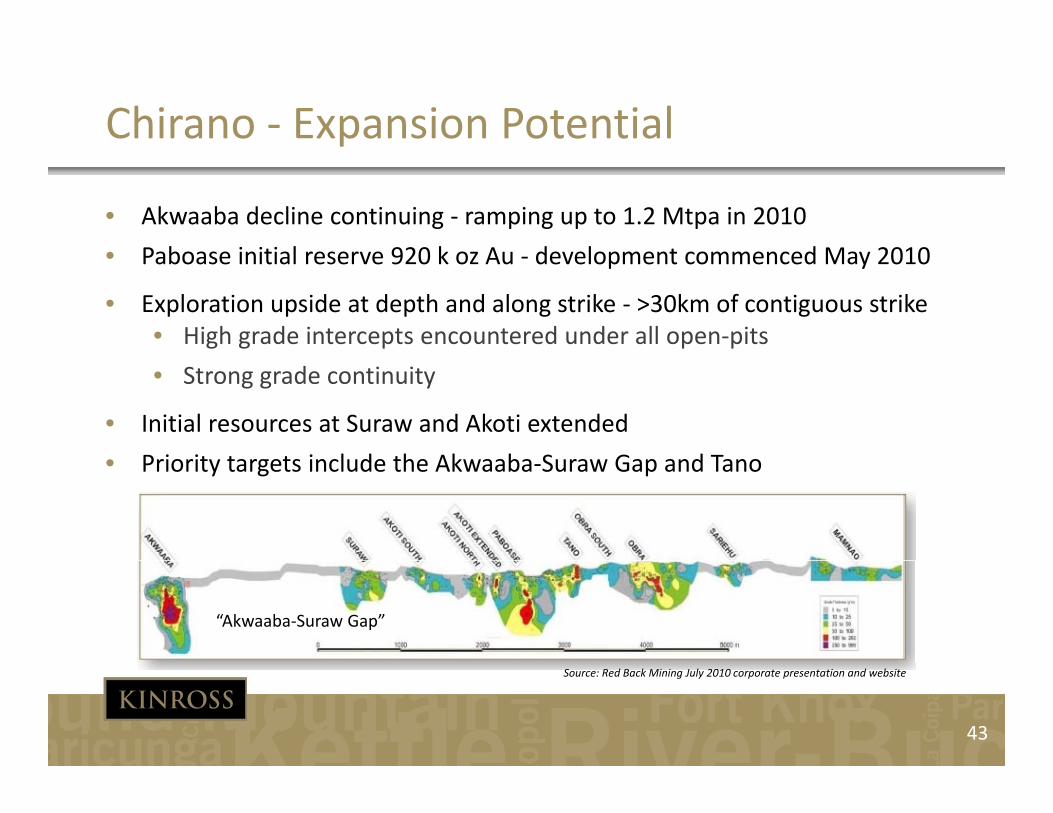
Chirano ‐ Expansion Potential
• Akwaaba decline continuing ‐ ramping up to 1.2 Mtpa in 2010
• Paboase initial reserve 920 k oz Au development commenced May 2010• Paboase initial reserve 920 k oz Au ‐ development commenced May 2010
• Exploration upside at depth and along strike ‐ >30km of contiguous strike• High grade intercepts encountered under all open‐pits
• Strong grade continuity
• Initial resources at Suraw and Akoti extended
P i it t t i l d th Ak b S G d T• Priority targets include the Akwaaba‐Suraw Gap and Tano
“Akwaaba‐Suraw Gap”
43
Source: Red Back Mining July 2010 corporate presentation and website

Pro Forma Kinross ‐ Overview
• Pro forma gold equivalent production of ~2 6 – 2 7 mm oz
Market Snapshot* Company Overview• Pro forma gold equivalent production of 2.6 2.7 mm oz
Au in 2010 (6,7)
• Production growth of ~47% to ~3.9 mm oz by 2015 based on consensus of analyst estimates(8)
• Exploration focused on highly‐prospective gold districts
• Permitting experience proven track record and well‐
Share Price (C$) $17.62
Share Price (US$) $17.00
Existing Kinross Shares Outstandi (mm) 704
Shares Issued to Red Back (mm) 414
Pro Forma Shares Outstanding (mm) 1 118 Permitting experience, proven track record and wellestablished corporate responsibility (CR) programs
• Dedicated project development team to expand existing operations and build new mines
• Listed on TSX and NYSE
Pro Forma Shares Outstanding (mm) 1,118
Market Capitalization (US$mm) $19,002
Cash ** (US$mm) ($1,417)
Debt (US$mm) $711
Minority Interest (US$mm) $184
Investments (US$mm) ($744)
* Market data shown as of September 8, 2010. Pro forma Kinross balance sheet as of June 30, 2010 as per the Kinross Management Information Circular dated August 16, 2010.** Cash includes cash & equivalents and restricted cash
Analyst Consensus Operating MetricsInvestments (US$mm) ($744)
44(6) Please refer to endnote #6.(7) Please refer to endnote #7.(8) Based on equity analyst consensus. Please refer to endnote #8.

Pro Forma Kinross – Production Metrics
7.8
2010 Production (8) (Moz) 2014 Production (Moz)
8 07.8
5.54.6
3.42.7 2.6 2.5 2.2
1.5 1 0
8.0
5.6 5.4
4.0 3.7 3.7 3.4 3.2 2.8
1.5 1 11.0 0.6
ABX NEM AU GFI Pro FormaKinross
NCM G K PLZL AEM ELD
2010 2014 Production CAGR (%)
1.1
ABX NEM AU GFI G Pro FormaKinross
NCM PLZL K AEM ELD
2010‐2014 Production CAGR (%)
20.9%
16.4%13.4%
9.7% 9.2%6.3% 5.7%
4.3% 3.6%
0.6% 0.2%
PLZL ELD Pro Forma G AEM NCM K AU GFI ABX NEM
45
PLZL ELD Pro FormaKinross
G AEM NCM K AU GFI ABX NEM
(8) Please refer to endnote #8. 2010 estimate assumes full‐year ownership of Red Back by Kinross in 2010.

World’s Largest Gold Deposits(1)
Mine / Project Natalka Kerr-Sulphurets Lihir Island Donlin Creek Nevada Ops. Obuasi Pueblo Viejo Boddington Pascua
Lama Penasquito Detour Lake Nevada Ops. Cortez Kibali
Owner Polyus (100%)
Seabridge (100%)
Newcrest(100%)
Barrick (50%), NovaGold
(50%)
Newmont (100%)
AngloGold (100%)
Barrick (60%), Goldcorp
(40%)
Newmont (100%)
Barrick (100%)
Goldcorp (100%)
Detour (100%) Barrick (100%)
Barrick (100%)
Randgold (45%),
AngloG.(45%), G.DRC (10%)
Location Russia Canada Papua New Guinea
United States United States Ghana Dominican Republic
Australia Chile / Argentina
Mexico Canada United States United States DRC
(3) (4)
(5)
Recent Transaction (2) NA Seabridge
(2006)NA NovaGold
(2007)NA Ashanti
(2004)Placer Dome
(2006)AngloGold
(2009)NA Glamis
(2003)Pelangio(2007)
NA Placer Dome(2006)
Moto(2009)
2009A Production (koz Au)
NA NA 853 NA 2,005 381 NA 103 NA 90 NA 1,360 518 NA
Resource grade (g/t)
1.5 0.5 2.3 2.3 1.3 6.1 2.6 0.7 1.8 0.4 1.0 5.9 2.6 3.4
46(1) Excludes: Deposits in South Africa, owned/controlled by a government, and porphyries.(2) Since 2003.(3) Includes Carlin, Phoenix, Twin Creeks, Midas, and 25% of Turquoise Ridge.
(4) Includes Goldstrike (Betze‐Post, Meikle, and Rodeo) and 75% of Turquoise Ridge.(5) Newcrest announced on August 23, 2010 that shareholders approved the takeover of
Lihir by Newcrest.
grade (g/t)

Endnotes1) Unless otherwise stated, gold equivalent production, gold equivalent ounces sold and cost of sales figures in this presentation are on an
attributable basis, based on Kinross’ share of Kupol production (75%).2) Cost of sales margin is defined as the average realized price of gold less attributable cost of sales per ounce.3) C t f l i d fi d t f l th fi i l t t t di id d b th b f ld i l t ld b th3) Cost of sales per ounce is defined as cost of sales as per the financial statements divided by the number of gold equivalent ounces sold, both
reduced for Kupol sales attributable to a third‐party 25% shareholder.4) Unless otherwise stated, all cash flow and cash flow per share figures in this presentation are adjusted operating cash flow.5) Adjusted net earnings and adjusted operating cash flow numbers are non‐GAAP financial measured which are meant to provide additional
information and should not be used as a substitute for performance measures prepared in accordance with GAAP. For more information about these non‐GAAP financial measures, and a reconciliation of these non‐GAAP financial measures for the three and six months ended June 30, 2010 and June 30, 2009, please refer to the press release dated August 4, 2010, available on our website at www.kinross.com
6) For more information on Kinross’ production and cost outlook for 2010, please refer to the news releases dated January 14, 2010 and May 4, 2010, available on our website at www.kinross.com
7) For more information on Red Back’s production outlook for 2010, please refer to the news releases dated July 21, 2010 and August 3, 2010, available on Red Back’s website at www.redbackmining.com
8) B d f it l t ’ ld d ti ti t f Ki d/ R d B k f A t 1 20108) Based on a consensus of equity analysts’ gold production estimates for Kinross and/or Red Back, as of August 1, 2010.9) Red Back’s cash and cash equivalents as at June 30, 2010.10) Mineral reserve and mineral resources reflect 100% ownership in Red Back’s assets. Please refer to Red Back Mining’s website for historical
mineral reserve and mineral resource information. “Current” mineral reserve and mineral resources reflect Red Back’s mineral reserve and mineral resource statement as at December 31, 2009, adjusted to reflect updates in 2010. Please refer to Red Back’s website at:www.redbackmining.com/s/ResourcesReserves.asp, and the news releases dated February 1, 2010, March 1, 2010, July 19, 2010 and g / / p, y , , , , y ,September 7, 2010, available on its website at www.redbackmining.com. Tasiast was acquired by Red Back in 2007, and historical mineral reserve and mineral resource information has been updated to reflect acquisitions.
11) Under National Instrument 43‐101 Standards of Disclosure for Mineral Projects (NI 43‐101), these potential tonnage and grade estimates are conceptual in nature, as there has been insufficient exploration to define a mineral resource, and it is uncertain if further exploration will result in the targeted deposit being delineated as a mineral resource.
12) Th G t f Gh h i ht t i f 10% i d i t t i th h ldi th Chi t
47
12) The Government of Ghana has a right to acquire a free 10% carried interest in the company holding the Chirano property.

Cautionary Note to Shareholders in the United States
Information in this presentation, including the documents incorporated by reference herein, has been prepared in accordance with therequirements of securities laws in effect in Canada, which differ from the requirements of United States securities laws. Withoutlimiting the foregoing, this presentation, including the documents incorporated by reference herein, uses terms such as “indicatedi l ” d “i f d i l ” U it d St t i t d i d th t hil h t i d dmineral resources” and “inferred mineral resources”. United States investors are advised that, while such terms are recognized and
required by Canadian securities law, the SEC does not recognize them. Under United States standards, mineralization may not beclassified as a “reserve” unless the determination has been made that the mineralization could be economically and legally produced orextracted at the time the reserve determination is made. United States investors are cautioned not to assume that all or any part ofindicated mineral resources will ever be converted into reserves. Further, “inferred mineral resources” have a great amount ofuncertainty to their existence and as to whether they can be mined legally or economically. It cannot be assumed that all or any part of“i f d i l ” ill b d d t hi h t Th f U it d St t i t l ti d t t“inferred mineral resources” will ever be upgraded to a higher category. Therefore. United States investors are also cautioned not toassume that all or any part of the inferred resources exist, or that they can be mined legally or economically. Accordingly, informationconcerning descriptions of mineralization and resources contained in this presentation or in the documents incorporated by reference,may not be comparable to information made public by United States companies subject to the reporting and disclosure requirements ofthe SEC. National Instrument 43‐101 – Standards of Disclosure for Mineral Project (“NI 43‐101”) is a rule developed by the CanadianSecurities Administrators which establishes standards for all public disclosure an issuer makes of scientific and technical information
i i l j U l h i i di d ll i l d i l i i d iconcerning mineral projects. Unless otherwise indicated, all mineral reserve and mineral resource estimates contained in orincorporated by reference in this presentation have been prepared in accordance with NI 43‐101 and the Canadian Institute of Mining,Metallurgy and Petroleum Classification System. These standards differ significantly from the requirements of the U.S. Securities andExchange Commission (“SEC”), and mineral reserve and mineral resource information contained herein and incorporated by referenceherein may not be comparable to similar information disclosed by United States companies.
Other informationOther information
This presentation does not constitute an offer of any securities for sale.
48