delivering growth while reducing deficits
TRANSCRIPT

8/3/2019 Delivering Growth While Reducing Deficits
http://slidepdf.com/reader/full/delivering-growth-while-reducing-deficits 1/45
Delivering growthwhile reducing decits: lessons from the 1930s
Nicholas Crafts
8/3/2019 Delivering Growth While Reducing Deficits
http://slidepdf.com/reader/full/delivering-growth-while-reducing-deficits 2/45
Delivering growth while reducing defcits
About the author
Professor Nicholas Crafts is Director of the University of Warwick’s ESRC-funded Competitive Advantage in theWorld Economy Research Centre and Professor of EconomicHistory at the University of Warwick. He has previously held
academic positions at London School of Economics and theUniversity of Oxford. He is a Fellow of the British Academyand a past President of the Economic History Society. He hasadvised HM Treasury, the IMF, and the World Bank.
Detailed and thoughtful comments from Tim Leunig havegreatly improved this paper but he bears no responsibilityfor any errors.
ISBN 1-902622-99-5 Copyright 2011 CentreForum
All rights reserved
No part of this publication may be reproduced, stored in a retrievalsystem, or transmitted in any form or by any means, electronic,mechanical, photocopying, recording or otherwise, without theprior permission of CentreForum, except for your own personal andnon-commercial use. The moral rights of the author are asserted.
8/3/2019 Delivering Growth While Reducing Deficits
http://slidepdf.com/reader/full/delivering-growth-while-reducing-deficits 3/45
Delivering growth while reducing defcits
Contents
Executive summary 4
Introduction 6
Monetary policy at the zero lower bound 9
A brief overview of UK macroeconomicpolicy in the 1930s 13
The importance of credibility 17
Economic recovery in the UK in the 1930s 21
Lessons for today 25
Conclusion 29
References 31
Tables 35
:
8/3/2019 Delivering Growth While Reducing Deficits
http://slidepdf.com/reader/full/delivering-growth-while-reducing-deficits 4/45
Delivering growth while reducing defcits
Executive summary
In the Great Depression of the 1930s Britain grew stronglydespite signicant cuts in the government’s decit, short-
term interest rates which were already as low as possible,and the international economy being in disarray. That isexactly what policymakers need to achieve today. This papersets out what happened in the 1930s and what we can learnfrom that experience.
Over scal years 1932/33 and 1933/34 the structural budget
decit was reduced by a total of nearly 2 per cent of GDP aspublic expenditure was cut and taxes increased, the publicdebt to GDP ratio stopped going up while short term interestrates stabilized at about 0.6 per cent. Yet, from 1933 to 1937there was strong growth such that real GDP increased bynearly 20 per cent over that period.
In the early 1930s, scal consolidation without a compensating
boost from monetary policy was not conducive to recoveryand ran the risk of prolonged stagnation in a difcult world
economic environment which had little to encourage businessinvestment and exports. The potential parallels with today
are readily apparent.
The key to recovery was the adoption of credible policies toraise the price level and in so doing to reduce real interestrates by raising the expected rate of ination. This providedmonetary stimulus even though, as today, nominal interestrates could not be cut further. Fiscal stimulus was not afactor in the UK recovery until after 1935 when rearmamentbegan.
The ‘cheap money’ policy put in place in 1932 provided
:

8/3/2019 Delivering Growth While Reducing Deficits
http://slidepdf.com/reader/full/delivering-growth-while-reducing-deficits 5/45
Delivering growth while reducing defcits
an important offset to the deationary impact of scalconsolidation that had led to the double-dip recession of that year. A major way in which this stimulated the economy
was through its favourable impact on housebuilding in aneconomy without strict planning rules; the private sectorbuilt 293000 houses in the year to March 1935.
The key implication for today is that, if a further policy actionis needed in 2012 in the face of sluggish growth or even adouble-dip recession, there is an alternative to using scal
policy or continuing with the present policy of quantitativeeasing. Even though interest rates cannot be further reduced,
monetary stimulus can be delivered by modifying the currentination-targeting framework under which the Monetary
Policy Committee operates.
A close approximation to the successful 1930s policy wouldbe to commit to a price-level target which might entail anaverage rate of ination of about 4 per cent for three years.Crucially, this would have to be clear and credible so thatthe ination was fully anticipated by the public and it would
work by reducing the real interest rate.If the lessons of the 1930s were fully taken on board, acomplementary policy would be implemented to liberalizeplanning rules and encourage private housebuilding.
It must be accepted that, while implementing these reformsenvisaged in this paper would stimulate growth, the outcomeis most unlikely to be a repeat of the 4 per cent growth rateseen in the 1930s. The output gap is probably smaller now,
consumer spending will surely be less buoyant and theEurozone crisis threatens to undermine business condenceand exports. Although these are important caveats, thefact that we cannot rely on consumers or the internationaleconomy for demand growth strengthens the case for apolicy response as it makes an early spontaneous recoveryless likely.
8/3/2019 Delivering Growth While Reducing Deficits
http://slidepdf.com/reader/full/delivering-growth-while-reducing-deficits 6/45
Delivering growth while reducing defcits
1. Introduction
The recent crisis in the UK economy has posed severedifculties for economic policymakers. After a deep
recession, growth is still anaemic, yet the government hasserious concerns about scal sustainability at a time of
large decits and rapidly rising public debt to GDP ratios.
With little scope for further reductions in nominal interestrates, it seems difcult to use monetary policy to stimulate
growth and to offset scal stringency. And while growth has
been weak, ination has been well above the target set for
the Bank of England because of the transitory impact of VATincreases, falls in the exchange rate, and energy prices. Fears
of a double-dip recession are growing yet ination hawksstill believe that interest rates should soon be increased.Keynesians worry that early decit reduction threatens to
de-rail recovery while at the same time Greece is seen as anawful warning not to delay putting the scal house in order.
In 1932, the making of economic policy also seemed verydaunting. Britain had been forced out of the gold standardand was facing a possible sovereign debt crisis, the design of
monetary policy was highly contentious, memories of Germanhyperination were still fresh, and Keynesian remedies werenot acceptable to orthodox opinion. Indeed, after a brief recovery following the devaluation in the autumn of 1931,the economy slipped back into recession in the middle of thefollowing year.
The aspect of the 1930s that is especially relevant for today isthat it represents the only experience that the UK has had of
attempting scal consolidation when nominal interest ratesare close to the lower bound and reductions in interest rates
:
8/3/2019 Delivering Growth While Reducing Deficits
http://slidepdf.com/reader/full/delivering-growth-while-reducing-deficits 7/45
Delivering growth while reducing defcits
cannot be used to offset the impact of tighter scal policy
on aggregate demand. Over the scal years 1932/33 and
1933/34 the structural budget decit was reduced by a total
of nearly 2 per cent of GDP as public expenditure was cutand taxes increased, the public debt to GDP ratio stoppedgoing up while short term interest rates stabilized at about0.6 per cent. Yet, from 1933 to 1937 there was strong growthsuch that real GDP increased by nearly 20 per cent over thatperiod.
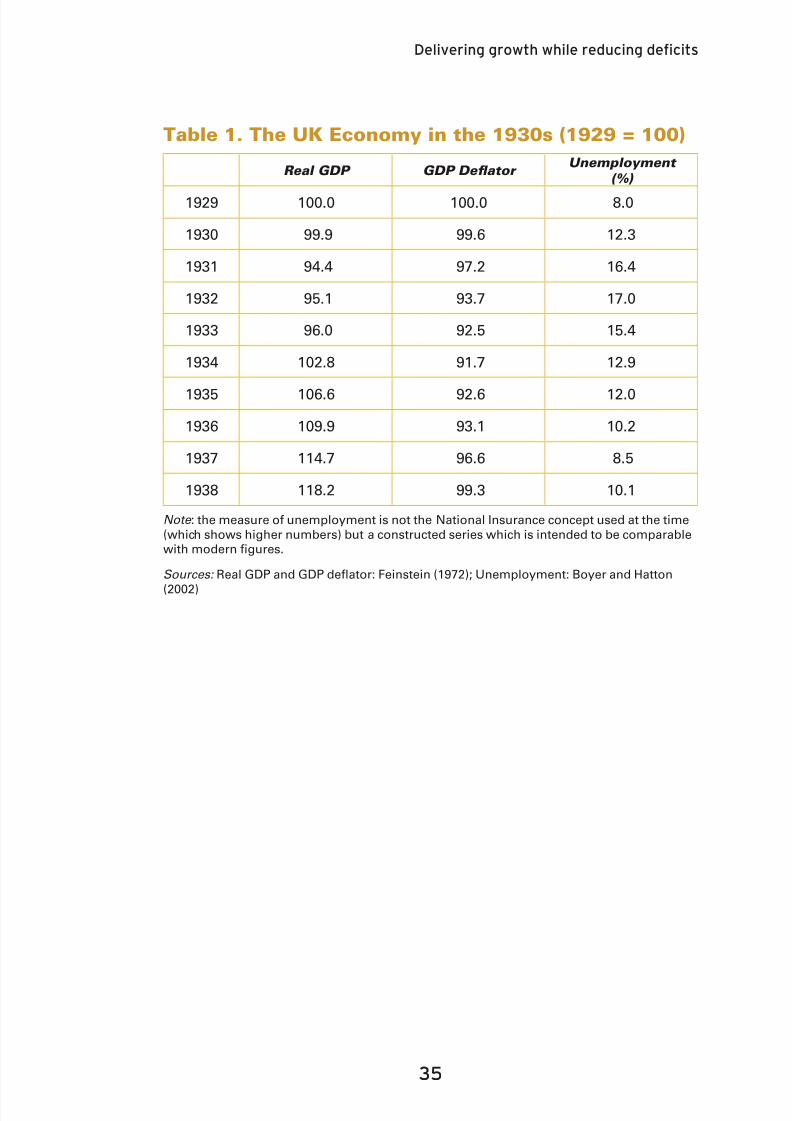
An overview of macroeconomic outcomes is reported inTable 1. The picture that we see is of an economy that went
through a severe recession such that annual output fell by5.6 per cent between 1929 and 1931 following which, aftera faltering start, real GDP grew at an annual rate of at least3.1 per cent per year in each of the years between 1933 and1937. Unemployment was always high and rose steeply inthe early 1930s but by 1937 was nearly back to the 1929level. Prices, as measured by the GDP deator, fell slowly
until 1934 but by 1937 ination was nearly 4 per cent. Thus,
contrary to many people’s perception, the initial downturn
was of similar magnitude to Britain in 2008-9.1
This is an episode that has valuable lessons for today as thispaper will show. Recovery in the 1930s did not take placeunder the auspices of ination targeting. It began while
scal policy was deationary but when control of monetarypolicy moved from the Bank of England to the Treasury. Animportant impetus to growth at the outset was housebuildingin an economy where highly restrictive planning rules were
yet to be imposed. Indeed, the experience of those yearsraises questions not only as to whether the UK monetarypolicy framework that has been in place since 1997 is stillappropriate in present circumstances, especially if scalconsolidation is to be sustained, but also as to whether
1 The fall in real GDP from peak to trough based on quarterly data was 7.2 percent (Mitchell et
al. 2011). Common beliefs about the 1930s are condioned by the persistent unemployment in
areas of Britain hit by the decline of old industries and the trade wars of the me. These structural
problems proved intractable throughout the interwar period but should not be allowed to obscure
the fact that this was nothing like the depression that the United States went through or that theeconomy was growing strongly by 1934. The Jarrow marchers are iconic but their journey in 1936
took them through prosperous southern England.

8/3/2019 Delivering Growth While Reducing Deficits
http://slidepdf.com/reader/full/delivering-growth-while-reducing-deficits 8/45
Delivering growth while reducing defcits
relaxing planning regulation might now be an importantingredient in returning to growth.
8/3/2019 Delivering Growth While Reducing Deficits
http://slidepdf.com/reader/full/delivering-growth-while-reducing-deficits 9/45
Delivering growth while reducing defcits
2. Monetary policy at the zero lower
bound
Since 1997, in common with other OECD countries, UK
monetary policy has been conducted in terms of inationtargeting by an independent central bank. The rationale forthis arrangement is to deal with the problem of ‘inationarybias’ that potentially arises from the discretionary conduct of macroeconomic policy by ministers when interest rates maybe set for short-term political reasons. The framework mightbe described as one of ‘constrained discretion’ (Allsopp andVines, 2000) rather than a rigid rules-based system like the
gold standard.In recent years, the Bank of England’s Monetary PolicyCommittee (MPC) has been mandated to maintain a CPIrate of ination of 2 per cent per year over time. Until the
current crisis, this approach had been consistent with adecent performance in terms of standard macroeconomicpolicy objectives with low ination coupled with very
modest uctuations in the level of economic activity; the UK
participated in the so-called ‘Great Moderation’. There wasgeneral political support for the MPC design established bythe Labour government although it should be noted thatthe favourable outcomes appear to have resulted to a largeextent from ‘good luck’ in terms of the shocks to which theeconomy was exposed rather than ‘good policy’ (Benati,2008).
The way in which is ination targeting by a central bank isimplemented is generally through a Taylor Rule. The central
bank raises short-term interest rates if ination is above
:
8/3/2019 Delivering Growth While Reducing Deficits
http://slidepdf.com/reader/full/delivering-growth-while-reducing-deficits 10/45
Delivering growth while reducing defcits
10
target or if GDP is above the economically sustainablelevel – in the jargon, if the ‘output gap’ is negative. Thestandard Taylor Rule is that interest rates should rise by 1.5
percentage points if ination is 1 percentage point abovetarget and by 0.5 percentage points when GDP is 1 per centabove the sustainable level. Conversely, interest rates wouldbe reduced if ination is below target or if GDP is below thesustainable level.2
There are two circumstances in which ination targeting
using a Taylor Rule runs into difculties. First, when there is
stagation such that a combination of high ination together
with a low level of output call for both high and low interestrates simultaneously. Then policymakers have to accept eitherthat ination is above target or output is below potential,
or some combination of the two. Second, the interest ratecannot be negative but this might be required by the TaylorRule. This is known as the ‘zero lower bound’ constraint.This is most likely to matter in times of deation or severe
recession especially if this is associated with a banking crisisand credit crunch (Woodford, 2011a).
The existence of the zero lower bound constraint suggeststhat in a nancial crisis or a severe recession there may be
a role for scal stimulus to raise demand. In turn, to have
the ability to run a substantial scal decit perhaps for
several years requires scal rules or institutions to ensure
that government nances are in robust shape in good times
to facilitate scal exibility in bad times (Wyplosz, 2005).
No government should run scal policy under the mistaken
belief that it has abolished boom and bust (Crafts, 2005).
The failure to ensure that public nances were sufciently
strong prior to the nancial crisis, combined with the severity
of the crisis itself means that the UK is now in a difcult
position. Not only is the optimal interest rate below zero butscal sustainability over the medium term requires decit
2 The Taylor Rule can be wrien as RS
= α + β(π – π*) + γ(Y – Y*) where π and π* are the actual
inaon rate and the target inaon rate, respecvely, and (Y – Y*) is the dierence between
real GDP and the sustainable level of real GDP. The standard values for β and γ are 1.5 and 0.5,respecvely. The term α = r* + π* where r* is the (neutral) real interest rate that is consistent with
maintaining aggregate demand at a level consistent with a zero output gap.
8/3/2019 Delivering Growth While Reducing Deficits
http://slidepdf.com/reader/full/delivering-growth-while-reducing-deficits 11/45
Delivering growth while reducing defcits
11
reduction, in particular to deal with a sizeable ‘structuralbudget decit’ in the aftermath of the crisis and to head off the possibility that the interest rates at which government
can borrow are subject to rapidly increasing risk premia(IFS, 2010). The implication is the need for a lengthy periodof scal consolidation based on some combination of expenditure cuts and tax increases but this, in the absence of offsetting interest rate reductions, risks pushing the UK backinto recession.
While the Bank of England cannot reduce its interest ratebelow zero, real interest rates can be negative. Ex post,
this means that ination has exceeded the nominal interestrate. Ex ante, an expected negative real interest rate wouldmean that the anticipated rate of ination is greater than
the nominal interest rate. In principle, the central bank canstimulate the economy by holding its interest rate downwhile encouraging people to expect ination. Indeed, this is
the classic recipe for escaping the so-called ‘liquidity trap’,much discussed in the context of Japan’s ‘lost decade’ of the1990s. Reductions in the real interest rate sustained over a
period of time have the potential to act as an expansionarypolicy so monetary policy is not impotent after all even wheninterest rates hit the zero lower bound.3
This may be easier said than done, however. There is aproblem of ‘time inconsistency’ in that the private sector mayanticipate that the central bank will change its policy as soonas the economy starts to recover. For the real interest ratepolicy instrument to be effective, it is vital that the central
bank is seen as credibly committed to future ination and therate of ination that is needed may well exceed the previoustarget rate, currently 2 per cent. This might be addressed byan upward revision of the target rate or the adoption of a
3 The central bank can manipulate short term interest rates but long term interest rates maer
for investment decisions. Given that long term rates must reect the expected sequence of short
term rates through me which it can control, the central bank can also aect long term rates but
generally with less certainty because it may be less successful in inuencing expectaons and
markets have to take a view on how the authories will respond to inaon in future. It follows
that the central bank can inuence long term real rates but less easily than short term nominalrates. For a review of these topics which concludes that policy maers for both short- and long-
term real interest rates, see Allsopp and Glyn (1999).
8/3/2019 Delivering Growth While Reducing Deficits
http://slidepdf.com/reader/full/delivering-growth-while-reducing-deficits 12/45
Delivering growth while reducing defcits
1
price-level target which would require higher ination to beachieved; either way the issue would be how to make thiscredible.4 One way to do this might be through exchange-
rate policy. Svensson (2003) suggested that a ‘foolproof’ wayto escape the liquidity trap is to combine a price-level targetpath with an initial currency devaluation and a crawlingexchange-rate peg which will require a higher price level inequilibrium and can be underpinned by creating domesticcurrency to purchase foreign exchange.
The implications of this discussion are as follows. First, inpresent circumstances, ination is not public enemy number
one; an increase in the expected rate of ination would helpavert fears of a double-dip recession. Second, conventionalination targeting at 2% may not be appropriate in present
circumstances. Third, in principle, a credible commitment toa price-level target that could only be met through signicant
ination may be preferable to the current MPC rules for the
time being. There are obvious difculties for the government
in changing the remit of the MPC, including communicatingthe new policy to the public and dealing with the political
fallout, and price-level targeting has few precedents.5 Wemight expect that such a change will only happen in a seriouscrisis and with evidence that something similar has workedin the past. It is time to turn to the 1930s.
4 A number of implicaons of this type of policy change which are favourable to recovery from the
2008/9 crisis are set out by Leunig (2009). As Leunig notes, the aim is to raise expected and actual
inaon rather than to try to exploit a Phillips Curve hypothesis that inaon and unemployment
are inversely related because people can be deceived by inaon surprises.
5 The example usually cited is the apparently successful experiment in Sweden from 1931 to 1937(Berg and Jonung, 1999). I shall argue below that de facto, though not de jure, the UK aer 1932
is another case in point.

8/3/2019 Delivering Growth While Reducing Deficits
http://slidepdf.com/reader/full/delivering-growth-while-reducing-deficits 13/45
Delivering growth while reducing defcits
1
3. A brief overview of UK
macroeconomic policy in the 1930s
In the late 1920s, macroeconomic policy in the UK economy
was organized along orthodox Victorian lines although withthe much greater burden of public debt which was the legacyof World War I. A return to the (xed exchange rate) goldstandard had been achieved in 1925 at the pre-war parity of $4.86, monetary policy was in the hands of an independentBank of England with the primary goal of sustaining this parity,and the government budget was expected at least to balanceand ideally to run a primary surplus consistent with avoidingunstable debt dynamics and indeed with the aim of slowlyreducing the debt to GDP ratio. The world economic crisiswhich erupted in 1929 and resulted in the Great Depressionwas a severe shock to this policy framework which was thenradically reformed during the 1930s.
3.1.Fiscalpolicy
Problems in the world economy were transmitted into theUK initially through declines in world trade and thus British
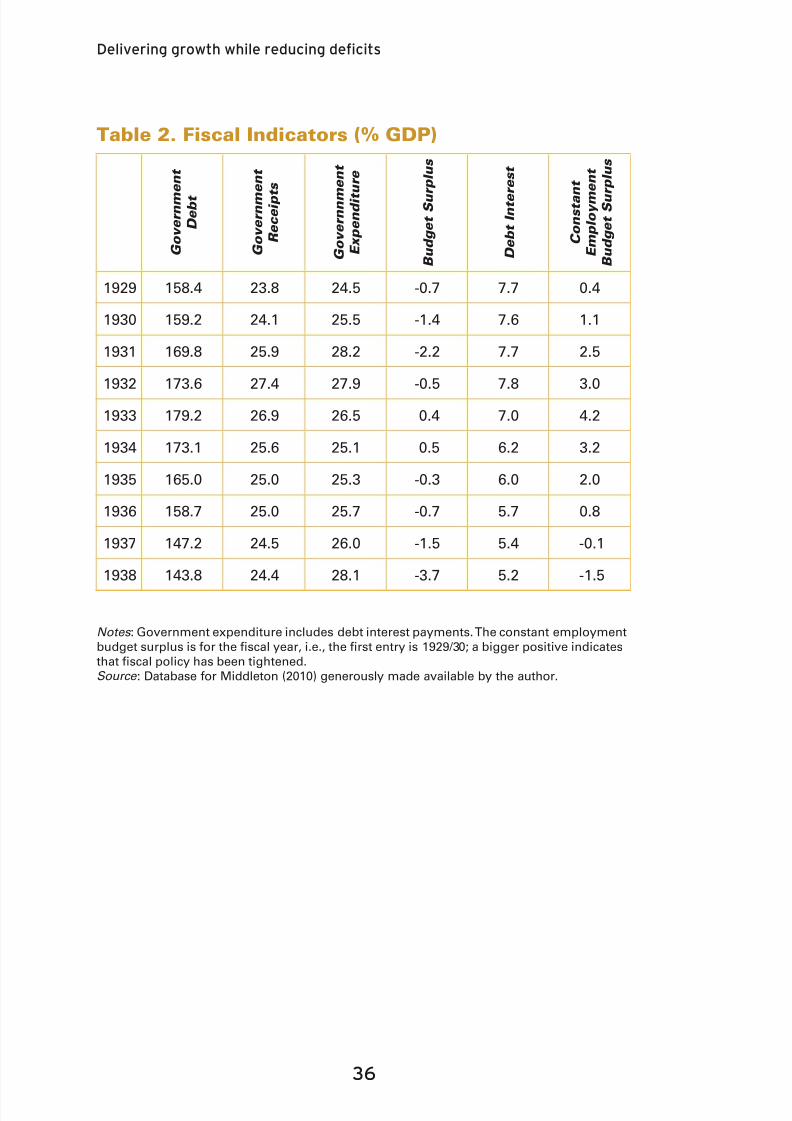
exports. The economy entered recession in 1930 and,with unemployment rising rapidly, the budgetary positiondeteriorated as tax revenues fell while transfer payments rose.The rise in the budget decit shown in Table 2 in 1930 and
1931 reects the impact of the recession on public nances
not discretionary scal stimulus. Fiscal sustainability was jeopardized by falling prices and the threat of risk premia
:
8/3/2019 Delivering Growth While Reducing Deficits
http://slidepdf.com/reader/full/delivering-growth-while-reducing-deficits 14/45
8/3/2019 Delivering Growth While Reducing Deficits
http://slidepdf.com/reader/full/delivering-growth-while-reducing-deficits 15/45
Delivering growth while reducing defcits
1
The xed exchange rate era came to an end on September18, 1931 when, in the face of massive losses of foreignexchange reserves, the UK was forced off the gold standard.
After this, the pound fell sharply against the dollar from itsgold-standard parity of $4.86 reaching a low point of $3.24in early December 1931 but recovered to $3.80 by the endof March 1932. By that point, the Treasury had decided thatit wished to lock in a devaluation of about 30 percent andmoved to a policy of implementing exchange rate targetsdened in terms rst of pegging the pound against thedollar at $3.40 and then, after the American devaluation of March 1933, against the French franc at Ffr. 88 and later at 77(Howson, 1980). The policy was underpinned through marketintervention using the Exchange Equalisation Account setup in the summer of 1932 and by a ‘cheap money’ policysymbolized by the reduction of bank rate to 2% on June 30,1932.
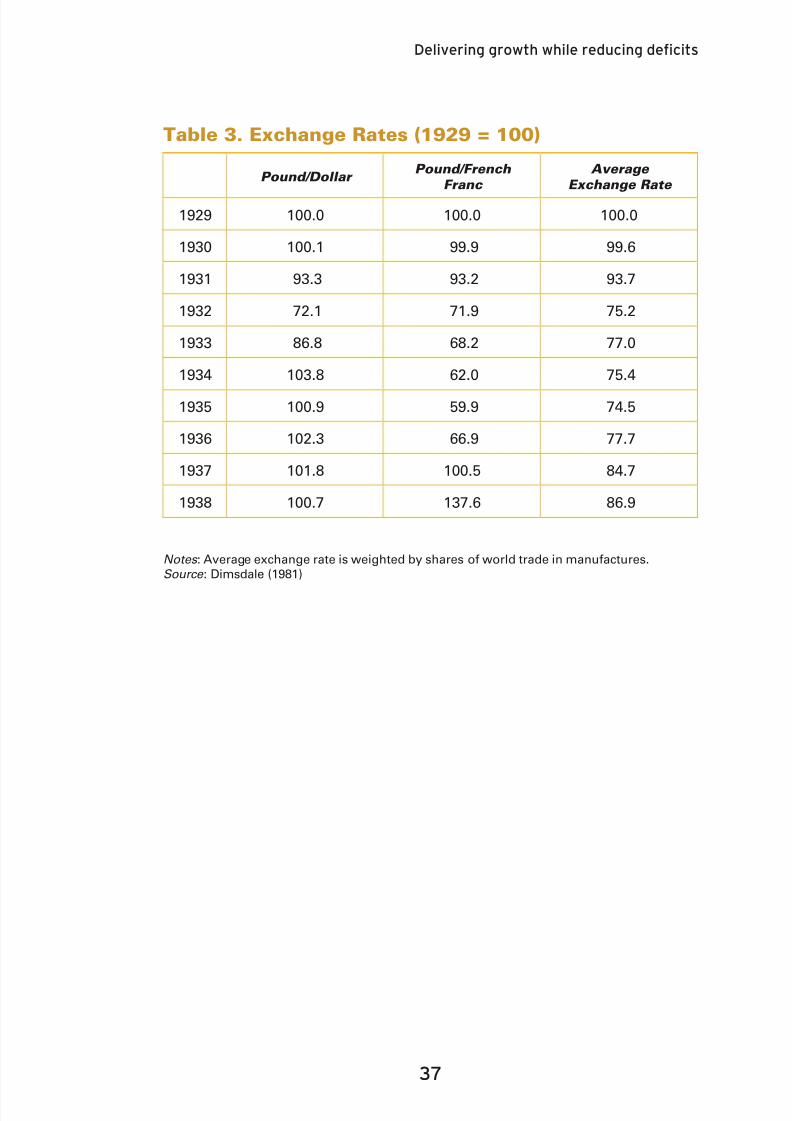
The 1930s was an era of competitive devaluations. The extentof the depreciation of the pound is best measured against anaverage of other currencies, as in Table 3, which shows that a
fall of close to 25 per cent was sustained over the period 1932to 1936. Taking into account relative ination rates, the real
exchange rate was nearly 20 per cent lower than in 1929 so thecompetitiveness of British exports was increased (Dimsdale,1981). Other implications of leaving the gold standard were,however, more important. By abandoning the xed exchange
rate, the UK regained control over its monetary policy andcould reduce interest rates, eliminated the need for deation
of prices and wages to remain competitive and reviveemployment, improved the scal arithmetic, and created an
opportunity to change inationary expectations.
3.3Monetarypolicy
Until the UK left the gold standard, the Bank of England setinterest rates with a view to maintaining the $4.86 parity. Inpractice, this meant that policy had to ensure that rates werenot out of line with foreign, especially American, interest
rates. After leaving gold, it took some time for policy to be re-
8/3/2019 Delivering Growth While Reducing Deficits
http://slidepdf.com/reader/full/delivering-growth-while-reducing-deficits 16/45
Delivering growth while reducing defcits
1
set. The opportunity to redeem the 5% War Loan was taken in
mid-1932 and £1.92 billion was converted to 3.5% War Loan
1952 saving interest payments of £28.8 million annually, a
non-trivial amount in the context of the £120 million savingsproposed by the May Committee. At the same time, the so-called ‘cheap money’ policy became reasonably settled andclearly articulated; the Treasury Bill rate fell from 3.77% in the
rst quarter of 1932 to 0.60% in the third quarter of that year,a level close to which it remained through 1938 (Howson,1975). Senior Treasury ofcials wanted the price level to riseand when the cheap money policy was introduced believedthat prices would return at least to the 1929 level by 1935.
The cheap money policy was a major change which wascentral to the recovery of the economy and acted to offsetcontractionary effects of scal consolidation once it was clear
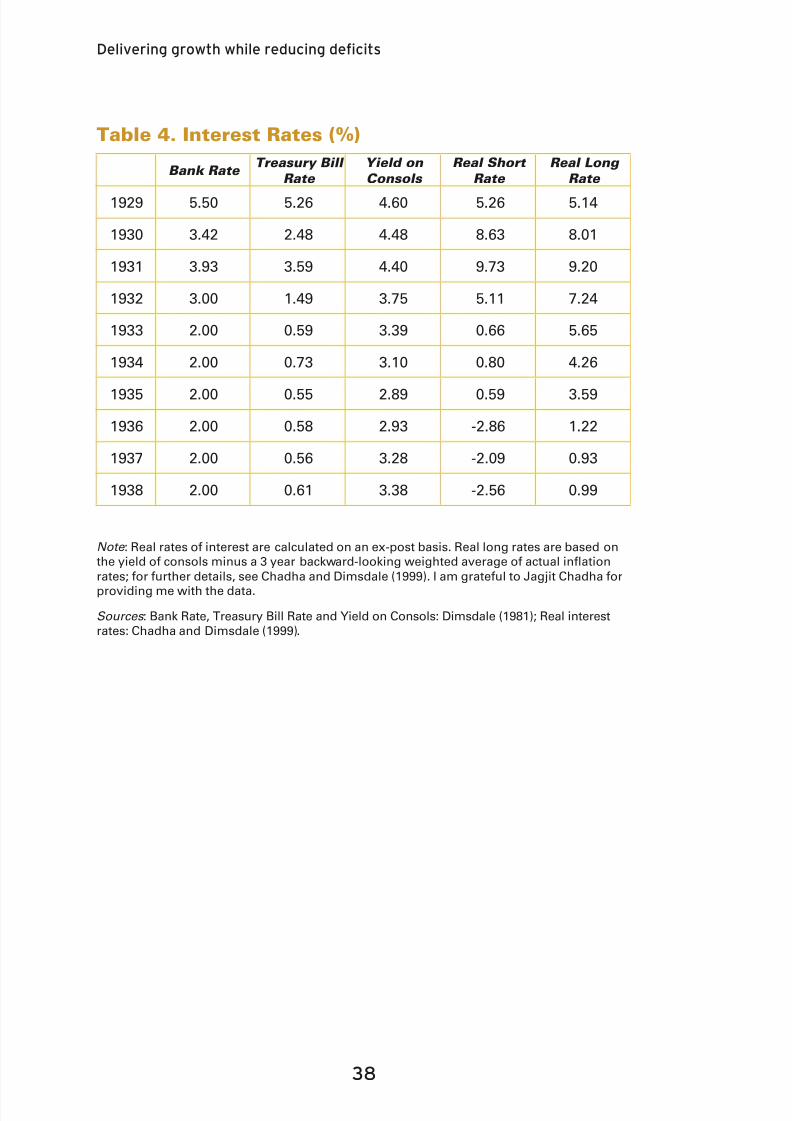
and credible. Table 4 reports short and long term nominalinterest rates and shows that long-term rates also fell. Frommid-1932, there was little scope for further nominal short terminterest rate reductions. It can also be seen in Table 4 thatex-post real interest rates fell sharply from 1932 as the price
falls of the early 1930s came to an end and then modest priceination set in. As might be expected, especially early on,
policymakers were more successful in reducing short- thanlong-term real rates but eventually both fell substantially.7
7 The esmates of long-term real rates are subject to more uncertainty than the short-term realrates, as Chadha and Dimsdale (1999) make clear. Moreover, it is ex-ante real rates that we would
really like to track but there is no reliable way of doing this prior to indexed gilts.
8/3/2019 Delivering Growth While Reducing Deficits
http://slidepdf.com/reader/full/delivering-growth-while-reducing-deficits 17/45
Delivering growth while reducing defcits
1
4. The importance of credibility
It is well-known that leaving the gold standard was good forrecovery across the world in the 1930s (Bernanke and Carey,
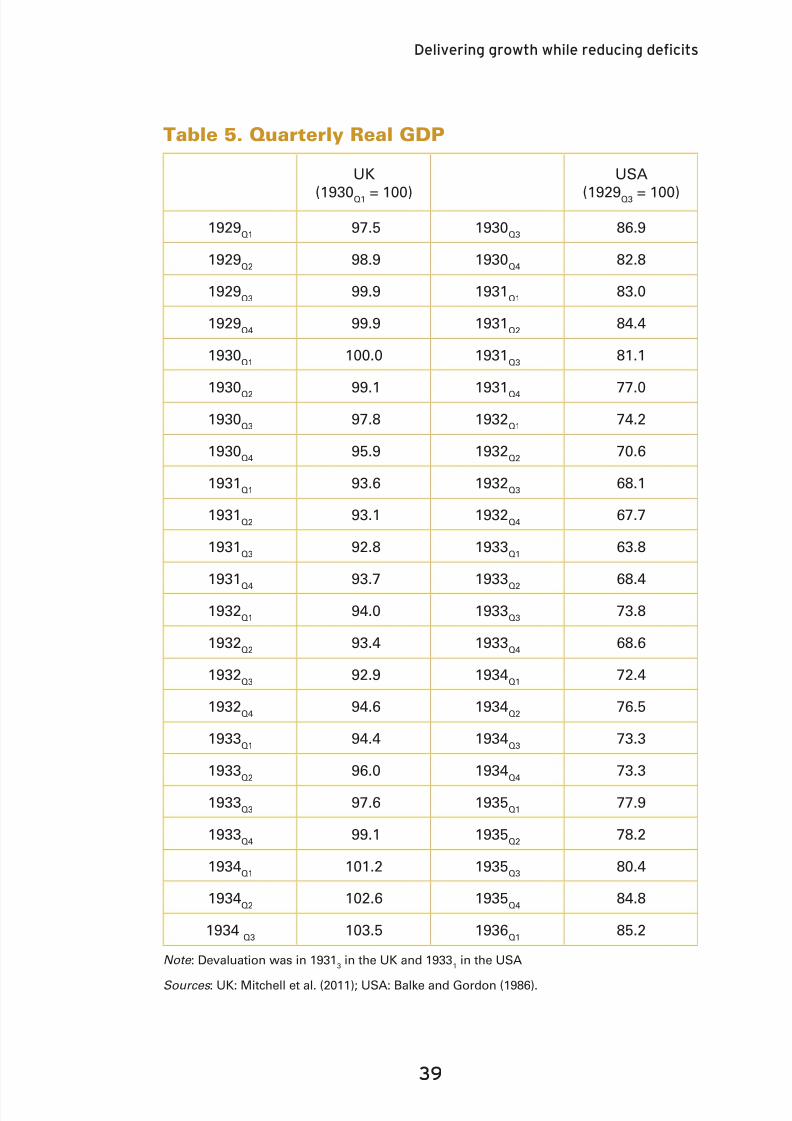
1996); crucially, it offered a route out of deation. The UKdevalued in September 1931 but this was not the signal forrapid economic growth to begin. Instead, as Table 5 reports,in the second and third quarters of 1932 the economy fell intoa double-dip recession, with the implication that real GDP ayear after devaluation had barely risen, before strong growthbecame established in mid-1933. It was not until the rstquarter of 1934 that real GDP surpassed the previous peaklevel of 4 years earlier. By contrast, Table 5 shows that the
United States did experience a surge in real GDP followingits departure from gold in March 1933; a year later real GDPwas 13 per cent higher and the economy avoided a secondrecession in the next 3 years. As is set out below, the contrastbetween the British and American experiences shows theimportance of clarity and credibility in policy formulation.
4.1‘Regimechange’intheUnitedStates
This was, of course, the era of the New Deal and it would beeasy to suppose that the difference lay in Keynesian stimulusin the United States compared with decit reduction in theUK. However, this would be a mistake. Ever since the workof Brown (1956) it has been known that the New Deal wasnot a massive scal stimulus since it was largely nancedby tax increases and the discretionary increase in the federaldecit between 1933 and 1936 was less than 3 per cent of GDP. With interest rates at the lower bound, the multiplier
effects of an aggressive Keynesian policy might have beenbig, as the estimates of Gordon and Krenn (2010) suggest,
:
8/3/2019 Delivering Growth While Reducing Deficits
http://slidepdf.com/reader/full/delivering-growth-while-reducing-deficits 18/45
Delivering growth while reducing defcits
1
but it was not tried.
The most persuasive account of the American turning point
in 1933 is to explain it as a ‘regime change’ linked to the exitfrom the gold standard (Temin and Wigmore, 1990); theyargue that the impact of the new policy stance was reected
in a doubling of share prices between March and July 1933.Recent research has claried and amplied this proposition in
the context of the zero lower bound. Eggertsson (2008) seesdevaluation as a necessary but not sufcient condition since
the key is not devaluation per se but creating inationary
expectations which reduce real interest rates by credible
commitment to raising the price level, which was an often-stated goal of the Roosevelt administration. In his analysis,the role of the New Deal and decit spending is central but
as a credible policy that raised inationary expectations
with the government targeting a return of prices to the 1926level. The calibrated dynamic stochastic general equilibriummodel used by Eggertsson (2008) to quantify his argumentpredicts that, if the regime change was seen as credible, itsimpact accounted for around 75 per cent of the rapid rise
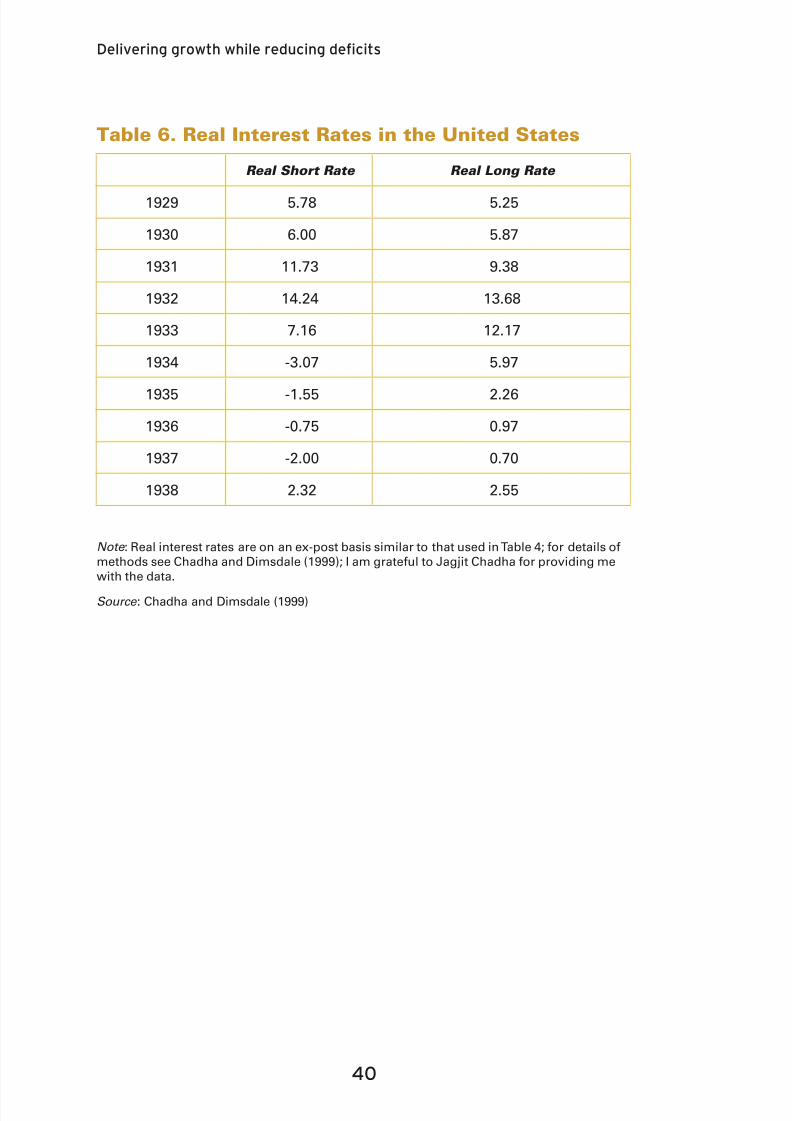
in real GDP between 1933 and 1937. It is clear from Table 6that real interest rates fell quite dramatically and very quicklywhile movements in the exchange rate, which fell to $5.10against the pound from $3.45 and remained in the range$4.90 to $5.10 during the next 4 years, and in gold reserves,which almost doubled within a year, were consistent withthe ‘foolproof way’ to escape the liquidity trap.
4.2PolicyvacuumintheUK
There is quite some contrast here with the formation andcommunication of policy in the UK. It is clear from the archivalresearch reported in Howson (1975) that during the 6 monthsafter leaving gold there was confusion and debate over thepolicy framework to adopt. The ‘cheap money’ or ‘managedeconomy’ strategy was not settled upon until the secondquarter of 1932 and in the meantime the exchange rate wasrising in early 1932 when nominal interest rates were higher
than in the summer of 1931. A comparison based on Table
8/3/2019 Delivering Growth While Reducing Deficits
http://slidepdf.com/reader/full/delivering-growth-while-reducing-deficits 19/45
Delivering growth while reducing defcits
1
4 and Table 6 shows that the declines in real interest rateswere slower to materialize after devaluation and were alsoless pronounced than in the United States. Share prices did
not reach the bottom until June 1932 and then doubled overthe next three years.
Not surprisingly, Mitchell et al. (2011) suggest that the double-dip in 1932 has to be understood in the light of the authorities’ineffectiveness in changing expectations. Given the absenceof monetary policy stimulus and the presence of large falls inworld trade, scal consolidation pushed the economy back
into recession.8 Taken together, these contrasting episodes
suggest that, while a large scal stimulus was not necessaryfor a strong upturn in the exit from the depression in the1930s, scal consolidation without a compensating boost
from monetary policy was not conducive to recovery and ranthe risk of prolonged stagnation in a difcult world economic
environment which had little to encourage businessinvestment and exports. The potential parallels with todayare readily apparent.
4.3The‘Managed-EconomyStrategy’
The Chancellor announced the objective of raising pricesat the British Empire Economic Conference at Ottawa inJuly 1932 and subsequently reiterated it frequently. The fallin the exchange rate from $3.80 in March 1932 to $3.28 inDecember 1932 is consistent with escaping the liquidity trapin the ‘Foolproof Way’, as is the sustained fall in the valueof the pound and the large increase in foreign exchange
reserves over the next four years which reected interventionby the authorities to keep the pound down (Howson, 1980).So market reactions suggest that the cheap money policyquickly became credible.
Based on archival research, economic historians haveprovided an overview of the strategy for economic recoveryafter the UK left the gold standard and control over monetaryand exchange rate policy passed from the Bank to HM
8 The best available esmates of the short-run scal mulplier at this me suggest a value of
around 1.5 (Dimsdale and Horsewood, 1995).
8/3/2019 Delivering Growth While Reducing Deficits
http://slidepdf.com/reader/full/delivering-growth-while-reducing-deficits 20/45
Delivering growth while reducing defcits
0
Treasury. Partly building on Howson (1975), Booth (1987)argued that from 1932 there was coherence in the Treasury’sthinking which deserved the label of a ‘managed-economy’
approach. The hallmark was a central objective of a steadyincrease in the price level - which on the assumption thatmoney wages would not react also amounted to reducingreal wages and restoring prots – subject to not letting
ination spiral out of control. The rise in the price level wouldbe promoted through cheap money, a weak pound, tariffs,and encouraging rms to exploit their (enhanced) market
power but fears of an inationary surge would be allayedthrough balancing the budget and intervening if necessaryto prevent a currency crisis.
This particular ‘managed-economy’ strategy is clearly quitesimilar to a price-level target. It was sustained over severalyears from the middle of 1932 onwards although prices roseby a bit less than Treasury ofcials expected and had still
not returned to the 1929 level in 1937. As Table 4 reports, itbrought about a big reduction in real interest rates comparedwith the start of the decade. On this measure, monetary
stimulus was still being provided after nominal interest ratesbottomed out. Obviously, this strategy does not represent anirrevocable commitment but it was a credible policy giventhat the Treasury and the Chancellor of the Exchequer were incharge.9 Cheap money and a rise in the price level were clearlyin the Treasury’s interests from 1932 as a route to recovery,better scal arithmetic, and to provide an alternative to the
Pandora’s Box of jettisoning balanced-budget orthodoxy and
adopting Keynesianism (Howson, 1975).
9 This would not have been the case had the Bank of England run monetary policy. GovernorNorman plainly disliked cheap money and regarded it as a temporary expedient (Howson, 1975, p.
95).
8/3/2019 Delivering Growth While Reducing Deficits
http://slidepdf.com/reader/full/delivering-growth-while-reducing-deficits 21/45
Delivering growth while reducing defcits
1
5. Economic recovery in the UK in the
1930s
As we saw in Table 1, from 1933 to 1937 the UK grewstrongly and real GDP increased by almost 20 per cent.The recovery was based on increases in expenditure whichraised aggregate demand in the context of a sizeable outputgap in the aftermath of the recession. As Table 1 shows, theunemployment rate in 1932 was around twice the level inthe business cycle peak years of 1929 and 1937 while realGDP in 1932 and 1933 was about 10 per cent below the levelimplied by the trend rate of growth. Hatton and Thomas
(2010) estimate that the equilibrium rate of unemploymentconsistent with stable ination was about 9.5% in the1930s. It is reasonable to think there was scope in 1932 forexpansionary policy to stimulate the economy.
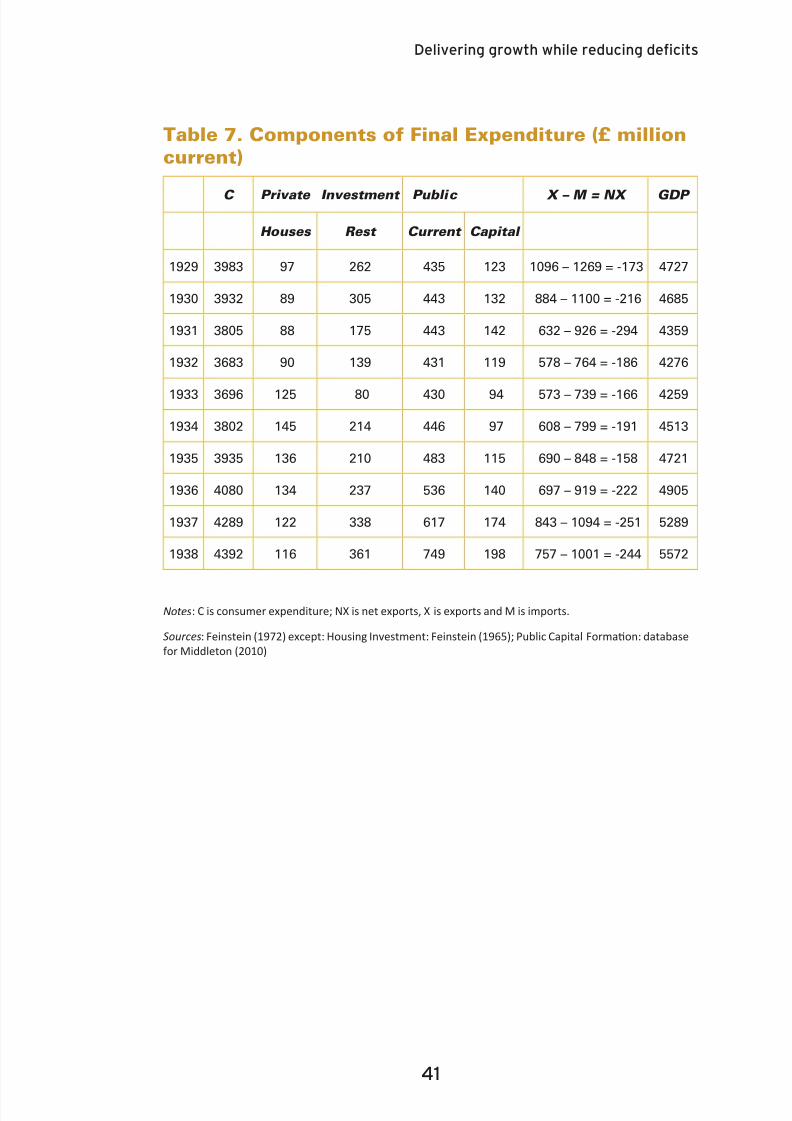
Table 7 reports on increases in demand in terms of standard macroeconomic categories. Private housebuildinginvestment has often been seen as a key component of therecovery so it is shown separately. Several points standout including the resilience of consumer expenditure,the slump in and slow recovery of exports, the at-lining
of government spending in the rst half of the 1930s, the
bounce back of other investment in 1934, and the surge inprivate housebuilding between 1932 and 1934 which waslargely maintained thereafter.
The background to these trends is as follows. Consumerexpenditure was sustained by the growth of real personaldisposable income (Broadberry, 1988); in real terms,
consumption fell in only one year, 1932, and then only by
:
8/3/2019 Delivering Growth While Reducing Deficits
http://slidepdf.com/reader/full/delivering-growth-while-reducing-deficits 22/45
Delivering growth while reducing defcits
0.6 per cent. Underpinned by falls in the price of food andincreases in employment, real income grew at over 3 per centbetween 1932 and 1935. Exports were hit by a combination
of the world economic crisis and protectionism. Governmentexpenditure and public investment were held down in the rst
half of the 1930s as a result of scal consolidation. Businessinvestment responded to lower interest rates (Broadberry,1986), improved prot expectations reected in higher shareprices and increased sales (Lund and Holden, 1968) whilebank lending was largely maintained in a climate of businessas usual in the absence of a banking crisis (Billings and Capie,2011). Housebuilding was the sector most positively affectedby the cheap money policy but was well positioned for anumber of other reasons including the behaviour of buildingsocieties, permissive land-use planning rules, and a shortfallof investment in the 1920s (Broadberry, 1987; Richardsonand Aldcroft, 1968).
Fiscal consolidation is normally deationary and there is no
obvious reason to think that this was not the case in the early1930s UK. The severity of its impact typically depends on the
extent to which it is offset by the benecial effects of currencydepreciation on net exports and by interest rate reductions(Guajardo et al., 2011). So was the strong economic recoverywhich began while scal consolidation was still in full swing
attributable to policy activism? Two possibilities need to beconsidered: protectionism and cheap money. The formermade a difference in 1932 and the latter was the main policystimulus to growth between 1933 and 1935.
As part of the so-called ‘managed-economy strategy’, the UKabandoned free trade and imposed a tariffs on manufacturesin 1932 at an average rate of nearly 20 per cent. The shareof imports in domestic demand for manufactures fell fromaround 12.5 per cent to about 9 per cent as a result of thecombined effects of the tariff and the devaluation – probablymainly the former (Kitson and Solomou, 1990); this reducedimports by about £100 million and was responsible for much
8/3/2019 Delivering Growth While Reducing Deficits
http://slidepdf.com/reader/full/delivering-growth-while-reducing-deficits 23/45
Delivering growth while reducing defcits
of the substantial improvement in net exports in 1932/3.10
The direct effects of cheap money were felt from mid-1932
onwards with reductions in nominal and real interest rates,as reported in Table 4. This has generally been thought tohave its most immediate effect through stimulus to privatehousebuilding investment which increased by £55 million, or
about 23 per cent of the increase in GDP, between 1932 and1934. The number of private unsubsidized houses built rosesharply from the 4th quarter of 1932 and almost doubled from63,000 in the half year ending September 1932 to 122,000in the half-year ending March 1934. Broadberry (1987)
estimated that about half the additional housing investmentwas due to lower interest rates. An increasing ratio of rentsto construction costs was also favourable but, as Howson(1975) stressed, the leap in housebuilding only occurred onceit was believed that construction costs had bottomed out.Here may be the most concrete illustration of the importanceof monetary policy in changing inationary expectations.
While housebuilding clearly was stimulated by the cheap
money policy, this stimulus operated in favourablecircumstances. Three aspects of the housing market wereimportant in this regard. First, mortgage nance was readilyavailable and advances by building societies rose from£86 million to £128 million between 1931/32 and 1934/35(Humphries, 1987). Second, between 1921 and 1931 thenumber of families had increased by 2.05 million but thenumber of houses by only 1.45 million; this shortfall wasmade up in the 1930s such that over the interwar period as
a whole both houses and families rose by about 3.5 million(Richardson and Aldcroft, 1968). Third, there were virtuallyno planning restrictions at this time and the period wasnotable for ‘uncontrolled’ development notably of suburbsin southern Britain (Royal Commission, 1940).
Fiscal consolidation was accompanied by strong economicgrowth in 1933 and 1934. This can be put in the context of supportive policy measures initiated in 1932 that offset its
10 This can be inferred using the method proposed by Foreman-Peck (1981) but correcng an
arithmec error in the original.
8/3/2019 Delivering Growth While Reducing Deficits
http://slidepdf.com/reader/full/delivering-growth-while-reducing-deficits 24/45
Delivering growth while reducing defcits
deationary effects. These included policies to raise netexports, in particular, by reducing imports and monetarypolicy which cut nominal interest rates and reduced real
interest rates by also changing the expected rate of ination.Adverse trends in the world economy meant that recoverywas based on domestic demand. Here the main transmissionmechanism for monetary policy worked through thestimulus to housebuilding. Growth in real personal incomesencouraged increases in real consumer spending whichrose by 8.4 per cent between 1932 and 1935 while bank andbuilding society lending was not undermined by a nancialcrisis.
In the short term, the policy stance that had evolved bymid-1932 worked reasonably well to promote economicrecovery. There are, however, two important caveats on this
judgement. First, it did relatively little to help the troubledregions of ‘Outer Britain’ whose exports were exposed tothe decline of old industries such as coal, cotton textiles,and shipbuilding and to the collapse of world trade. Second,it should be remembered, however, that while this was a
policy package which encouraged the growth of output it didnot result, as has sometimes been claimed, in a regenerationof the economy or an improvement in productivity growth.Indeed, the ‘managed economy’ of the 1930s is notable fora retreat from competition in product markets that provedvery hard to reverse and did substantial damage to long-runproductivity performance (Crafts, 2012).11
11 Average manufacturing taris were sll at the levels of the mid 1930s in the early 1960s.
8/3/2019 Delivering Growth While Reducing Deficits
http://slidepdf.com/reader/full/delivering-growth-while-reducing-deficits 25/45
Delivering growth while reducing defcits
6. Lessons for today
The experience of the 1930s offers useful lessons for today.This is to be expected since the situation in mid- 1932 had
some striking similarities with now; the economy had justbeen through a recession in which real GDP had fallen byabout 7 per cent, growth was fragile, scal consolidation wasseen as imperative, and interest rates were close to the zerolower bound. There was a threat of a double-dip recession– which actually materialized in the 1930s – and yet theeconomy was about to enjoy several years of growth at 3+per cent per year, an outcome which would be very welcomenow.
The bad news is that scal consolidation is deationary
and in a weak economy can deliver a double-dip recession;given the current weakness of public nances in the UK, the
good news is that scal stimulus is not necessary to achieve
a strong recovery from recession even when interest ratesare at the lower bound and so cannot be cut further. Thekey to promoting economic growth in the early 1930s wasto combine scal consolidation with other policies that
expanded demand, in particular, cheap money.
Cheap money was a policy package that entailed keepingshort term interest rates close to zero while raising inationaryexpectations through announcing policies intended to raisethe price level. This reduced both short and long real interestrates and then pushed the former into negative territory.The policy worked once it was clearly communicated andcommitted to. This is underlined by the contrast with the
United States in 1933 where leaving the gold standard plusthe new deal was clearly understood as regime change very
:
8/3/2019 Delivering Growth While Reducing Deficits
http://slidepdf.com/reader/full/delivering-growth-while-reducing-deficits 26/45
Delivering growth while reducing defcits
quickly and recovery started much faster.
Is it possible to repeat the experience of the UK after 1932?
The answer is maybe partly - but only with some difculty. Itis any case neither feasible nor desirable to impose tariffs noris it reasonable to expect consumer expenditure to show thebuoyancy of that period today when households are seekingto pay off debt, particularly if commodity prices continue torise. How fast the economy can grow over the next few yearsdepends on the current output gap which is quite unclear– based on extrapolation of pre-crisis trends it could be 10per cent or more but looking at business behaviour and
survey evidence on capacity utilization it could be as little as3 per cent.12
Given that interest rates are at the lower bound, a modernequivalent to the cheap money policy would be appropriateif growth continues to be weak or the economy enters adouble-dip recession. This could not be entered into lightlysince it would, at the very least, entail signicant modication
of the ination-targeting regime currently delegated to the
Monetary Policy Committee but could deliver more stimulusthan a return to quantitative easing by the Bank of England. Itis quite right that this should be tried rst. Nevertheless, at thezero lower bound, economic theory tells us that an option isto reduce real interest rates by a policy that convinces peoplethat ination will be higher in future. If further measures arerequired because the impact of quantitative easing with a2 per cent CPI target is too small, this would be the mosteffective alternative to the scal stimulus called for by the
government’s Keynesian critics.
Quantitative easing could in principle work either throughportfolio rebalancing or through signalling higher futureination. It appears that so far its main effects have come
through the former channel (Joyce et al., 2011). TheMPC’s commitment to the 2 per cent CPI target makes thatunsurprising. Although the UK has had above-target CPIination for some time now, the public’s medium-term
12 For contrasng views and a review of the evidence, see Oce of Budget Responsibility (2011) and
Marn (2011).
8/3/2019 Delivering Growth While Reducing Deficits
http://slidepdf.com/reader/full/delivering-growth-while-reducing-deficits 27/45
Delivering growth while reducing defcits
inationary expectations have changed very little duringthe crisis and the Bank has repeatedly emphasized that itscentral expectation is that ination will return to the target
rate before long as transitory inationary shocks evaporate.The MPC believes that in the medium term ination is morelikely to undershoot than overshoot the target (Bean, 2011).In sum, this suggests both that there has not been a regimechange and that the MPC remains keen to emphasize that.
The 1930s’ experience tells us that to be effective a changein monetary policy would have to be clear and credible. If it becomes necessary to go beyond the current version of
quantitative easing to a monetary policy that seeks to workby raising inationary expectations, then it will be important
formally to abandon the 2 per cent CPI target and replace itwith a new mandate for the Bank of England.
This could take the form either of raising the target rate of ination rate or of adopting a price-level target which entails a
signicant average rate of ination over a period of years. Thelatter is closer to the 1930s approach and has the advantage
that the MPC is tasked with correcting any undershootingof the intended average ination rate. The modern versionof a cheap money policy might be to aim for a 15 per centincrease in the price level over four years. In any event, thekey is to persuade the public that there will be ination, thatnominal interest rates will not be raised to counter this andthat the target is credible. Quantitative easing in its presentguise is not able to do this.13
An aspect of the 1930s economy which is remarkable tomodern eyes is that in the year to March 1935 the privatesector built 293,000 houses. This has not been matched in anyyear since the Town and Country Planning Act of 1947 despitethe rise in population, household numbers and incomes.Whereas, in the modern era, the transmission mechanismfor a cut in real interest rates works in the housing sectorprimarily through its impact on house prices, in a situationwhere the supply of housing land was elastic it could work,
13 Which is problemac, as is pointed out with regard to the current American situaon by Woodford
(2011b).
8/3/2019 Delivering Growth While Reducing Deficits
http://slidepdf.com/reader/full/delivering-growth-while-reducing-deficits 28/45
Delivering growth while reducing defcits
as in the 1930s, through an increase in the number of housesbuilt and in the equilibrium housing stock. This would bemuch more useful in generating economic growth.
On grounds of economic efciency, it is clear that a policy
of liberalizing planning restrictions is highly desirable in anycase and this could be an important complement to a policyto reduce real interest rates. House prices in the averagedistrict would be signicantly lower and the housing stock
higher (Hilber and Vermeulen, 2010; NHPAU, 2007). It is notdifcult to construct counterfactuals in which the equilibrium
housing stock in England is at least 3 million bigger than at
present and a transition from here to there could easily entailbuilding 150,000 additional houses per year for quite someyears with a direct impact on employment of around 750,000.The price signals generated by lower real interest rates anda liberalization of planning rules that made hoarding landunprotable might achieve something like this. As in the
1930s, the key would be credibly to signal that there was noadvantage in delaying construction and, as then, there is theopportunity to deal with a situation where housebuilding has
failed to keep up with growth in households.
None of this is likely to be palatable to politicians. They startedfrom a different place in the 1930s that made a strategy of this type more feasible. There were no strict planning rulesto reform and the forced exit from the gold standard meantthat in any case macroeconomic policy had to be redesigned.It is no doubt premature to think in these terms. But, if the UKdoes fall into a double-dip recession, the ideas set out here
make it clear that there is an alternative to doing nothing andalso to calls for renewed scal stimulus.
8/3/2019 Delivering Growth While Reducing Deficits
http://slidepdf.com/reader/full/delivering-growth-while-reducing-deficits 29/45
Delivering growth while reducing defcits
7. Conclusions
The 1930s offers important lessons for today’s policymakers.At that time, the UK was attempting scal consolidation with
interest rates at the lower bound but devised a policy packagethat took the economy out of a double-dip recession and intoa strong recovery. The way this was achieved was throughmonetary rather than scal stimulus.
The key to recovery both in the UK and the United States inthe 1930s was the adoption of credible policies to raise theprice level and in so doing to reduce real interest rates. Thisprovided monetary stimulus even though, as today, nominal
interest rates could not be cut further. In the UK, the ‘cheapmoney’ policy put in place in 1932 provided an importantoffset to the deationary impact of scal consolidation that
had pushed the economy into a double-dip recession in thatyear.
If economic recovery falters in 2012, it may be necessary togo beyond further quantitative easing as practised hitherto.It is important to recognize that at that point there would bean alternative to scal stimulus which might be preferable
given the weak state of public nances. The key requirement
would be to reduce real interest rates by raising inationaryexpectations.
At that point, ination targeting as currently practised in the
UK would no longer be appropriate. A possible reform wouldbe to adopt a price level target which commits the MPC toincrease the price level by a signicant amount, say 15 per
cent, over four years. In the 1930s, the Treasury succeeded in
developing a clear and credible policy to raise prices. It may
:

8/3/2019 Delivering Growth While Reducing Deficits
http://slidepdf.com/reader/full/delivering-growth-while-reducing-deficits 30/45
Delivering growth while reducing defcits
0
be necessary to adopt a similar strategy in the near future.
It would be attractive if this kind of monetary stimulus worked,
as in the 1930s, through encouraging housebuilding. Thissuggests that an important complementary policy reformwould be to liberalize the planning restrictions which makeit most unlikely that we will ever see the private sector againbuild 293000 houses in a year as happened in 1934/5.
8/3/2019 Delivering Growth While Reducing Deficits
http://slidepdf.com/reader/full/delivering-growth-while-reducing-deficits 31/45
Delivering growth while reducing defcits
1
References
Allsopp, C. J. and Glyn, A. (1999), “The Assessment: Real InterestRates”, Oxford Review of Economic Policy , 15(2), 1-16.
Allsopp, C. J. and Vines, D. (2000), “The Assessment:Macroeconomic Policy”, Oxford Review of
Economic Policy , 16(4), 1-32.
Balke, N. and Gordon, R. J. (1986), “Appendix B: Historical Data”,in R. J. Gordon (ed.), The American Business Cycle: Continuity and
Change . Chicago: University of Chicago Press, 781-850.
Bean, C. (2011), “The Economic Outlook”, speech to Council of Mortgage Lenders, November 3.
Benati, L. (2008), “The ‘Great Moderation’ in the United Kingdom”,Journal of Money, Credit, and Banking , 40, 121-147.
Berg, C. and Jonung, L. (1999), “Pioneering Price-Level Targeting:the Swedish Experience, 1931- 1937”, Journal of Monetary
Economics , 43, 525-551.
Bernanke, B. and Carey, K. (1996), “Nominal Wage Stickiness and
Aggregate Supply in the Great Depression”, Quarterly Journal of Economics , 111, 853-883.
Billings, M. and Capie, F. (2011), “Financial Crisis, Contagion, andthe British Banking System between the World Wars”, Business
History , 53, 193-215.
Booth, A. (1987), “Britain in the 1930s: a Managed Economy”,Economic History Review , 40, 499-522.
Boyer, G. R. and Hatton, T. J. (2002), “New Estimates of British
Unemployment, 1870-1913”, Journal of Economic History , 62,643-675.
Broadberry, S.N.(1986), The British Economy between the Wars: a
Macroeconomic Survey . Oxford: Basil Blackwell.
Broadberry, S. N. (1987), “Cheap Money and the Housing Boomin Interwar Britain: an Econometric Appraisal”, The Manchester
School , 55, 378-389.
Broadberry, S. N. (1988), “Perspectives on Consumption in
Interwar Britain”, Applied Economics , 20, 1465-1479
:
8/3/2019 Delivering Growth While Reducing Deficits
http://slidepdf.com/reader/full/delivering-growth-while-reducing-deficits 32/45
Delivering growth while reducing defcits
Brown, E. C. (1956), “Fiscal Policy in the Thirties: a Reappraisal”,American Economic Review , 46, 857- 879.
Chadha, J. S. and Dimsdale, N. H. (1999), “A Long View of RealRates”, Oxford Review of Economic Policy , 15(2), 17-45.
Crafts, N. (2005), “Brown’s Historical Boasts have Little Weight”,Financial Times , April 13.
Crafts, N. (2012), “British Relative Economic Decline Revisited:the Role of Competition”, Explorations in Economic History ,forthcoming.
Dimsdale, N. H. (1981), “British Monetary Policy and the ExchangeRate, 1920-1938”, Oxford Economic Papers , 33 (2, supplement),306-349.
Dimsdale, N. H. and Horsewood, N. (1995), “Fiscal Policy andEmployment in Interwar Britain: Some Evidence from a NewModel”, Oxford Economic Papers , 47, 369-396.
Eggertsson, G. B. (2008), “Great Expectations and the End of theDepression”, American Economic Review , 98, 1476-1516.
Feinstein, C. H. (1965), Domestic Capital Formation in the United
Kingdom, 1920-1938 . Cambridge: Cambridge University Press.
Feinstein, C. H. (1972), National Income, Expenditure and Output of
the United Kingdom, 1855-1965 . Cambridge: Cambridge UniversityPress.
Foreman-Peck, J. (1981), “The British Tariff and IndustrialProtection in the 1930s: an Alternative Model”, Economic History
Review , 34, 132-139.
Gordon, R. J. and Krenn, R. (2010), “The End of the GreatDepression, 1939-41: Policy Contributions and Fiscal Multipliers”,NBER Working Paper No. 16380.
Guajardo, J., Leigh, D. and Pescatori, A. (2011), ExpansionaryAusterity: New International Evidence”, IMF Working Paper No.11/158.
Hatton, T. J and Thomas, M. (2010), “Labour Markets in theInterwar Period and Economic Recovery in the UK and the USA”,Oxford Review of Economic Policy , 26, 463-485.
Hilber, C. and Vermeulen, W. (2010), The Impact of Restricting
Housing Supply on House Prices and Affordability . London:
8/3/2019 Delivering Growth While Reducing Deficits
http://slidepdf.com/reader/full/delivering-growth-while-reducing-deficits 33/45
Delivering growth while reducing defcits
Department for Communities and Local Government.
Howson, S. (1975), Domestic Monetary Management in Britain,
1919-1938 . Cambridge: Cambridge University Press.
Howson, S. (1980), “The Management of Sterling, 1932-1939”,Journal of Economic History , 40, 53- 60.
Humphries, J. (1987), “Interwar House Building, Cheap Moneyand Building Societies: the Housing Boom Revisited”, Business
History , 29, 325-345.
Institute for Fiscal Studies (2010), The Green Budget .
Joyce, M., Tong, M. and Woods, R. (2011), “The United Kingdom’s
Quantitative Easing Policy: Design, Operation and Impact”, Bank of England Quarterly Bulletin, 3, 200-212.
Kitson, M. and Solomou, S. (1990), Protectionism and Economic
Revival: the British Interwar Economy . Cambridge: CambridgeUniversity Press.
Leunig, T. (2009), “Coordinated Ination Could Bail Us Out”,Financial Times , February 15.
Lund, P. J. and Hoplden, K. (1968), “An Econometric Study of
Private Sector Gross Fixed Capital Formation in the UK, 1923-38”,Oxford Economic Papers , 20, 56-73.
Martin, B. (2011), Is the British Economy Supply-Constrained?:
a Critique of Productivity Pessimism. Cambridge: Centre forBusiness Research.
Middleton, R. (2010), “British Monetary and Fiscal Policy in the1930s”, Oxford Review of Economic Policy , 26, 414-441.
Mitchell, J., Solomou, S. and Weale, M. (2011), “Monthly GDP
Estimates for Interwar Britain”, Cambridge Working Paper inEconomics No. 1155.
National Housing and Planning Advice Unit (2007), Affordability
Matters . London.
Ofce for Budget Responsibility (2011), Economic and Fiscal
Outlook . London.
Richardson, H. W. and Aldcroft, D. H. (1968), Building in the British
Economy between the Wars . London: George Allen & Unwin.
Royal Commission on the Distribution of the Industrial Population
8/3/2019 Delivering Growth While Reducing Deficits
http://slidepdf.com/reader/full/delivering-growth-while-reducing-deficits 34/45
Delivering growth while reducing defcits
(1940), Report . London: HMSO.
Svensson, L. E. O. (2003), “Escaping from a Liquidity Trap andDeation: the Foolproof Way and Others”, Journal of Economic
Perspectives , 17(4), 145-166.
Temin, P. and Wigmore, B. A. (1990), “The End of One BigDeation”, Explorations in Economic History , 27, 483-502.
Thomas, M. (1983), “Rearmament and Economic Recovery in theLate 1930s”, Economic History Review , 36, 552-579.
Woodford, M. (2011a), “Financial Intermediation andMacroeconomic Analysis”, Journal of Economic Perspectives ,24(4), 21-44.
Woodford, M. (2011b), “Bernanke Should Clarify Policy and SinkQE3”, Financial Times , August 26.
Wyplosz, C. (2005), “Fiscal Policy: Institutions versus Rules”,National Institute Economic Review , 191, 64-78.
8/3/2019 Delivering Growth While Reducing Deficits
http://slidepdf.com/reader/full/delivering-growth-while-reducing-deficits 35/45
Delivering growth while reducing defcits
Table1.TheUKEconomyinthe1930s(1929=100)
Real GDP GDP Defator Unemployment
(%)
1929 100.0 100.0 8.0
1930 99.9 99.6 12.3
1931 94.4 97.2 16.4
1932 95.1 93.7 17.0
1933 96.0 92.5 15.4
1934 102.8 91.7 12.9
1935 106.6 92.6 12.0
1936 109.9 93.1 10.2
1937 114.7 96.6 8.5
1938 118.2 99.3 10.1
Note : the measure of unemployment is not the National Insurance concept used at the time(which shows higher numbers) but a constructed series which is intended to be comparablewith modern gures.
Sources: Real GDP and GDP deator: Feinstein (1972); Unemployment: Boyer and Hatton
(2002)
8/3/2019 Delivering Growth While Reducing Deficits
http://slidepdf.com/reader/full/delivering-growth-while-reducing-deficits 36/45
Delivering growth while reducing defcits
Table2.FiscalIndicators(%GDP)
G o v e r n m
e n t
D e b t
G o v e r n m
e n t
R e c e i p t s
G o v e r n n m
e n t
E x p e n d i t u r e
B u d g e t S u r p l u s
D e b t I n t e r e s t
C o n s t a n t
E m p l o y m
e n t
B u d g e t S u r p l u s
1929 158.4 23.8 24.5 -0.7 7.7 0.4
1930 159.2 24.1 25.5 -1.4 7.6 1.1
1931 169.8 25.9 28.2 -2.2 7.7 2.5
1932 173.6 27.4 27.9 -0.5 7.8 3.0
1933 179.2 26.9 26.5 0.4 7.0 4.2
1934 173.1 25.6 25.1 0.5 6.2 3.2
1935 165.0 25.0 25.3 -0.3 6.0 2.0
1936 158.7 25.0 25.7 -0.7 5.7 0.8
1937 147.2 24.5 26.0 -1.5 5.4 -0.1
1938 143.8 24.4 28.1 -3.7 5.2 -1.5
Notes : Government expenditure includes debt interest payments. The constant employmentbudget surplus is for the scal year, i.e., the rst entry is 1929/30; a bigger positive indicates
that scal policy has been tightened. Source : Database for Middleton (2010) generously made available by the author.
8/3/2019 Delivering Growth While Reducing Deficits
http://slidepdf.com/reader/full/delivering-growth-while-reducing-deficits 37/45
Delivering growth while reducing defcits
Table3.ExchangeRates(1929=100)
Pound/Dollar Pound/French
Franc
Average
Exchange Rate
1929 100.0 100.0 100.0
1930 100.1 99.9 99.6
1931 93.3 93.2 93.7
1932 72.1 71.9 75.2
1933 86.8 68.2 77.0
1934 103.8 62.0 75.4
1935 100.9 59.9 74.5
1936 102.3 66.9 77.7
1937 101.8 100.5 84.7
1938 100.7 137.6 86.9
Notes : Average exchange rate is weighted by shares of world trade in manufactures.Source : Dimsdale (1981)
8/3/2019 Delivering Growth While Reducing Deficits
http://slidepdf.com/reader/full/delivering-growth-while-reducing-deficits 38/45
Delivering growth while reducing defcits
Table4.InterestRates(%)
Bank Rate Treasury Bill
Rate
Yield on
Consols
Real Short
Rate
Real Long
Rate
1929 5.50 5.26 4.60 5.26 5.14
1930 3.42 2.48 4.48 8.63 8.01
1931 3.93 3.59 4.40 9.73 9.20
1932 3.00 1.49 3.75 5.11 7.24
1933 2.00 0.59 3.39 0.66 5.65
1934 2.00 0.73 3.10 0.80 4.26
1935 2.00 0.55 2.89 0.59 3.59
1936 2.00 0.58 2.93 -2.86 1.22
1937 2.00 0.56 3.28 -2.09 0.93
1938 2.00 0.61 3.38 -2.56 0.99
Note : Real rates of interest are calculated on an ex-post basis. Real long rates are based onthe yield of consols minus a 3 year backward-looking weighted average of actual ination
rates; for further details, see Chadha and Dimsdale (1999). I am grateful to Jagjit Chadha for
providing me with the data.
Sources : Bank Rate, Treasury Bill Rate and Yield on Consols: Dimsdale (1981); Real interestrates: Chadha and Dimsdale (1999).
8/3/2019 Delivering Growth While Reducing Deficits
http://slidepdf.com/reader/full/delivering-growth-while-reducing-deficits 39/45
8/3/2019 Delivering Growth While Reducing Deficits
http://slidepdf.com/reader/full/delivering-growth-while-reducing-deficits 40/45
Delivering growth while reducing defcits
0
Table6.RealInterestRatesintheUnitedStates
Real Short Rate Real Long Rate
1929 5.78 5.25
1930 6.00 5.87
1931 11.73 9.38
1932 14.24 13.68
1933 7.16 12.17
1934 -3.07 5.97
1935 -1.55 2.26
1936 -0.75 0.97
1937 -2.00 0.70
1938 2.32 2.55
Note : Real interest rates are on an ex-post basis similar to that used in Table 4; for details of methods see Chadha and Dimsdale (1999); I am grateful to Jagjit Chadha for providing mewith the data.
Source : Chadha and Dimsdale (1999)
8/3/2019 Delivering Growth While Reducing Deficits
http://slidepdf.com/reader/full/delivering-growth-while-reducing-deficits 41/45
Delivering growth while reducing defcits
1
Table7.ComponentsofFinalExpenditure(£million
current)
C Private Investment Public X – M = NX GDP
Houses Rest Current Capital
1929 3983 97 262 435 123 1096 – 1269 = -173 4727
1930 3932 89 305 443 132 884 – 1100 = -216 4685
1931 3805 88 175 443 142 632 – 926 = -294 4359
1932 3683 90 139 431 119 578 – 764 = -186 4276
1933 3696 125 80 430 94 573 – 739 = -166 4259
1934 3802 145 214 446 97 608 – 799 = -191 4513
1935 3935 136 210 483 115 690 – 848 = -158 4721
1936 4080 134 237 536 140 697 – 919 = -222 4905
1937 4289 122 338 617 174 843 – 1094 = -251 5289
1938 4392 116 361 749 198 757 – 1001 = -244 5572
Notes: C is consumer expenditure; NX is net exports, X is exports and M is imports.
Sources: Feinstein (1972) except: Housing Investment: Feinstein (1965); Public Capital Formaon: database
for Middleton (2010)

8/3/2019 Delivering Growth While Reducing Deficits
http://slidepdf.com/reader/full/delivering-growth-while-reducing-deficits 42/45
Delivering growth while reducing defcits

8/3/2019 Delivering Growth While Reducing Deficits
http://slidepdf.com/reader/full/delivering-growth-while-reducing-deficits 43/45
Delivering growth while reducing defcits

8/3/2019 Delivering Growth While Reducing Deficits
http://slidepdf.com/reader/full/delivering-growth-while-reducing-deficits 44/45
Delivering growth while reducing defcits

8/3/2019 Delivering Growth While Reducing Deficits
http://slidepdf.com/reader/full/delivering-growth-while-reducing-deficits 45/45
Delivering growth while reducing defcits