delong number
DESCRIPTION
Ferrite DeLong NumberTRANSCRIPT
WESLDINC RESEARCH SUPPLEMENT TO THE WELDING JOURNAL, JULY 1973
Sponsored by the American Welding Society and the Welding Research Council
The Ferrite Content of Austenitic Stainless Steel Weld Metal
The effect of nitrogen pickup in GTAW and
GMA W and the need for better correlation
between calculated and measured
ferrite content leads to a revised constitution
diagram and an evaluation of experimental
and statistical error.
BY C. J. LONG AND W. T. DeLONG
W. T. DeLONG is Vice President and C. J. LONG is Welding Engineer,
Teledyne McKay, York, Pennsylvania. Paper was presented at the 54th
AWS Annual Meeting held in Chicago during April 2-6, 1973.
ABSTRACT. The possibi l i ty of nitrogen incursion into the arc and weld pool must be considered in any application where austenitic stainless weld metal ferrite content is important. This is especially true in gas metal-arc welding (GMAW) and gas tungsten-arc welding (GTAW) where turbulence in the arc shielding gas flow can admit enough nitrogen to appreciably reduce the ferrite content of the deposit. Calculations of ferrite using filler metal chemistry and either the DeLong or Schaeffler diagrams will usually show a higher ferrite content than exists in the deposit, because nitrogen is picked up by the weld metal during welding.
If the Schaeffler Diagram were the only calculation tool available the nitrogen-caused differences in ferrite between filler metal and weld metal would often be difficult to explain because Schaeffler did not include a factor for nitrogen in his diagram. However, use of the actual deposit analysis and the DeLong Diagram, which takes account of the strong austenitizing effect of nitrogen, can generally explain the significant differences observed when high nitrogen pickup has occurred.
Knowledge of the effect of nitrogen and the magnetic measurement of weld deposit ferrite can be of significant help in qualifying GMAW and GTAW procedures and operators to minimize pickup of the element and thereby to provide consistent and acceptable weld metal ferrite.
The DeLong Diagram has been revised to convert it to the WRC Ferrite Number system and to reflect information obtained in the study of the GTAW and GMAW deposits described in this paper.
C o m p a r i s o n s b e t w e e n the calculated and the measured ferrite contents are made for both the Schaeffler and the revised DeLong Diagrams. On Types 308, 308L and 347 the diagrams are essentially equal in performance except where high nitrogen levels are involved, in which case the DeLong Diagram is better. For the more highly alloyed Types 316, 316L and 309 the Schaeffler Diagram understates the ferrite content so the DeLong Diagram is better for these types.
The sources and magnitudes of
WELDING RESEARCH S U P P L E M E N T ! 281-s
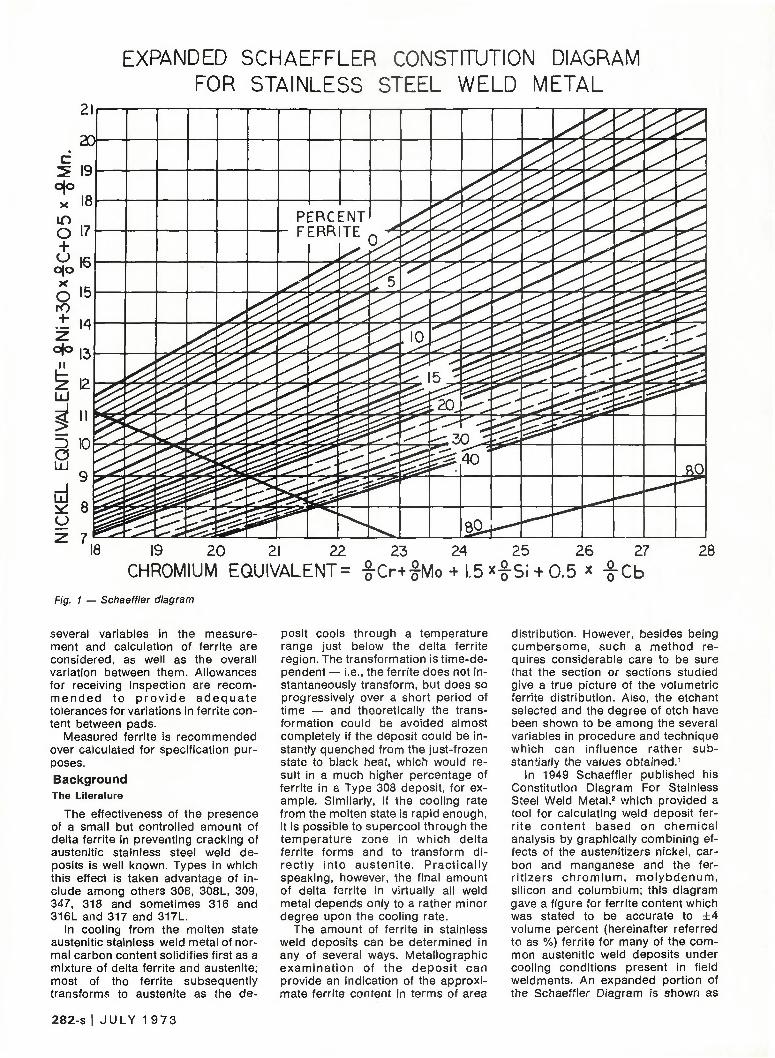
EXPANDED SCHAEFFLER CONSTITUTION DIAGRAM FOR STAINLESS STEEL WELD METAL
18 19 20 21 22 23 24 25 26 27
CHROMIUM EQUIVALENT = £Cr+§Mo + 1.5 x-g-Si + 0.5 x "rjCb 28
Fig. 1 — Schaeffler diagram
several variables in the measurement and calculation of ferrite are considered, as well as the overall variation between them. Allowances for receiving inspection are recomm e n d e d to p r o v i d e a d e q u a t e tolerances for variations in ferrite content between pads.
Measured ferrite is recommended over calculated for specification purposes.
Background The Literature
The effectiveness of the presence of a small but controlled amount of delta ferrite in preventing cracking of austenitic stainless steel weld deposits is well known. Types in which this effect is taken advantage of include among others 308, 308L, 309, 347, 318 and sometimes 316 and 316L and 317 and 317L.
In cooling f rom the molten state austenitic stainless weld metal of normal carbon content solidifies first as a mixture of delta ferrite and austenite; most of the ferrite subsequently transforms to austenite as the de
posit cools through a temperature range just below the delta ferrite region. The transformation is t ime-dependent — i.e., the ferrite does not instantaneously transform, but does so progressively over a short period of time — and theoretically the transformation could be avoided almost completely if the deposit could be instantly quenched from the just-frozen state to black heat, which would result in a much higher percentage of ferrite in a Type 308 deposit, for example. Similarly, if the cooling rate from the molten state is rapid enough, it is possible to supercool through the temperature zone in which delta ferrite forms and to transform d i rect ly into aus ten i te . Prac t ica l l y speaking, however, the final amount of delta ferrite in virtually all weld metal depends only to a rather minor degree upon the cooling rate.
The amount of ferrite in stainless weld deposits can be determined in any of several ways. Metallographic examina t i on of the depos i t can provide an indication of the approximate ferrite content in terms of area
distribution. However, besides being cumbersome, such a method requires considerable care to be sure that the section or sections studied give a true picture of the volumetric ferrite distribution. Also, the etchant selected and the degree of etch have been shown to be among the several variables in procedure and technique which can inf luence rather substantially the values obtained.1
In 1949 Schaeffler published his Constitution Diagram For Stainless Steel Weld Metal,2 which provided a tool for calculating weld deposit ferr i te con ten t based on chem ica l analysis by graphically combining effects of the austenitizers nickel, carbon and manganese and the fer-r i t izers c h r o m i u m , m o l y b d e n u m , silicon and columbium; this diagram gave a figure for ferrite content which was stated to be accurate to ± 4 volume percent (hereinafter referred to as %) ferrite for many of the common austenitic weld deposits under cooling conditions present in field weldments. An expanded portion of the Schaeffler Diagram is shown as
282-s I J U L Y 1 9 7 3
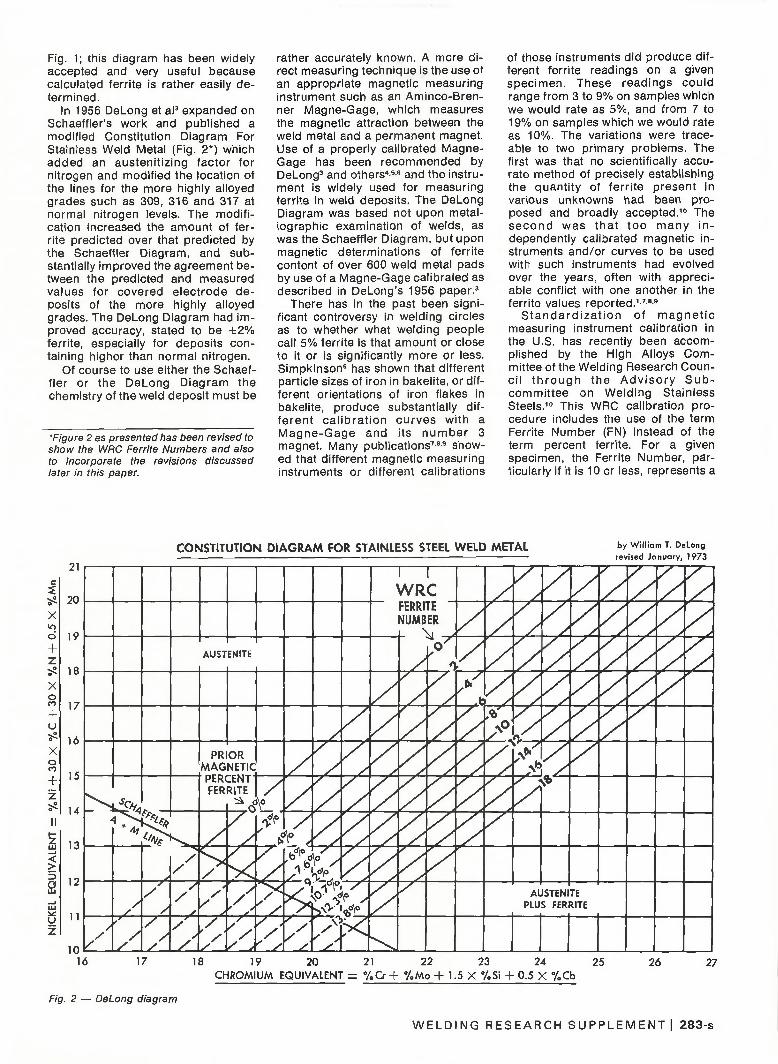
Fig. 1; this diagram has been widely accepted and very useful because calculated ferrite is rather easily determined.
In 1956 DeLong et al3 expanded on Schaeffler's work and published a modified Constitution Diagram For Stainless Weld Metal (Fig. 2*) which added an austenitizing factor for nitrogen and modified the location of the lines for the more highly alloyed grades such as 309, 316 and 317 at normal nitrogen levels. The modification increased the amount of ferrite predicted over that predicted by the Schaeffler Diagram, and substantially improved the agreement between the predicted and measured values for covered electrode deposits of the more highly alloyed grades. The DeLong Diagram had improved accuracy, stated to be ±2% ferrite, especially for deposits containing higher than normal nitrogen.
Of course to use either the Schaeffler or the DeLong Diagram the chemistry of the weld deposit must be
'Figure 2 as presented has been revised to show the WRC Ferrite Numbers and also to incorporate the revisions discussed later in this paper.
rather accurately known. A more direct measuring technique is the use of an appropriate magnetic measuring instrument such as an Aminco-Bren-ner Magne-Gage, which measures the magnetic attraction between the weld metal and a permanent magnet. Use of a properly calibrated Magne-Gage has been recommended by DeLong3 and others456 and the instrument is widely used for measuring ferrite in weld deposits. The DeLong Diagram was based not upon metallographic examination of welds, as was the Schaeffler Diagram, but upon magnetic determinations of ferrite content of over 600 weld metal pads by use of a Magne-Gage calibrated as described in DeLong's 1956 paper.3
There has in the past been significant controversy in welding circles as to whether what welding people call 5% ferrite is that amount or close to it or is significantly more or less. Simpkinson5 has shown that different particle sizes of iron in bakelite, or different orientations of iron flakes in bakelite, produce substantially different calibration curves with a Magne-Gage and its number 3 magnet. Many publications78-9 showed that different magnetic measuring instruments or different calibrations
of those instruments did produce different ferrite readings on a given specimen. These readings could range from 3 to 9% on samples which we would rate as 5%, and from 7 to 19% on samples which we would rate as 10%. The variations were traceable to two primary problems. The first was that no scientifically accurate method of precisely establishing the quantity of ferrite present in various unknowns had been proposed and broadly accepted.10 The second was that too many independently calibrated magnetic instruments and/or curves to be used with such instruments had evolved over the years, often with appreciable conflict with one another in the ferrite values reported.1-7-89
Standardizat ion of magnetic measuring instrument calibration in the U.S. has recently been accomplished by the High Alloys Committee of the Welding Research Coun-cil through the Advisory Subcommittee on Welding Stainless Steels.10 This WRC calibration procedure includes the use of the term Ferrite Number (FN) instead of the term percent ferrite. For a given specimen, the Ferrite Number, particularly if it is 10 or less, represents a
CONSTITUTION DIAGRAM FOR STAINLESS STEEL WELD METAL by Wil l iam T. DeLong
revised January, 1973
18 19 20 21 22 23 24 CHROMIUM EQUIVALENT = %Cr + %Mo + 1.5 X %Si + 0.5 X %Cb
Fig. 2 — DeLong diagram
WELDING RESEARCH S U PPLE M E NT | 283-s
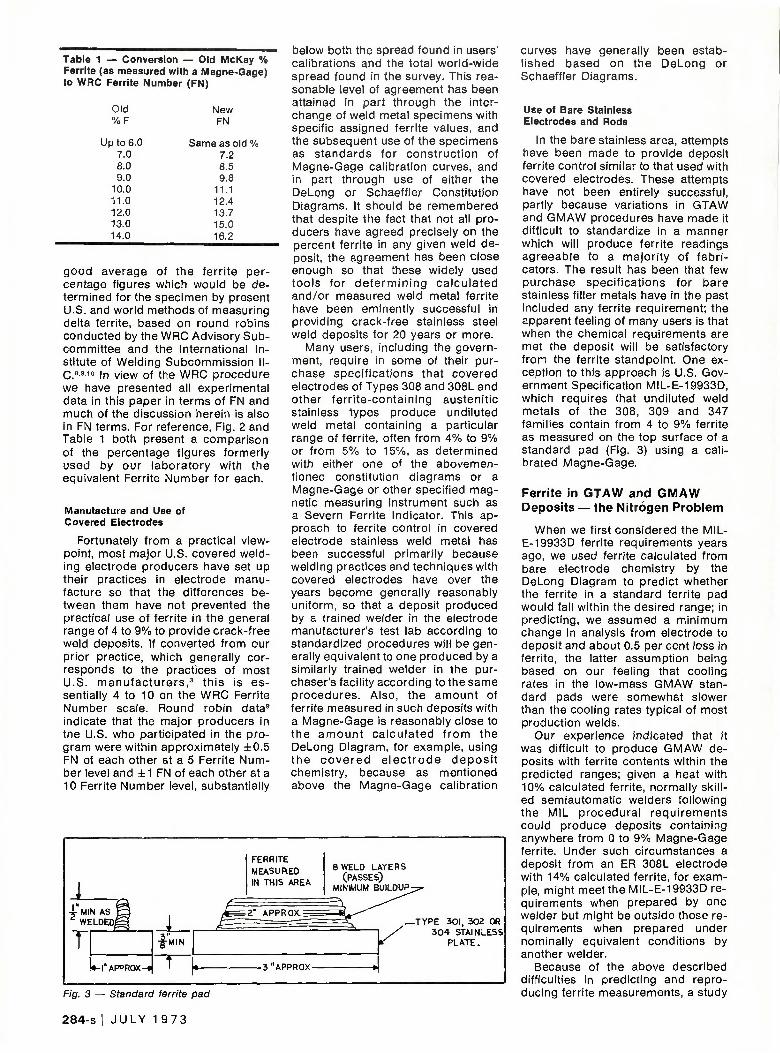
Table 1 — Conversion — Old McKay % Ferrite (as measured with a Magne-Gage) to WRC Ferrite Number (FN)
Old % F
Up to 6.0 7.0 8.0 9.0
10.0 11.0 12.0 13.0 14.0
New FN
Same as old % 7.2 8.5 9.8
11.1 12.4 13.7 15.0 16.2
good average of the ferr i te percentage figures which would be determined for the specimen by present U.S. and world methods of measuring delta ferrite, based on round robins conducted by the WRC Advisory Subcommittee and the International Institute of Welding Subcommission II-Q 8.9.10 | n V j e w 0 f t h e WRC procedure
we have presented all experimental data in this paper in terms of FN and much of the discussion herein is also in FN terms. For reference, Fig. 2 and Table 1 both present a comparison of the percentage figures formerly used by our laboratory with the equivalent Ferrite Number for each.
Manufacture and Use of Covered Electrodes
Fortunately from a practical viewpoint, most major U.S. covered welding electrode producers have set up their practices in electrode manufacture so that the differences between them have not prevented the practical use of ferrite in the general range of 4 to 9% to provide crack-free weld deposits. If converted from our prior practice, which generally corresponds to the practices of most U.S. manu fac tu re rs , 3 th is is essentially 4 to 10 on the WRC Ferrite Number scale. Round robin data8
indicate that the major producers in the U.S. who participated in the program were within approximately ±0.5 FN of each other at a 5 Ferrite Number level and ± 1 FN of each other at a 10 Ferrite Number level, substantially
below both the spread found in users' calibrations and the total world-wide spread found in the survey. This reasonable level of agreement has been attained in part through the interchange of weld metal specimens with specific assigned ferrite values, and the subsequent use of the specimens as standards for construct ion of Magne-Gage calibration curves, and in part through use of either the DeLong or Schaeffler Constitution Diagrams. It should be remembered that despite the fact that not all producers have agreed precisely on the percent ferrite in any given weld deposit, the agreement has been close enough so that these widely used too ls for d e t e r m i n i n g ca l cu la ted and/or measured weld metal ferrite have been eminently successful in providing crack-free stainless steel weld deposits for 20 years or more.
Many users, including the government, require in some of their purchase speci f icat ions that covered electrodes of Types 308 and 308L and other ferr i te-conta in ing austenit ic stainless types produce undiluted weld metal containing a particular range of ferrite, often from 4% to 9% or from 5% to 15%, as determined with either one of the abovemen-tioned constitution diagrams or a Magne-Gage or other specified magnetic measuring instrument such as a Severn Ferrite Indicator. This approach to ferrite control in covered electrode stainless weld metal has been successful primarily because welding practices and techniques with covered electrodes have over the years become generally reasonably uniform, so that a deposit produced by a trained welder in the electrode manufacturer's test lab according to standardized procedures will be generally equivalent to one produced by a similarly trained welder in the purchaser's facility according to the same procedures. Also, the amount of ferrite measured in such deposits with a Magne-Gage is reasonably close to the a m o u n t ca lcu la ted f r o m the DeLong Diagram, for example, using the c o v e r e d e l e c t r o d e d e p o s i t chemistry, because as mentioned above the Magne-Gage calibration
FERRITE MEASURED IN THIS AREA
8 WELD LAYERS (PASSES)
MINIMUM BUILDUP-
- MIN AS J WELDEDE
r»-1 APPROX -
jfMIN
-T^L -3"APPROX-
-TYPE 30I, 302 OR 304 STAINLESS
PLATE.
Fig. 3 — Standard ferrite pad
284-s I J U L Y 1 9 7 3
curves have generally been establ ished based on the DeLong or Schaeffler Diagrams.
Use of Bare Stainless Electrodes and Rods
In the bare stainless area, attempts have been made to provide deposit ferrite control similar to that used with covered electrodes. These attempts have not been entirely successful, partly because variations in GTAW and GMAW procedures have made it difficult to standardize in a manner which will produce ferrite readings agreeable to a major i ty of fabr i cators. The result has been that few purchase speci f icat ions for bare stainless filler metals have in the past included any ferrite requirement; the apparent feeling of many users is that when the chemical requirements are met the deposit will be satisfactory from the ferrite standpoint. One exception to this approach is U.S. Government Specification MIL-E-19933D, which requires that undiluted weld metals of the 308, 309 and 347 families contain from 4 to 9% ferrite as measured on the top surface of a standard pad (Fig. 3) using a calibrated Magne-Gage.
Ferrite in G T A W and G M A W Deposits — the Nitrogen Problem
When we first considered the MIL-E-19933D ferrite requirements years ago, we used ferrite calculated f rom bare electrode chemistry by the DeLong Diagram to predict whether the ferrite in a standard ferrite pad would fall within the desired range; in predicting, we assumed a minimum change in analysis from electrode to deposit and about 0.5 per cent loss in ferrite, the latter assumption being based on our feeling that cooling rates in the low-mass GMAW standard pads were somewhat slower than the cooling rates typical of most production welds.
Our experience indicated that it was difficult to produce GMAW deposits with ferrite contents within the predicted ranges; given a heat with 10% calculated ferrite, normally skil led semiautomatic welders following the MIL procedural requi rements could produce deposits containing anywhere from 0 to 9% Magne-Gage ferrite. Under such circumstances a deposit from an ER 308L electrode with 14% calculated ferrite, for example, might meet the MIL-E-19933D requirements when prepared by one welder but might be outside those requirements when prepared under nominally equivalent conditions by another welder.
Because of the above described difficulties in predicting and reproducing ferrite measurements, a study
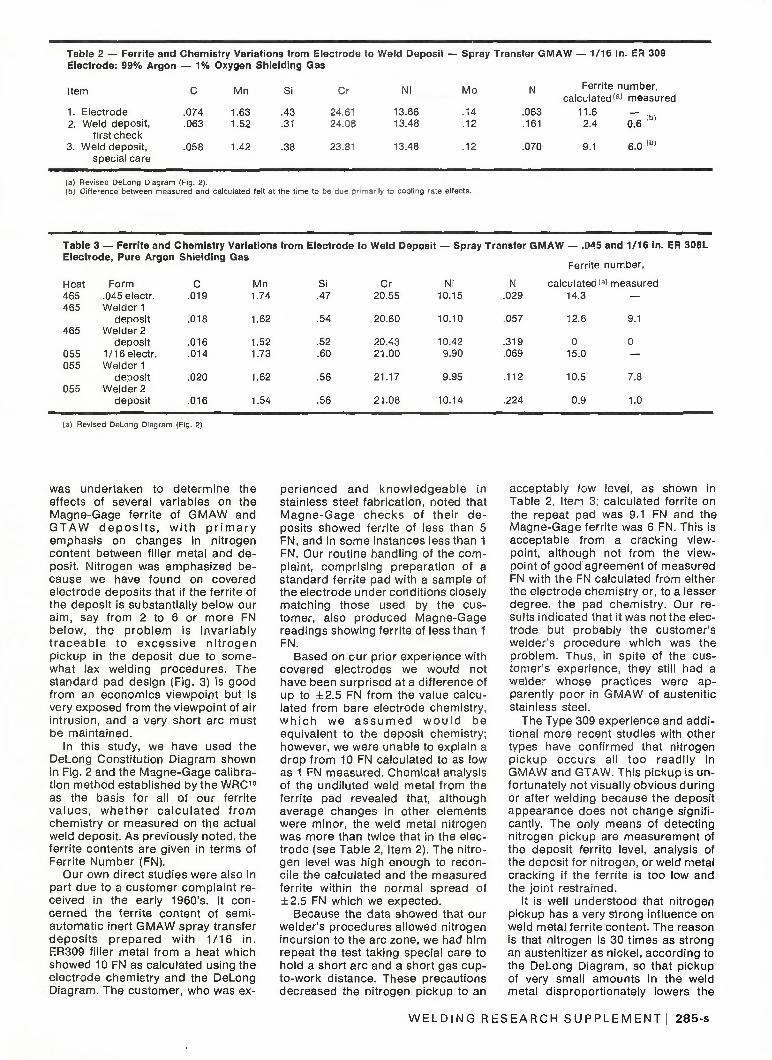
Table 2 — Ferrite and Chemistry Variations from Electrode to Weld Deposit Electrode: 99% Argon — 1 % Oxygen Shielding Gas
Spray Transfer GMAW — 1/16 In. ER 309
Item
1. Electrode 2. Weld deposit,
first check 3. Weld deposit,
special care
C
.074
.063
.058
Mr,
1.63 1.52
1.42
Si
.43
.31
.38
Cr
24.61 24.08
23.81
Ni
13.66 13.48
13.48
Mo
.14
.12
.12
N
.063
.161
.070
Ferrite number, calculated'3 ' measured
11.6 2.4
9.1
0.6 W
6.0 ,b )
{a) Revised DeLong Diagram (Fig. 2). (b) Difference between measured and calculated felt at the time to be due primarily to cooling rate effects.
Table 3 — Ferrite and Chemistry Variations from Electrode to Weld Deposit — Spray Transfer G Electrode, Pure Argon
Heat Form 465 .045 electr. 465 Welder 1
deposit 465 Welder 2
deposit 055 1/16 electr. 055 Welder 1
deposit 055 Welder 2
deposit
Shielding
C .019
.018
.016
.014
.020
.016
Gas
Mn 1.74
1.62
1.52 1.73
1.62
1.54
Si .47
.54
.52
.60
.56
.56
Cr 20.55
20.60
20.43 21.00
21.17
21.08
Ni 10.15
10.10
10.42 9.90
9.95
10.14
N .029
.057
.319
.069
.112
.224
MAW — .045 and 1/16 in. ER 308L
Ferrite number,
calculated^) measured 14.3
12.6
0 15.0
10.5
0.9
—
9.1
0
—
7.8
1.0
(a) Revised DeLong Diagram (Fig. 2)
was undertaken to determine the effects of several variables on the Magne-Gage ferrite of GMAW and G T A W d e p o s i t s , w i t h p r i m a r y emphasis on changes in nitrogen content between filler metal and deposit. Nitrogen was emphasized because we have found on covered electrode deposits that if the ferrite of the deposit is substantially below our aim, say from 2 to 6 or more FN below, the prob lem is invar iably t raceab le to excess ive n i t rogen pickup in the deposit due to somewhat lax welding procedures. The standard pad design (Fig. 3) is good from an economics viewpoint but is very exposed from the viewpoint of air intrusion, and a very short arc must be maintained.
In this study, we have used the DeLong Constitution Diagram shown in Fig. 2 and the Magne-Gage calibration method established by the WRC10
as the basis for all of our ferrite va lues, whe the r ca l cu la ted f r om chemistry or measured on the actual weld deposit. As previously noted, the ferrite contents are given in terms of Ferrite Number (FN).
Our own direct studies were also in part due to a customer complaint received in the early 1960's. It concerned the ferrite content of semiautomatic inert GMAW spray transfer deposi ts prepared with 1/16 in. ER309 filler metal from a heat which showed 10 FN as calculated using the electrode chemistry and the DeLong Diagram. The customer, who was ex
per ienced and knowledgeable in stainless steel fabrication, noted that Magne-Gage checks of their deposits showed ferrite of less than 5 FN, and in some instances less than 1 FN. Our routine handling of the complaint, comprising preparation of a standard ferrite pad with a sample of the electrode under conditions closely matching those used by the customer, also produced Magne-Gage readings showing ferrite of less than 1 FN.
Based on our prior experience with covered electrodes we would not have been surprised at a difference of up to ±2.5 FN from the value calculated from bare electrode chemistry, w h i c h we a s s u m e d w o u l d be equivalent to the deposit chemistry; however, we were unable to explain a drop from 10 FN calculated to as low as 1 FN measured. Chemical analysis of the undiluted weld metal from the ferrite pad revealed that, although average changes in other elements were minor, the weld metal nitrogen was more than twice that in the electrode (see Table 2, Item 2). The nitrogen level was high enough to reconcile the calculated and the measured ferrite within the normal spread of ±2.5 FN which we expected.
Because the data showed that our welder's procedures allowed nitrogen incursion to the arc zone, we had him repeat the test taking special care to hold a short arc and a short gas cup-to-work distance. These precautions decreased the nitrogen pickup to an
acceptably low level, as shown in Table 2, Item 3; calculated ferrite on the repeat pad was 9.1 FN and the Magne-Gage ferrite was 6 FN. This is acceptable from a cracking viewpoint, although not from the viewpoint of good agreement of measured FN with the FN calculated from either the electrode chemistry or, to a lesser degree, the pad chemistry. Our results indicated that it was not the electrode but probably the customer's welder's procedure which was the problem. Thus, in spite of the customer's experience, they still had a welder whose practices were apparently poor in GMAW of austenitic stainless steel.
The Type 309 experience and additional more recent studies with other types have confirmed that nitrogen pickup occurs all too readily in GMAW and GTAW. This pickup is unfortunately not visually obvious during or after welding because the deposit appearance does not change significantly. The only means of detecting nitrogen pickup are measurement of the deposit ferrite level, analysis of the deposit for nitrogen, or weld metal cracking if the ferrite is too low and the joint restrained.
It is well understood that nitrogen pickup has a very strong influence on weld metal ferrite content. The reason is that nitrogen is 30 times as strong an austenitizer as nickel, according to the DeLong Diagram, so that pickup of very small amounts in the weld metal disproportionately lowers the
W E L D I N G R E S E A R C H S U P P L E M E N T ! 285-s
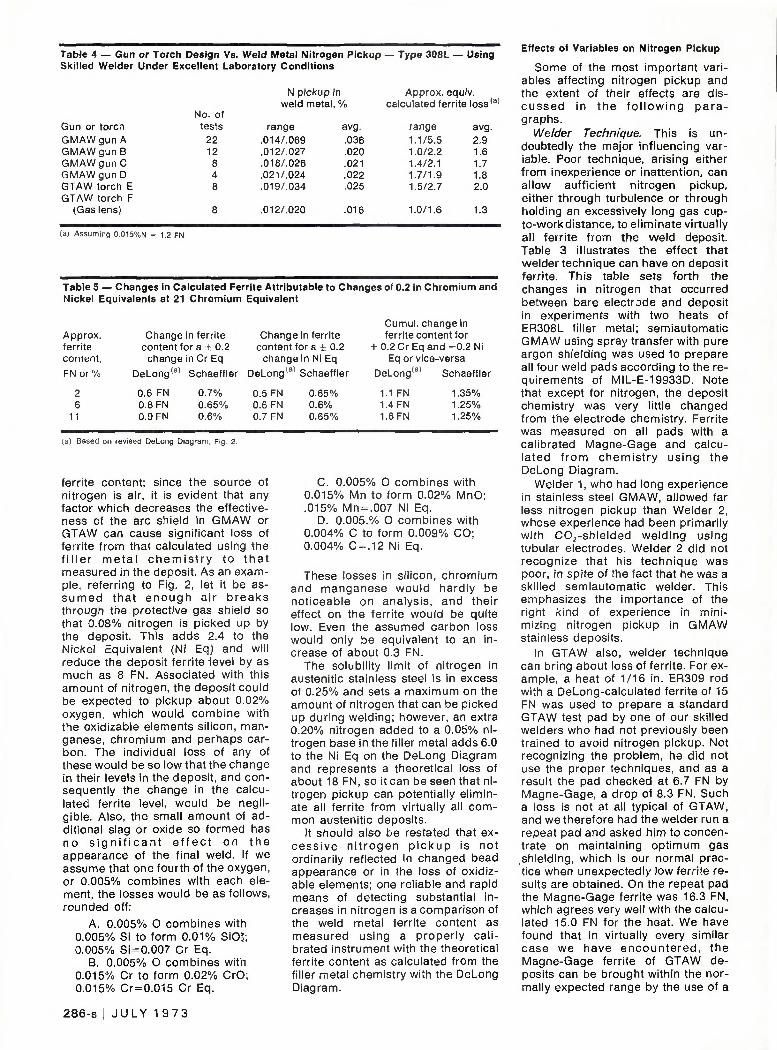
Table 4 — Gun or Torch Design Vs. Weld Metal Nitrogen Pickup — Type 308L — Using Skilled Welder Under Excellent Laboratory Conditions
Gun or torch GMAW gun A GMAW gun B G M A W g u n C GMAW gun D GTAW torch E GTAW torch F
(Gas lens)
No. of tests
22 12 8 4 8
8
N pick weld m
range
.014/.069
.012/.027
.018/.026
.021/.024
.019/.034
.012/.020
up etal
n
% avg.
.036
.020
.021
.022
.025
.016
Approx. calculated fe
range
1.1/5.5 1.0/2.2 1.4/2.1 1.7/1.9 1.5/2.7
1.0/1.6
equiv. r r i te loss ( a )
avg.
2.9 1.6 1.7 1.8 2.0
1.3
(a) Assuming 0.015%N = 1.2 FN
Table 5 — Changes in Calculated Ferrite Attributable to Changes of 0.2 in Chromium and Nickel Equivalents at 21 Chromium Equivalent
Approx. ferrite content,
FN or %
2 6
11
Change in ferrite content for a ± 0.2
change in Cr Eq
DeLong l a ) Schaeffler
0.6 FN 0.7% 0.8 FN 0.65% 0.9 FN 0.6%
Change in ferrite content for a ± 0.2
change in Ni Eq
DeLong , a ) Schaeffler
0.5 FN 0.65% 0.6 FN 0.6% 0.7 FN 0.65%
Cumul. c ferrite cc
+ 0.2Cr Eq
hange in ntentfor and - 0 . 2 Ni
Eq or vice-versa
DeLong ( a )
1.1 FN 1.4 FN 1.6 FN
Schaeffler
1.35% 1.25% 1.25%
(a) Based on revised DeLong Diagram, Fig. 2.
ferrite content; since the source of nitrogen is air, it is evident that any factor which decreases the effectiveness of the arc shield in GMAW or GTAW can cause significant loss of ferrite from that calculated using the f i l l e r m e t a l c h e m i s t r y to t h a t measured in the deposit. As an example, referring to Fig. 2, let it be ass u m e d tha t e n o u g h air b r e a k s through the protective gas shield so that 0.08% nitrogen is picked up by the deposit. This adds 2.4 to the Nickel Equivalent (Ni Eq) and will reduce the deposit ferrite level by as much as 8 FN. Associated with this amount of nitrogen, the deposit could be expected to pickup about 0.02% oxygen, which would combine with the oxidizable elements sil icon, manganese, chromium and perhaps carbon. The individual loss of any of these would be so low that the change in their levels in the deposit, and consequently the change in the calculated ferrite level, would be negligible. Also, the small amount of additional slag or oxide so formed has no s i g n i f i c a n t e f f e c t on t h e appearance of the final weld. If we assume that one fourth of the oxygen, or 0.005% combines with each element, the losses would be as follows, rounded off:
A. 0.005% O combines with 0.005% Si to form 0.01% SiOi; 0.005% Si = 0.007 Cr Eq.
B. 0.005% O combines with 0.015% Cr to form 0.02% CrO; 0.015% Cr = 0.015 Cr Eq.
C. 0.005% 0 combines with 0.015% Mn to form 0.02% MnO; .015% Mn = .007 Ni Eq.
D. 0.005.% O combines with 0.004% C to form 0.009% CO; 0.004% C = .12 Ni Eq.
These losses in sil icon, chromium and manganese would hardly be not iceable on analysis, and their effect on the ferrite would be quite low. Even the assumed carbon loss would only be equivalent to an increase of about 0.3 FN.
The solubility limit of nitrogen in austenitic stainless steel is in excess of 0.25% and sets a maximum on the amount of nitrogen that can be picked up during welding; however, an extra 0.20% nitrogen added to a 0.05% nitrogen base in the filler metal adds 6.0 to the Ni Eq on the DeLong Diagram and represents a theoretical loss of about 18 FN, so it can be seen that nitrogen pickup can potentially el iminate all ferrite from virtually all common austenitic deposits.
It should also be restated that excess i ve n i t r o g e n p i c k u p is not ordinarily reflected in changed bead appearance or in the loss of oxidizable elements; one reliable and rapid means of detecting substantial increases in nitrogen is a comparison of the weld metal ferrite content as measured using a proper ly cal i brated instrument with the theoretical ferrite content as calculated from the filler metal chemistry with the DeLong Diagram.
Effects of Variables on Nitrogen Pickup
Some of the most important variables affecting nitrogen pickup and the extent of their effects are disc u s s e d in the f o l l o w i n g p a r a graphs.
Welder Technique. This is undoubtedly the major influencing variable. Poor technique, arising either from inexperience or inattention, can allow aufficient nitrogen pickup, either through turbulence or through holding an excessively long gas cup-to-work distance, to eliminate virtually all ferr i te f rom the weld deposit. Table 3 illustrates the effect that welder technique can have on deposit ferrite. This table sets forth the changes in nitrogen that occurred between bare electrode and deposit in experiments with two heats of ER308L filler metal; semiautomatic GMAW using spray transfer with pure argon shielding was used to prepare all four weld pads according to the requirements of MIL-E-19933D. Note that except for nitrogen, the deposit chemistry was very little changed from the electrode chemistry. Ferrite was measured on all pads with a calibrated Magne-Gage and calculated f rom chemis t r y us ing the DeLong Diagram.
Welder 1, who had long experience in stainless steel GMAW, allowed far less nitrogen pickup than Welder 2, whose experience had been primarily with C0 2 -sh ie lded weld ing using tubular electrodes. Welder 2 did not recognize that his technique was poor, in spite of the fact that he was a skilled semiautomatic welder. This emphasizes the importance of the right kind of experience in minimizing nitrogen pickup in GMAW stainless deposits.
In GTAW also, welder technique can bring about loss of ferrite. For example, a heat of 1/16 in. ER309 rod with a DeLong-calculated ferrite of 15 FN was used to prepare a standard GTAW test pad by one of our skilled welders who had not previously been trained to avoid nitrogen pickup. Not recognizing the problem, he did not use the proper techniques, and as a result the pad checked at 6.7 FN by Magne-Gage, a drop of 8.3 FN. Such a loss is not at all typical of GTAW, and we therefore had the welder run a repeat pad and asked him to concentrate on maintaining opt imum gas shielding, which is our normal practice when unexpectedly low ferrite results are obtained. On the repeat pad the Magne-Gage ferrite was 16.3 FN, which agrees very well with the calculated 15.0 FN for the heat. We have found that in virtually every similar case we have e n c o u n t e r e d , the Magne-Gage ferrite of GTAW deposits can be brought within the normally expected range by the use of a
286-s I J U L Y 1 9 7 3
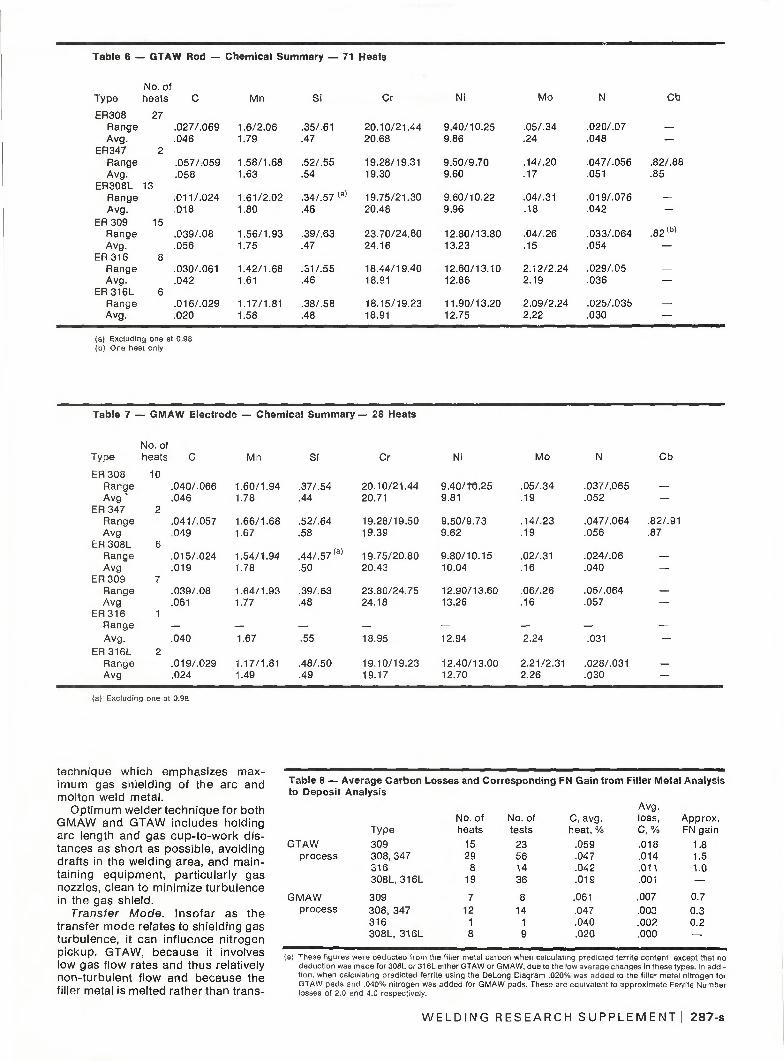
Table 6 -
Type
ER308 Range Avg.
ER347 Range Avg.
ER308L Range Avg.
ER309 Range Avg.
ER316 Range Avg.
ER316L Range Avg.
- GTAW Rod —
No. of heats
27
2
13
15
8
6
C
.027/.069
.046
.057/.059
.058
.011/.024
.018
.039/.08
.056
.030/.061
.042
.016/.029
.020
Chemical Summary — 71
Mn
1.6/2.06 1.79
1.58/1.68 1.63
1.61/2.02 1.80
1.56/1.93 1.75
1.42/1.68 1.61
1.17/1.81 1.58
Si
.35/.61
.47
.52A55
.54
.34/.57 (a)
.46
.39A63
.47
.31/.55
.46
.38/.58
.48
Heats
Cr
20.10/21.44 20.68
19.28/19.31 19.30
19.75/21.30 20.48
23.70/24.80 24.16
18.44/19.40 18.91
18.15/19.23 18.91
Ni
9.40/10.25 9.86
9.50/9.70 9.60
9.60/10.22 9.96
12.80/13.80 13.23
12.60/13.10 12.86
11.90/13.20 12.75
Mo
.05/.34
.24
.14/.20
.17
.04/.31 .18
.04/.26
.15
2.12/2.24 2.19
2.09/2.24 2.22
N
.020/.07
.048
.047/.056
.051
.019/.076
.042
.033/.064
.054
.029/.05
.036
.025/.035
.030
Cb
— —
.82A88
.85
— —
8 2 ( b )
—
— —
— —
(a) Excluding one at OS (b) One heat only
Table 7 -
Type
ER308 Range Avg "
ER347 Range Avg
ER308L Range Avg
ER309 Range Avg
ER316 Range Avg.
ER316L Range Avg
- GMAW Electrode — Chem
No. of heats
10
2
6
7
1
2
c
.040/.066
.046
.041/.057
.049
.015/.024
.019
.039/.08
.061
— .040
.019/.029
.024
Mn
1.60/1.94 1.78
1.66/1.68 1.67
1.54/1.94 1.78
1.64/1.93 1.77
— 1.67
1.17/1.81 1.49
cal Summary
Si
.37A54
.44
.52/.64
.58
.44/.57 ( a )
.50
.39/.63
.48
— .55
.48/.50
.49
— 28 Heats
Cr
20.10/21.44 20.71
19.28/19.50 19.39
19.75/20.80 20.43
23.80/24.75 24.18
— 18.95
19.10/19.23 19.17
Ni
9.40/TO.25 9.81
9.50/9.73 9.62
9.80/10.15 10.04
12.90/13.60 13.26
— 12.94
12.40/13.00 12.70
Mo
.05/.34
.19
.14/.23
.19
.02/.31
.16
.06/.26
.16
— 2.24
2.21/2.31 2.26
N
.037/.065
.052
.047/.064
.056
.024/.06
.040
.05/.064
.057
— .031
.028/.031
.030
Cb
— —
.82/.91
.87
— —
— —
— —
— —
(a) Excluding one at 0.S
technique which emphasizes maximum gas shielding of the arc and molten weld metal.
Optimum welder technique for both GMAW and GTAW includes holding arc length and gas cup-to-work distances as short as possible, avoiding drafts in the welding area, and maintaining equipment, particularly gas nozzles, clean to minimize turbulence in the gas shield.
Transfer Mode. Insofar as the transfer mode relates to shielding gas turbulence, it can influence nitrogen pickup. GTAW, because it involves low gas flow rates and thus relatively non-turbulent flow and because the filler metal is melted rather than trans-
Table 8 — Average Carbon Losses and C to Deposit Analysis
GTAW process
GMAW process
Type
309 308, 347 316 308L, 316L
309 308, 347 316 308L, 316L
No. of heats
15 29
8 19
7 12
1 8
Drresponding FN Gain from Filler Metal Analysis
No. of tests
23 56 14 36
8 14
1 9
C, avg. heat, %
.059
.047
.042
.019
.061 .047 .040 .020
Avg. loss, C, %
.018
.014
.011
.001
.007
.003
.002
.000
Approx. FN gain
1.8 1.5 1.0
— 0.7
0.3 0.2
—
(a) These figures were deducted from the filler metal carbon when calculating predicted ferrite content, except that no deduction was made for 308L or 316L either GTAW or GMAW, due to the low average changes in these types. In addition, when calculating predicted ferrite using the DeLong Diagram .020% was added to the filler metal nitrogen for GTAW pads and .040% nitrogen was added for GMAW pads. These are equivalent to approximate Ferrite Number losses of 2.0 and 4.0 respectively.
WELDING RESEARCH S U P P L E M E N T ! 287-s
ferred across the arc, which minimizes exposure of the metal, generally provides the least nitrogen pickup of the gas-shielded processes and hence the least variations in weld metal ferr i te content. A l though it would be expected that GMAW with short circuiting transfer might show somewhat greater gas turbulence than spray transfer GMAW, it is also true that short circuiting arc transfer does not involve the fine particles of molten metal which cross the arc gap in spray transfer, so the overall nitrogen pickup could be either less or greater than with spray transfer; our data are inconclusive on this point.
Gun or Torch Design. Here again the effect is related to gas turbulence. Table 4 summarizes the results obta ined in GMAW tests wi th four di f ferent gun designs f rom three manufacturers; the tests covered both spray and short-circuit ing transfer, using 99% A r - 1 % 0 2 and 90% He-7.5% Ar-2.5% C 0 2 shielding gases respectively, and both 0.045 and 1/16 in. electrode diameters. Also summarized are the results of GTAW tests wi th two c o m m e r c i a l l y ava i lab le torches, one with a gas lens and the other without. All the tests were run by the experienced Welder 1 of Table 3 and under comfor tab le and con trolled laboratory condit ions; consequently, the nitrogen increases in these tests were all relatively low.
The GMAW tests showed very little difference between Guns B, C and D, all three guns providing reasonably low weld metal nitrogen pickup; Gun A performed somewhat less well than the other three, possibly for the reasons that (a) it was in poorer overall condition than the others, having been in use in our laboratory considerably longer than they, and (b) the data shown for Gun A represent a larger number and variety of test conditions than the data shown for the other guns. As a general rule, it appears that when all are in equally good (or bad) condition no signif i c a n t d i f f e r e n c e s w i l l be seen between most commercial ly available semiautomatic GMAW guns, excep t t ha t t he s ize and o v e r a l l geometry of the gun may affect nitrogen p ickup to the extent that it prevents the welder from holding a short gas cup-to-work distance — e.g., use of a large, heavy gun to deposit a smal l fi l let weld in t ight quarters may result in lower deposit ferrite than use of a smaller lightweight gun for the same job. In GTAW, nitrogen pickup can be reduced by use of a torch which includes a gas lens. In the set of eight pairs of weld deposits prepared to compare the gas lens torch with the ordinary torch, deposits made with
Table 9 — Ferrite Data from 53 Type 308 GTAW Pads
Rod diam, Cr DeL. Sch. DeL. Sch.
Heat in. Eq(a) Ni Eq (b l Ni Eq |c | FN(d) FN (e)
Change, Change,
21.44 14.66 12.35 7.5 8.. .030 .045 .045 1/16 3/32 3/32 1/8 5/32
.045 3/32 3/32 1/8
3 — 1/16 3/32 1/8
1/16 1/8 1/8
5 — 1/16 3/32 1/8
1/16 3/32 1/8
7 —
10
11
1/16 1/16
1/16 1/16
3/32 3/32
3/32 1/8
1/16 3/32
21.67 13.67 11.57 11.9 11.7
21.21 13.30 11.14 11.0 11.7
21.29 13.80 11.70 9.6 10.1
20.96 14.13 11.76 7.1 9.3
21.01 13.92 11.52 8.0 10.0
21.51 13.05 11.37 13.3 11.
21.46 13.42 11.92 11.8 10.0
21.57 13.60 11.20 11.6 12.6
21.18 14.22 11.82 7.7 9.6
21.74 13.05 11.43 14.2 12.2
M - G l " FN
10.0(9> 9.7
12.0 7.4
10.4 9.8
10.4 9.9
10.1 11.7 , 9 )
10.2 10.8 13.6 12.0 11.4<9)
11.5 10.4 12.4
9.9 l9 )
11.5 9.5 8.6 9 .1 ( 9 )
9.1 9.1 9.0 8 . 2 ( 9 )
8.2 8.1 8.2
11.4*9) 10.7 12.1 11.6(9> 12.4 10.7 13.01a' 13.9 12.0 7.5 , 9 )
7.7 7.2
12.1 (9' 12.9 11.3
DeL. FNto M-G FN
+ 2.5 (9> + 2.4 + 4.5 - 0 . 1 + 2.9 + 2,3 + 2.9 + 2.4 + 2.6 - 0 . 2 (3)
- 1 . 7 - 1 . 1 + 1.7 + 0.1 + 0.4'9) + 0.5 - 0 . 6 + 1.4 + 0.3 l 9 )
+ 1.9 - 0 . 1 - 1 . 0 + 2.0 ( s )
+ 2.0 + 2.0 + 1.9 + 0 2 ( g >
+0.2 + 0.1 + 0.2 -1 .9 . ( 9 )
- 2 . 6 - 1 . 2 - 0 . 2 (9)
+ 0.6 - 1 . 1 + 1.4(9)
+ 2.3 + 0.4 - 0 . 3 (9)
0 - 0 . 5 _ 2 1 ( g >
- 1 . 3 - 2 . 9
Sch. FNto M-GFN
+ 1.2<9) + 1.1 + 3.2 - 1 . 4 + 1.6 + 1.0 + .1.6 + 1.1 + 1.3
0.0 (9» - 1 . 5 - 0 . 9 + 1.9 + 0.3 + 0.7'9> - 0 . 2 - 1 . 3 + 0.7 _ 0 . 2 (9)
+ 1.4 - 0 . 6 - 1 . 5 -0.2 ' 9> - 0 . 2 - 0 . 2 - 0 . 3 -1.8(9) - 1 . 8 - 1 . 9 - 1 . 8 -0.4 ( 9» - 1 . 1 + 0.3, + 1.6<gl
+ 2.4 + 0 - 7 ,„ i + 0.4 (9 )
+ 1.3 - 0 . 6 + 2.1 <9) - 1 . 9 - 2 . 4 - 0 . 1 '9 I
+ 0.7 - 0 . 9
the former contained lower nitrogen in all cases.
Joint Design and Position of Welding. Although no tests were run in these areas it seems logical that nitrogen pickup would depend upon these variables also. Both fillet welds and deep groove welds are obviously physically better shielded than welds on a flat plate. Protection against drafts would be a variable. Gas protection could be better or poorer in the vertical or overhead positions than in the flat position.
Recommendations On Average Nitrogen Pickup. From a practical viewpoint, it is necessary to assume some average nitrogen pickup from filler metal to deposit in order to supply a filler metal to a customer which will give him a reasonable ferrite level in the weld deposit — reasonable in the sense of providing enough ferrite to prevent cracking or to meet some deposit ferrite requirements or both.
When the variations in nitrogen pickup shown in the data are considered, as well as the added variations which could come from variations in production welding situations due to the influence of the joint on gas shielding, any assumptions reached must be accepted as being only approximations of the final results. With this caution in mind, we assume a GTAW pickup of 0.020% N and a GMAW pickup of 0.040% N. The GTAW figure of 0.020% is roughly equal to the average data presented and represents what we estimate would result from good practice in joints more protected than our test pads. The GMAW figure of 0.040% is above the average of the data in Table 4 but provides a factor of safety for welders less trained in and less conscious of the nitrogen problem than the welder who ran most of our later tests. As our earlier tests show, the pickup of nitrogen and the loss of ferrite can be quite high.
288 -s I J U L Y 1 9 7 3
Heat
12
13
14
15
16
17
18
19
20
21
22
23
24
25
26
27
diam, in.
3/32 3/32
— 3/32 1/8
— .045 1/16
— 1/16
— 1/16
— 3/32
— 3/32
— 1/16
— .045
— 1/16
— 3/32
— 1/16
— 1/8
— 1/18
— .035
— 3/32
Cr DeL. Sch. DeL. Sch. Eq Ni Eq Ni Eq FN FN
22.08 13.98 11.52 12.6 12.9
21.62 12.73 11.53 14.8 11.5
21.77 13.84 11.74 11.7 11,2
22.34 13.84 12.13 14,1 11,6
21.46 13.91 11.90 10.0 10.0
21.77 13.43 11.91 13.1 10.7
21.88 13.79 11.60 12.4 12.1
21.30 14.67 11.97 7.0 9.5
21.32 14.36 11.87 7.9 9.8
21.59 14.85 12.69 7.5 8.4
21.75 13.17 11.31 14.0 12.7
21.67 13.11 11.61 13.7 11.4
21.77 12.44 11.12 16.3 13.3
21.88 13.60 12.25 13.0 10.1
22.18 13.93 11.98 13.1 11.8
21.23 13.90 11.68 9.0 10.1
M-G FN
12.0*9) 11.3 12.6 11.2(9) 12.1 10.2 9.0 (8)
7.7 10.3
13.0
10.2
9.7
12.4
9.3
7.7
9.3
14.3
11.6
14.2
13.2
8.9
9.8
Change, DeL. FNto M-GFN
_0.6<9) - 1 . 3
0 -3.6(9) - 2 . 7 - 4 . 6 _2.7<9> - 4 . 0 - 1 . 4
- 1 . 1
+0.2
- 3 . 2
0
+ 2.3
- 0 . 2
+ 1.8
+ 0.3
- 2 . 1
- 2 . 1
+0.2
- 4 . 2
+0.8
Change, Sch. FN to M-GFN
-0.9<9> - 1 . 6 - 0 . 3 -0.3<9) +0.6 - 1 . 3 - 2 . 2 ( 9 )
- 3 . 5 - 0 . 9
+ 1.4
+0.2
- 1 . 0
+ 0.3
- 0 . 2
- 2 . 1
+0.9
+ 1.6
+0.2
+ 0.9
+ 3.1
- 2 . 9
- 0 . 3
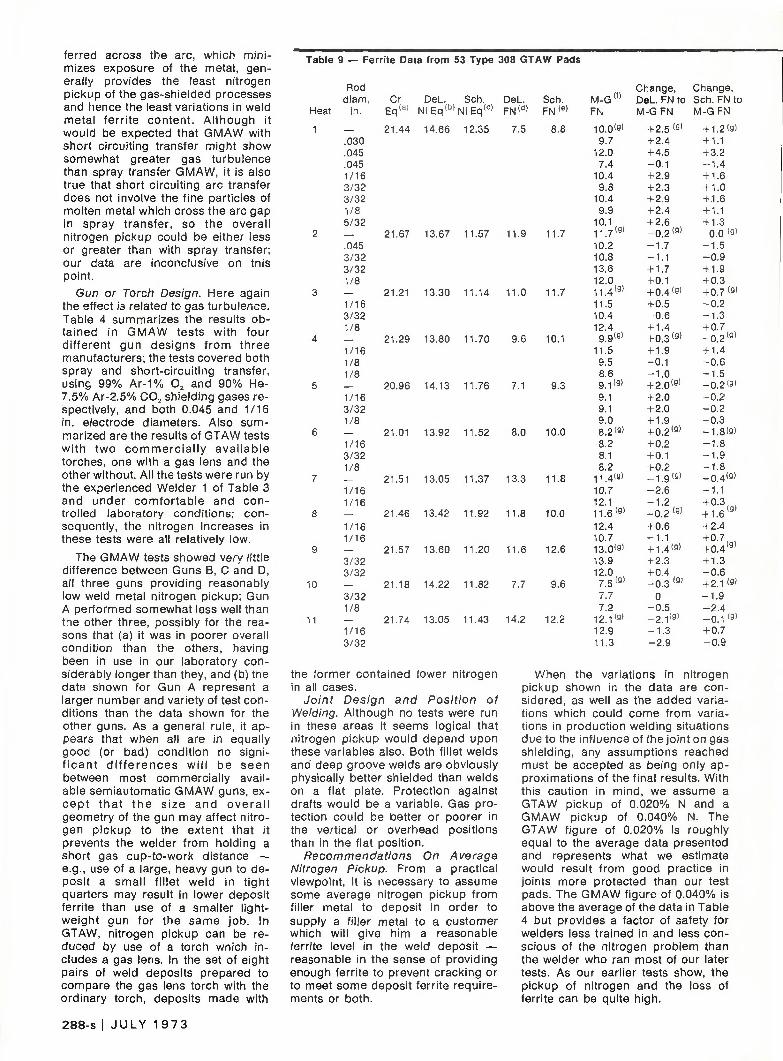
(a) Cr Eq: Chromium equivalent calculated from filler metal chemistry (= % Cr + % Mo + 1.5 X % Si + 0.5 X % Cb); Same for both DeLong and Schaeffler Diagrams
(b) DeL. Ni Eq: DeLong nickel equivalent calculated from filler metal chemistry corrected per Table 8 ( = % Ni + 30 X % C + 0.5 X % Mn•+ 30 X % N)
(c) Sch. Ni Eq: Schaeffler nickel equivalent calculated from filler metal chemistry corrected per Table 8 (+ % Ni + 30 X % C + 0.5 x % Mn)
(d) DeL. FN: Ferrite Number calculated using DeLong constitution diagram (e) Sch. FN: % ferrite calculated using Schaeffler constitution diagram (taken as equal to FN) (f) M-G FN: Ferrite Number measured on pad using Magne-Gage calibrated per WRC procedure (g) Average for heat when more than one test per heat.
Table 10 — Ferrite Data from 3 Type 347 GTAW Pads (For Explanation of Column Headings See Footnotes Table 9)
Heat
28
28
Rod diam,
in.
1/16 3/32
045
Cr Eq
20.78
20.61
DeL. N iEq
14.12
13.64
Sch. N iEq
11.84
11.63
DeL. FN
6.3
7.1
Sch. FN
8.6
8.7
M-G FN
8.4 |a )
8.2 8.6
5.8
Change, DeL. FNto
M-GFN
+ 2.1 <a)
+ 1.9 + 2.3
- 1 . 3
Change, Sch. FNto
M-G FN
- 0 . 2 (a)
- 0 . 4 0
- 2 . 9
(a) Average for heat when more than one test per heat
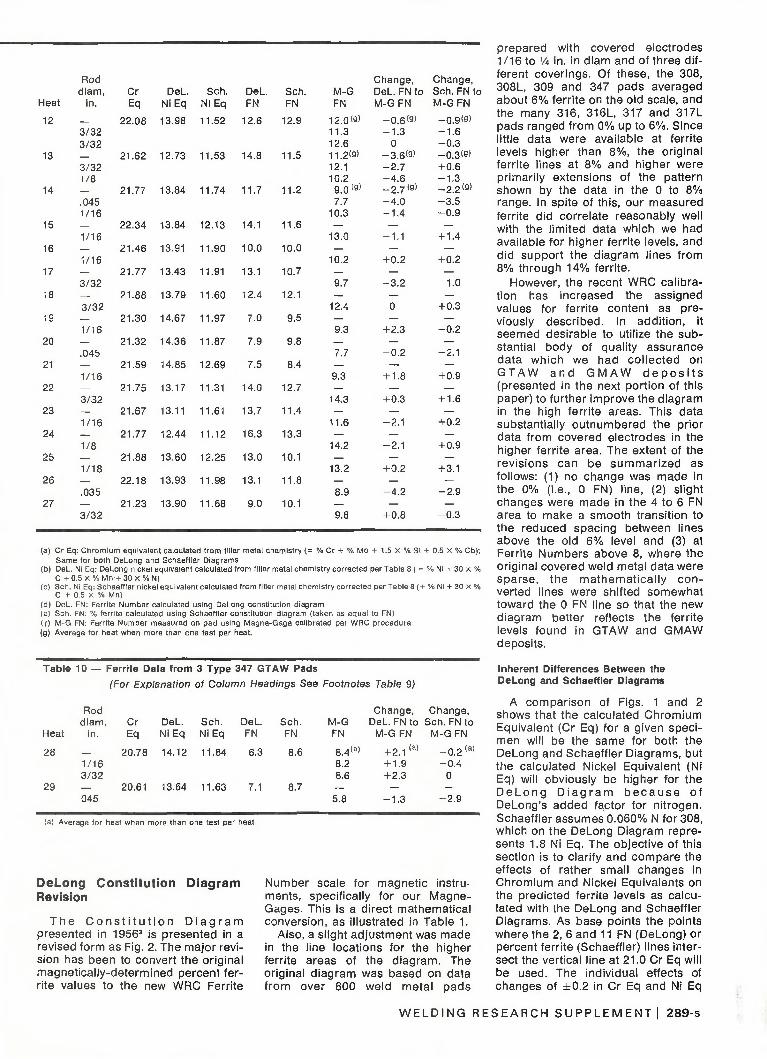
D e L o n g Const i tu t ion D i a g r a m Revision
T h e C o n s t i t u t i o n D i a g r a m presented in 19563 is presented in a revised form as Fig. 2, The major revision has been to convert the original magnetically-determined percent ferrite values to the new WRC Ferrite
Number scale for magnetic instruments, specifically for our Magne-Gages. This is a direct mathematical conversion, as illustrated in Table 1.
Also, a slight adjustment was made in the line locations for the higher ferrite areas of the diagram. The original diagram was based on data f rom over 600 weld metal pads
prepared with covered electrodes 1/16 to V* in. in diam and of three different coverings. Of these, the 308, 308L, 309 and 347 pads averaged about 6% ferrite on the old scale, and the many 316, 316L, 317 and 317L pads ranged from 0% up to 6%. Since little data were available at ferrite levels higher than 8%, the original ferrite lines at 8% and higher were primarily extensions of the pattern shown by the data in the 0 to 8% range. In spite of this, our measured ferrite did correlate reasonably well with the limited data which we had available for higher ferrite levels, and did support the diagram lines from 8% through 14% ferrite.
However, the recent WRC calibration has increased the assigned values for ferrite content as previously described. In addit ion, it seemed desirable to utilize the substantial body of quality assurance data which we had col lected on G T A W a n d G M A W d e p o s i t s (presented in the next portion of this paper) to further improve the diagram in the high ferrite areas. This data substantially outnumbered the prior data from covered electrodes in the higher ferrite area. The extent of the revisions can be summar ized as follows: (1) no change was made in the 0% (i.e., 0 FN) line, (2) slight changes were made in the 4 to 6 FN area to make a smooth transition to the reduced spacing between lines above the old 6% level and (3) at Ferrite Numbers above 8, where the original covered weld metal data were sparse, the mathemat ical ly converted lines were shifted somewhat toward the 0 FN line so that the new diagram better reflects the ferrite levels found in GTAW and GMAW deposits.
Inherent Differences Between the DeLong and Schaeffler Diagrams
A comparison of Figs. 1 and 2 shows that the calculated Chromium Equivalent (Cr Eq) for a given specimen will be the same for both the DeLong and Schaeffler Diagrams, but the calculated Nickel Equivalent (Ni Eq) will obviously be higher for the D e L o n g D i a g r a m b e c a u s e of DeLong's added factor for nitrogen. Schaeffler assumes 0.060% N for 308, which on the DeLong Diagram represents 1.8 Ni Eq. The objective of this section is to clarify and compare the effects of rather small changes in Chromium and Nickel Equivalents on the predicted ferrite levels as calculated with the DeLong and Schaeffler Diagrams. As base points the points where the 2, 6 and 11 FN (DeLong) or percent ferrite (Schaeffler) lines intersect the vertical line at 21.0 Cr Eq will be used. The individual effects of changes of ±0.2 in Cr Eq and Ni Eq
W E L D I N G R E S E A R C H S U P P L E M E N T ! 289-s
Table 11 — Ferrite Data f rom 22 Type 308L GTAW Pads
(For Explanation ot Column Headings See Footnotes
Heat
30
Rod diam,
in.
1/16 3/32 5/32
Cr DeL. Sch. Eq Ni Eq Ni Eq
21.63 14.10 11.22
DeL. FN
10.0
31 - 20.96 12.97 11.44 11.0
Sch. FN
12.6
10.0 .035 3/32 3/32
32 — 21.48 12.87 11.43 13.8 11.4
33
1/16 1/16
3/32 1/8
21.11 12.£ 11.14 12.1 11.3 •>(a)
34 — 21.40 14.10 11.40 9.0 11.3
35
36
37
38
39
40
41
42
.045 1/16
.035 1/16
3/32 I/8
1/16
3/32
3/32
1/8
3/32
.035
21.34 13.48 11.59 11.0 10.6
20.92 13.59 11.31 8.7 10.2
21.85 12.16
21.47 13.03
21.28 12.71
21.57 13.17
10.99
11.53
11.30
11.70
20.96 13.26 11.49
22.36 13.89 11.49
17.7
13.0
13.4
13.1
10.0
14.1
14.3
11.0
11.3
10.8
10.0
14.0
M-G FN
10.8 (a )
9.7 9.8
13.0 11.1 W 11.3 11.3 10.8 11.4<a» 10.8 12.0 9.9" 9.0
10.8 8.0(a)
7.3 8.8
11.9(a)
12.2 11.7 11.5<a)
12.1 11.0
14.8
11.5
12.8
11.5
10.8
10.0
Table 9)
Change, DeL. FNto
M-GFN
+ 0.8 (a)
- 0 . 3 -0 .2 + 3.0 + 0.1 <a)
+0.3 +0.3 - 0 . 2 — 2.4 ,a>
- 3 . 0 - 1 . 8 - 2 . 2 | a )
-3 .1 - 1 . 3 - 1 . 0 ( a )
-1 .7 -0 .2 + 0.9 ( a )
+ 1.2 + 0.7 + 2.8 (a )
+ 3.4
+ 2.3
- 2 . 9
- 1 . 5
- 0 . 6
- 1 . 6
+ 0.8
- 4 . 1
Change, Sch. FNto
M-GFN
- 1 . 8 - 2 . 9 - 2 . 8 +0.4 + 1.1<»>
+ 1.3 + 1.3 + 0.8
0.0'a)
- 0 . 6 + 0.6 -1.4 (a> - 2 . 3 - 0 . 5 - 3 . 3 ( a )
- 4 . 0 -2 .5 + 1.3,a» + 1.6 + 1.1 + 1.3(a)
+ 1.9 + 0.8
+ 0.5
+ 0.5
+ 1.5
+ 0.7
+ 0.8
- 4 . 0
(a) Average for heat when more than one test per heat
a n d t h e c u m u l a t i v e e f f e c t s o f a c h a n g e of + 0 . 2 Cr Eq a n d - 0 . 2 Ni Eq (or - 0 . 2 Cr Eq a n d + 0 . 2 Ni Eq) a re s h o w n in T a b l e 5. T h e v a l u e s w e r e o b t a i n e d by r e a d i n g the d i a g r a m s of F igu res 1 a n d 2 as c lose l y as p o s s i b l e .
As w o u l d be e x p e c t e d f r o m e x a m i n i n g t h e d i a g r a m s , t h e pa t t e rn is not a c o n s t a n t o n e b e c a u s e b o t h t he s p a c i n g s a n d the s l o p e s of t he c o n s tan t f e r r i t e l ines c h a n g e f r o m o n e d i a g r a m to t h e o the r . At a level of 2 FN, a g i v e n c h a n g e in Cr Eq a n d / o r Ni Eq wi l l p r o d u c e less c h a n g e in c a l c u la ted f e r r i t e on the D e L o n g D i a g r a m than o n t h e Schae f f l e r D i a g r a m ; h o w ever , at leve ls of 6 FN a n d 11 FN the reve rse is t r u e . A l s o n o t e tha t t h e c h a n g e s in c a l c u l a t e d f e r r i t e a r e ra ther s u b s t a n t i a l in v i ew of t he re la t ively s m a l l c h a n g e of 0.2 in the Cr Eq a n d Ni Eq . A 0.2 c h a n g e in Ni Eq c o u l d be p r o d u c e d by a c h a n g e of a b o u t 0 .007% in C, 0 . 0 0 7 % in N (if t h e D e L o n g D i a g r a m is used ) , 0 .2% in N i , or 0 . 4 % in M n ; a 0.2 c h a n g e in Cr Eq c o u l d be p r o d u c e d by a c h a n g e of 0 .2% in Cr , 0 . 1 4 % in S i , 0 . 2 % in M o or 0 .4% in C b .
T a b l e 5 s h o w s tha t a c h a n g e of 0.2 each in Cr Eq a n d Ni Eq w i l l , if t hey r e
i n f o r c e e a c h o the r , p r o d u c e an ove ra l l c h a n g e of a b o u t 1.1 to 1.6 FN d e p e n d i n g o n the fe r r i t e level a n d t h e d i a g r a m u s e d .
S t u d y o f G T A W a n d G M A W
D e p o s i t s
T h e f o l l o w i n g d i s c u s s i o n c o v e r s a s tudy of 129 G T A W a n d 32 G M A W d e p o s i t s p r e p a r e d by o u r Qua l i t y A s s u r a n c e (QA) D e p a r t m e n t ; M a g n e -G a g e fe r r i t e w a s c h e c k e d on al l t h e d e p o s i t s , a n d on m o s t of t h e d e pos i t s c h e m i c a l ana l yses w e r e r u n . The s tudy w a s u n d e r t a k e n fo r t h e f o l l ow ing l i s ted p u r p o s e s :
1. T o d e v e l o p a p r a c t i c a l m e t h o d fo r p r e d i c t i n g G T A W a n d G M A W d e p o s i t f e r r i t e u s i n g c h e m i c a l ana lys is of t he f i l ler m e t a l a n d the D e L o n g D i a g r a m .
2. Us ing the m e t h o d d e v e l o p e d in 1 , t o c o m p a r e t h e D e L o n g a n d Schae f f l e r D i a g r a m s in r e s p e c t of h o w c lose ly e a c h p r e d i c t s t h e G T A W a n d G M A W d e p o s i t f e r r i t e fo r t he m o r e c o m m o n f e r r i t e - b e a r i n g g r a d e s of aus ten i t i c s t a i n l ess s tee l s .
3 . T o s t u d y t h e v a r i a t i o n s in M a g n e - G a g e r e a d i n g s t yp i ca l l y e n
c o u n t e r e d in a g r o u p of weJd d e pos i t s p r e p a r e d w i th f i l ler m e t a l f r o m a g i v e n hea t a n d t y p e .
Procedure
S e v e r a l a p p r o a c h e s w e r e c o n s i d e r e d in ana l yz i ng t h e w e l d p a d s . A m o n g t h e s e w e r e (a) to c a l c u late f e r r i t e us i ng on ly t h e f i l ler m e t a l heat ana lys i s a n d c o m p a r e the resu l t s w i th t he m e a s u r e d ( M a g n e - G a g e ) fe r r i te o b t a i n e d in e a c h p a d ; (b) s a m e as (a) bu t us i ng ac tua l w e l d me ta l ana lys i s i n c l u d i n g an e s t i m a t e fo r n i t r o g e n c o n t e n t of t h e w e l d me ta l ( s ince t h e Q A w e l d m e t a l a n a l y s e s d i d no t i n c l u d e n i t r o g e n ) ; a n d (c) t o m o d i f y t h e f i l ler m e t a l hea t a n a l y s e s so as to re f lec t a n t i c i p a t e d c h a n g e s in t he c r i t i ca l e l e m e n t s c a r b o n a n d n i t r o g e n , a n d to c o m p a r e f e r r i t e c a l c u la ted f r o m the r e s u l t i n g a n a l y s e s w i th M a g n e - G a g e fe r r i t e m e a s u r e d o n the p a d s .
A p p r o a c h (c) w a s f ina l l y d e c i d e d u p o n . U s e d as t h e base w a s t h e f i l ler me ta l c h e m i s t r y d e t e r m i n e d f r o m the a v e r a g e of seve ra l tes ts o n t h e ho t ro l led r o d a n d / o r d r a w n w i r e fo r t h e e l e m e n t s c a r b o n , m a n g a n e s e , s i l i con , c h r o m i u m , n i c k e l , m o l y b d e n u m a n d c o l u m b i u m a n d the s u p p l y i n g mi l l ana l ys i s f o r n i t r o g e n . S u m m a r i e s of the f i l ler m e t a l a n a l y s e s by t y p e a re p r e s e n t e d in T a b l e 6 fo r t he r o d s used in G T A W a n d T a b l e 7 fo r t h e e l e c t r o d e s u s e d in G M A W . A c o m p a r i s o n of t he ac tua l w e l d m e t a l ana l yses w i t h t h e f i l ler me ta l c h e m i s t r ies i n d i c a t e d the f o l l o w i n g :
1. T h e r e w a s a d i s t i nc t p a t t e r n of losses in c a r b o n c o n t e n t b e t w e e n f i l ler m e t a l a n d p a d , t h e a m o u n t of c a r b o n lost d e p e n d i n g o n w i r e c a r b o n c o n t e n t a n d w e l d i n g p r o c e s s ; T a b l e 8 l ists t h e s e f i n d i n g s . In c a l c u l a t i n g " p r e d i c t e d " f e r r i t e w e m o d i f i e d t h e f i l ler me ta l c a r b o n c o n t e n t in a c c o r d a n c e w i th t he a v e r a g e losses s h o w n in T a b l e 8.
2 . A l t h o u g h s o m e t r e n d s w e r e seen i n d i c a t i n g s l i gh t a v e r a g e losses in M n , N i , Cr a n d M o (in t h e M o -b e a r i n g g r a d e s ) , w h i c h w e a s s u m e d to be p r i m a r i l y d u e to v a p o r i z a t i o n ra ther t h a n to o x i d a t i o n , w e i g n o r e d t h e m b e c a u s e (a) t h e e f fec ts w e r e la rge ly s e l f - c a n c e l l i n g , (b) t hey w o u l d i n f l uenc e c a l c u l a t e d Fer r i t e N u m b e r by no m o r e t h a n a b o u t 0.5 FN if at al l a n d (c) t h e r e w a s a q u e s t i o n as to w h e t h e r t he c h a n g e s m i g h t have b e e n d u e to n o r m a l ana ly t i ca l e r r o r in t h e X - r a y s p e c t r o g r a p h i c t e c h n i q u e s used to d e t e r m i n e t h e ana l ys i s ( re -c h e c k s us ing w e t c h e m i s t r y t e c h n i q u e s a re b e i n g m a d e to c h e c k th i s ou t ) .
In a d d i t i o n t o m o d i f y i n g t he f i l ler me ta l c a r b o n c o n t e n t fo r c a l c u l a t i o n of p r e d i c t e d w e l d m e t a l f e r r i t e , w h i c h w o u l d a p p l y t o c a l c u l a t i o n s us ing b o t h t h e D e L o n g a n d t h e S c h a e f f l e r
2 9 0 - s I J U L Y 1 9 7 3
Diagrams, we assumed a constant nitrogen pickup from the filler metal nitrogen of 0.020% for GTAW calculations and 0.040% for GMAW calculations (also listed in Table 8 for reference). These assumptions were based on the data discussed earlier in this paper.
Tables 9 through 19 list data on the 129 GTAW and 32 GMAW pads included in the study; these data are summarized by type and process in Tables 20 (GTAW) and 21 (GMAW).
An Overall G T A W and G M A W Review
Variations From Test To Test On A Single Heat
The Magne-Gage data from Tables 9 through 19 have been summarized and analyzed in Table 22 to show statistical data by types and in total for all heats on which multiple tests were run. Each test variance shown was calculated by summing the squares of the differences between individual test values and the average test value for the heat used in each test and dividing the sum so obtained by the figure (number of tests minus number of heats involved); this divisor combines the usual (n-1) small sample divisors for the data from individual heats and is the commonly accepted method of giving an overall variance for several small groups of data. Taking the square root, of the test var iance f u rn i shed the s tanda rd deviation in each case.
The data in Table 22, being based on Magne-Gage measurements, are presented in terms of Ferrite Number. As discussed earlier, the FN can be r e g a r d e d as e q u i v a l e n t to the Schaeffler percent ferrite. GTAW data from the several types are arranged in order from the type showing the lowest standard deviation to that showing the highest. The table shows what appears to be a significant trend, i.e., that the standard deviation increases appreciably as the average ferrite content increases. The combined 316 and 316L tests show an average ferrite content 5.6 FN and an average standard deviation of about 0.8 FN. The combined 308 and 308L tests average about 10.6 FN and show an average standard deviation of about 1.2 FN. Tests of the more highly alloyed 309 weld metal with about the same ferrite content as the 308 show a standard deviation of about 1.8 FN.
Although the figure for 309 may be correct and due to that type's higher alloy content, it is based on only 14 tests and with more tests the standard deviation for 309 might come down toward that of the 308 family. The overall GTAW group of 94 tests on 36 heats shows an average standard
Table 12 — Ferrite Data from 23 Type 309 GTAW Pads
(For Explanation of Column Headings See Footnotes Table 9)
Heat
43
44
45
46
47
48
49
50
51
52
53
54
55
56
57
Rod diam,
in.
1/16 3/32 3/32 1/8
.045 1/8
.045 3/32
.035 1/8
1/16 1/16
1/16 3/32
1/8
3/32
1/8
1/16
1/8
1/8
3/32
3/32
1/16
Cr Eq
24.64
25.01
24.70
25.61
24.96
24.94
24.86
25.61
24.67
25.12
25.08
24.95
25.59
25.09
24.83
DeL. N iEq
18.45
17.65
18.41
17.23
17.47
17.96
18.10
18.55
17.58
16.94
17.83
16.70
16.16
17.78
16.84
Sch. N iEq
16.17
15.28
16.13
15.13
15.37
15.86
15.58
16.15
15.18
14.51
15.43
15.11
14.57
15.38
14.38
DeL. FN
8.9
12.8
9.2
16.4
13.3
11.7
11.0
12.5
11.9
15.5
12.5
15.5
19.9
12.7
14.5
Sch. FN
7.0
9.7
7.2
11.0
9.4
8.3
8.7
9.0
9.2
11.6
9.4
9.8
12.7
9.6
11.3
M-G FN
6.8 (a )
7.1 7.1 6.7 6.2 9.7<a)
8.2 11.3
8.8 (a)
8.8 8.8
14.3<a)
13.0 15.6 12.0<a)
10.4 13.7 10.8 (a)
13.2 8.5
10.8
12.6
13.2
13.9
13.5
9.8
18.6
13.0
16.3
Change, DeL. FN to
M-GFN
-2.1 ,a> - 1 . 8 - 1 . 8 - 2 . 2 - 2 . 7 - 3 . 1 ( a )
- 4 . 6 - 1 . 5 -0.4<a> - 0 . 4 - 0 . 4 -2.1(a) - 3 . 4 - 0 . 8 -1.3 ( a» - 2 . 9 +0.4 - 0 . 9 ( a )
+ 1.5 - 3 . 2
- 0 . 2
+0.1
+ 1.3
- 1 . 4
+ 1.0
- 5 . 7
- 1 . 3
+ 0.3
+ 1.8
Change, Sch. FNto
M-GFN
- 0 . 2 ( a )
+0.1 +0.1 - 0 . 3 - 0 . 8
0.0 (a)
- 1 . 5 + 1.6 + 1.6(a)
+ 1.6 + 1.6 +3.3 ( a )
+2.0 +4.6 + 2.6 (a)
+ 1.0 +4.3 + 2.5 (a)
+4.9 +0.2
+2.1
+3.6
+4.0
+ 2.3
+4.1
0
+5.9
+ 3.4
+5.0
(a) Average for heat when more than one test per heat
Table 13 — Ferrite Data from
Heat
58
59
60
61
62
63
64
65
(For Explanation o)
Rod diam,
in.
1/8 1/8 1/8
3/32 3/32
3/32 1/8
1/16 3/32
.035
.045
.045
1/16
3/32
Cr Eq
22.29
22.14
21.80
22.02
21.19
21.78
21.59
21.50
DeL. Ni Eq
16.13
15.96
16.62
16.18
16.19
16.42
15.81
16.71
14 Type 316 GTAW Pads
' Column
Sch. N iEq
14.63
14.43
14.79
14.65
14.60
14.32
14.34
14.91
Headings See Footnotes
DeL. Sch. FN FN
6.3 5.3
6.3 5.4
3.3 3.3
5.4 4.5
2.4 1.8
3.8 4.7
4.6 4.0
2.1 1.9
M-G FN
5.2(a)
5.7 4.1 5.8 5.6<a> 4.8 6.5 5.4'a» 4.8 6.1 6 7 (a)
6.6 6.8 2.2(a> 2.2 2.2
5.9
4.4
4.8
Table 9)
Change, DeL. FNto
M-GFN
- 1 . 1 ( a )
- 0 . 6 - 2 . 2 - 0 . 5 -0.7(a) - 1 . 5 + 0.2 + 2.1(a) + 1.5 +2.8 + 1.3(a)
+ 1.2 + 1.4 -0.2 ( a> - 0 . 2 - 0 . 2
+ 2.1
- 0 . 2
+ 2.7
Change, Sch. FN to
M-GFN
- 0 . 1 ( a )
+0.4 - 1 . 2 +0.5 +0.2 ( a )
- 0 . 6 + 1.1 +2.1<a> + 1.5 +2.8 + 2.2 (a)
+2.1 +2.3 +0.4 ( a l
+0.4 +0.4
+ 1.2
+0.4
+ 2.9
(a) Average for heat when more than one test per heat
W E L D I N G R E S E A R C H S U P P L E M E N T ! 291 -s
Table 14 — Ferrite Data from 14 Type 316L GTAW Pads
(For Explanation of Column Headings See Footnotes Table 9)
Heat
66
67
68
69
70
71
Rod diam,
in.
.045
.045 1/16 1/8
.035
.045 1/16 1/8
3/32 3/32 1/8
3/32
3/32
3/32
Cr Eq
21.67
22.26
21.02
22.06
21.85
21.97
DeL. N iEq
15.83
15.29
16.00
15.92
15.69
14.87
Sch. Ni Eq
14.48
13.76
14.53
14.48
14.10
13.22
DeL. FN
4.9
9.0
2.3
6.0
6.0
9.0
Sch. FN
3.9
7.2
1.3
5.1
5.5
7.9
M-G FN
7.4 (a ' 6.7 6.9 7.7 8.4 8.2(a) 8.8 S.2 7.2 8.6 4.8(a) 3.7 4.8 5.8
6.0
6.3
10.2
Change, DeL. FNto
M-G FN
+ 2.5 ( a )
+ 1.8 +2.0 +2.8 +3.5 >a» - 0 . 8 - 0 . 2 - 0 . 8 - 1 . 8 - 0 . 4 +2 .5 ( a )
+ 1.4 + 2.5 +3.5
0
+0.3
+ 1.2
Change, Sch. FNto
M-GFN
+ 3.5 ( a |
+ 2.8 +3.0 + 3.8 +4.5 + 1.0(a)
+ 1.6 + 1.0
0 + 1.4 +3.5(a» + 2.4 + 3.5 +4.5
+0.9
+0.8
+ 2.3
(a) Average for heat when more than one test per heat
Table 15 — Ferrite Data from 12 Type 308 GMAW Pads
(For Explanation of Column Headings See Footnotes Table 9)
Heat
3
1
2
6
15
18
20
72
73
74
Electr. Diam,
in.
.030
.035 1/16
.045
.045
3/32
1/16
3/32
.045
.030
.045
.035
Cr Eq
21.21
21.44
21.67
21.01
22.34
21.88
21.32
21.77
21.43
21.65
DeL. N iEq
14.23
15.59
14.60
14.85
14.77
14.72
15.29
14.31
14.13
14.96
Sch. N iEq
11.47
12.68
11.90
11.85
12.46
11.93
12.20
11.91
11.73
11.81
DeL. FN
7.9
4.8
8.6
5.2
11.0
9.1
5.1
10.0
9.0
7.5
Sch. FN
10.6
8.0
10.5
9.1
10.6
10.9
8.9
10.7
10.3
10.7
M-G FN
6.9(a)
7.3 6.5 6.8
6.0
8.9
4.6
8.1
10.8
2.1
11.0
8.5
7.4
Change, DeL. FNto
M-G FN
- 1 . 0 , a )
- 0 . 6 - 1 . 4 - 1 . 1
+ 1.2
+0.3
- 0 . 6
- 2 . 9
+ 1.7
- 3 . 0
+ 1.0
- 0 . 5
- 0 . 1
Change, Sch. FNto
M-GFN
-3.7(a> - 3 . 3 - 4 . 1 - 3 . 8
- 2 . 0
- 1 . 6
- 4 . 5
- 2 . 5
- 0 . 1
- 6 . 8
+0.3
- 1 . 8
- 3 . 3
(a) Average for heat when more than one test per heat
deviation of about 1.2 FN, and an average weld deposit ferrite content of 9.4 FN. The GMAW data are not extensive enough to separate by type, but the overall standard deviation of 0.96 FN at an average FN of 7.9 fits in well with the trend indicated by the GTAW data.
Considering that in the DeLong Diagram a given change in chemistry causes a greater change in calcu
lated FN at high FN levels than at low FN levels (as shown in Table 5 at levels of 2, 6 and 11 FN), it could logically be expected that a similar trend would be present in ferrite measured with a Magne-Gage — i.e., a given change in the factors influencing measured FN would cause a greater change in measured FN at high FN levels than at low FN levels. This thesis is borne out by the strong in
dication that the standard deviations for measured ferrite at high FN levels are greater than they are at low FN levels.
If the experimental results are assumed to produce a normal distribution curve, a range of plus or minus one standard deviation (sigma) from the mean should encompass about 68% of the tests, and one of plus or minus two sigma should encompass about 95% of the tests. It is obviously desirable that acceptance tests for material be set so that there is substantially less than a 10% chance of rejection due to testing error or variation. Thus, if a specification for a GTAW deposit were to be established at 5 to 12 Ferrite Number and the assumption made that mean values of 5.0 FN on the low side or 12.0 FN on the high side would be acceptable, the receiving acceptance test limits would require a test tolerance of not less than about 1.5 FN on the low side and about 2.0 FN on the high side in order to reduce to well under 10% the chances of rejection at the specification limits.
Amendments to specifications MIL-E-0022200/2 and MIL-E-19933D for cove red and bare aus ten i t i c chromium nickel stainless steel electrodes have for several years accepted this philosophy of broader receiving test tolerances to provide for variations in pad preparation, testing procedure, and the inherent ferrite variations to be expected from pad to pad in the weld metal itself.
Variations From Predicted FN To Measured FN
The data from Tables 9 through 19 are presented graphically in the bar graphs of Fig. 4, which also presents for comparison a summary bar graph of similar data on covered electrode weld pads of the same types drawn from the work described in Ref. 3. The covered electrode graph has been condensed to a scale similar to that of the other bar graphs for easier comparison. As stated in the note on Fig. 4, the width of each bar representing covered electrode data based on the DeLong Diagram has been expanded 15% to compensate for the increase in numerical value in going from our old percent ferrite to the new Ferrite Number system.
Turning first to the covered electrode summary bar graph data, it can be seen that roughly 87% of the values were within ± 2.5 FN based on the De-Long Diagram versus about 68% within the same range based on the Schaeffler Diagram; at ± 3 FN the figures were about 92% and 78%, respectively. The DeLong Diagram data were significantly better than the Schaeffler, particularly on the low side. This was logical because the De-
292-s I JULY 19 73
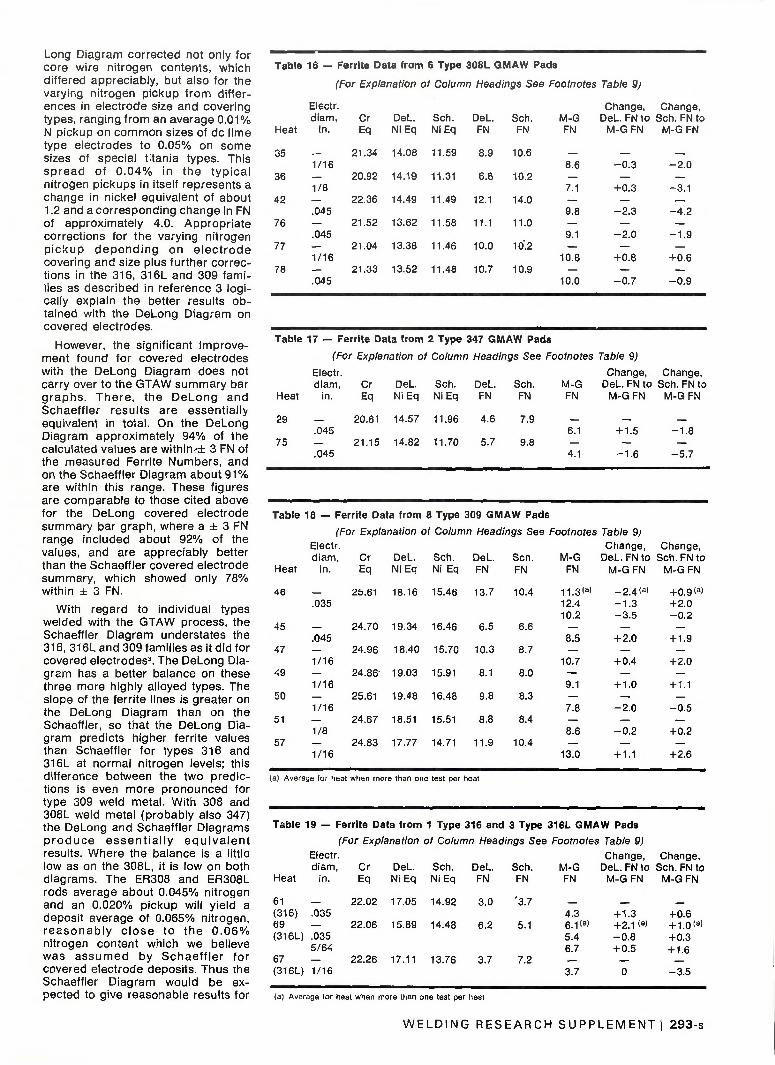
Long Diagram corrected not only for core wire nitrogen contents, which differed appreciably, but also for the varying nitrogen pickup f rom differences in electrode size and covering types, ranging f rom an average 0 .01% N pickup on common sizes of dc lime type electrodes to 0.05% on some sizes of special titania types. This sp read of 0.04% in the t yp ica l nitrogen pickups in itself represents a change in nickel equivalent of about 1.2 and a corresponding change in FN of approximately 4.0. Appropriate corrections for the varying nitrogen p i ckup d e p e n d i n g on e l ec t r ode covering and size plus further corrections in the 316, 316L and 309 families as described in reference 3 logically explain the better results obtained with the DeLong Diagram on covered electrodes.
However, the significant improvement found for covered electrodes with the DeLong Diagram does not carry over to the GTAW summary bar g raphs . There , the DeLong and Schaeff ler results are essentially equivalent in total. On the DeLong Diagram approximately 94% of the calculated values are w i t h i n - i 3 FN of the measured Ferrite Numbers, and on the Schaeffler Diagram about 9 1 % are within this range. These figures are comparable to those cited above for the DeLong covered electrode summary bar graph, where a ± 3 FN range included about 92% of the values, and are appreciably better than the Schaeffler covered electrode summary, which showed only 78% within ± 3 FN.
With regard to individual types welded with the GTAW process, the Schaeffler Diagram understates the 316, 316L and 309 families as it did for covered electrodes3. The DeLong Diagram has a better balance on these three more highly alloyed types. The slope of the ferrite lines is greater on the DeLong Diagram than on the Schaeffler, so that the DeLong Diagram predicts higher ferrite values than Schaeffler for types 316 and 316L at normal nitrogen levels; this difference between the two predictions is even more pronounced for type 309 weld metal. With 308 and 308L weld metal (probably also 347) the DeLong and Schaeffler Diagrams p r o d u c e e s s e n t i a l l y e q u i v a l e n t results. Where the balance is a little low as on the 308L, it is low on both diagrams. The ER308 and ER308L rods average about 0.045% nitrogen and an 0.020% pickup will yield a deposit average of 0.065% nitrogen, r e a s o n a b l y c l o s e to the 0 .06% nitrogen content which we believe was assumed by Schaef f le r for covered electrode deposits. Thus the Schaeffler Diagram would be expected to give reasonable results for
Table 16 — Ferrite Data from 6 Type 308L GMAW Pads
(For Explanation of Column Headings See Footnotes Table 9)
Heat
35
36
42
76
77
78
Electr. d iam,
in.
1/16
1/8
.045
.045
1/16
.045
Cr Eq
21.34
20.92
22.36
21.52
21.04
21.33
DeL. N iEq
14.08
14.19
14.49
13.62
13.38
13.52
Sch. NiEq
11.59
11.31
11.49
11.58
11.46
11.48
DeL. FN
8.9
6.8
12.1
11.1
10.0
10.7
Sch, FN
10.6
10.2
14.0
11.0
10.2
10.9
M-G FN
8.6
7.1
9.8
9.1
10.8
10.0
Change, DeL. FN to
M-GFN
- 0 . 3
+ 0.3
- 2 . 3
- 2 . 0
+0.8
- 0 . 7
Change, Sch. FN to
M-GFN
- 2 . 0
- 3 . 1
- 4 . 2
- 1 . 9
+0.6
- 0 . 9
Table 17 — Ferrite Data from 2 Type 347 GMAW Pads
(For Explanation of Column Headings See Footnotes Table 9)
Electr. Change, Change,
Heat
29
75
diam, in.
.045
.045
Cr Eq
20.61
21.15
DeL. N iEq
14.57
14.82
Sch. N iEq
11.96
11.70
Table 18 — Ferrite Data from 8 Type
Heat
46
45
47
49
50
51
57
(For Explanation
Electr. d iam,
in.
.035
.045
1/16
1/16
1/16
1/8
1/16
(a) Average for heat
Cr
Eq
25.61
24.70
24.96
24.86'
25.61
24.67
24.83
DeL. N iEq
18.16
19.34
18.40
19.03
19.48
18.51
17.77
DeL. FN
4.6
5.7
Sch. FN
7.9
9.8
309 GMAW Pads
M-G FN
6.1
4.1
DeL. FNto M-GFN
+ 1.5
- 1 . 6
->t Column Headings See Footnotes Table 9)
Sch. Ni Eq
15.46
16.46
15.70
15.91
16.48
15.51
14.71
when more than one test per
DeL. FN
13.7
6.5
10.3
8.1
9.8
8.8
11.9
heat
Sch. FN
10.4
6.6
8.7
8.0
8.3
8.4
10.4
M-G FN
11.3<a> 12.4 10.2
8.5
10.7
9.1
7.8
8.6
13.0
Change, DeL. FN to
M-GFN
- 2 . 4 (a» - 1 . 3 - 3 . 5
+2.0
+0.4
+ 1.0
- 2 . 0
- 0 . 2
+ 1.1
Sch. FNto M-GFN
- 1 . 8
- 5 . 7
Change, Sch. FN to
M-G FN
+0.9 ( a )
+ 2.0 - 0 . 2
+ 1.9
+2.0
+ 1.1
- 0 . 5
+ 0.2
+2.6
Table 19 — Ferrite Data from 1 Type 316 and 3 Type 316L GMAW Pads
(For Explanation of Column Headings See Footnotes Table 9)
Heat
61 (316) 69 (316L)
67 (316L)
Electr. diam,
in.
.035
— .035 5/64
— 1/16
Cr Eq
22.02
22.06
22.26
DeL. N iEq
17.05
15.89
17.11
Sch. N iEq
14.92
14.48
13.76
DeL. FN
3.0
6.2
3.7
Sch. FN
'3.7
5.1
7.2
M-G FN
4.3 e.i<a> 5.4 6.7
_ 3.7
Change, DeL. FN to
M-GFN
+ 1.3 +2.1 <a) - 0 . 8 +0.5
— 0
Change, Sch. FN to
M-GFN
+0.6 + 1.0(a> +0.3 + 1.6
- 3 . 5
(a) Average for heat when more than one test per heat
W E L D I N G R E S E A R C H S U P P LE M E NT I 293 -s
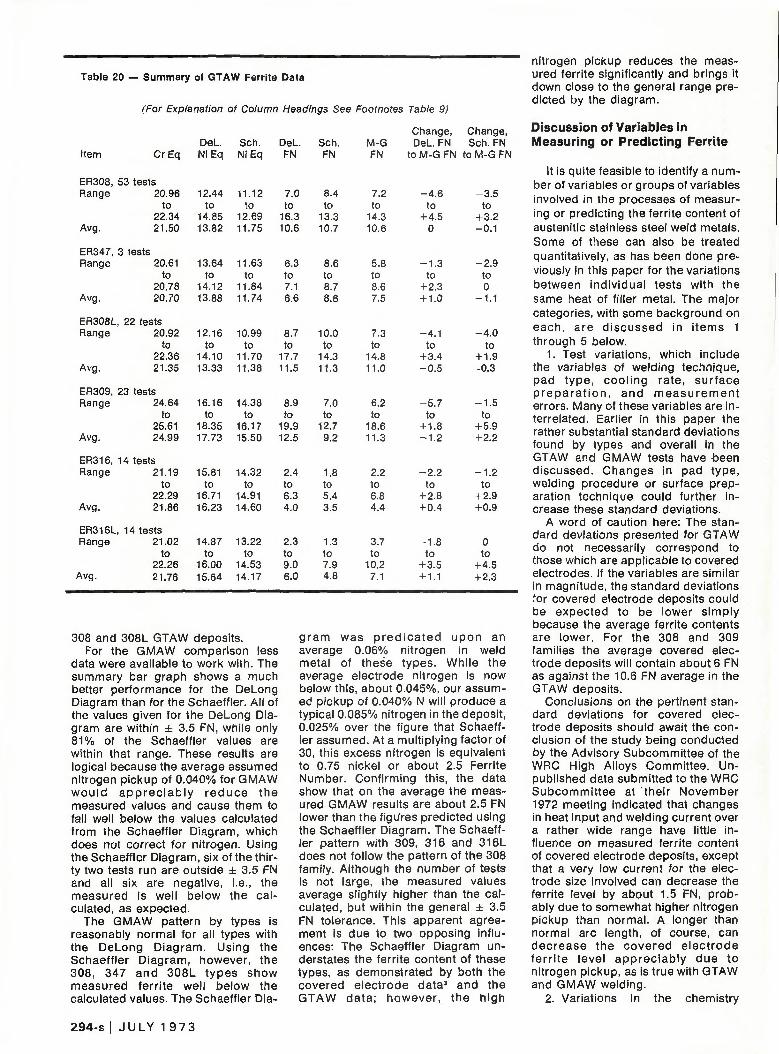
Table 20 — Summary of GTAW Ferrite Data
(For Explanation of Column Headings See Footnotes Table 9)
Item
ER308, Range
Avg.
ER347, Range
Avg.
ER308L Range
Avg.
ER309, Range
Avg.
ER316, Range
Avg.
ER316L Range
Avg.
C r E q
53 tests 20.96
to 22.34 21.50
3 tests 20.61
to 20.78 20.70
, 22 tests 20.92
to 22.36 21.35
23 tests 24.64
to 25.61 24.99
14 tests 21.19
to 22.29 21.86
, 14 tests 21.02
to 22.26 21.76
DeL. N iEq
12.44 to
14.85 13.82
13.64 to
14.12 13.88
12.16 to
14.10 13.33
16.16 to
18.35 17.73
15.81 to
16.71 16.23
14.87 to
16.00 15.64
Sch. N iEq
11.12 to
12.69 11.75
11.63 to
11.84 11.74
10.99 to
11.70 11.38
14.38 to
16.17 15.50
14.32 to
14.91 14.60
13.22 to
14.53 14.17
DeL. FN
7.0 to
16.3 10.6
6.3 to 7.1 6.6
8.7 to
17.7 11.5
8.9 to
19.9 12.5
2.4 to 6.3 4.0
2.3 to 9.0 6.0
Sch. FN
8.4 to
13.3 10.7
8.6 to 8.7 8.6
10.0 to
14.3 11.3
7.0 to
12.7 9.2
1.8 to 5.4 3.5
1.3 tc 7.9 4.8
M-G FN
7.2 to
14.3 10.6
5.8 to 8.6 7.5
7.3 to
14.8 11.0
6.2 to
18.6 11.3
2.2 to 6.8 4.4
3.7 to
10.2 7.1
Change, DeL. FN
to M-G FN
- 4 . 6 to
+4.5 0
- 1 . 3 to
+ 2.3 + 1.0
- 4 . 1 to
+ 3.4 - 0 . 5
- 5 . 7 to
+ 1.8 - 1 . 2
- 2 . 2 to
+ 2.8 +0.4
- 1 . 8 to
+ 3.5 + 1.1
Change, Sch. FN
to M-G FN
- 3 . 5 to
+3.2 - 0 . 1
- 2 . 9 to 0
- 1 . 1
- 4 . 0 to
+ 1.9 -0.3
- 1 . 5 to
+ 5.9 + 2.2
- 1 . 2 to
+ 2.9 + 0.9
0 to
+4.5 + 2.3
308 and 308L GTAW deposits. For the GMAW comparison less
data were available to work with. The summary bar graph shows a much better performance for the DeLong Diagram than for the Schaeffler. All of the values given for the DeLong Diagram are within ± 3.5 FN, while only 8 1 % of the Schaeffler values are within that range. These results are logical because the average assumed nitrogen pickup of 0.040% for GMAW w o u l d a p p r e c i a b l y r e d u c e the measured values and cause them to fall well below the values calculated from the Schaeffler Diagram, which does not correct for nitrogen. Using the Schaeffler Diagram, six of the thirty two tests run are outside ± 3.5 FN and all six are negative, i.e., the measured is well below the ca l culated, as expected.
The GMAW pattern by types is reasonably normal for all types with the DeLong Diagram. Using the Schaeff ler Diagram, however, the 308, 347 and 308L types show measured ferr i te well below the calculated values. The Schaeffler Dia-
g r a m was p r e d i c a t e d u p o n an average 0.06% nitrogen in weld metal of these types. Whi le the average electrode nitrogen is now below this, about 0.045%, our assumed pickup of 0.040% N will produce a typical 0.085% nitrogen in the deposit, 0.025% over the figure that Schaeffler assumed. At a multiplying factor of 30, this excess nitrogen is equivalent to 0.75 nickel or about 2.5 Ferrite Number. Confirming this, the data show that on the average the measured GMAW results are about 2.5 FN lower than the figi/res predicted using the Schaeffler Diagram. The Schaeffler pattern with 309, 316 and 316L does not follow the pattern of the 308 family. Although the number of tests is not large, the measured values average slightly higher than the calculated, but within the general ± 3.5 FN tolerance. This apparent agreement is due to two opposing influences: The Schaeffler Diagram understates the ferrite content of these types, as demonstrated by both the covered e lect rode data3 and the GTAW da ta ; however , the h igh
nitrogen pickup reduces the measured ferrite significantly and brings it down close to the general range predicted by the diagram.
Discussion of Var iables in Measuring or Predicting Ferrite
It is quite feasible to identify a number of variables or groups of variables involved in the processes of measuring or predicting the ferrite content of austenitic stainless steel weld metals. Some of these can also be treated quantitatively, as has been done previously in this paper for the variations between individual tests with the same heat of filler metal. The major categories, with some background on each , are d i scussed in i tems 1 through 5 below.
1. Test variations, which include the variables of welding technique, pad type , coo l i ng ra te , su r face p r e p a r a t i o n , and m e a s u r e m e n t errors. Many of these variables are interrelated. Earlier in this paper the rather substantial standard deviations found by types and overall in the GTAW and GMAW tests have -been discussed. Changes in pad type, welding procedure or surface preparation technique could further increase these standard deviations.
A word of caution here: The standard deviations presented for GTAW do not necessarily correspond to those which are applicable to covered electrodes. If the variables are similar in magnitude, the standard deviations for covered electrode deposits could be expected to be lower s imply because the average ferrite contents are lower. For the 308 and 309 families the average covered electrode deposits will contain about 6 FN as against the 10.6 FN average in the GTAW deposits.
Conclusions on the pertinent standard deviations for covered electrode deposits should await the conclusion of the study being conducted by the Advisory Subcommittee of the WRC High Alloys Committee. Unpublished data submitted to the WRC Subcommi t tee at their November 1972 meeting indicated that changes in heat input and welding current over a rather wide range have little influence on measured ferrite content of covered electrode deposits, except that a very low current for the electrode size involved can decrease the ferrite level by about 1.5 FN, probably due to somewhat higher nitrogen pickup than normal. A longer than normal arc length, of course, can dec rease the cove red e lec t rode fe r r i te level app rec i ab l y due to nitrogen pickup, as is true with GTAW and GMAW welding.
2. Variations in the chemistry
294 -s I J U L Y 1 9 7 3
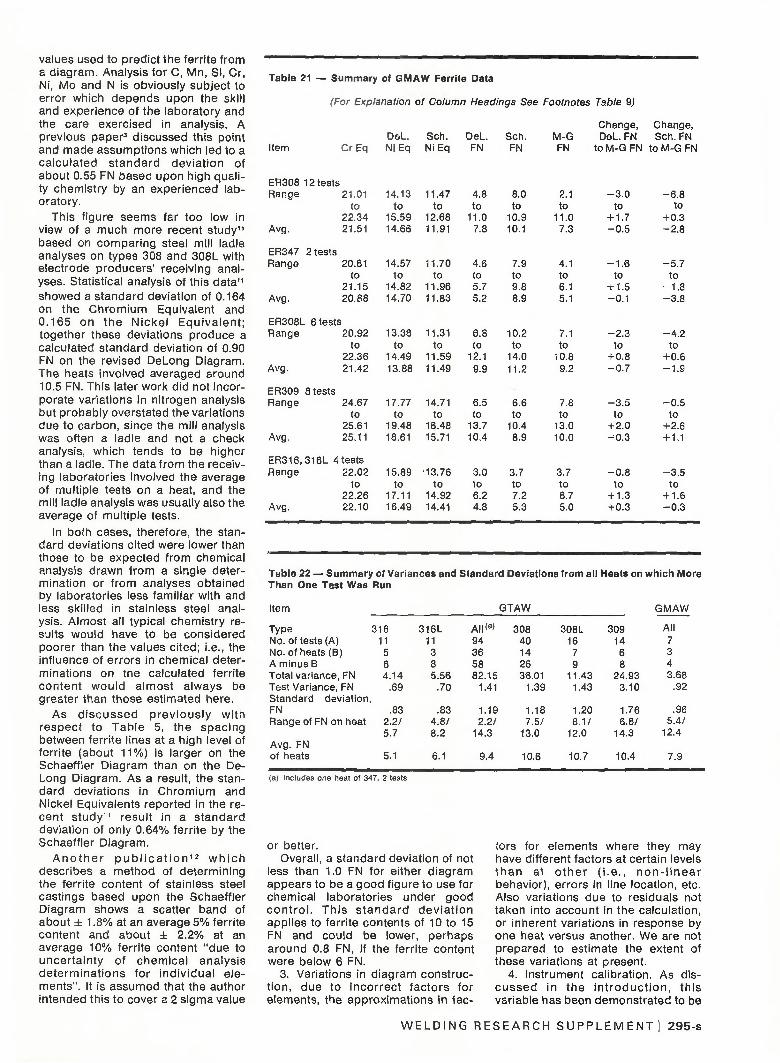
values used to predict the ferrite from a diagram. Analysis for C, Mn, Si, Cr, Ni, Mo and N is obviously subject to error which depends upon the skill and experience of the laboratory and the care exercised in analysis. A previous paper3 discussed this point and made assumptions which led to a calculated s tandard deviat ion of about 0.55 FN based upon high quality chemistry by an experienced laboratory.
This figure seems far too low in view of a much more recent study11
based on comparing steel mill ladle analyses on types 308 and 308L with electrode producers' receiving analyses. Statistical analysis of this data11
showed a standard deviation of 0.164 on the Chromium Equivalent and 0.165 on the Nicke l Equ iva len t ; together these deviations produce a calculated standard deviation of 0.90 FN on the revised DeLong Diagram. The heats involved averaged around 10.5 FN. This later work did not incorporate variations in nitrogen analysis but probably overstated the variations due to carbon, since the mill analysis was often a ladle and not a check analysis, which tends to be higher than a ladle. The data f rom the receiving laboratories involved the average of multiple tests on a heat, and the mill ladle analysis was usually also the average of multiple tests.
In both cases, therefore, the standard deviations cited were lower than those to be expected from chemical analysis drawn from a single determination or from analyses obtained by laboratories less familiar with and less skilled in stainless steel analysis. Almost all typical chemistry results would have to be considered poorer than the values cited; i.e., the influence of errors in chemical determinations on the calculated ferrite content would almost always be greater than those estimated here.
As d i scussed prev ious ly wi th respect to Table 5, the spacing between ferrite lines at a high level of ferrite (about 11%) is larger on the Schaeffler Diagram than on the De-Long Diagram. As a result, the standard deviations in Chromium and Nickel Equivalents reported in the recent study11 result in a s tandard deviation of only 0.64% ferrite by the Schaeffler Diagram.
A n o t h e r p u b l i c a t i o n 1 2 w h i c h describes a method of determining the ferrite content of stainless steel castings based upon the Schaeffler Diagram shows a scatter band of about ± 1.8% at an average 5% ferrite content and about ± 2.2% at an average 10% ferrite content "due to uncertainty of chemical analysis determinat ions for individual elements". It is assumed that the author intended this to cover a 2 sigma value
Table 21 — Summary of GMAW Ferrite Data
(For Explanation of Column Headings See Footnotes Table 9)
Item
ER308 12 tests Range
Avg.
ER347 Range
Avg.
ER308L Range
Avg.
ER309 Range
Avg.
ER316, Range
Avg.
2 tests
C r E q
21.01 to
22.34 21.51
20.61 to
21.15 20.88
. 6 tests
8 tests
20.92 to
22.36 21.42
24.67 to
25.61 25.11
316L 4 tests 22.02
to 22.26 22.10
DeL. N iEq
14.13 to
15.59 14.66
14.57 to
14.82 14.70
13.38 to
14.49 13.88
17.77 to
19.48 18.61
15.89 to
17.11 16.49
Sch. N iEq
11.47 to
12.68 11.91
11.70 to
11.96 11.83
11.31 to
11.59 11.49
14.71 to
16.48 15.71
•13.76 to
14.92 14.41
DeL. FN
4.8 to
11.0 7.8
4.6 to 5.7 5.2
6.8 to
12.1 9.9
6.5 to
13.7 10.4
3.0 to 6.2 4.8
Sch. FN
8.0 to
10.9 10.1
7.9 to 9.8 8.9
10.2 to
14.0 11.2
6.6 to
10.4 8.9
3.7 to 7.2 5.3
M-G FN
2.1 to
11.0 7.3
4.1 to 6.1 5,1
7.1 to
10.8 9.2
7.8 to
13.0 10.0
3.7 to 6.7 5.0
Change, DeL. FN
to M-GFN
- 3 . 0 to
+ 1.7 - 0 . 5
- 1 . 6 to
+ 1.5 - 0 . 1
- 2 . 3 to
+ 0.8 - 0 . 7
- 3 . 5 to
+ 2.0 ^0 .3
- 0 . 8 to
+ 1.3 +0.3
Change, Sch.FN
to M-G FN
- 6 . 8 to
+0.3 - 2 . 8
- 5 . 7 to
- 1 . 8 - 3 . 8
- 4 . 2 to
+0.6 - 1 . 9
- 0 . 5 to
+2.6 + 1.1
- 3 . 5 to
+ 1.6 - 0 . 3
Table 22 — Summary of Variances and Standard Deviations from all Heats on which More Than One Test Was Run
Item GTAW GMAW
Type No. of tests (A) No. of heats (B) A minus B Total variance, FN Test Variance, FN Standard deviation FN Range of FN on heat
Avg. FN of heats
316 11 5 6 4.14
.69
.83 2.2/ 5.7
5.1
316L 11 3 8 5.56
.70
.83 4.8/ 8.2
6.1
A l l ( a )
94 36 58 82.15
1.41
1.19 2.2/
14.3
9.4
308 40 14 26 36.01
1.39
1.18 7.5/
13.0
10.6
308L 16
7 9
11.43 1.43
1.20 8 . 1 /
12.0
10.7
309 14 6 8
24.93 3.10
1.76 6.8/
14.3
10.4
All 7 3 4 3.68
.92
.96 5.4/
12.4
7.9
(a) Includes one heat of 347. 2 tests
or better. Overall, a standard deviation of not
less than 1.0 FN for either diagram appears to be a good figure to use for chemical laboratories under good con t ro l . This s t anda rd dev ia t ion applies to ferrite contents of 10 to 15 FN and could be lower, perhaps around 0.8 FN, if the ferrite content were below 6 FN.
3. Variations in diagram construct ion, due to incorrect factors for elements, the approximations in fac
tors for elements where they may have different factors at certain levels t han at o t h e r ( i . e . , n o n - l i n e a r behavior), errors in line location, etc. Also variations due to residuals not taken into account in the calculation, or inherent variations in response by one heat versus another. We are not prepared to estimate the extent of these variations at present.
4. Instrument calibration. As discussed in the i n t r o d u c t i o n , th is variable has been demonstrated to be
W E L D I N G R E S E A R C H S U P P L E M E N T ! 295 -s
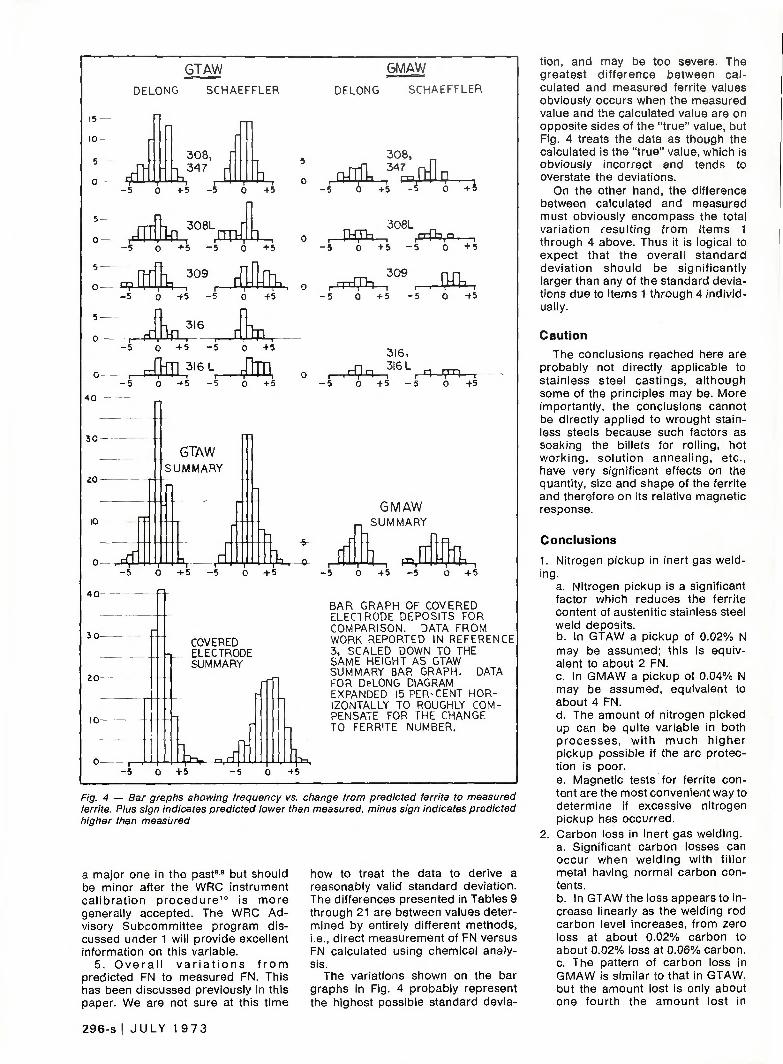
GTAW
DELONG SCHAEFFLER
GMAW
DELONG SCHAEFFLER
15 -
1 0 -
5 -
0 -
5
o-
5 -
0 -
5 -
0
0
4 0
$
308 ,
r i M 7 _n D L - 5 0 + 5 - 5 0 + 5
riTti,̂ ™LM
308,
- 5 0 + 5
-5 0 + 5 - 5 0 + 5
^fi4 ,309, ,itfh -5 0 + 5 - 5 0 +5
316
- 5 0 +5
308L o , Vrtjh , .rrfh.n, ,
- 5 0 + 5 - 5 0 + 5
^ T ± + 309
• . w » - 5 0 + 5 - 5 0 + 5
— , rri.rVri j i L ^ -5 0 + 5 - 5 0 + 5
316,
, rrftfTI ,316 L, , JlTTi, o , , ^ n ,3 I6L , - 5 0 ^ - 5 - 5 0 + 5 • 5 0 + 5
n f n 0 + 5
20
rj
^ c f . . .
GTAW SUMMARY
n
-
", if:
-
"j-.
In
GMAW ,_, SUMMARY
+ 5 + 5 \wu J *
+ 5 - 5 0 + 5
3 0 -
2 0 -
10-
0 —
COVERED ELECTRODE SUMMARY
tw
BAR GRAPH OF COVERED ELECTRODE DEPOSITS FOR COMPARISON. DATA FROM WORK REPORTED IN REFERENCE 3, SCALED DOWN TO THE SAME HEIGHT AS GTAW SUMMARY BAR GRAPH. DATA FOR DeLONG DIAGRAM EXPANDED 15 PER-CENT HORIZONTALLY TO ROUGHLY COMPENSATE FOR THE CHANGE TO FERRITE NUMBER.
- 5 0 + 5 + 5
Fig. 4 — Bar graphs showing frequency vs. change from predicted ferrite to measured ferrite. Plus sign indicates predicted lower than measured, minus sign indicates predicted higher than measured
a major one in the past8-9 but should be minor after the WRC instrument ca l ib ra t ion p rocedu re 1 0 is more generally accepted. The WRC Advisory Subcommittee program discussed under 1 will provide excellent information on this variable.
5. O v e r a l l v a r i a t i o n s f r o m predicted FN to measured FN. This has been discussed previously in this paper. We are not sure at this t ime
how to treat the data to derive a reasonably valid standard deviation. The differences presented in Tables 9 through 21 are between values determined by entirely different methods, i.e., direct measurement of FN versus FN calculated using chemical analysis.
The variations shown on the bar graphs in Fig. 4 probably represent the highest possible standard devia
tion, and may be too severe. The greatest d i f ference between ca l culated and measured ferrite values obviously occurs when the measured value and the calculated value are on opposite sides of the " t rue" value, but Fig. 4 treats the data as though the calculated is the " true" value, which is obviously incorrect and tends to overstate the deviations.
On the other hand, the difference between calculated and measured must obviously encompass the total var iat ion result ing f rom Items 1 through 4 above. Thus it is logical to expect that the overal l s tandard deviat ion should be signif icant ly larger than any of the standard deviations due to Items 1 through 4 individually.
Caut ion
The conclusions reached here are probably not directly applicable to stainless steel cast ings, a l though some of the principles may be. More importantly, the conclusions cannot be directly applied to wrought stainless steels because such factors as soaking the billets for roll ing, hot work ing , solut ion anneal ing, etc., have very significant effects on the quantity, size and shape of the ferrite and therefore on its relative magnetic response.
Conclusions
1. Nitrogen pickup in inert gas welding.
a. Nitrogen pickup is a significant factor which reduces the ferrite content of austenitic stainless steel weld deposits. b. In GTAW a pickup of 0.02% N may be assumed; this is equivalent to about 2 FN. c. In GMAW a pickup of 0.04% N may be assumed, equivalent to about 4 FN. d. The amount of nitrogen picked up can be quite variable in both p rocesses , wi th much h igher pickup possible if the arc protection is poor. e. Magnetic tests for ferrite content are the most convenient way to determine if excessive nitrogen pickup has occurred.
2. Carbon loss in inert gas welding. a. Significant carbon losses can occur when weld ing with f i l ler metal having normal carbon contents. b. In GTAW the loss appears to increase linearly as the welding rod carbon level increases, from zero loss at about 0.02% carbon to about 0.02% loss at 0.06% carbon. c. The pattern of carbon loss in GMAW is similar to that in GTAW, but the amount lost is only about one four th the amount lost in
296-s I J U L Y 1 9 7 3
GTAW up to 0.06% electrode carbon.
3. Variations in FN measurements on multiple pads of the same filler metal heat. a. The standard deviat ion for measu red Fer r i te N u m b e r in GTAW increases as the ferrite content increases over the range studied. At a measured 6 FN the standard deviation is about 0.8 FN (Types 316 and 316L) and this increases to about 1.2 FN at a measured 11 FN (Type 308 and 308L). An average standard deviation of 1.8 FN was found for Type 309 at about 11 measured FN, but this deserves more study.
b. Based on much less data than were studied for GTAW, the standard deviations for GMAW tests were close to those of the GTAW tests and the trends were similar. c. To provide for test-to-test variations in measured GTAW and GMAW ferrite, receiving acceptance tests should allow for variations between the supplier's'tests and the receiving tests, e.g., if the supplier is required to meet 5 FN m i n i m u m the c u s t o m e r ' s re ceiving test requirement should be set at 3.5 FN minimum. Similarly, if a maximum of 10 or 15 FN is requi red of the suppl ier the receiving limit should be set at 12.5 or 17.5 FN respectively. These figures represent approximate two sigma tolerance levels based on the data studied.
4. Uncertainties in the determination of deposi t chemistry are s ignificant variables in the calculat ion of f e r r i t e f r o m any c o n stitution diagram. From various sources it is concluded that two sigma levels of about 1.6 FN at calculated ferrite of 6 FN and less and about 2.0 FN at 10 to 15 FN calculated are reasonable values for this variable if excellent chemistry is available. For average to poor chemistry checks these values should be increased appreciably.
5. Comparison of the Schaeffler and DeLong Diagrams for inert gas shielded deposits. a. The diagrams are essentially equ iva len t in the d i f fe rences between predicted and measured ferrite in GTAW deposits of Types 308, 308L and 347. b. The Schaeffler Diagram understates the ferrite content of the more highly alloyed Type 316, 316L and 309 GTAW deposits. The DeLong Diagram is better on these grades, as is also the case with covered electrode deposits. c. The DeLong Diagram is better for GMAW deposits due to higher nitrogen pickup in those deposits. d. The differences to be expected
b e t w e e n m e a s u r e d and c a l culated ferrite contents when using either diagram are greater at the higher ferrite levels found in GTAW and GMAW deposits than when using the DeLong Diagram at the lower ferrite levels of the covered electrode deposits studied in the original work leading to that diagram. However, the differences are slightly lower than those encountered with covered electrode deposits using the Schaeffler Diagram. With GTAW and GMAW deposits a spread of up to about ± 3.5 FN or % ferrite can be expected between measured and calculated values, versus about ± 4.5 FN or % ferrite for covered e lec t rode depos i t s us ing the Schaeffler Diagram, e. In types with inherently lower ferrite content, such as 316 and 316L, the range of differences between measured and calculated ferrite seems lower than in the types with inherently higher ferrite levels, such as 308, 308L and 309.
6. Direct measurement of ferr i te, although it requires some allowance for test variations as described in conclusion 3, offers the most dependable approach to determining the ferrite content of weld deposits.
7. The variables involved in calculation seem greater in total than the variables involved in measurement.
8. The reconcil ing of both calculated and m e a s u r e d fe r r i te con ten t within one frameowrk — e.g., where a specification requires a given ferrite range to be met both measured and calculated — requires the acceptance of rather broad tolerances because standard deviations, both known and undef ined, of both systems of rating the ferrite content must be accommoda ted if the requ i rements are to be met on a practical and workable basis. The data show that the total tolerance in such case may have to be as high as ± 3.4 to 4.0 FN for GTAW and GMAW deposits averaging around 11 FN.
9. Conclusion 8 must not be interpreted to mean that the ferrite content of a weld deposit cannot be measured or calculated to closer limits than ± 4 FN. Pending the completion of the WRC cooperative program on covered electrode deposits, which will also cover the influence of pad size and preparation, we are estimating the following overall tolerances for m e a s u r e m e n t / c a l c u l a t i o n . The base is the average FN as measured on a welded pad of the type defined in this paper.
Single (avg) measured pad FN compared to:
Avg measured FNof5or more pads of the batch
Calculated FN from good deposit chemistry and dia-gram'3 '
Schaeffler covered bare
DeLong covered bare
Est. 2 sigma (95%) tolerance where the avg ferrite content is:
0-8 FN 8-14 FN
(see above 3a & 6)
±1.6 FN ±2.4 FN
(see above 4, 5,7& 8 but prime data source is Fig. 4)
± 5.0 FN ± 5.5 FN ± 3.3 FN ± 4.0 FN
± 3.3 FN ± 4.0 FN ± 2.7 FN ± 3.3 FN
(a) The estimated tolerances would probably be lower if the average of multiple measured FN determinations were used, and would be higher if poorer chemistry values were used.
References 1. DeLong, W. T., "Discussion of the In
ternational Testing Program for the Determination of Ferrite Content in Austenitic Stainless Weld Metal", IIW Document ll-C-331-70.
2. Schaeffler, A. L., "Constitution Diagram for Stainless Steel Weld Metal", Metal Progress, 56, 680 and 680-B (November 1949).
3. DeLong, W., Ostrom, G., and Szu-machowski, E., "Measurement and Calculation of Ferrite in Stainless Steel Weld Metal", The Welding Journal, 35 (11), Research Suppl., 526-s to 533-s (1956).
4. Simpkinson, T. V. and Lavigne, M. J., "Detection of Ferrite by Its Magnetism," Metal Progress, 55, 164-167 (February 1949).
5. Simpkinson, T. V., "Ferrite in Austenitic Steels Estimated Accurately," Iron Age, 170, 166-169 (Dec. 11, 1952).
6. Fleischmann, W. L., "Determination of Ferrite in Type 347 Stainless Steel Weld Deposit", The Welding Journal, 33 (9), Research Suppl., 459-s to 468-s (1954).
7. Gunia, R. B. and Ratz, G. A., "The Measurement of Delta Ferrite in Austenitic Stainless Steels", WRC Bulletin 132, August, 1968.
8. DeLong, W. T., "Measurement and Effects of Ferrite in Stainless Steel Weld Metal, Subcommittee Meeting of Nov. 10 in New York" (Advisory Subcommittee of the High Alloys Committee of the Welding Research Council), IIW Doc. II-C-372-71.
9. Rosendahl, C-H, "Ferrite in Austenitic Stainless Steel Weld Metal; Round Robin Testing Programme 1971-1972", IIW Doc. 11-631-72.
10. "Calibration Procedure for Instruments to Measure the Delta Ferrite Content of Austenitic Stainless Steel Weld Metal", Welding Journal 52 (2), Research Suppl., 69-s to 72-s (1973).
11. Hebble, T. L., "Statistical Treatment of Chemical Analysis Variability", Supplemental minutes of November '72 WRC Advisory Subcommittee minutes and phone conversation of 1/16/73.
12. E. A. Schoefer, "Welding of High Alloy Castings", Steel Founders' Society of American, Publication 772-5M1.
W E L D I N G R E S E A R C H S U P P L E M E N T ! 297 -s