dem modelling and simulation of coal …1003742/fulltext01.pdfdem modelling and simulation of coal...
TRANSCRIPT

DEM Modelling and Simulation of Coal Compaction by Stamping
Sand, A. 1, Rosenkranz, J. 1, Kuyumcu, H. Z. 2 1 Mineral Processing, Luleå University of Technology, 971 87 Luleå, Sweden
2 Mechanical Process Engineering and Solids Processing, Technical University of Berlin, 10623 Berlin, Germany
ABSTRACT Within stamp-charged coke making a large volume of coal is compacted to one single coal cake before entering the coke oven chamber. This is done by means of several falling stampers in a stamping machine having a mould nearly of the oven’s dimensions. Producing a high quality coke also from inferior coals requires a cake density of approximately 80% of the coal density. Besides that the industrial stamp-charging process demands a minimum mechanical strength of the coal cake to move it from the stamping mould into the oven chamber without failure.
Densification and the build up of cake strength were investigated earlier in stamping tests using a micro-stamping device [1-2]. The quantities derived from these tests (as e.g. cake density or porosity) represent average values for the entire cake. Statements describing the local compaction state at different heights are difficult to achieve without destructing the cake.
In order to gain better insight into the densification process and the inner structure of the coal cake a computational model based on the discrete element method, DEM, has been set up using 2 and 3-dimensional simulation software. The stamper’s position and velocity as well as the force acting on the stamper were monitored and the model’s response was compared against measurement data from laboratory stamping tests.
It was possible to reproduce the force and displacement pattern of the stamper in response to the visco-elastic properties of the cake using standard DEM bonding and contact models. Furthermore, the rearrangement of particles in response to the compaction by the stamper was tracked by calculating their displacement at the point the stamper hit the coal surface. The latter can also be used as indicators of particle deformation or breakage. By defining control points at different heights the particle displacement, stress and strain rates, porosity could be studied at different heights.
1. Introduction Coking of coal blends using high volatile coals with poor caking properties and other blendable components to still produce a high quality blast furnace coke can be achieved by compacting the whole oven charge prior to the carbonization using the so-called stamp-charge operation [3]. The compaction of the oven charge to a single huge coal cake involves a stamping machine consisting of a mould of slightly smaller dimensions than the coke oven, compare Figure 1. The

machine is equipped with a row of stampers that are periodically lifted up and dropped on the coal charge. The objectives of the stamping process are to obtain a homogenous cake density of approximately 80% of the coal density and at the same time a sufficiently high mechanical strength to prevent the cake from mechanical failure before it has been moved into the oven chamber. Cake density and cake strength are depending on several material-related parameters, as coal type and rank, the particle shape and size distribution, moisture content, and on the stamping energy applied [1-2]. These objectives together with demands on increasing productivity, i.e. corresponding to short stamping times, are subject to optimization.
In the systematics of agglomeration processes the stamping process falls into the category of pressure agglomeration with binder addition. I.e. the wet agglomerate strength is determined by liquid bridges and capillary forces. To investigate the two sub processes of densification and strengthening during stamping, theoretical and experimental work has been done earlier using a micro-stamping test unit in combination with a strength tester suited to the dimensions of the stamped cake [1-2]. The physical quantities derived from these tests (as e.g. cake density or porosity) allow to describe the densification but represent average values for the entire cake. Statements describing the local compaction state at different heights are difficult to achieve without destructing the cake. In order to gain better insight into the densification process and the inner structure of the coal cake a computational model describing the particle system is to be recommended.
Figure 1. Stamped coal cake of industrial dimensions, reproduced from [1]. Simulation of powder or particle system compaction by either finite or discrete element methods has been carried out by several research groups, where especially methods viewing powder compacts as a continuum are relatively well established [4-6]. Although continuum methods provide some understanding of compaction processes, only limited insight can be obtained regarding localised porosities and influence of particle size distribution, individual particle behaviour and rearrangement phenomena, etc. Discrete particle methods have been less common. This is partly due to their higher complexity, often large

number of particles are needed, and difficulties in selecting appropriate parameters for use in simulations. There are, however, some recent examples of compaction studies by discrete element approaches. These include compression of mineral suspensions by coupled Lattice-Boltzmann and DEM [7] and one-dimensional discrete element simulations of high-velocity compaction (HVC) by Shoaib et al. [8]. Typical high velocity compaction studies reach velocities of 8-10 m/s [9].
This study aims at a better understanding of the micro-processes within stamp charge operation, in order to get indications for possible process improvement and enhanced properties of the coal cake. Commercial 2D and 3D discrete element simulation tools are utilised in simulating the compaction of the coal cake. The simulation results are compared with empirical results using a laboratory-scale stamping device.
2. Method
The setup of the DEM model for the coal compaction includes several steps to model the stamping process domain and the material properties of the coal:
1. Representation of the stationary walls of the mould 2. Representation of the stamper as a movable wall in the vertical direction
and description of its motion in the gravity field 3. Generation of the coal particle collective (polydisperse bulk with a defined
particle size distribution) 4. Selection and calibration of the DEM model (adjustment of micro-level
parameters within the mechanistic model to macroscopic measured values) 5. Description of the filling process (generation of a random arrangement of
particles followed by deposition in the stamping mould) 6. Description of the compaction process
Within this procedure the calibration of the DEM model is the most crucial step. To model the interaction between particles and between particle and wall, the mechanistic model parameters that describe particle contacts and bonds have to be adjusted. The block chart in Figure 2 illustrates this iterative process.
Comparison between the experimental and calculated data for multiple control variables, in the case at hand the rebound amplitude and attenuation, and the peak force, is often done only in a qualitative way. A more satisfying approach to quantify the agreement is given by strategies as used in multiple objective optimisation. Taking the deviations in the individual control variables as the criteria to be minimised, and defining the initially unknown model parameters as the optimization variables, it is possible to identify the best fitting set of parameters within a numerical directed or non-directed search. For determining the ‘best fit’ the multiple criteria first need to be aggregated in one single objective function, e.g. in a weighted sum of least squares.

Data from
shear tests
Conduct of DEM
simulation run,
calculation of rebound
amplitude and
attenuation, and peak
force
Initial
DEM model
parameters
Agreement
between
experiment
and model?
Data from
stamping
tests
Variation of DEM
model parameters
Calibrated
model
Data from
Particle
analysis
Figure 2. Iterative process of determining model parameters for use in DEM simulation, adopted from [10].
The coal stamping operation was then simulated using the commercial particle
flow code PFC2D 4.0 by Itasca Consultants, Minneapolis, USA [11]. The results of simulations were quantitatively compared with data from empirical investigations of the stamping process using a laboratory-scale microstamping device. In addition to directly comparable information such as stamper movement, velocity and force on the stamper, discrete element simulation allows for observation of those properties that are difficult or impossible to obtain by experimental methods. These can relate to particle displacements, contact force networks in the cake structure during compaction, local coordination numbers (average number of contacts per particle), sliding fractions (average number of sliding contacts) and porosities. Porosity can be tracked both as function of time or cake position (e.g. vertical height).
A critical issue with simulating particle compaction processes by DEM is that the time step must be very small if the velocity of compaction is high compared to the size of particles. This severely increases the wall-clock simulation time, which can only be compensated by reducing the number of particles simulated or possibly by simplifying particle interactions.
The description of large-scale processes where information of interest can lie on several different levels of detail should, from the simulation point of view, be subject to a hierarchical modelling and simulation approach. Stamping of coal cakes is an example of such a process. The problem size and number of particles

will in that case determine which methods are most feasible to use. Consequently, if interest lies on the macro-scale properties of a large coal cake, one should approach the problem by continuum methods, e.g. the finite element method. With interest in meso-scale behaviour of a system, the problem needs to be scaled down compared to the macro-level approach. Suitable simulation methods in this range could be particle-based continuum approaches such as smoothed particle methods, e.g. SPH, or the particle finite element method, PFEM. On the smallest size scale and with interest in interactions between individual elements of a material, the discrete element approach DEM is the feasible option. To receive the full picture simulations should be performed at multiple levels of detail. Ideally parameters obtained at one level are utilised as input values for simulations using another method and on another level of detail.
2.1 Stamping test results and experimentally derived parameters
Micro-stamping tests have been conducted using a stamping mould of 100 mm x 100 mm base, initially filled to a level of 150 mm by 1 kg coal sample plus varying amounts of water as a binder [16]. The stamper consisted of a metal weight of approximately 40 kg that was lifted to a falling height between 0.25 and 0.55 m in order to obtain a specific energy input similar to the industrial scale. To enable tracking of stamper movement and the forces acting on it during the stamping of the coal, the stamper was instrumented by a load cell and a displacement transducer. Figure 3 shows the characteristic results for these measurement parameters as a function of time for one stamping step.
Figure 3. Micro-stamping device (left) and an example of stamper displacement and load cell response (right) [1-2]. From the temporal course of the measured path and force values (recorded at a frequency of 4800 data points per second) and shear test results from bulk shear tests for the coal as well as from strength tests of the coal cake, several input parameters can be provided for adjusting a DEM model, Table 1.

Table 1. Derived parameters from experimental work
Parameter units
Coal solid density 1430 kg/m3
Coal bulk density (after filling) 667 kg/m3
Moisture content 10 %
Friction angle of coal bulk material 35°
Friction angle of the stamped coal cake 50° - 60°
Coefficient of restitution CoR 0.27
2.2 Model and simulation setup
2.2.1 Simulation domain
In PFC, the stamping cell was defined as a 2 dimensional simulation box with length and height of 10 × 10 cm. The box was confined by walls at all sides. Rougly 1,000 spherical particles satisfying the size distribution described in Figure 5 was randomly placed in the box and allowed to fall by gravity. Before compaction by the stamper, the particles filled about half the simulation box at a porosity of 40-45 vol-%. Measurement circles were added to enable tracking of porosity gradients and other properties at different cake heights. Figure 4 illustrates the setup of the system.
Figure 4. PFC2D simulation domain with wall boundaries and a free moving stamper on top of the coal cake. Measurement circles numbered 10 to 34 have been defined at 5 different vertical heights in the coal cake.

From the upper side of the simulation domain, the stamper is added. It is
simulated as a servo-controlled wall of 40 kg mass, falling under gravity. The stamper was dropped from a height of approximately 0.55 m above the top surface of the coal cake. The response of the stamper in terms of displacement and veocity in time will depend on the bulk properties of the coal cake. The high stamper velocity of around 3 m/s as it hits the coal and its weight in combination with the relatively small coal particle sizes makes the simulations complex and computationally costly. A time step of 10-9 or 10-10 s should preferrably be used, but a maximum time step of 10-8 s was found acceptable for the particle size distribution used in simulations. Plot and data collection intervals in simulations were adjusted to correspond to the transducer sampling rate of 4800 s-1 in the experimental rig used by Abel et al. [1-2]. This ensures comparability between experimental and simulation-based results. A simulation with 1,000 coal particles simulated on a desktop computer translates to a wall-clock simulation time of 9-10 hours, given a time step of 10-8 s.
2.2.2 Contact models and parametrisation
PFC2D contains two built-in bonding models; contact bonds and parallel bonds. The contact bond can be used to represent adhesion between two particles over an infinitely small area of the contact point. The parallel bond represent the effect of an added binder-material that results in particle adhesion over a longer distance, referred to as the bond radius. The contact bond would represent the special case of having a parallel bond of radius zero. The parameters that describe a contact bond are thus normal and shear strength, φn and φs. A parallel bond, on the other hand, is characterised by five parameters; normal and shear
stiffness, nk and s
k , normal and shear strength, Cσ and Cτ , and bond radius, R .
More information on bonding models can be found in [11]. In the simulations, the linear contact model with global viscous damping
was utilised. Viscous damping was applied to dissipate kinetic energy from the impacts of the stamper. This would be analoguous to internal friction and wave scattering mechanisms as it is observed in real material samples [12]. With regard to particle cohesion, both contact and parallel bonds were included in simulations.
A challenge in DEM is the determination of micro-level parameters for use in simulations. These parameters include stiffness, friction coefficients, damping values, bond strengths and stiffnesses, and are used to represent interactions between particles and particles and boundaries [13]. Some parameters can be estimated from experiments or obtained from literature [14-15]. This could include e.g. friction coefficients and solid density. Other parameters are in some aspect simulation-specific, as for instance the stiffness values. These need to be estimated through calibration using physically determinable control parameters. Furthermore, some parameters can be tuned to account for idealisations applied in simulations. For instance, complex-shape particles of a real material can in some cases be estimated as being spherical if assigned a higher friction coefficient for simulations. Based on such

considerations as described above, the parameter set as described in Table 2 was used in simulations.
Table 2. Model parameters used in PFC2D simulations
Linear contact model with viscous damping
Particle stiffness (normal/shear) 6.0 × 10⁶ N/m
Particle friction coefficient 1.0
Viscous damping (normal/shear) 0.2
Wall stiffness (normal/shear) 5.2 × 10⁹ N/m
Wall friction coefficient 1.0
Parallel bond model
Bond strength (normal/shear) 1.0 × 10¹⁸ N
Bond stiffness (normal/shear) 1.0 × 10¹⁸ N/m
Bond radius 0.10 m
Contact bond model
Bond strength (normal/shear) 1.0 × 10¹⁸ N
2.2.3 Particle system and size distribution
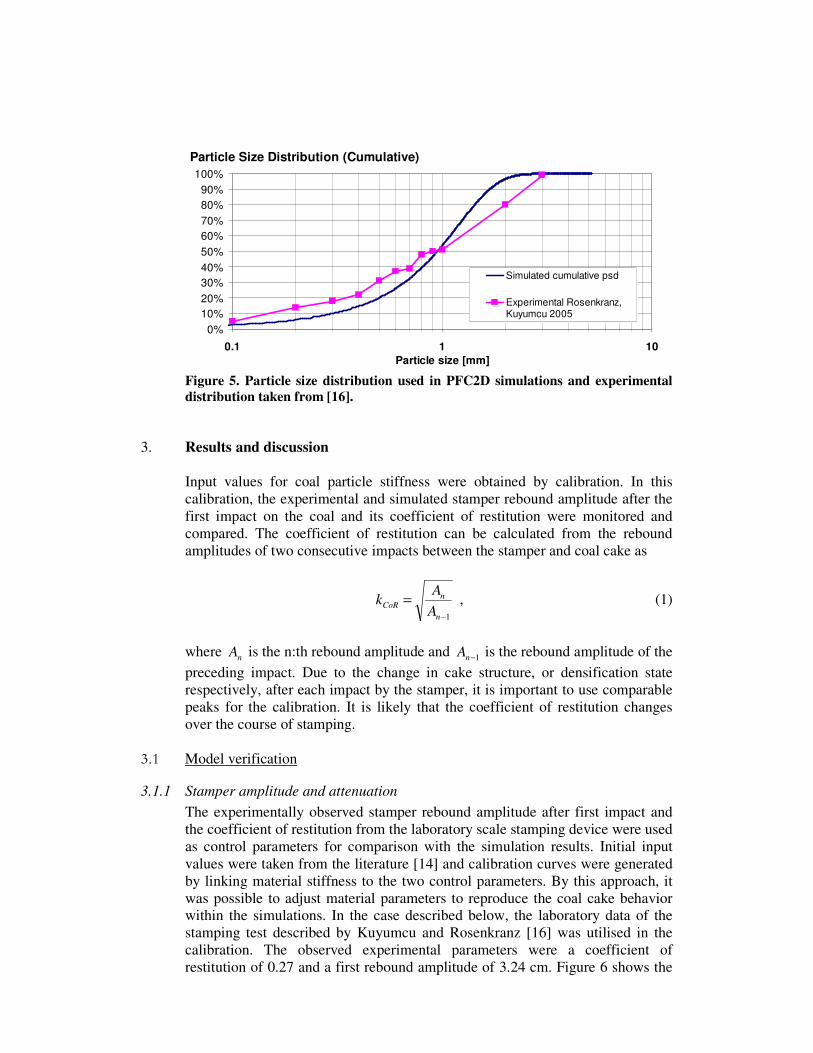
A realistic filling of the stamping cell assuming a particle size of 2 mm would require approximately 100,000 particles. Assuming the same particle size distribution as in experiments [16], the number of particles would be counted in billions. Due to the limitiation of number of particles in simulations, an accurate particle size distribution and stamping cell filling degree could not be obtained. Instead, the cell was only filled in part and a modified particle size distribution was applied. The standard PFC2D functionality for producing particle size distributions was utilised. Consequently, a Gaussian particle size distribution was generated, with a mean particle size of µd = 0.9 mm and standard deviation σd = 0.6 mm. Comparison of experimental and simulated distributions is shown in Figure 5. In this sense, the simulated particles are considered as scaled DEM-particles. Thus they are considered as a means for discretising the coal cake in order to provide appropriate mechanical behaviour, and enabling the identification and study of micro-scale mechanisms taking place in the coal cake during stamping.
Particle Size Distribution (Cumulative)
0%
10%
20%
30%
40%
50%
60%
70%
80%
90%
100%
0.1 1 10
Particle size [mm]
Simulated cumulative psd
Experimental Rosenkranz,Kuyumcu 2005
Figure 5. Particle size distribution used in PFC2D simulations and experimental distribution taken from [16].
3. Results and discussion
Input values for coal particle stiffness were obtained by calibration. In this calibration, the experimental and simulated stamper rebound amplitude after the first impact on the coal and its coefficient of restitution were monitored and compared. The coefficient of restitution can be calculated from the rebound amplitudes of two consecutive impacts between the stamper and coal cake as
1−
=
n
nCoR
A
Ak , (1)
where nA is the n:th rebound amplitude and 1−nA is the rebound amplitude of the
preceding impact. Due to the change in cake structure, or densification state respectively, after each impact by the stamper, it is important to use comparable peaks for the calibration. It is likely that the coefficient of restitution changes over the course of stamping.
3.1 Model verification
3.1.1 Stamper amplitude and attenuation
The experimentally observed stamper rebound amplitude after first impact and the coefficient of restitution from the laboratory scale stamping device were used as control parameters for comparison with the simulation results. Initial input values were taken from the literature [14] and calibration curves were generated by linking material stiffness to the two control parameters. By this approach, it was possible to adjust material parameters to reproduce the coal cake behavior within the simulations. In the case described below, the laboratory data of the stamping test described by Kuyumcu and Rosenkranz [16] was utilised in the calibration. The observed experimental parameters were a coefficient of restitution of 0.27 and a first rebound amplitude of 3.24 cm. Figure 6 shows the

coefficients of restitution and rebound amplitudes obtained by simulation with varying settings of particle normal and shear stiffness. This information can be used as basis for the calibration curve linking simulated and experimental results.
Parameter testing
0.00
0.05
0.10
0.15
0.20
0.25
0.30
0.35
0.40
0.45
3 4 5 6 7 8 9
Particle-particle stiffness [MN/m]
Co
eff
icie
nt
of
resti
tuti
on
[-]
0.0
0.5
1.0
1.5
2.0
2.5
3.0
3.5
4.0
4.5
5.0
Reb
ou
nd
am
plitu
de
[m
m]
Coefficient of restitution
Rebound amplitude
Figure 6. Influence of particle stiffness on coefficient of restitution and stamper rebound amplitude after first impact. Simulated coefficients of restitution and rebound amplitudes were compared with experiments by calculating deviations as shown in Figure 7.
0%
10%
20%
30%
40%
50%
2 4 6 8 10
Normal and shear stiffness [MN/m]
Devia
tio
n [
%]
Coefficient of restitution
Rebound amplitude
Average deviation
Figure 7. Deviation between measured (experimental) and simulated stamper coefficient of restitution and rebound amplitude after first impact. The average deviation can be used to find the stiffness where both criteria are best satisfied (aggregation using equal weight).

Model parameters best fitting both prerequisites were thus a coal particle normal and shear stiffness of 5-6 MN/m. These settings gave an average error of less than 10%, with errors in the coefficient of restitution and rebound amplitude of 13.3% and 5.3%, respectively. The difference in result from one simulation to another, with identical parameters, was less than 0.5%.
Measured data from the laboratory trials were compared with simulations using the stiffness parameters obtained with help of the calibration described above. The best average fit combining rebound amplitude and coefficient of restitution with an equal weight, produced a deviation between measured and simulated results of 6.0%. However, related to the discussion regarding multiple-objective optimisation, it was noted that the rebound amplitude is the more critical parameter. Obtaining a good amplitude fit should therefore take predecence over fitting the coefficient of restitution. The best overall fit was consequently reached by using the particle stiffness 6.0 × 10⁶ N/m. The stamper trajectory obtained from simulations using the parameter selection that gave the best agreement with the experimental case is shown in Figure 8.
100
110
120
130
140
150
160
170
180
300 400 500 600 700 800
Time [ms]
Sta
mp
er
po
sit
ion
[m
m]
Simulated
Measured
Figure 8. Comparison between calibrated simulation and measured stamper trajectory. The deviation between simulated and measured result was for the rebound amplitude 1.3% and for the coefficient of restitution 23.9%
3.1.2 Peak force
The peak force of the first stamper impact with the coal was in the calibrated simulation case 14.6 kN while the load cell-response in the laboratory test was 17.9 kN. Besides that also the temporal course of the force differs, see Figure 9. The deviation between experimental and simulated peak force is thus around 18%, which can be considered as acceptable for now. There are several issues related to the elastic plastic-behaviour of the coal and the coal cake, effects of particle size and shape distribution in the context of particle re-arrangement during stamper impact etc that need to be taken into consideration when finding an explanation for this deviation.

0
5
10
15
20
250 300 350 400 450 500
Time [ms]
Fo
rce
[k
N]
Measured force kN
Simulated force kN
Figure 9. Comparison between calibrated simulation and measured peak force
3.2 Advanced numerical analysis of the coal cake
3.2.1 Porosity test
Based on the local porosities obtained from simulations for different heights, the vertical porosity profile was calculated as a function of time during stamping. Furthermore, the bulk porosity was calculated as an average of the local porosities.
Figure 10. Porosity development in time, shown for three horizontal coal cake positions and as an average over the entire coal cake.
As is shown in Figure 10, the starting average coal cake porosity is around 45%.
With each bounce of the stamper, the porosity decreases sharply and then partly rebounds. As this process is repeated, the porosity gradually decreases to 18%, until the stamper settles on the cake. These results are in acceptable agreement

with experimental results showing 50% average starting porosity and 20% porosity after completed compaction. It should be noted, however, that the experimental final porosity by Kuyumcu and Rosenkranz [16], resulted from 6 stamping cycles. For each cycle, the stamper is allowed to bounce and settle on the coal cake. The simulation results are based on only one such cycle. A major difference is that in the simulations particles are spherical and the friction coefficient is constant. This allows particles to easier find an optimum dense packing. This is not the case for the experimental system, where particles have a non-spherical shape and can also deform or break during stamping. Furthermore, several additional sources of error are involved with regard to comparing the experimental and simulated porosities. To name but a few; 2D and 3D porosities are of course not directly comparable, and as previously discussed there is a difference in particle size and size distribution.
By defined porosity measurement positions within the coal cake, porosity profiles versus vertical position can be dynamically traced in a simulation. One such example is given in Figure 11.
10%
20%
30%
40%
50%
0.5 1.0 1.5 2.0 2.5 3.0
Height above stamping cell floor [cm]
Po
rosit
y [
%]
Starting porosity @350ms
After first stamp impact @550ms
After second stamp impact @650ms
After third stamp impact @715ms
Figure 11. Porosity gradients inside the coal cake during stamping.
3.2.2 Particle motion and rearrangement
With regard to particle motion and rearrangement, discrete element simulation can offer a level of detail that is not possible to obtain by laboratory trials. For instance, particle displacement mechanisms during cake compaction can be studied at varying levels of cohesion. Linking such information to local porosity development during stamping can help to optimise cake compaction and thus the mechanical properties of the coal cake. Figure 12 illustrates how particle movement during stamping can be tracked using vector maps.
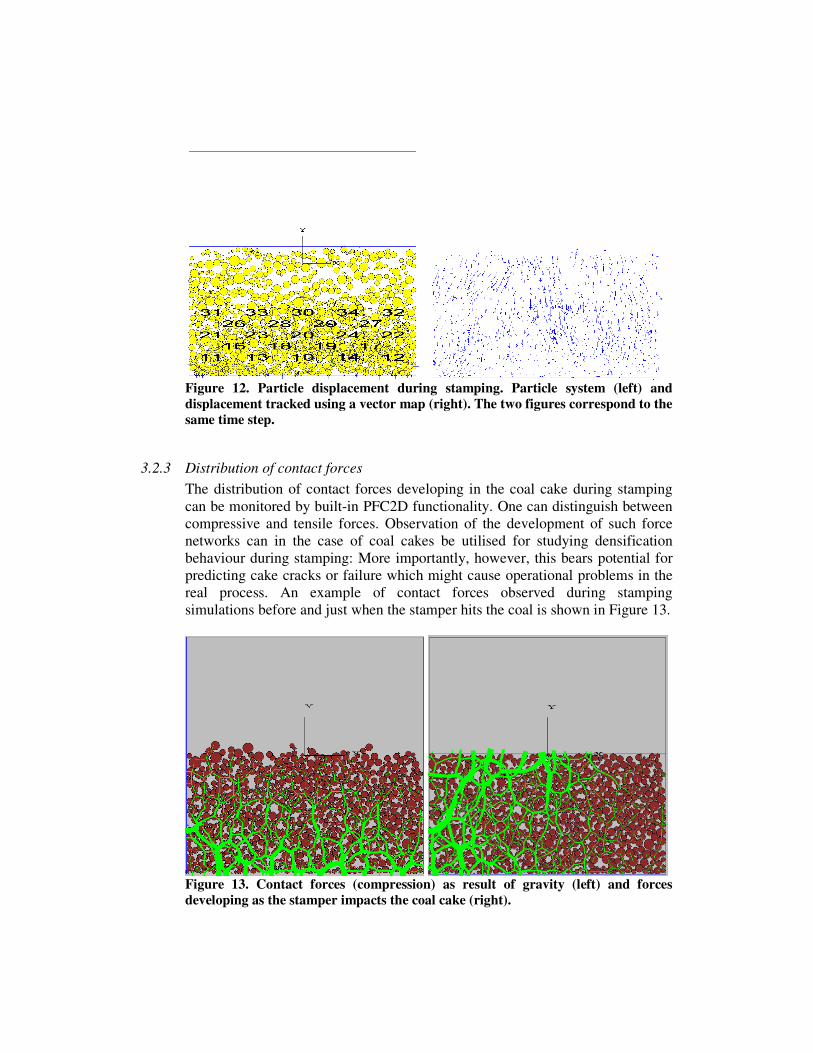
Figure 12. Particle displacement during stamping. Particle system (left) and displacement tracked using a vector map (right). The two figures correspond to the same time step.
3.2.3 Distribution of contact forces
The distribution of contact forces developing in the coal cake during stamping can be monitored by built-in PFC2D functionality. One can distinguish between compressive and tensile forces. Observation of the development of such force networks can in the case of coal cakes be utilised for studying densification behaviour during stamping: More importantly, however, this bears potential for predicting cake cracks or failure which might cause operational problems in the real process. An example of contact forces observed during stamping simulations before and just when the stamper hits the coal is shown in Figure 13.
Figure 13. Contact forces (compression) as result of gravity (left) and forces developing as the stamper impacts the coal cake (right).

4. Orienting tests towards 3D simulation
The simulation problem was extended to the 3-dimensional case using the discrete element tool EDEM by DEM-Solutions, Edinburgh, UK. These simulations are still at an early stage and should be viewed as a feasability test, rather than a quantitative description of the stamping process. In this case, the no-slip Hertz-Mindlin contact model was used in conjunction with a linear cohesion model. The parameters used in the Hertz-Mindlin model are Poisson’s ratio and the shear modulus. The coefficients of restitution, static and rolling frictions are defined between each type of material of the system, i.e. particle-particle and particle-wall. Linear cohesion is defined by an energy density parameter.
Figure 14 shows a compaction test performed in EDEM. In this case, the translation of the stamper is defined by an oscillation amplitude and frequency. The simulation comprises 3000 particles of monodisperse size distibution (d=8 mm). At the end of the process, a cohesive particle cake is ejected from the stamping cell. Systematic parameter testing and calibrations have as yet not been performed.
Figure 14. Particle compression simulated in EDEM, including particle deposition (upper left), stamping (upper right) and ejection (bottom left and right).
5. Concluding remarks
The reported simulation results have proven the concept of using DEM models to describe the stamping of a coal charge. Simulation-based studies also offer complementary information compared to laboratory-scale stamping trials. For instance, particle displacement and rearrangement mechanisms in the coal cake,

contact forces, and local differences in porosity or cake density can be tracked during the stamping process. This can be done based on mechanical properties of the coal cake as obtained from comparing the force on and motion of the stamper in order to confirm realistic coal cake behaviour.
Nethertheless the standard particle models applied need to be modified in the future. Built-in particle bonding models in commercial discrete element simulation tools are deemed insufficient in describing the complexity of liquid bridge and capillary force-based particle interactions. Efforts should therefore be made in developing such models or tuning of existing alternative models to enable better description of the properties of moist particulate systems [17]. This also refers to the parameters in the contact and bond models. These parameters should be correlated to the physical phenomena of capillary forces and liquid bridges, in order to arrive at a more predictive significance. The reliability of particle rearrangement mechanisms and related properties using the present approach should therefore be considered only as primary, until more appropriate bonding models have been developed and incorporated in the simulation model.
As the mechanistic model parameters, like stiffness, friction etc, are affected by the densification process they need to be formulated in a dynamical manner. Time or system dependent (e.g. related to densification state) changes in model properties or parameters therefore remain as an interesting topic for model development. Thus, parameters should be described as functions rather than being assigned static values over the full length of a simulation.
Future work In addition to the previous discussion on models and parameter calibration, there are some points that can be specifically stressed regarding future work in the simulation-based investigation of coal cake compaction.
Comparison between 2D and 3D systems with regard to porosity, particle displacements, etc. are not straightforward. Work should therefore continue in the direction of 3D simulations. Issues related to the number of particles, particle size distributions and increased complexity of interaction models will put greater strain on computational resources. With this in mind, it is at present time still not reasonable to completely rule out 2D simulations.
Due to the restriction in the number of particles, the cell filling degree in simulations was not identical with the experimental trials. If possible, simulations should be performed the same filling degree as in experiments. An alternative approach could be to perform laboratory tests with filling degrees in better coherence with simulations. As in the technological process the coal charge is filled into the stamping machine in layers it would also be interesting to conduct a simulation of filling and compacting in several layers and investigate the potential effect of layering on the cake stability.
For modelling the stamping of coal cakes on industrial full-scale, i.e. with a mass of 50 tons, the description of individual particles as in the DEM approach is not feasible. Instead particle-based continuum methods, e.g. the smoothed particle SP method, could be an interesting option. To describe different facets of the stamping process a hierarchical approach to modelling and simulation, which incorporates different numerical methods corresponding to the number of particles, is useful.

A general task that is not restricted particularly to the stamping process is how to formalise the model calibration step using multiple parameters simultaneously. The solution must couple the iterative procedure as described by Figure 2 with a directed numerical search to find the best-fitting parameters based on quantitative multi-criteria evaluation. Due to the quite high computing times for simulation, highly efficient numerical routines are necessary in this case.
6. References
[1] Abel, F., Rosenkranz, J. and Kuyumcu, H. Z. (2009a). Stamped coal cakes in cokemaking technology. Part 1 – A parameter study on stampability, Ironmaking and Steelmaking 36(5), 321-326.
[2] Abel, F., Rosenkranz, J. and Kuyumcu, H. Z. (2009b). Stamped coal cakes in cokemaking technology. Part 2 – The investigation of cake strength, Ironmaking and Steelmaking 36(5), 327-332.
[3] Kuyumcu, H. Z. (1990). Cokemaking by Stamp Charging. In: Proceedings of The Sixth International Iron and Steel Congress. Nagoya, Japan: ISIJ.
[4] Marques, M., and Martins, P. (1991). Finite-element simulation of powder-metal forming, Journal of Materials Processing Technology 28, 345-363.
[5] Khoei, A. (2002). Numerical simulation of powder compaction processes using an inelastic finite element analysis, Materials and Design 23(6): 523-529.
[6] Jonsén, P., H.-Å. Häggblad, Troive, L., Furuberg, J., Allroth, S. and Skoglund, P. (2007). Green body behavior of high velocity pressed metal powder, Materials Science Forum, 289-292.
[7] Pianet, G., Bertrand, F., Vidal, D. and Mallet, B. (2008). Modelling the Compression of Particle Packings using the Discrete Element Method, TAPPI Advanced Coating Fundamentals Symposium, June 11-13, Montréal, Canada, 278-288.
[8] Shoaib, M., Kari, L. and Azhdar, B. (2011). Simulation of high-velocity compaction process with relaxation assists using the discrete element method, Powder Technology 217, 394-400 (in press).
[9] Wang, J., Qu, X., Yin, H., Yi, M. and Yuan, X. (2009). High velocity compaction of ferrous powder, Powder Technology 192, 131-136.
[10] Schubert, W., Jeschke, H., Khanal, M. and Tomas, J. (2005). DEM simulation of mineral processing machines, Preprints 4. Kolloquium Sortieren – Innovationen und Anwendungen, Technical University Berlin, 82-88.
[11] PFC2D Particle Flow Code in 2 Dimensions User’s Guide (2008), 4th Edition. Itasca Consulting Group, Minneapolis, MN.

[12] Potyondy, D. and Cundall, P. (2004). A bonded-particle model for rock, International Journal of Rock Mechanics & Mining Sciences 41, 1329-1364.
[13] Coetzee, C. and Els, D. (2009). Calibration of granular material parameters for DEM modelling and numerical verification by blade-granular material interaction, Journal of Terramechanics 46, 15-26.
[14] Xie, Y.-S. and Zhao, Y.-S. (2009). Numerical simulation of the top coal caving process using the discrete element method, International Journal of Rock Mechanics and Mining Sciences 46, 983-991.
[15] Yoon, J. (2007). Application of experimental design and optimization to PFC model calibration in uniaxial compression simulation, International Journal on Rock Mechanics & Mining Sciences 44, 871-889.
[16] Kuyumcu, H .Z. and Rosenkranz, J. (2006). Untersuchungen zur Verdichtung von Steinkohlen durch Stampfen, Stahl und Eisen 1, 41-47.
[17] Mu, F. and Su, X. (2007). Analysis of liquid bridge between spherical particles, China Particuology 5, 420-424.