demand and supply functions in economics
TRANSCRIPT

1
9 : Theory of Demand

2 Prof. Trupti Mishra, School of Management, IIT Bombay
Definition of Demand Laws of Demand Exception to law of Demand Factors influencing Demand
Recap from last session

Change in quantity demanded
Occurs when price changes
Movement along demand curve
Change in demand
Occurs when one of the other variables, or determinants of demand, changes
Demand curve shifts rightward or leftward
Change in the Demand
Prof. Trupti Mishra, School of Management, IIT Bombay

Change in the Demand Curve
Prof. Trupti Mishra, School of Management, IIT Bombay

Qd
0 1,100 700 100
Quantity
Pri
ce (
Ru
pees)
900
P
300 500 1,500 1,300
10
20
30
40
50
60
70
80
D0
D1
D2
• • • •
Demand
increase
Demand
decrease
Shifts in Demand
Prof. Trupti Mishra, School of Management, IIT Bombay

6
Price of Cigarettes,
per Pack.
Number of Cigarettes Smoked per Day
D2
A policy to discourage smoking shifts the demand curve to the left.
0 20
RS 2.00
D1
A
10
B
A Shifts in the Demand Curve
Prof. Trupti Mishra, School of Management, IIT Bombay

7
Price of Cigarettes,
per Pack.
Number of Cigarettes Smoked per Day
0 20
Rs 2.00
D1
A
A tax that raises the price of cigarettes results in a movements along the demand curve.
C
12
Rs 4.00
A Movement Along the Demand Curve
Prof. Trupti Mishra, School of Management, IIT Bombay

8 Prof. Trupti Mishra, School of Management, IIT Bombay
Supply
Supply of a goods refers to the various quantities of the good which a seller is willing and able to sell at a different prices in a given market, at a particular point of time.

9 Prof. Trupti Mishra, School of Management, IIT Bombay
Law of Supply
The law of supply states that, other things equal, the quantity supplied of a good rises when the price of the good rises.
Example: when the price of a good falls from 25 to 10, the quantity supplied falls from 31 to 16.

10 Prof. Trupti Mishra, School of Management, IIT Bombay
Factors Influencing Supply
Price of good or service (P)
Input prices (PI )
Prices of goods related in production (Pr)
Technological advances (T)
Expected future price of product (Pe)
Number of firms producing product (F)

11
- Supply function
- shows relation between P & Qs when all other variables are held constant
Qs = g(P)
Supply Function
Prof. Trupti Mishra, School of Management, IIT Bombay

12 Prof. Trupti Mishra, School of Management, IIT Bombay
Supply Function: Example
Qs = 10Px
If Px = 2, Qs = 20
If Px =5,Qs = 50

13
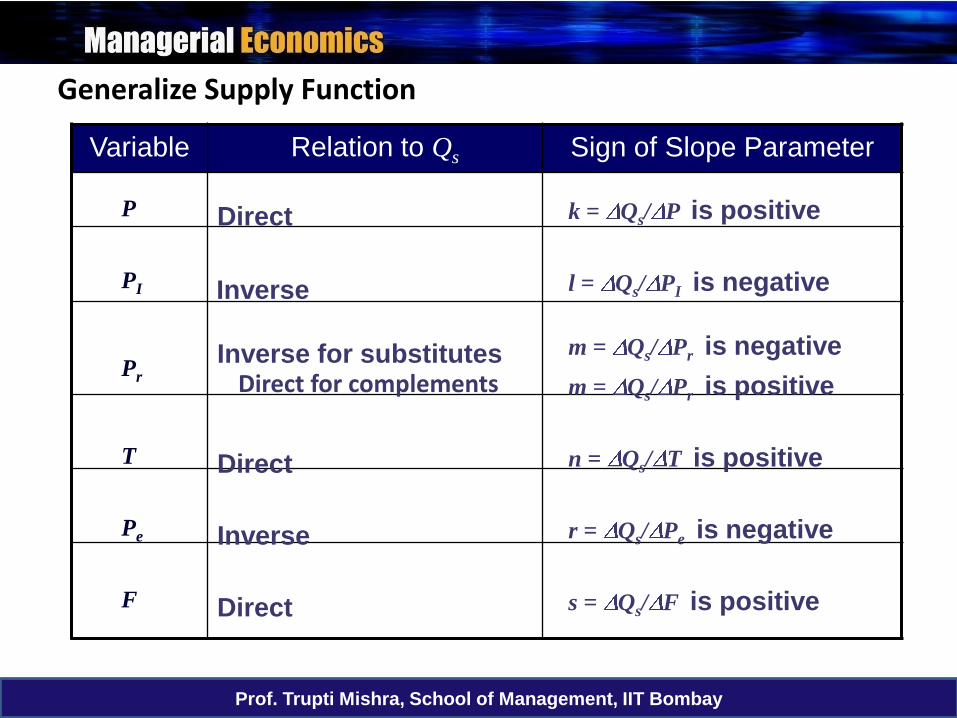
k, l, m, n, r, & s are slope parameters
Measure effect on Qs of changing one of the variables while holding the others constant
Sign of parameter shows how variable is related to Qs
Positive sign indicates direct relationship
Negative sign indicates inverse relationship
s I r eQ h kP lP mP nT rP sF
Generalize Supply Function
Prof. Trupti Mishra, School of Management, IIT Bombay
14
Variable Relation to Qs Sign of Slope Parameter
P
Pe
F
PI
Pr
Direct
Direct
Direct
Inverse
Inverse
Inverse for substitutes
k = Qs/ P is positive
l = Qs/ PI is negative
m = Qs/ Pr is negative
m = Qs/ Pr is positive
r = Qs/ Pe is negative
s = Qs/ F is positive
Direct for complements
n = Qs/ T is positive T
Generalize Supply Function
Prof. Trupti Mishra, School of Management, IIT Bombay

15
Supply Schedule
- The supply schedule is a table that shows the relationship between the price of the good and the quantity supplied.
Prof. Trupti Mishra, School of Management, IIT Bombay

16
Supply Schedule: Example
5 3.00
4 2.50
3 2.00
2 1.50
1 1.00
0 0.50
0 0.00
Quantity of cones Supplied Price of Ice-cream Cone
(Rs)
Prof. Trupti Mishra, School of Management, IIT Bombay

17
5 3.00
0 0.50
0 0.00
A Price of Ice-cream Cone
(Rs)
Market supply Schedule
+
8
0
0
B
13
4 2.50
3 2.00
2 1.50
1 1.00
6
4
2
0
10
7
4
1
0
0
Market
=
Prof. Trupti Mishra, School of Management, IIT Bombay

18
Supply Curve
-The supply curve is a graph of the relationship between the
price of a good and the quantity supplied.
Prof. Trupti Mishra, School of Management, IIT Bombay

19
Price of Ice-Cream Cone
Quantity of Ice-Cream Cones
6 8 10 12 0 2
1.50
1.00
1
2.00
3 4
Rs 3.00
2.50
5
0.50
Supply Curve: Example
Prof. Trupti Mishra, School of Management, IIT Bombay

20
The Determinants of Quantity Supplied
Prof. Trupti Mishra, School of Management, IIT Bombay

21
S0
S2
S1
Supply
decrease
Qs
0 700 100 900 300 500
10
20
30
40
50
60
70
80
Quantity
Pri
ce (
Ru
pees)
P
• •
• •
Supply
increase
Shifts in Supply
Prof. Trupti Mishra, School of Management, IIT Bombay

22
• Equilibrium refers to a situation in which the price has reached the level where quantity supplied equals quantity demanded.
Market Equilibrium
Prof. Trupti Mishra, School of Management, IIT Bombay

23
Equilibrium price & quantity are determined by the intersection of demand & supply curves
At the point of intersection, Qd = Qs
Consumers can purchase all they want & producers can sell all they want at the “market-clearing” price
Market Equilibrium
Prof. Trupti Mishra, School of Management, IIT Bombay

24
At Rs 2.00, the quantity demanded is equal to the
quantity supplied!
Demand Schedule Supply Schedule
Equilibrium
Prof. Trupti Mishra, School of Management, IIT Bombay

25
Equilibrium price
Demand
Supply
Rs 2.00
6 8 10 0
Equilibrium
Equilibrium quantity
Quantity of Ice-
Cream Cones
Price of
Ice-Cream
Cone
4 2 1 3 5 7 9 11
The Equilibrium of Supply and Demand
Prof. Trupti Mishra, School of Management, IIT Bombay

26
Equilibrium
• Surplus
– When price > equilibrium price, then quantity supplied > quantity demanded.
• There is excess supply or a surplus.
• Suppliers will lower the price to increase sales, thereby moving toward equilibrium.
Prof. Trupti Mishra, School of Management, IIT Bombay

27
Equilibrium
• Shortage
– When price < equilibrium price, then quantity demanded > the quantity supplied.
• There is excess demand or a shortage.
• Suppliers will raise the price due to too many buyers chasing too few goods, thereby moving toward equilibrium.
Prof. Trupti Mishra, School of Management, IIT Bombay

28
Demand
Supply
2.00
6 8 10 0 Quantity of Ice-Cream
Cones
Price of Ice-Cream
Cone
4 2 1 3 5 7 9 11
2.50
Surplus
Quantity Demanded
Quantity Supplied
Excess Supply
Prof. Trupti Mishra, School of Management, IIT Bombay

29
Demand
Supply
2.00
6 8 10 0 Quantity of Ice-Cream
Cone
Price of Ice-Cream
Cone
4 2 1 3 5 7 9 11
1.50
Shortage
Quantity Supplied
Quantity Demanded
Excess Demand
Prof. Trupti Mishra, School of Management, IIT Bombay

30
D1
Supply
Rs 2.00
6 10 0 Quantity of Ice-Cream
Cone
Price of Ice-Cream
Cone
4 2 1 3 5 7 11
D2
Rs2.50
1. Hot weather increases the
demand for ice cream…
2. …
resulting in
a higher
price …
3. … and a higher quantity
sold.
New equilibrium
Initial
equilibrium
How an Increase Demand Affects the Equilibrium
Prof. Trupti Mishra, School of Management, IIT Bombay

31
Demand
S1
Rs 2.00
10 0 Quantity of Ice-Cream
Cones
Price of Ice-Cream
Cone
4 2 1 3 7 11
S2
Rs 2.50
1. A technical failure reduces the
supply of ice cream…
2. …
resulting in
a higher
price …
3. … and a lower quantity
sold.
New equilibrium
Initial equilibrium
How a Decrease Demand Affects the Equilibrium
Prof. Trupti Mishra, School of Management, IIT Bombay

32
D1
S1
0 Quantity of Ice-Cream
Cone
Price of Ice-Cream
Cone
Q1
D2
Large increase
in demand
P2
S2
Q2
New
equilibrium
Small
decrease in
supply
Initial equilibrium P1
A Shift in Both Supply and Demand
Prof. Trupti Mishra, School of Management, IIT Bombay

33
D1
S1
0 Quantity of Ice-Cream
Cone
Price of Ice-Cream
Cone
Q1
D2
Large
decrease in
supply
P2
S2
Q2
New
equilibrium
Small increase
in demand
Initial equilibrium
P1
A Shift in Both Supply and Demand
Prof. Trupti Mishra, School of Management, IIT Bombay

34
When demand & supply shift simultaneously
Can predict either the direction in which price changes or the direction in which quantity changes, but not both
The change in equilibrium price or quantity is said to be indeterminate when the direction of change depends on the relative magnitudes by which demand & supply shift
Simultaneous Shifts
Prof. Trupti Mishra, School of Management, IIT Bombay

35
What Happens to Price and Quantity when Supply or Demand Shifts?
Prof. Trupti Mishra, School of Management, IIT Bombay

36
Session Summary
• The demand curve shows how the quantity of a good depends upon the price.
– According to the law of demand, as the price of a good falls, the quantity demanded rises. Therefore, the demand curve slopes downward.
Prof. Trupti Mishra, School of Management, IIT Bombay

37
Session Summary
– In addition to price, other determinants of how much consumers want to buy include income, the prices of complements and substitutes, tastes, expectations, and the number of buyers.
– If one of these factors changes, the demand curve shifts.
Prof. Trupti Mishra, School of Management, IIT Bombay

38
Session Summary
• The supply curve shows how the quantity of a good supplied depends upon the price.
• According to the law of supply, as the price of a good rises, the quantity supplied rises. Therefore, the supply curve slopes upward.
Prof. Trupti Mishra, School of Management, IIT Bombay

39
Session Summary
• In addition to price, other determinants of how much producers want to sell include input prices, technology, expectations, and the number of sellers.
• If one of these factors changes, the supply curve shifts.
Prof. Trupti Mishra, School of Management, IIT Bombay

40
Session Summary
• Market equilibrium is determined by the intersection of the supply and demand curves.
• At the equilibrium price, the quantity demanded equals the quantity supplied.
• The behavior of buyers and sellers naturally drives markets toward their equilibrium.
Prof. Trupti Mishra, School of Management, IIT Bombay

41 Prof. Trupti Mishra, School of Management, IIT Bombay
Managerial Economics; D N Dwivedi, 7th Edition Managerial Economics ; Thomas and Maurice, 9th Edition Managerial Economics ; Mark Hirschey
Session References