€¦ · the demand for ms. lala’s hot dogs questionnaire i would like to ask for your assistance...
TRANSCRIPT

TITLE AN INVESTIGATION INTO THE DEMAND FOR HOT DOGS AT HILLVIEW COLLEGE DURING THE TIME PERIOD OF MORNINGS, RECESS AND LUNCH.

AIMS AND OBJECTIVES To determine if there is a demand for Hot dogs sold by Ms. Lala at Hillview
College Calculating PED (Price Elasticity of Demand)
Factors affecting the demand for hot dogs To establish the relationship between the amount of hot dogs purchased and
different time periods To determine and establish if there is a relationship between between the
quantity of hot dogs demanded and the allowances of students To determine the difference between the price of hot dogs and the quantity
demanded To determine if taste influences the demand for hot dogs To determine what complementary goods are purchased with hot dogs To determine the effect of the prices of the complementary goods affect the
quantity of hot dogs purchased

METHODOLOGY PRIMARY SOURCES
QUESTIONNAIRE-
Each questionnaire contained 12 questions, 11 of which were restricted which allowed responses to be tabulated and easily summarized. It contained one open response question which allowed for a greater depth of responses from each student. In total, 50 questionnaires were distributed to students from forms 1-5. Each form was given 10 questionnaires to fill out. The age ranged from 11-17 years old.
SECONDARY SOURCES
TEXTBOOK-
The textbook was used to obtain relevant information on the theories of demand.

THE DEMAND FOR MS. LALA’S HOT DOGS
QUESTIONNAIRE I would like to ask for your assistance in conducting research for my Economics SBA. Honest responses and answers will be greatly appreciated. I thank you in advance for your time and co-operation.
1. What form are you in?
1 2 3 4 5
2. Do you purchase Ms. Lala’s?
Yes No
3. When do you consume hot dogs?
Breakfast Recess Lunch Never
4. How many times do you purchase hot dogs for the week?
0 1 2 3 4 5 6 >6
5. If your allowance increased, you would
Buy more hot dogs Buy less hot dogs Switch to alloo pies
6. If your allowance decreased, you would
Buy more hot dogs Buy less hot dogs Switch to alloo pies
7. (a)If the price of hot dogs increased by $2, you would
Buy more hot dogs
Buy less hot dogs
Switch to alloo pies
(B)How much hot dogs would u now purchase?
1 3 5 7
2 4 6 8
8. (a)If the price of hot dogs decrease by $2, you would

Buy more hot dogs
Buy less hot dogs
Switch to alloo pies
(B)How much hot dogs would u now purchase?
1 3 5 7
2 4 6 8
9. Does the taste of hot dogs influence the quantity you purchase?
Yes No
10. Do you consume other goods with hot dogs?
Yes No
If yes, which good? __________________
11. If the price of the other good increased, would this influence the quantity of hot dogs you purchase?
Yes No
12. If yes, how would it affect the quantity of hot dogs you purchase?
Yes No Buy another product
Thank you for your co-operation!!!!
PRESENTATION OF DATA
The following is a presentation of data that has been collected and calculated.

QUESTION 1:
Form 1 2 3 4 5
No. Of Students 10 10 10 10 10
What form are you in? When the results were calculated, it was seen that 20% of the students who did the questionnaire came from each of the 5 forms. QUESTION 2:
Purchase hot dogs Do not purchase hot dogs
Number of students 33 17
Forms:

Figure 2.
Do you purchase Ms. Lala’s Hot Dogs? When the results were calculated, 34% of the students said they did not purchase hot dogs from Ms. Lala while 66% of the students said they purchased Ms. Lala’s hot dogs. This shows a greater percentage of the students purchasing hot dogs.
QUESTION 3:
Breakfast Recess Lunch Never
No. Of Students 10 16 7 17

Figure 3.
When do you consume these hot dogs? From the data collected and tabulated,it was seen that 20% of the students who performed this questionnaire ate hot dogs for breakfast, 32% ate hot dogs for recess, 14% of them are it for lunch and 34% do not eat it at all. QUESTION 4:
No. Of Hot Dogs
0 1 2 3 4 5 6 >6
No. Of students
17 7 10 4 2 2 5 3

Figure 4.
How many hot dogs do you purchase per week? From the results shown in figure 4, 34% of students do not purchase hot dogs, while 14% purchase 1 per week, 20% twice for the week, 8% purchase 3 per week, with 4% of students purchasing 4 & 5 hotdogs each per week, with 10% purchasing 6 and 6% purchasing more than 6 hot dogs for the week. Most students who purchased hot dogs purchased 1 and 2 hot dogs for the week. QUESTION 5:
Buy more hot dogs Buy less hot dogs Switch to aloo pie
No. Of Students 35 7 8

Figure 5.
What would you do if your allowance increased? From the results obtained, it was seen that the majority of the students(70%) said that they would buy more hot dogs if their allowances increased. 7% said they would buy less while hot dogs while 8% said they'd rather buy aloo pies instead. QUESTION 6:
Buy more hot dogs Buy less hot dogs Switch to aloo pie
No. Of Students 10 37 3

Figure 6.
What would you do if your allowance decreased? The majority of the students(74%) said that if their allowance decreased, they would purchase less hot dogs while 20% of the students said they'd purchase more hot dogs with the last 6% switching to aloo pies. QUESTION 7:
Buy more hot dogs Buy less hot dogs Switch to aloo pie
No. Of Students 4 25 21

Figure 7.
What would you do if the price of hot dogs increased by $2? From the tabulated results in figure 7, it can be seen that majority of the students would purchase less hot dogs (50%) while 42% of the students would switch to alloo pies with only 8% of the students opting to purchase more hot dogs.
Quantity Purchased if Price Increases by $2:
No. Of Hot Dogs
0 1 2 3 4 5 6 7 8
No. Of students
19 13 7 3 3 2 1 2 0

The pie chart above represents the quantity of hot dogs students will purchase if the price of these hit dogs were to increase. QUESTION 8:
Buy more hot dogs Switch to alloo pies Remain the same
No. Of students 19 12 19

Figure 8.
What would you do if the price of hot dogs decreased by $2? From the results collected and the chart plotted, it can be seen that majority of the students opted to buy more hot dogs and buy the same amount of hot dogs. 38% of the students each decided on these choices with a minority choosing to switch to alloo pies.
Quantity Purchased if Price decreased by $2:
0 1 2 3 4 5 6 7 8
No. Of students
12 7 11
8 1 3 3 5 1
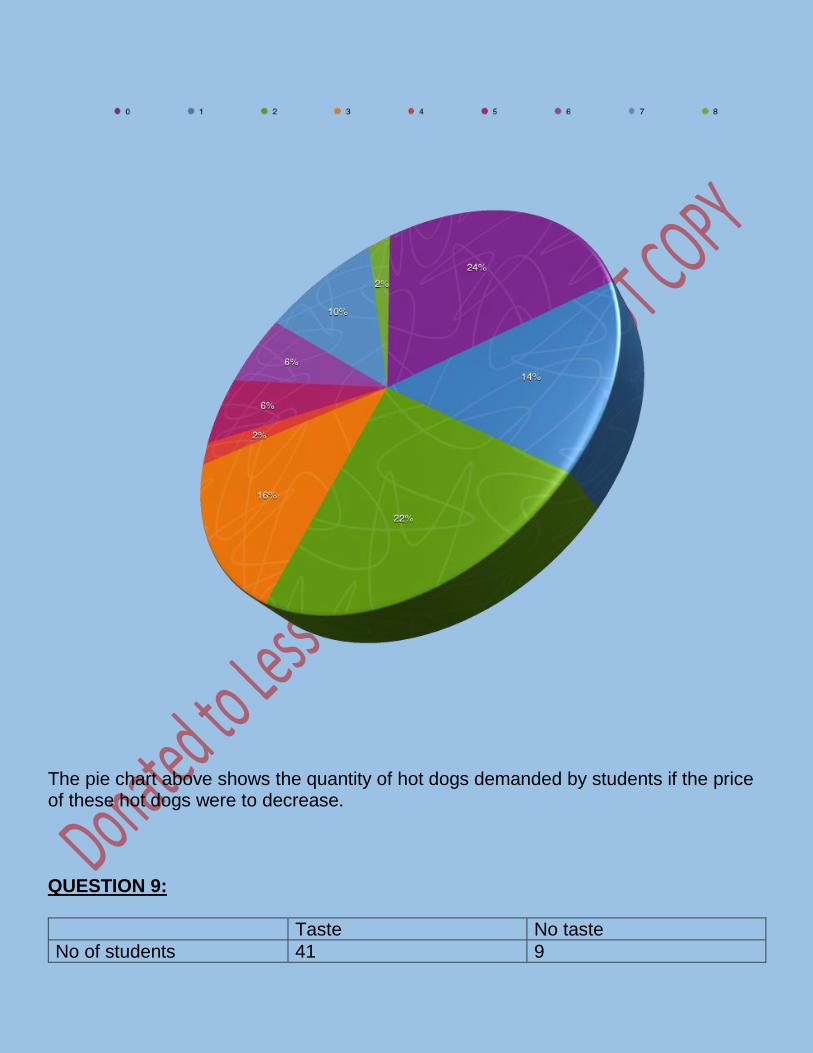
The pie chart above shows the quantity of hot dogs demanded by students if the price of these hot dogs were to decrease. QUESTION 9:
Taste No taste
No of students 41 9

Figure 9.
Does the taste of hot dogs influence the amount you purchase? From the data tabulated, it was seen that 82% of the students allow the taste of the hot dogs to influence the amount they purchase with 18% not allowing the taste of the hot dogs to influence the quantity they purchase. QUESTION 10:

Do you purchase other goods with hot dogs?
Yes No
No. Of students 37 13
Figure 10.1 From the results collected above, it can be seen that 74% of the students purchase other goods with hot dogs while 26% didn't. Which goods do you purchase hot dogs?
Juice Water Coca Cola Donuts Mints

No. Of students 9 13 5 3 7
Figure 10.2 35% of the students preferred water as their complementary good which was the most of the students. 24% demanded juice with 19% demanding mints, 14% preferring coca cola and 8 % choosing donuts. Water and juice were the most popular complementary goods of hot dogs among the students.

QUESTION 11:
Yes No
No. Of students 33 17
Figure 11.
If the price of these complementary goods increased, would this alter your demand for hot dogs? From the results collected, majority of the students’ demand for hot dogs would be affected by the price of the complementary goods (66%). 34% of the students would let the cost of these complementary goods affect the quantity of hot dogs that they purchase.
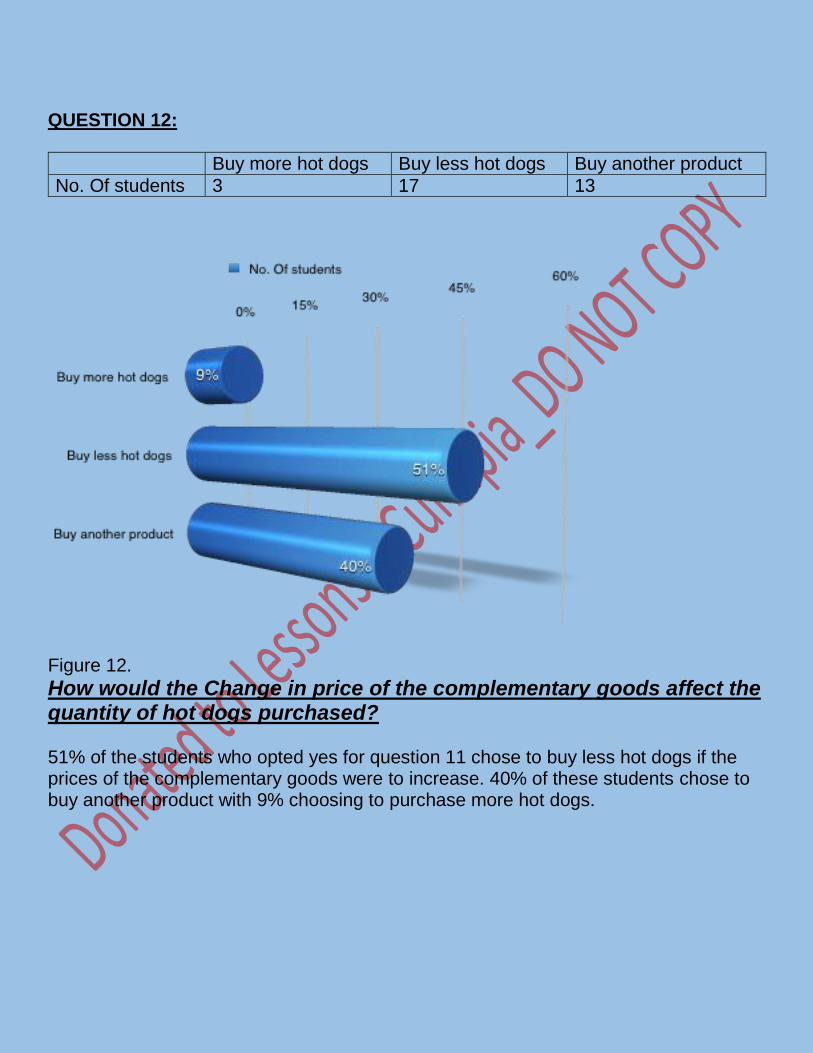
QUESTION 12:
Buy more hot dogs Buy less hot dogs Buy another product
No. Of students 3 17 13
Figure 12.
How would the Change in price of the complementary goods affect the quantity of hot dogs purchased? 51% of the students who opted yes for question 11 chose to buy less hot dogs if the prices of the complementary goods were to increase. 40% of these students chose to buy another product with 9% choosing to purchase more hot dogs.

ANALYSIS AND INTERPRETATION Fifty students were given questionnaires with 10 from each form. Of the fifty students, 33 of them purchase hot dogs. Demand is the desire and willingness to buy a product, backed by the ability to pay for the good of service. Therefore an assumption can be made that those who purchase hot dogs have the ability/ amount of money to purchase it. Of those students who purchase hot dogs, for the question where they were asked how many hotdogs do they purchase per week, majority of them purchase 1-2 hot dogs per week. Also, of the students who purchase hot dogs, the most of them purchase hot dogs during recess with some purchasing it for breakfast and the least for lunch. From the questions asked, it was concluded that the factors affecting the quantity of hot dogs demanded by the students were:
1) Price of Hot Dogs 2) The Allowance of the student 3) The taste of the hot dogs 4) The cost of the complementary goods
These factors were be investigated based on the laws of demand and graphs were plotted to show how they relate to the demand theory.

The law of demand states that other factors being constant(Ceteris Paribus), price and quantity demand of any good and service are inversely related to each other. When the price of the product increases, he demand for it will decrease. This is the natural behavior of the consumer to hesitate to spend more for the good with the fear of running out of cash. This law is shown in questions 7 and 8 where the student was asked what they would do if the price of hot dogs increased or decreased. The demand curve below, represents this law of demand. From the results collected, it was seem that if the price of the hot dogs were to increase by $2 from $5 to $7, the demand of the the hot dog would thereby decrease. If the price of the hot dogs decreased, then demand for it increased.
D
D
Price of Hot dogs
Quantity Demanded
$7
$5
Q2 Q1
Demand Curve representing Changes in Demand as Price Increases

It was seen that the factor of the allowance of the student indicates the quantity of hot dogs demanded. As allowance increased, their demand for hot dogs increase as well. Thus as their allowance decreased, the quantity of hot dogs demanded decreased. Therefore the quantity of hot dogs demanded depends on the budget of the individual.
Allo
wance
Quantity Demanded
D1
D2
Demand Curve showing shift in Demand

The Price Elasticity of Demand(P.E.D) was then required to be calculated. This is the measure the responsiveness/ elasticity of a quantity of a good or service due to a change in price, Ceteris Paribus. FORMULA FOR CALCULATING P.E.D. :
% Change In Price: ($7 - $5) x 100 40%
$5 % Change in Demand: 78 - 107 x 100 -27%
107 P.E.D. = -27%. -0.675
40%