demand optimization with lightinge2s2.ndia.org/schedule/documents/abstracts/12282.pdf · ashrae...
TRANSCRIPT

NDIA
Demand Optimization with Lighting
Scott Ziegenfus, LEED APSenior Applications Engineer Lutron Electronics Co., Inc
ASHRAE SPC 201P Facility Smart Grid Information Model Committee MemberASHRAE SSPC 135 BACnet Committee Member
NDIA

NDIA
Demand Response - what is it?
Demand Response (DR)– Manage customer electricity consumption in response to supply conditions,
critical times or market prices. – A different concept from energy efficiency.– The goal is a STABLE Electric Supply with minimal transients (peaks and
valleys).
Source: NIST Smart Grid Framework 1.0 Sept 2009

NDIA
Demand Response - what is it?
• Emergency DR vs. Economic DR– Emergency demand response is primarily needed to avoid outages and
peak charges. – Some facilities, corporations, and institutions have initiated internal Demand
Response initiatives to avoid peak charges, emphasize onsite generation, move demand to non peak hours (night time)
– Economic demand response is because Electricity is a tradable commodity.
Source: NIST Smart Grid Framework 1.0 Sept 2009

NDIA
Demand Response Programs - Who Administers it?
Independent System Operator (ISO)Regional Transmission Operator (RTO)
– Control the operation and stability of the Electric Grid
– The distribution system of the electricity industry
– Facilitate demand-side management – Most DR programs require a minimum of
100 KW to participate.– Certifies Curtailment Service Providers
(CSP)• A company authorized to act as an interface
between the ISO/RTO and end-use customers • Also known as a Demand Response Provider or
Energy Aggregator.
Grid OperatorISO/RTO
Curtailment Service Provider Electric Utility
End User

NDIA
Demand Response Programs - How do they work?
Y-A
xis
Y-A
xis
00:0
0:00
01:0
0:00
02:0
0:00
03:0
0:00
04:0
0:00
04:0
0:00
06:0
0:00
07:0
0:00
08:0
0:00
09:0
0:00
10:0
0:00
11:0
0:00
12:0
0:00
13:0
0:00
14:0
0:00
15:0
0:00
16:0
0:00
17:0
0:00
18:0
0:00
19:0
0:00
20:0
0:00
21:0
0:00
22:0
0:00
23:0
0:00
Ele
ctric
Usa
ge (K
W)
CurtailmentPeriod
Time
Normal Usage
Actual Usage with Demand Response
Demand Response (DR)– Demand response can involve curtailing power used or through on
site generation. – Current demand response schemes often implement the use of control
systems to shed loads. Load shed is the action to demand Response– Most DR programs are manually implemented

NDIA
Commercial Electricity Usage
Load Shed Reduction Strategies– Lighting and HVAC account for over 2/3 of all electricity in
commercial buildings with lighting being the biggest contributor– Lighting and HVAC are the number 1 & 2 loadshed strategies
• Load Shed Reductions Should Consider– Productivity impact
• Average Building Costs– Personnel: $200.00 to $400.00/ft2– Energy: $2.00 to $4.00/ft2
– Management and control• Lighting is the easier strategy
– Little Management– Little Productivity impact
Source: DOE 2003 Commercial Buildings Energy Consumption Survey

NDIA
HVAC MANAGEMENT– HVAC, by definition, has multiple
components that are interdependent• Humidity / temperature / air movement
– HVAC has a recovery period exiting DR • It can take hours to bring a building back to
desired temperature after it has been shut off. • If recovery too severe peak charges can occur
– Load shed for AC depends on the time of day and weather conditions making the amount of load shed unpredictable.
– Temp reduction can damage equipment that relies on continuous cooling.
– Complex systems often use both heating and cooling systems simultaneously. Increasing temp set points can results in higher energy costs.
Demand Response and Management of HVAC
recovery
recovery

NDIA
Demand Response and Management of Lighting
Lighting MANAGEMENT– Lighting control is linear and predictive
• Light Power Density = Watt/Ft2
• Electrical Power in Watts = Voltage x Current– No recovery period or time delay with Lighting– Lighting is almost a “SET IT AND FORGET IT” DR strategy
• HVAC entails a strong amount of management compared to Lighting.
TIMEIlluminationCurrent
NDIA
Demand Response and Productivity Impact of HVAC
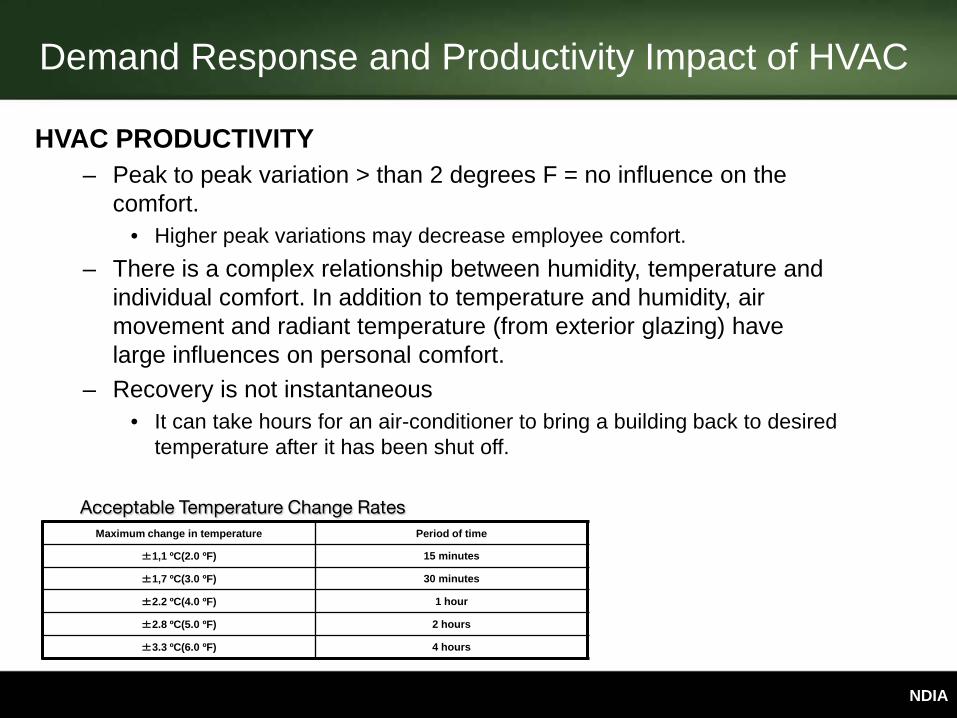
HVAC PRODUCTIVITY– Peak to peak variation > than 2 degrees F = no influence on the
comfort. • Higher peak variations may decrease employee comfort.
– There is a complex relationship between humidity, temperature and individual comfort. In addition to temperature and humidity, air movement and radiant temperature (from exterior glazing) have large influences on personal comfort.
– Recovery is not instantaneous• It can take hours for an air-conditioner to bring a building back to desired
temperature after it has been shut off.
Maximum change in temperature Period of time
±1,1 ºC(2.0 ºF) 15 minutes
±1,7 ºC(3.0 ºF) 30 minutes
±2.2 ºC(4.0 ºF) 1 hour
±2.8 ºC(5.0 ºF) 2 hours
±3.3 ºC(6.0 ºF) 4 hours
Acceptable Temperature Change Rates
NDIA
Demand Response and Productivity Impact of Lighting
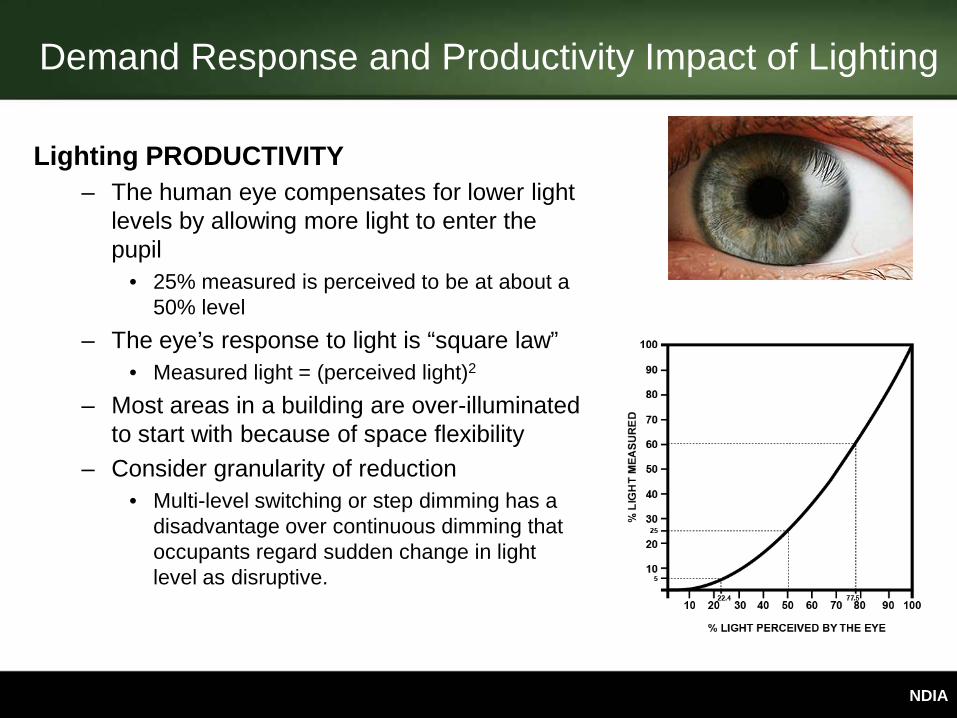
Lighting PRODUCTIVITY– The human eye compensates for lower light
levels by allowing more light to enter the pupil
• 25% measured is perceived to be at about a 50% level
– The eye’s response to light is “square law”• Measured light = (perceived light)2
– Most areas in a building are over-illuminated to start with because of space flexibility
– Consider granularity of reduction• Multi-level switching or step dimming has a
disadvantage over continuous dimming that occupants regard sudden change in light level as disruptive.
NDIA
Demand Response and Productivity Impact of Lighting
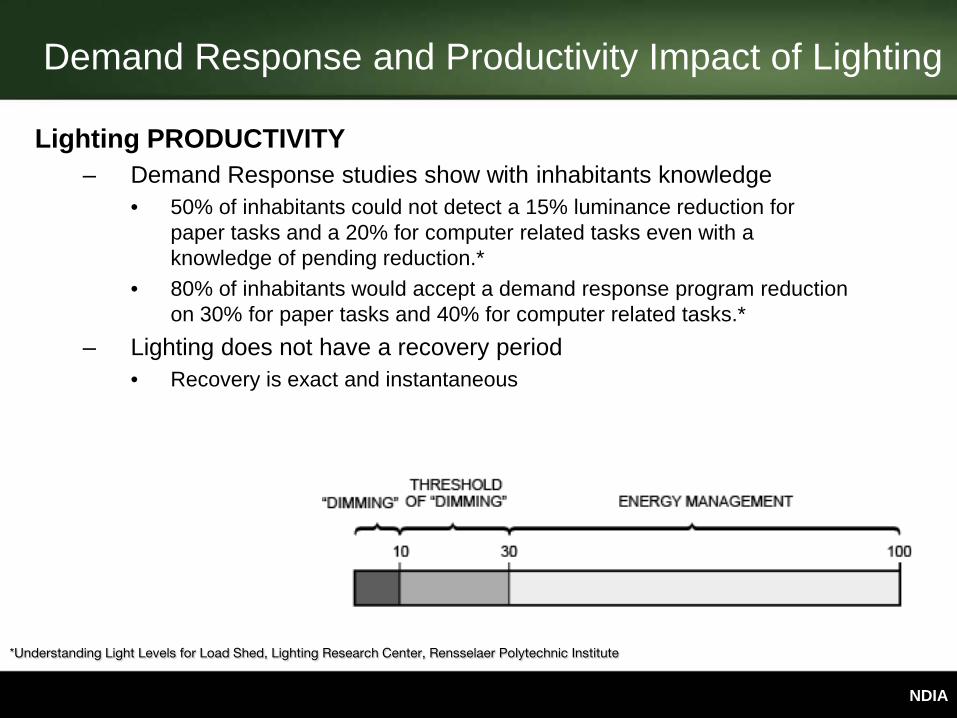
Lighting PRODUCTIVITY– Demand Response studies show with inhabitants knowledge
• 50% of inhabitants could not detect a 15% luminance reduction for paper tasks and a 20% for computer related tasks even with a knowledge of pending reduction.*
• 80% of inhabitants would accept a demand response program reduction on 30% for paper tasks and 40% for computer related tasks.*
– Lighting does not have a recovery period• Recovery is exact and instantaneous
*Understanding Light Levels for Load Shed, Lighting Research Center, Rensselaer Polytechnic Institute

NDIA
Permanent Demand Reduction Lighting Strategies
“permanent improvements in efficiency were discovered through the planning and implementation of “temporary” demand responsestrategies.” Strategies for Demand Response in Commercial Buildings, Lawrence Berkeley National Laboratory

NDIA
Demand Response In New Standards
Section 7.4.5.1 of ASHRAE 189.1 – 7.4.5.1 Peak Load Reduction/Load Factor. Building projects shall contain
automatic systems such as demand-limiting or load shifting to reduce electric peak demand of the building by not less than 10%. Standby power generation shall not be used to achieve the reduction in peak capacity.
Section 605.4 of INTERNATIONAL green CONSTRUCTION CODE®
(IgCC®) – 605.4 Lighting. The Auto-DR system shall be capable of reducing total
connected power of lighting in Group B, office, spaces by at least 30 percent.
LEED 2012 BD+C, ID+C, EBOM – Pilot Credit 8 EA: Demand Response– Option 1. Demand Response Program– Option 2. Permanent Peak Load Shifting
• Implement electrical load shifting measures that permanently transfer regulated electricity demand from daytime hours to off-peak hours. Demand shifting measures must result in a reduction of 10%

NDIA
Power System to remaining at a steady state is a manual endeavor
Central GeneratingStation
Step-Up Transformer
DistributionSubstation
ReceivingStation
DistributionSubstation
DistributionSubstation
Commercial
Industrial Commercial
Gas Turbine
DieselEngine
Cogeneration
CogenerationTurbine
Fuel cell
Micro-turbine
Wind Power
Residential
Storage
Photovoltaic systems
1.Power System Infrastructure
Source: IEC TC57 Information Models - CIM & 61850.ppt
Demand Response Today
NDIA
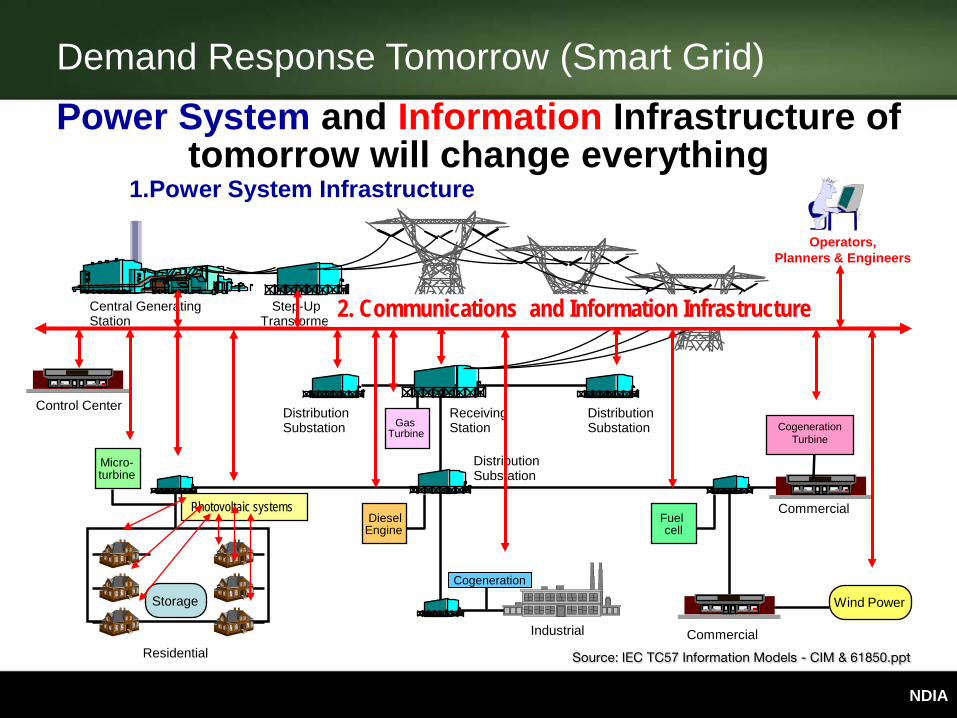
Power System and Information Infrastructure of tomorrow will change everything
Central GeneratingStation
Step-Up Transformer
DistributionSubstation
ReceivingStation
DistributionSubstation
DistributionSubstation
Commercial
Industrial Commercial
Gas Turbine
DieselEngine
Cogeneration
CogenerationTurbine
Fuel cell
Micro-turbine
Wind Power
Residential
Storage
Photovoltaic systems
Control Center
Operators,Planners & Engineers
2. Communications and Information Infrastructure
1.Power System Infrastructure
Source: IEC TC57 Information Models - CIM & 61850.ppt
Demand Response Tomorrow (Smart Grid)

NDIA
Demand Optimization with Lighting
“The key to the potential of a demand-responsive lighting system is that it provides a simple, reliable, and painless way to decrease load.”
Energy-Efficient Load-Shedding Lighting Technology California Energy Commission.