demand response fundamentals, evolution, and industry leaders · 2019-07-11 · generation combined...
TRANSCRIPT
www.peakload.org
www.peakload.org
Demand Response Fundamentals, Evolution, and Industry Leaders
Ed Thomas, PLMA Executive Director [email protected] – (707) 652-5333
Ed Thomas, PLMA Executive [email protected] (707) 652-5333


1. Accenture2. Advanced Energy3. Alectra Utilities4. Ally Energy Solutions5. AESC6. Ameren7. American Public Power 8. Apogee Interactive9. Applied Energy Group10. Arizona Public Service11. Aquanta 12. Austin Energy13. AutoGrid Systems14. BGE, an Exelon Company15. Berkshire Hathaway Energy
16. Bidgely17. Blackhawk Network18. Bonneville Power Admin.19. BPL Global20. BTES21. Buffalo Niagara Medical Ctr
22. Carina Technology23. Central Hudson G&E24. Centrica Business Solutions
25. Chelen PUD 26. City of Tallahassee Utilities27. CLEAResult28. COI Energy Services29. Commonwealth Edison30. Con Edison31. Connected Energy
32. Consumers Energy Co.33. Cpower34. CPS Energy 35. Crius Energy36. Customized Energy Solutions
37. Dairyland Power Co-op38. DTE Energy39. Duke Energy40. E Source41. E4TheFuture42. Eaton43. Ecobee44. EcoFactor45. Ecotagious46. Edison Electric Institute47. Efficiency Vermont48. Electric Ireland49. Emerson Climate Tech.50. Enbala51. Encycle52. Enel X53. Energy Datametrics54. Energy Federation 55. EnergyHub56. Energy Solutions57. EnerVision58. Engie59. Entergy60. EPRI61. ERS62. Eversource
63. Extensible Energy64. Fairbanks Morse65. FleetCarma66. Franklin Energy67. Georgia Power68. Google (Nest) 69. Great River Energy70. GridOptimize71. Hawaiian Electric72. High West Energy73. Honeywell Smart Energy 74. ICF 75. Idaho Power76. IGS77. Illume Advising78. Indianapolis Power & Light79. Integral Analytics80. IPKeys Power Partners81. Itron82. Jackson EMC83. JouleSmart Solutions84. KCP&L85. Landis & Gyr86. Leap87. Lockheed Martin88. Message Broadcast89. Modesto Irrigation District 90. Mosaic Power91. National Grid92. NRECA93. Navigant
94. NB Power95. New Hampshire Electric Coop.
96. Nexant97. Next Energy Party98. New Braunfels Utilities99. North Carolina EMC100.Northwestern REC101.NRG Curtailment Solutions
102.NTC Corporate103.Oglethorpe Power Corp104.Okla. Gas & Electric105.Olivine106.Omnetric107.Oncor Energy Delivery108.Opinion Dynamics109.Orange & Rockland Utilities
110.Pacific Gas and Electric111.PECO, an Exelon Company112.Pepco, an Exelon Company
113.Portland General Electric114.Powerley115.Rappahannock Electric116.Research into Action117.RF Demand Solutions118.SMUD119.Salt River Project120.San Diego Gas & Electric121.Schneider Electric122.Scope Services123.Sensus USA124.Simple Energy
125.Skipping Stone126.SEPA127.Snohomish PUD128.Southern Calif. Edison129.SoCal Gas130.Steffes Corporation131.Tacoma Power132.Tantalus133.Tendril134.Tenn Muni Electric Pwr Assn
135.Tenn. Valley Authority136.The Brattle Group137.Threshold 138.Tierra Resource Consultants
139.Tokyo Electric Power140.Tri-State G&T Assoc.141.Tucson Electric Power142.United Illuminating143.Utility Load Mgmt Exchange
144.Vectren145.Virtical Peaker146.Waseda University147.WaterFurnace148.Westar Energy149.West Monroe Partners150.Whisker Labs151.Xcel Energy152.Zen Ecosystems153.Zeuthen Mgmt Solutions154.ZOME Energy Networks
Voice of Load Management Practitioner

PRACTITIONER ENGAGEMENT

Demand Response Fundamentals
5

Demand Side Management
Conservation
Energy Efficiency
Demand Response
Load Shape Impact of
Residential Direct Load Control
0
1
2
3
4
5
6
0:00 2:00 4:00 6:00 8:00 10:00 12:00 14:00 16:00 18:00 20:00 22:00
kW
Projected Load
Load on TOU Rate
During CPP Event
6

Demand Response – its “Fast EE” for the Grid
7
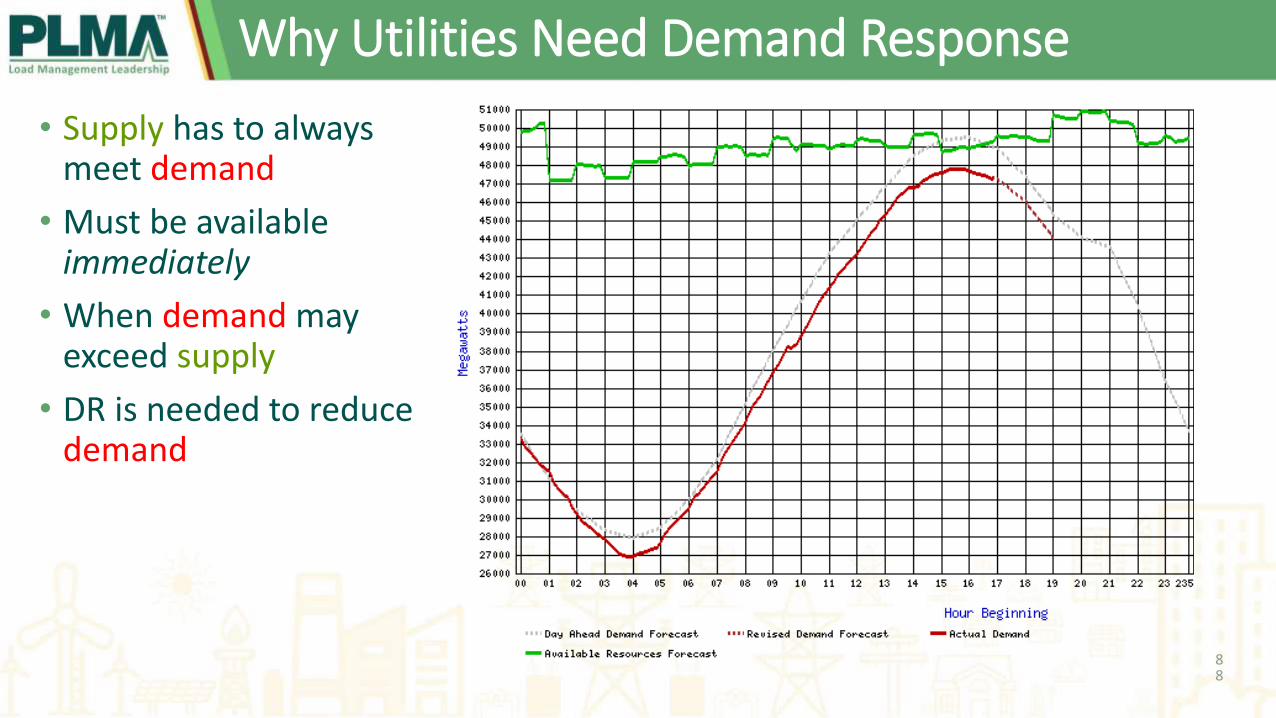
Why Utilities Need Demand Response
• Supply has to always meet demand
• Must be available immediately
• When demand may exceed supply
• DR is needed to reduce demand
88

The Economic Definition of DR
The “response” is based on a payment for either:• the willingness to change behavior (capacity), or• the actual change (performance)
in the “demand” level of electric energy
Payment can be based on the actual reduction
controlled by:• the electricity customer, or• programmed into the customer’s equipment
responding to either:• a grid system operator reliability request, or• a price signal, or• on the availability to be on call
9

Bombardier CRJ-700 Only Has Capacity for 70 People
80 People show up for a flight on a day of high travel demand
Airline pays 10 people to take a later flight (e.g. provide an incentive in the form of ticket vouchers)
Demand Response in the Airline Industry
Source: Skipping Stone10

Demand Response in the Utility Industry
Power Grid only has 70 MW
Power Grid needs 80 MW
Power Grid pays consumers to reduce 10 MW to balance supply & demand
Source: Skipping Stone11

• Delaying investments in new generation capacity to meet reserve requirements
Capacity Deferral
• Developing curtailment capability to address short-term/emergency supply shortfalls
Improved Reliability
• Delaying investment in specific, localized substations and feeders using DR as a demand side resource
Deferral of T&D Upgrades
• Reduction of system operating costs through fewer starts of peaking units, reduced need for spinning reserve from generators, and economic dispatch of DR resources
Operational Cost Savings (Economic Dispatch)
• A possible alternative to new generation or a more economical way to provide ancillary services
Integration of Intermittent Renewable Resources
• Commission rulings to have ESPs fund and operate DR programs or achieve DR curtailment goals
Regulatory requirements
Source: Navigant
Policy Drivers of DR Programs
12

Types of DR programs
• Dispatchable = call or control or bid in advance• Wholesale market directed economic programs• Wholesale market directed reliability programs• Direct Load Control, e.g. automatic appliance shut-off• Interruptible Rates, i.e. lower rates for directed
reductions
• Non-Dispatchable / Price-Responsive Demand = pre-set• Critical Peak Pricing – scheduled • Peak Time Rebate – built into a rate• Time-Of-Use Pricing – annual schedule• Dynamic Pricing – all of the above
13

Peak-Day Load Shape
Before and After Load Control
8,000
9,000
10,000
11,000
12,000
9 10 11 12 13 14 15 16 17 18 19 20 21 22 23 24
Hour
Meg
aw
att
s
Use few DR
resources
Use more
DR
resources
Use few DR
resources
1000 MW
Source: Navigant
500 MW250 MW
Call on DR when it is needed
14

• Manage pre-event load to get more during event
• Manage post-event snapback to avoid new peak
• Smooth out load reduction to give steady MW that operators can count on
• Monitor indoor temperatures (for HVAC loads) to ensure customer comfort
Load Shape Impact of
Residential Direct Load Control
0
1
2
3
4
5
6
0:00 2:00 4:00 6:00 8:00 10:00 12:00 14:00 16:00 18:00 20:00 22:00
kW
Projected Load
Load on TOU Rate
During CPP Event
Source: Navigant
DR Impact on the System Load Can be Nuanced
15

Optimizing Multiple DR Resources Maximizes System Peak Reduction
• Smooth load shape during control event
• Like a bull pen, different loads can be called when needed
• Its all about the load impact, not what is controlled
Peak-Day Load Shape
Before and After Load Control
6,000
7,000
8,000
9,000
10,000
11,000
12,000
13,000
1 2 3 4 5 6 7 8 9 10 11 12 13 14 15 16 17 18 19 20 21 22 23 24
Hour
Meg
aw
att
s
Projected Load
After Load Control
Dispatched
Load control creates
an 8-hour flat peak
Source: Navigant16

Demand Response Evolution
17

Demand Response Evolution
• Largely manual control
• Interruptible tariffs for large C&I
• 1-way Direct Load Control for Residential
• Used for Capacity Planning & Emergencies
• Introduced To Wholesale Markets
• Increased automation
• Increased Precision
• Eventually Ancillary Services
• Behavioral/voluntary Options
• Smarter Equipment
• 2-way communications
• Some Near Real-Time Visibility
• Provide Multiple Grid Services
• Respond to Controls and/or Price Signals
• Distribution & Transmission Relief
• Introduction of Storage
• Migration to DER
18

Renewables Growth Creates DR Opportunities
Source: California Independent System Operator
Reductions in load could allow generators time to ramp up
Increase in load could allow generators time to ramp down
19
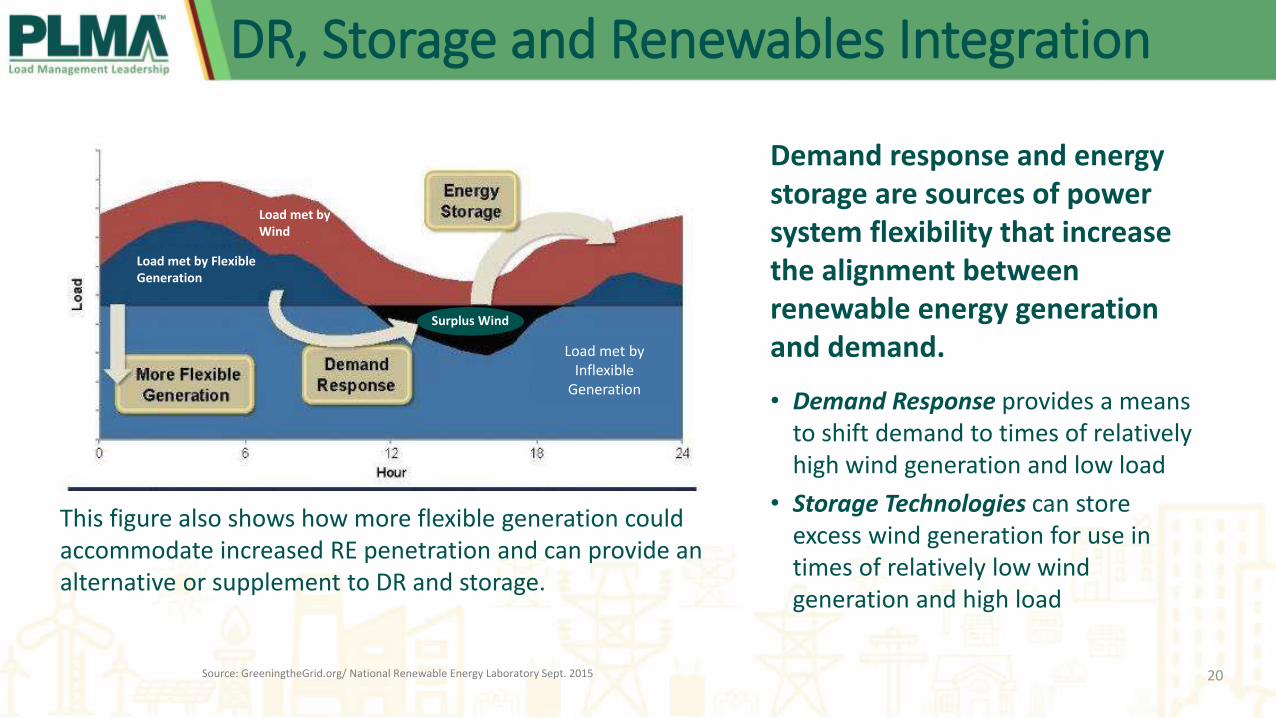
DR, Storage and Renewables Integration
Load met by Wind
Load met by Flexible Generation
Surplus Wind
Load met by Inflexible
Generation
Demand response and energy storage are sources of power system flexibility that increase the alignment between renewable energy generation and demand.
• Demand Response provides a means to shift demand to times of relatively high wind generation and low load
• Storage Technologies can store excess wind generation for use in times of relatively low wind generation and high load
This figure also shows how more flexible generation could accommodate increased RE penetration and can provide an alternative or supplement to DR and storage.
Source: GreeningtheGrid.org/ National Renewable Energy Laboratory Sept. 2015 20

DSM
Energy Efficiency
Demand Response
Energy Storage
DistributedGeneration
Combined Heat & Power
Solar PV Systems
MicroGrid
Thermal Storage & Batteries
Grid-Interactive
Water Heaters
DR is Part of Integrated Demand Side Management (IDSM)
A program design type that delivers the benefits of EE to customers and DR to the grid using the same technology intervention and/or a linked incentive while leveraging the same program delivery resources and infrastructure.
21

Thought Leadership

Table of Contents
• Western Utility Perspectives of Demand Response, DER, Load Growth, and More - Mark Martinez, Southern California Edison, with Kent Walter, Arizona Public Service; Fabienne Arnoud, Pacific Gas & Electric; Brad Mantz, San Diego Gas & Electric; Richard Barone, Hawaiian Electric; and Darren Hanway, Southern California Gas
• Leveraging Legacy Technology Platforms for the New DER World - Richard Philip, Duke Energy, with Wayne Callender, CPS Energy; Mitch Vanden Langenberg, Dairyland Power Cooperative; and Derek Kirchner, DTE Energy
• The Future of DER: Energizing the Smart Home - Tom Kerber, Parks Associates with Rich Barone, Hawaiian Electric Company; Michael Brown, Berkshire Hathaway NV Energy and PLMA Board Chair; Tony Koch, Bonneville Power Administration; John Powers, Extensible Energy
• DERMS Software Selection Group Discussion - John Brown, Skipping Stone with Rich Barone, Hawaiian Electric; Jim Musilek, North Carolina EMC; Derek Kirchner, DTE Energy; Lee Hall, Bonneville Power Administration; Paul Wassink, National Grid
• DER Integration Challenges - John Powers, Extensible Energy, with Kelsey Horowitz, NREL; Rich Barone, Hawaiian Electric; and Matt Carlson, Aquanta
• Reinventing Demand Response with DERs - Derek Kirchner, DTE Energy with Rich Barone, Hawaiian Electric; Troy Eichenberger, Tennessee Valley Authority; and Brenda Chew, Smart Electric Power Alliance
• Save or Shift? How to Successfully Transition from EE to DSM/DER - Ray Martinez, Tucson Electric Power with Tom Hines, Tierra Resource Consultants
• Three Utility Approaches to Gas Demand Response - Brett Feldman, Navigant with Charles Umberger, Con Edison; Paul Wassink, National Grid; and Andrew Nih, Southern California Gas Company


Featured Case Studies

Learn more at www.peakload.org

www.peakload.org
www.peakload.org
Demand Response Fundamentals, Evolution, and Industry Trends
Ed Thomas, PLMA Executive Director [email protected] – (707) 652-5333
Ed Thomas, PLMA Executive [email protected] (707) 652-5333