demand, supply, and sustainabilityrural finance in the lao people’s democratic republic: demand,...
TRANSCRIPT

Rural Financein the LaoPeople’sDemocraticRepublic:Demand, Supply,and SustainabilityResults of Household and Supplier Surveys
Brett E. ColemanJon Wynne-Williams

Asian Development Bank6 ADB Avenue, Mandaluyong City1550 Metro Manila, Philippineswww.adb.orgPublication Stock No. 060406 Printed in the Philippines
Rural Finance in the Lao PDR
Rural financial markets have enormous potential to contribute to economicgrowth and poverty reduction in the Lao PDR, but they remain underdeveloped.Until recently, the Government’s policy to deliver rural financial services wasfocused on channeling directed, subsidized credit through the AgriculturePromotion Bank (APB). As in many countries, this initiative was well intentionedbut has had limited success. APB serves the credit needs of only 2% of ruralhouseholds, while other formal and semiformal financial institutions reachanother 5%. By contrast, 33% of rural households borrow from informalsources, such as friends, family, and moneylenders. Unmet demand for credit is 7times larger than actual borrowing for the average rural household; for poorrural households, it is 40 times larger.
This study is based on a national survey of nearly 1,200 rural households, aswell as all commercial banks and known microfinance initiatives in 2004. Itattempts to provide a comprehensive overview of rural finance in the Lao PDR, toinform the Government’s policy decisions and strategy formulation fordeveloping the sector, to inform practitioners in designing microfinanceinitiatives, and to provide a baseline for monitoring development of the sectorunder the Government’s Rural Finance Sector Development Program to belaunched in 2006.
The key conclusion of this study is that the formal sector (banks) andsemiformal sector (microfinance initiatives) are currently not meeting thedemand for financial services of the vast majority of rural households in the LaoPDR. However, the study’s critical assessment points to opportunities and hopefor developing rural finance so it can achieve its potential contribution togrowth and poverty reduction. The study notes that the Government’s newpolicy, issued by the Prime Minister’s Office in 2003, is based on a commercial,market-oriented approach driven largely by the private sector within an enablingpolicy and regulatory framework established by the Government. Such policies,
when implemented in other countries, have had significant positive impact onsector development.
Key recommendations of the study include the following:
• The Lao authorities should carry out concrete actions to operationalize thenew market-oriented policy
• The Lao authorities should phase out policy lending from the bankingsector, allowing APB and other banks to make loans on a strictly commercialbasis under autonomous bank management
• The Government should continue to support commercial microfinanceinitiatives through improvements in the policy, legal, and regulatoryenvironment
• The Government should attract foreign investment in the microfinancesector
• Microfinance donors and practitioners should ensure that theirmicrofinance initiatives follow good practices and focus on sustainabilityfrom the outset—a key survey result is that the poor are more concernedwith sustained access to financial services than with low interest rates
• The Government’s Rural and Microfinance Committee should meet regularlywith microfinance stakeholders to receive feedback, identify implementationand policy issues, and propose new solutions to further develop the sector
A greater variety of rural finance institutions will help meet the needs of adiverse population in the Lao PDR. Allowing market forces to meet this demand,under an enabling framework created by the Government, will be the mosteffective way of achieving this objective.

Results of Household and Supplier Surveys
Rural Financein the LaoPeople’sDemocraticRepublic:Demand, Supply,and SustainabilityResults of Household and Supplier Surveys
Brett E. ColemanJon Wynne-Williams

© 2006 Asian Development Bank, Financial Reform and Strengthening Initiative
All rights reserved. Published 2006.Printed in the Philippines.
Publication Stock No. 060406
The views expressed in this book are those of the authors and do not necessarily reflect theviews and policies of the Asian Development Bank (ADB) or its Board of Governors or thegovernments they represent, and the Financial Reform and Strengthening Initiative (FIRST).
FIRST and ADB do not guarantee the accuracy of the data included in this publication andaccept no responsibility for any consequence of their use.
Use of the term “country” does not imply any judgment by the authors, FIRST or ADB as tothe legal or other status of any territorial entity.

Table of Contents
Acknowledgments ................................................................................................................................ v
Foreword ............................................................................................................................................ vii
Executive Summary .............................................................................................................................. ix
1. Introduction—The Rural and Microfinance Survey ........................................................................... 1
2. An Economic Portrait of Rural Households ....................................................................................... 5
3. Rural Financial Services Supply—The Formal Sector .......................................................................16
4. Rural Financial Services Supply—The Semiformal and Informal Sectors .........................................28
5. Household Savings.........................................................................................................................46
6. Household Borrowing ....................................................................................................................55
7. Conclusions and Recommendations...............................................................................................74

iv
ADBADBADBADBADB – Asian Development BankADBIADBIADBIADBIADBI – Asian Development Bank InstituteAPBAPBAPBAPBAPB – Agricultural Promotion BankAPRAPRAPRAPRAPR ––––– annual percentage rateBABABABABAYYYYY – Bank of AyudhyaBBLBBLBBLBBLBBL – Bangkok Bank LimitedBCELBCELBCELBCELBCEL – Banque pour le Commerce Extérieur du LaosBOLBOLBOLBOLBOL – Bank of the Lao PDRCCSPCCSPCCSPCCSPCCSP – Coopérative de Crédit de Soutien aux Petits ProducteursFFFFFAAAAAOOOOO – Food and Agricultural Organization (of the United
Nations)FCBFCBFCBFCBFCB – foreign commercial bankFIRST InitiativeFIRST InitiativeFIRST InitiativeFIRST InitiativeFIRST Initiative – Financial Sector Reform and Strengthening InitiativeINGOINGOINGOINGOINGO – international nongovernment organizationJDBJDBJDBJDBJDB – Joint Development BankJVCBJVCBJVCBJVCBJVCB – joint venture commercial bankkmkmkmkmkm – kilometerKKKKKTBTBTBTBTB – Krung Thai BankLao PDRLao PDRLao PDRLao PDRLao PDR – Lao People’s Democratic RepublicLDBLDBLDBLDBLDB – Lao Development BankLLLLLVBVBVBVBVB – Lao-Viet BankLLLLLWUWUWUWUWU – Lao Women’s UnionMAFMAFMAFMAFMAF – Ministry of Agriculture and ForestryMOMOMOMOMOAAAAA – Ministry of AgricultureMOFMOFMOFMOFMOF – Ministry of FinanceMFIMFIMFIMFIMFI – microfinance institutionNGONGONGONGONGO – nongovernment organizationNPLNPLNPLNPLNPL – nonperforming loanPMBPMBPMBPMBPMB – Public Bank MalaysiaRDCRDCRDCRDCRDC – Rural Development Cooperative
Abbreviations
Currency Equivalents(as of January 2003, used throughout this report)
Currency Unit – Kip (KN)KN1.00 = $0.000094$1.00 = KN 10,622
Notes
(i) The fiscal year (FY) of the Government and itsagencies ends on 30 September.
(ii) In this report, “$” refers to US dollars.
SBLSBLSBLSBLSBL – State Bank of Lao PDRSCBSCBSCBSCBSCB – Siam Commercial BankSCUSCUSCUSCUSCU – savings and credit unionSOCBSOCBSOCBSOCBSOCB – state-owned commercial bankTMBTMBTMBTMBTMB – Thai Military BankUNCDFUNCDFUNCDFUNCDFUNCDF – United Nations Capital Development
FundUNDPUNDPUNDPUNDPUNDP – United Nations Development
ProgrammeVCBVCBVCBVCBVCB – Vientiane Commercial BankVSCGVSCGVSCGVSCGVSCG – village savings and credit groupVRFVRFVRFVRFVRF – village revolving fund

v
Rural Finance in the Lao People’s Democratic Republic: Demand, Supply, and Sustainability
This report is the product of the collaboration of many people.Preparatory work began in 2003 with discussions betweenMr. Brett Coleman (Asian Development Bank [ADB], SeniorMicrofinance Specialist) and Mr. Jon Wynne-Williams(Enterplan, Consutant Team Leader). While assisting theGovernment of the Lao PDR to reform its rural andmicrofinance policies and institutions under TA 3413-LAO:Rural Finance Development, and in making preparations tobegin supporting the Government to design the Rural FinanceSector Development Program (RFSDP), we became acutelyaware of the dearth of up-to-date information on rural financein the country. During further discussions, officials in the Bankof the Lao PDR (BOL), the Ministry of Finance (MOF), andthe Agriculture Promotion Bank (APB) confirmed the needfor an updated survey. The United Nations DevelopmentProgramme (UNDP) survey of 1996 was still the most recentand widely cited data. More current data was needed,especially on rural household access to and perceptions offinancial services, to inform sound policy decisions.
The survey and analysis was financed by the FinancialSector Reform and Strengthening Initiative (FIRSTInitiative) and ADB. The Asian Development Bank Institute(ADBI) provided additional support to the analysis andpreparation of this report.
We would like to thank H.E. Phoumy Thipphavone,Governor of BOL at the time of the survey, and H.E. PhouphetKhamphounvong, Deputy Governor of BOL at that time, fortheir support. Thanks also go to Mr. Phanthaboun Sayaphet,
Acknowledgments
Deputy Managing Director of the Agricultural PromotionBank (APB), who assisted with many logistical matters, andto APB in general for providing survey headquarters facilitiesin Vientiane. The assistance of Mr. Dethphouvang Moularat,Director of Supervision in BOL at the time of the survey, forfacilitating introductions to commercial banks and the supplyof supplementary information is much appreciated.
Mr. Rob Solomon led the survey team for Enterplan.Ms. Charlotte Clarke and Mr. Somphone Sisenglath managedthe Household and Moneylender Surveys and carried outthe survey of multilateral and bilateral developmentagencies, international nongovernment organizations(INGOs), and microfinance institutions (MFIs)for Enterplan. Mr. Reuben Jessop, engaged throughPricewaterhouseCoopers (PwC), managed and carried outthe Bank Survey. Thanks are due to Mr. Huw Lester of PwC,who assisted with aspects of the survey logistics; to Mr. CurtisSlover of the World Council of Credit Unions, who providedinformation on the conduct of the previous UNDP-sponsoredsurvey of microfinance in 1996; to Ms. Vatlana Boupha andMs. Paisone Sayadeth for their able office support services;and to Earth Systems Lao for assisting in the mapping.
Much appreciation is due to the team of four Lao fieldsupervisors and 16 Lao enumerators who conducted theHousehold and Moneylender field surveys, and whoweathered 5 weeks in the field, often travelling off-road,sometimes by river and sometimes on foot, to collect data ofa consistently high standard. The supervisors were
Rural Finance in the Lao People’s Democratic Republic: Demand, Supply, and Sustainability
vi
Mr. Khamphat Boulom, Ms. Chanhsouda Douangpanya, Mr.Sengaloun Sengsavang, and Mr. Somsack Senthavisouk.The enumerators were Ms. Phetsamone Chanthavong, Ms.Anousy Chindamany, Ms. Sengaloun Damlongboune,Kittiphan Darasouk, Ms. Phengdavanh Inthavongtham, Mr.Viengnakhone Khathoumphom, Thongmany Khotpanya,Ms. Chounlavanh Luanglatbandith, Ms. Somsy Manivanh,Souksavanh Manivong, Ms. Somvang Phanthavong, Mr.Phouketsouvanh Ratanavong, Ms. Sonephet Sayvongpheng,Mr. Viengkhong Sivankham, Ms. XaybouavoneTengbriachue, and Mr. Khouanchay Xayngaket.
Finally, the authors express our foremost thanks to the1,189 rural households in the Lao PDR who kindly took thetime to answer our questionnaire and provide informationabout themselves and their households’ activities. We arealso extremely grateful to all of the staff associated withmultilateral, bilateral, INGO, and MFI initiatives and thosein the commercial banks who gave their time to answer ourquestions and provide information.
While this report would have been impossible withoutthe support of all the above-mentioned people and more,any errors remain the sole responsibility of the authors.
Brett E. ColemanBrett E. ColemanBrett E. ColemanBrett E. ColemanBrett E. ColemanAsian Development Bank
Jon WJon WJon WJon WJon Wynneynneynneynneynne-----WWWWWilliamsilliamsilliamsilliamsilliamsEnterplan Limited

Rural Finance in the Lao People’s Democratic Republic: Demand, Supply, and Sustainability
vii
Foreword
The Government of the Lao People’s Democratic Republic(Lao PDR) has made significant efforts in the past 2 decadesto extend financial services to poor and rural households.With 80% of Lao households, and 90% of poor households,based in rural areas, the provision of rural financial servicescan promote equitable growth and contribute to theGovernment’s poverty reduction strategy by financinginvestment opportunities and risk-management strategiesof poor and vulnerable households and their micro- andsmall enterprises.
Major financial sector reforms began in Lao PDR in1988, with a view to making the financial system moreefficient and market-oriented. This included thetransformation of the country’s mono-bank system into atwo-tiered banking system consisting of a central bank andseveral state-owned commercial banks. In 1993, theGovernment created the Agriculture Promotion Bank (APB),with a mandate to extend credit and savings services to therural areas of the Lao PDR. However, this has had limitedsuccess because APB’s practice of carrying out policylending at subsidized interest rates on behalf of theGovernment and donor-supported programs has resulted insome resource misallocation along with large losses that haveeroded its capital, and therefore, limited the resourcesavailable for its expansion. Today, APB serves about 18%of all Lao households, but less than 5% of rural households.
The Government and international donors have alsosupported many microfinance projects across the country,
especially in the last 10 years, often working through theLao Women’s Union. Some 1,600 village revolving fundshave been established, as well as dozens of microfinancecomponents of larger development projects. Again, however,the vast majority of such initiatives have resulted inunsustainable provision of microfinance services becausemost made loans at subsidized interest rates or lackedsufficient emphasis on long-term institution building. Mostbecame non-operational after outside funding ended. At thesame time, a small number of microfinance projects andinstitutions have demonstrated that best-practice initiativescan succeed in the Lao PDR, provided they focus ondemand-driven services, charge interest rates that covercosts and allow profits and growth, and build capacity forprofessional management necessary for long-termsustainability.
With the lessons learned from both Lao and internationalexperience, the Government has committed to, and begunimplementing, a major reform program in rural andmicrofinance. This program includes: (i) restructuring APBto be a financially self-sustainable, market-oriented ruralfinance institution; (ii) actively promoting best-practicemicrofinance institutions (MFIs) through piloting of private,professionally managed, and financially self-sustainablesavings and credit unions; (iii) issuing a national PolicyStatement on Sustainable Rural and Microfinance toencourage development of the sector, including a diversityof MFI models to serve a dispersed and diverse population;

Rural Finance in the Lao People’s Democratic Republic: Demand, Supply, and Sustainability
viii
(iv) preparing an enabling legal and regulatory frameworkallowing for multiple MFI models and products withminimum starting regulations, interest rate autonomy, privateownership and foreign investment; and (v) adopting andimplementing an appropriate regulatory framework forprudential supervision of APB.
Before this study, the most recent national survey ofrural and microfinance occurred in 1996 with support fromthe United Nations Development Programme. However, thedata from this survey needed to be updated to form the basisfor detailed policy formulation and project selection anddesign.
The present survey is intended to fill the gap in currentknowledge, and results have already begun to inform theGovernment’s policy decisions and strategy formulation,help design microfinance initiatives, and provide a baselinefor monitoring development of the sector to assess the impactof reform and to make adjustments as necessary.
We would like to thank the survey respondents,especially the many rural households that generouslycontributed their time and their views in participating inthis survey. Without their assistance, this report would nothave been possible.
Rajat M. NagDirector General
Southeast Asia Regional DepartmentAsian Development Bank
Peter McCawleyDean
Asian Development Bank Institute
Mark St GilesManaging Director
Financial Reform and StrengtheningInitiative

Rural Finance in the Lao People’s Democratic Republic: Demand, Supply, and Sustainability
ix
Executive Summary
The main elements of this research report are as follows:• Chapter 1 presents the motivation and objectives of the
study, as well as the survey and statistical methodology.• Chapter 2 presents an economic overview of rural
households in the Lao People’s Democratic Republic(Lao PDR), based on a household survey conducted forthe study.
• Chapters 3 and 4 present the institutional landscape offinancial services in the Lao PDR. Chapter 3 presentsdetails on the formal banking sector, while Chapter 4presents the semiformal sources of rural and microfinance,including microfinance projects and sustainably orientedmicrofinance institutions (MFIs), as well as informalsources, including moneylenders, households, and houayor rotating savings and credit associations.
• Chapters 5 and 6 present results of a survey of 1,189randomly selected rural households. These chaptersThese chaptersThese chaptersThese chaptersThese chaptersrepresent the crux of the study and present the most salientrepresent the crux of the study and present the most salientrepresent the crux of the study and present the most salientrepresent the crux of the study and present the most salientrepresent the crux of the study and present the most salientresultsresultsresultsresultsresults. These include analyses of households’ accessto various means of savings, including formal andinformal. They also include access to formal, semiformal,and informal sources of credit. Chapter 6 includesestimates of unsatisfied demand for credit in rural areas.Household preferences for different sources andcharacteristics of savings and lending products are alsopresented.
• Chapter 7 presents conclusions and recommendations.
Introduction—The Rural andMicrofinance SurveyThe Government of the Lao PDR has committed to carryingout a major rural and microfinance reform program consistentwith the Policy Statement on Sustainable Rural andMicrofinance that the Prime Minister’s Office issued in late2003. This program includes: (i) restructuring theAgriculture Promotion Bank (APB) to be a financially self-sustainable, market-oriented rural finance institution; (ii)adopting an appropriate regulatory framework for prudentialsupervision of APB; (iii) preparing an enabling legal andregulatory framework for a diversity of MFI models withminimum starting regulations, interest rate autonomy, andprivate and foreign investment; and (iv) promoting thecreation of best-practice MFIs that are private, autonomous,professionally managed, and financially self-sustainable.
Now that the Government has committed to a majorreform program in rural and microfinance, it also wishes tomonitor development of the sector to assess the impact ofreform and to make adjustments as necessary. For thesereasons, it was timely to conduct a new survey of rural andmicrofinance in the Lao PDR. The survey results willhopefully inform policy decisions and the design ofmicrofinance initiatives, as well as provide a baseline fromwhich the Government can assess the effectiveness of itsreform program.

Rural Finance in the Lao People’s Democratic Republic: Demand, Supply, and Sustainability
x
This study is based on surveys carried out in early 2004.First, a Household Survey gathered information on thehousehold economy, financial management, assets andliabilities, and attitudes. Second, a Rural Financial ServicesSurvey was carried out with banks, multilateral and bilateraldevelopment agencies, international nongovernmentorganizations (INGOs), and MFIs to capture informationabout the services provided, outreach, and the terms ofsavings and credit offered. Third, a survey of moneylenderswas undertaken to supplement this data.
The Household Survey used four geographical areas tostratify villages. Map 1 illustrates the villages selected. Thestrata used were:
• “Peri-urban” (areas within 25 kilometers (km) of, butoutside, the country’s four largest urban areas ofVientiane, Savannakhet, Luang Prabang, and Pakse);
• “Provincial Capital” (areas within 10 (km) of, butoutside, the other provincial capital towns);
• “Rural Mekong” (areas with lowland rice farmingsystems, which do not fall within the Peri-urban orProvincial Capital strata areas); and
• “Other Rural” (areas using upland intensive andextensive systems, which do not fall within the Peri-urban or Provincial Capital strata).
A stratified random sample of 1,189 households wasselected. The Household Survey collected information onhousehold demographics, economic activities, assets,liabilities, and attitudes to financial services. Analysis wascarried out on the sample as a whole, as well as by stratumand by wealth quartile using appropriate statisticaltechniques.
For the Rural Financial Services Survey, separatequestionnaires were designed for (i) banks; (ii) multilateral
and bilateral development agencies, INGO, and MFIprojects; and (iii) informal moneylenders. Thequestionnaires collected information on outreach of theinstitution, lending activities and loan portfolios, and savingsservices.
An Economic Portrait of Rural HouseholdsCharacteristics of rural households’ demographic structureand income-generating activities are important determinantsof financial decisions such as borrowing, saving, lending,and risk management. Therefore, the study begins bypresenting a brief economic portrait of rural households,based on the survey of 1,189 households.
Results indicate that the more remote Rural Mekongand Other Rural strata have larger proportions of poorhouseholds, while the Peri-urban and Provincial Capitalstrata tend to be wealthier. But they also indicate that allfour rural strata have significant portions of poor households.Peri-urban households reported average income 1.44 timesthe average of Provincial Capital households, 2.14 timesthe average of Rural Mekong households, and 1.68 timesthe average of Other Rural households. The average incomeof the richest quartile of households was 5.08 times that ofthe average income of the households in the poorest quartile.
For 90.34% of rural households, the primary incomesource is from self-employment (including farming their ownland) or ownership of a business. Only 5.38% of ruralhouseholds have salaried work as the primary source ofincome, while wage labor provides the primary source ofincome for only 4.28% of rural households.
Rice production is the most common primary activity(64.65% of rural households), followed by livestock raising(10.24%), and trade (6.96%). Production of other crops isthe primary activity for only 3.34% of households. Thecontrast between the poorest quartile, where rice production
Rural Finance in the Lao People’s Democratic Republic: Demand, Supply, and Sustainability
xi
is the main activity for about 70% of households and therichest quartile where it is the main activity for only 51% ofhouseholds, suggests that relative poverty is linked with theproduction of the subsistence crop as the primary householdactivity.
However, there is a high degree of multifunctionalityamong rural households: 90% of rural households engagein multiple income-generating activities. The high level ofmultifunctionality is an important observation withimplications for the rural finance system in the Lao PDR.While rural finance policies have traditionally focused ondirected lending programs that target agricultural activities,the high frequency of multifunctionality suggests a need forfinancial services that serve a broad range of economicactivities in rural households.
Overall, only 38% of reported income of rural householdscame from agriculture, livestock, or fishing. Over half ofreported income came from business activities. Amongwealth quartiles, the poorest derived only 35% of theirincome from agriculture, livestock, and fishing, and therichest derived 37%. The results highlight the importanceof nonagricultural income in rural Lao PDR.
Rural Financial Services Supply—theFormal SectorThe supply of rural financial services in the Lao PDR canbe broken down into the formal, semiformal, and informalsectors. The formal sector consists of the commercial banks;the semiformal sector comprises project-based interventions;and the informal sector comprises loans between friendsand family members, informal moneylending, and lendingthrough the traditional Lao houay.
The commercial banking industry in the Lao PDR has threeprincipal groups:
• Three SOCBs: Banque pour le Commerce Extérieur duLaos (BCEL), Lao Development Bank (LDB), and theAgricultural Promotion Bank (APB). BCEL is focusedon foreign trade, LDB on commerce, and APB on theagricultural sector.
• Three JVCBs: the Joint Development Bank (JDB),Vientiane Commercial Bank (VCB), and Lao-Viet Bank(LVB). The JVCBs mainly service customers in thecountry’s principal cities.
• Six foreign commercial banks (FCBs), each operating asingle branch office in Vientiane, and one British bankwith a representative office in Vientiane. The FCBsprimarily service their home country clients who haveoperations in the Lao PDR.
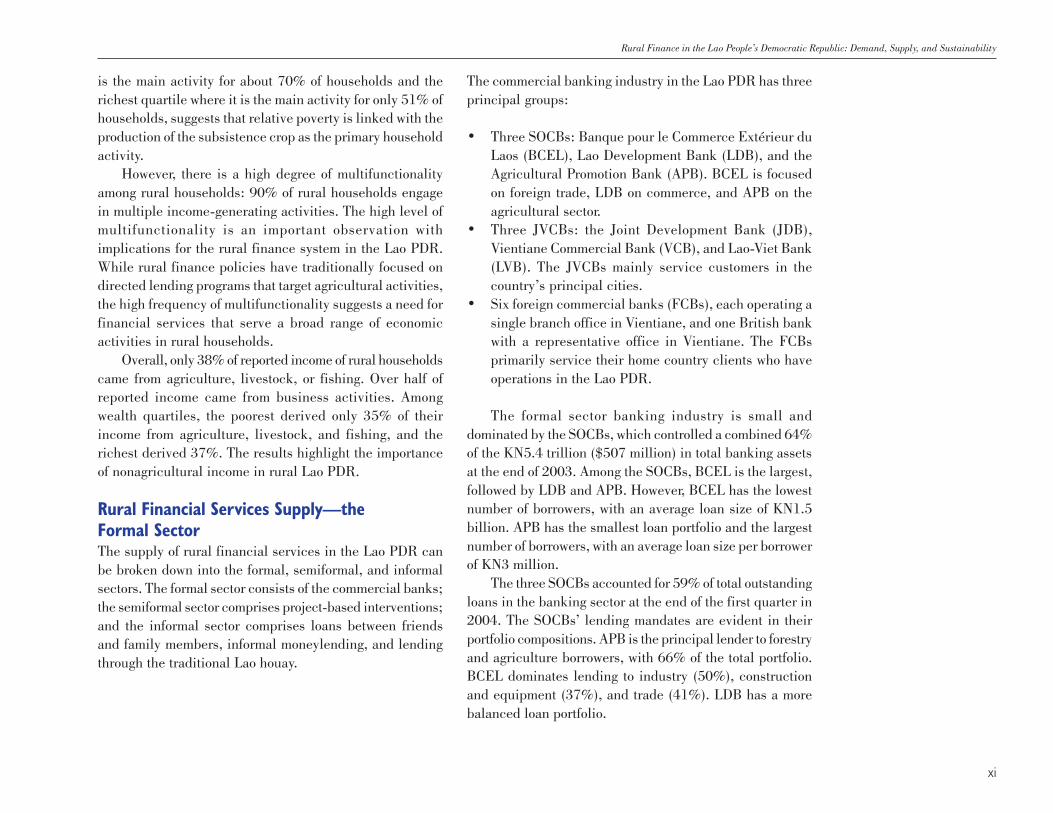
The formal sector banking industry is small anddominated by the SOCBs, which controlled a combined 64%of the KN5.4 trillion ($507 million) in total banking assetsat the end of 2003. Among the SOCBs, BCEL is the largest,followed by LDB and APB. However, BCEL has the lowestnumber of borrowers, with an average loan size of KN1.5billion. APB has the smallest loan portfolio and the largestnumber of borrowers, with an average loan size per borrowerof KN3 million.
The three SOCBs accounted for 59% of total outstandingloans in the banking sector at the end of the first quarter in2004. The SOCBs’ lending mandates are evident in theirportfolio compositions. APB is the principal lender to forestryand agriculture borrowers, with 66% of the total portfolio.BCEL dominates lending to industry (50%), constructionand equipment (37%), and trade (41%). LDB has a morebalanced loan portfolio.

Rural Finance in the Lao People’s Democratic Republic: Demand, Supply, and Sustainability
xii
The commercial banking industry has experiencedconsiderable growth over the past few years. As aconsequence of this growth, as well as continuing supervisoryweaknesses, nonperforming loans (NPLs) in the industryhave also grown. Moreover, as the current three SOCBs arethe result of mergers between the previous seven SOCBs,the current SOCBs have inherited the financial difficultiesthat caused these consolidations in the first place. Hence,as of 31 December 2003, the capital of the three SOCBswas significantly negative at -35.6% of total assets and theiraggregate NPL rate was 58%. Ongoing restructuring effortsat the SOCBs and the Bank of the Lao PDR (BOL) areintended to address these problems.
The commercial banks’ attention toward rural areas isvery limited. APB, with its mandate to promote agriculture,is the most engaged in rural areas, but in practice, the vastmajority of its clients are located in urban areas—surveyresults indicate that only 2% of rural households borrowedfrom APB in the 12 months prior to the survey. The remainingcommercial banks have limited distribution networks.Residents of rural areas are mostly removed from commercialbanks and the services they provide.
Rural Financial Services Supply—theSemiformal and Informal SectorsThe semiformal sector in the Lao PDR primarily comprisesproject-based interventions. They are “formal” in the sensethat they either fall under the government-approved activitiessponsored by multilateral and bilateral developmentagencies and INGOs, or they operate under BOL regulations.They are “informal” in that the savings and credit activitiescarried out are not supervised by BOL and their financialsector operations are not subject to official financial reportingrequirements.
The survey had 23 respondents, who supported a totalof 50 microfinance initiatives. The respondents comprisedthree groups. The first consisted of six multilateral andbilateral development agencies supporting microfinancecomponents in larger projects. The second group consistedof 14 INGOs supporting microfinance components in largerprojects. The third group consisted of three specialized MFIsset up specifically to provide sustainable microfinanceservices.
Multilateral, bilateral, and INGO projects are typicallyimplemented through local partners. The Lao Women’s’Union (LWU) was the most frequent local partner, followedby the Ministry of Agriculture and Forestry (MAF). One ofthe sustainably oriented initiatives, established originallywith UNDP support, works with the Ministry of Finance(MOF).
Three main types of microfinance organizational formspredominate in the Lao PDR. These are:
• Savings and Credit Unions (SCUs) and CreditCooperatives operating under BOL regulations.
• Village Savings and Credit Groups (VSCGs) notoperating under BOL regulations;
• Village Revolving Funds (VRFs) not operating underBOL regulations.
In the semiformal sector, there are no product offeringsother than savings and loans.
Data show that funding for microfinance activitiesremains low, at less than $1 million cumulatively over 5years. Funding of capacity building has also grown butremains low, at less that $100,000 cumulatively over 5 years.

Rural Finance in the Lao People’s Democratic Republic: Demand, Supply, and Sustainability
xiii
The total number of villages reached by microfinanceinitiatives as of 31 December 2003 was reported as 930.The multilateral and bilateral microfinance componentsreached 211 villages; the INGO components reached 406villages; and the MFIs reached 313 villages. Overalloutreach of 33,392 savers remains low. Conservativelyassuming each saver corresponds to one rural household,this implies outreach to only 3.7% of rural households.
As of 31 December 2003, the semiformal sector reported12,365 outstanding borrowers with loans outstanding ofKN12 billion. (The difference in the number of borrowersand savers was due to the fact that one INGO, FIAM, reportedhaving 20,880 savers but was unable to report on itsborrowers.)
Loans products offered by MFIs have a median effectiveinterest rate of 48% per year, while loans products offeredby INGO microfinance components have a median interestrate of 22% per year, and those of multilateral and bilateraldevelopment agency microfinance components have amedian rate of 12% per year. Only the MFIs regularly chargeinterest rates at sustainable levels, thus creating the potentialto provide permanent access to financial services.
MFIs also had the lowest percentage of borrowers inarrears, at 7.68%. Multilateral and bilateral developmentagency projects reported 13.71% of borrowers in arrears,while INGOs reported 14.84%. The data also indicate thatgroups are less likely to default than individuals, and thatwomen are less likely to default than men.
In the Lao PDR, the informal sector comprises loansbetween households, informal moneylending, and lendingthrough the traditional houay. Results indicate that ruralhouseholds made an estimated 353,574 loans to friends,family, and other households valued at KN660.69 billion($62.2 million) in the 12 months preceding the survey,dwarfing the amount loaned in the semiformal sector.
The vast majority of lending (76%) was done byhouseholds in the wealthiest quartile. Households in theOther Rural stratum account for the vast majority of loansby number: they account for 60% of all loans (and 44% ofloan volume), almost certainly the result of the lack ofoutreach by more formal and semiformal institutions in theremote Other Rural areas, and therefore the need to rely oninformal inter-household loans.
In the 12 months before the survey, moneylenders madeloans to about 25,300 rural households in an estimatedamount of KN27.30 billion ($2.57 million), a fraction of theinformal lending done by households, but still more thantwice as much as the semiformal sector. Moreover, about3,100 rural households participated in houay which lenttheir members about KN18.53 billion ($1.74 million), about50% more than the semiformal sector.
Household SavingsIt is commonly believed that many rural households in lessdeveloped countries, including the Lao PDR, are too poorto save. However, a considerable amount of researchdisproves this view. In fact, the poor do save but do not haveready access to savings facilities in formal financialinstitutions. Instead, they use alternative, informal vehiclesfor their savings such as livestock, gold and other preciousmetals, jewelry, and housing materials or other stocks ofphysical goods. Many of these informal savings mechanismsinvolve high risk and high transaction costs and result insavings that are not easily turned into ready cash. Experiencehas shown that households often value the availability ofappropriate deposit services as much as, and sometimesmore than, access to credit.
Extrapolating from the survey sample to the population,in early 2004 rural households in the Lao PDR held anestimated KN2,290.28 billion ($215.62 million) in cash

Rural Finance in the Lao People’s Democratic Republic: Demand, Supply, and Sustainability
xiv
savings. Almost 90% of rural households reported holdingsome cash savings—89% reported cash in-hand but only5% reported any bank deposits, suggesting a low level ofoutreach by the Lao banking sector (including APB) in ruralareas. However, bank deposits represented 55% of cashsavings reported, while cash in hand represented 39.75%.Just over 4% of rural households reported savings in thesemiformal sector, and this represented only 0.5% of cashsavings.
The richest quartile of households accounts for 81.30%(KN1,862 billion) of the cash savings held in banks, whilethe poorest quartile of households accounts for only 2.10%(KN48.4 billion) of such savings. However, only 13.8% ofhouseholds in the richest quartile and 1.5% of householdsin the poorest quartile maintain any savings in the bankingsystem.
In rural areas of the Lao PDR, savings are mostly heldIn rural areas of the Lao PDR, savings are mostly heldIn rural areas of the Lao PDR, savings are mostly heldIn rural areas of the Lao PDR, savings are mostly heldIn rural areas of the Lao PDR, savings are mostly heldin-kind.in-kind.in-kind.in-kind.in-kind. Non-cash savings amount to KN6,291.7 billion andaccount for 73.3% of total savings in rural areas. Non-cashsavings exceed cash savings for each wealth quartile, andfor three of four rural strata (the exception being Peri-urbanhouseholds). Livestock is the most common means of non-cash savings in Lao rural households, used by 98.2% ofrural households and accounting for KN4,268 billion.Livestock as a means of savings is especially important forhouseholds in the poorest quartile where it accounts for77.09% of non-cash savings. Precious metals, jewelry, andhousing materials are also commonly used as savingsvehicles.
Although household preferences are revealed to someextent by actual practices, underlying preferences may differfrom practice depending on the availability of options.Almost 30% of households said their first preference was tosave in APB or another bank (12.43% in APB and 17.29%in another bank). Some 27.63% expressed some preference
(first, second, or third) for APB, while 35.6% expressed somepreference for other banks. As less than 5% of householdsactually have savings in any bank, this suggests a large unmetdemand for formal savings services in rural Lao PDR.
Among non-cash alternatives, livestock is the mostpreferred vehicle for savings, with preferences on the sameorder as that for banks. More than a quarter of all households(27.97%) stated that livestock was their first preference forsaving, and 56.6% expressed some preference for thissavings method. Examined by stratum and wealth quartile,results show a more frequent preference for non-cashinstruments (especially livestock) as savings vehiclesamongst the poorer and more remote households, and agreater preference for APB and other commercial banksamongst richer and less remote households.
Household BorrowingOne cause of poverty observed in less developed countriesis the lack of access to credit, especially among ruralhouseholds. The poor often find themselves in a viciouscircle: producing at a subsistence level makes it difficult toaccumulate assets, thus making it difficult either to investany surplus or to gain access to credit in formal financialmarkets, which leads to low productivity and continuedpoverty.
Recognizing this, many government policy makers havepromoted initiatives to deliver formal credit to rural areas.These have often included setting up special agriculturalbanks to lend to rural borrowers, and this has also been thecase in the Lao PDR.
Overall, 40% of rural households borrowed in the 12months before the survey. The formal sector made loans toless than 3% of rural households, while the semiformal sectorreached 4% of rural households. In contrast, informal sourcesmade loans to 33% of rural households. The poorest two

Rural Finance in the Lao People’s Democratic Republic: Demand, Supply, and Sustainability
xv
quartiles relied on informal sources significantly more thanthe richest two quartiles while the richest two quartiles hadgreater access to formal sources.
Extrapolating from the survey sample to the population,rural households borrowed an estimated KN636.82 billion($59.95 million) in the 12 months preceding the survey.Borrowing from family and friends was the most common:25% of households borrowed from friends or family, in anamount equal to KN307 billion (48% of loan volume). Theaverage loan size was KN1.38 million ($130). Supplier creditwas the next common means of financing, with loans takenby 6.14% of households, with estimated overall borrowingof KN134.81 billion (21% of loans by value). The averageoriginal loan size from suppliers was KN3.76 million ($354).The third most common loan source, in terms of the numberof households borrowing, was VRFs. An estimated 2.18%of rural households borrowed from VRFs. The averageoriginal loan size was KN612,000 ($58).
APB was the fourth most common means of financing,reaching an estimated 18,267 rural households, or 2.01%of all rural households in the 12 months preceding the survey.It is noteworthy that APB reports about 87,000 totalborrowers in the Lao PDR. The survey findings indicatethat only 21% of APB borrowers are located in rural areas.This is also consistent with APB’s lending records, whichindicate that the large urban areas of Vientiane, Savannakhet,Pakse, and Luang Prabang absorb the vast majority of itslending. Average loan size for APB’s rural borrowers wasKN2.65 million ($249).
Some 30.3% of households in the richest quartile hadborrowed during the previous 12 months, compared to 43.1%of the households in the poorest quartile. The poorest quartilewas more dependent on friends and family: 28.4% of thepoorest households borrowed from this source but only15.2% of richest households did so. Higher percentages of
households in the poorest quartile also borrowed fromsuppliers, moneylenders, and VSCGs. A higher percentageof the households in the richest quartile borrowed from APBand other banks: 5.5% of households in the richest quartileborrowed from a bank while only 1.9% of households in thepoorest quartile did so. And despite APB’s mandate toprovide subsidized loans to the poor, its richest-quartileclients outnumbered its poorest-quartile clients by more than3 to 1. However, outreach of APB and other banks wasextremely low to all strata and all quartiles.
The average household in the richest quartile borrowed17 times as much as the average household in the poorestquartile. Moreover, households in the richest quartileborrowed 33.6 times as much as households in the poorestquartile from banks. This included 12.6 times as much fromAPB. Overall, 77.7% of the borrowing from APB by valuewas by households in the richest quartile. The vast majorityof borrowing by the poor comes from family and friends.
Similar to savings, household preferences are revealedto some extent by practices, but preferences may differ frompractice depending on the availability of options. Overall,57% of households said borrowing from family and friendswas their first preference; 75% expressed some preferencefor this (i.e., either first, second, or third preference). Nextwas APB, with 19% of households expressing this as theirfirst preference, and 36% expressing some preference forthis. This compared to only 6% that expressed a firstpreference for borrowing from another bank and smallerpercentages for other sources. As only 2% of rural householdsactually borrowed from APB in the 12 months before thesurvey, there is clearly a significant untapped market forAPB.
Rural households were also asked to state what theimportant characteristics were for them when choosing whereto apply for a loan. Consistently across all wealth quartiles,

Rural Finance in the Lao People’s Democratic Republic: Demand, Supply, and Sustainability
xvi
“confidence that a loan will be made” was the mostfrequently cited important characteristic—households wantto be sure of being able to access the loan. Almost 60% ofhouseholds regarded this as an important factor in choosingwhere to apply for a loan. In all wealth groups, this wasmore frequently cited than the interest rate. Households inthe poorest quartile named this characteristic almost twiceas frequently as the interest rate (52.89% to 27.64%),indicating that confidence about receiving a loan (i.e., accessto the loan) is significantly more important than price forthem. These results for the Lao PDR are consistent withresults in other countries: the poor are more concerned withthe poor are more concerned withthe poor are more concerned withthe poor are more concerned withthe poor are more concerned withsustained access to financial services than they are with lowsustained access to financial services than they are with lowsustained access to financial services than they are with lowsustained access to financial services than they are with lowsustained access to financial services than they are with lowinterest ratesinterest ratesinterest ratesinterest ratesinterest rates.
For the poorest quartile of rural households, conveniencein terms of a short journey to the source of the loan wasalmost as important as price (24.35% of the poorest quartileciting this as an important factor). For the richest quartile,50% of households cited interest rates as being an importantfactor compared to only 26.68% who cited a short journeyto the loan provider as being important.
The availability of long-term loans, low collateralrequirements, and simple loan procedures were the nextmost important factors across all households. While long-term loan availability was the fourth most frequently citedimportant characteristic when determining where to applyfor a loan, it is noteworthy that only 22.32% cited this; hence,77.68% did not consider this to be important. A considerableamount of policy lending by the Government, as well as donorcredit lines, has been justified by the perception that demandfor long-term loans is high. The evidence of this surveyindicates that such policies may be misguided.
In terms of loan purpose, borrowing is concentrated inthe transport, services, and trade businesses, as well aslivestock, rice production, and medicine and health care.
Virtually all borrowing for service businesses takes place inPeri-urban areas (99.3%); and virtually all is borrowed byhouseholds in the richest quartile (99.5%). While borrowingfor trade is more equally distributed across strata, it is alsoconcentrated in the richest quartile, who borrow 90.6% ofsuch lending. Similarly, borrowing for transport businessesis concentrated in Peri-urban households (67.3%) andhouseholds in the richest quartile (91.7%).
Borrowing for rice production is predominant inProvincial Capital and Rural Mekong households, whichtogether comprise 81% of such borrowing. Again, however,such borrowing is concentrated in the richest quartile, whichborrowed 63% of total lending for rice production. Borrowingfor livestock production is concentrated in Other Ruralhouseholds, which borrowed 96.7% of such lending; again,the richest quartile account for most, borrowing 95% of totallending for livestock.
Results also point to the importance of loans for healthand medical purposes in the three poorer quartiles, whichtogether borrowed 95% of such lending. Households in thepoorest quartile borrowed over five times as much ashouseholds in the richest quartile for health and medicines,and this accounted for 34.9% of all borrowing by householdsin the poorest quartile, compared to 0.4% for the richestquartile.
Overall, an estimated 308,884 loans or just over 72%of all loans (by number) were for nonproductive purposes(house construction, domestic consumption goods, healthand medicines, education, marriage, funeral, or otherpurposes) at an average size of KN990,000 ($93), evidencingthe substantial demand for the type of lending that can oftenbe delivered through MFIs more effectively than throughformal banks.
About half of all loans taken by rural households(50.71%) had zero interest—the vast majority of these came

Rural Finance in the Lao People’s Democratic Republic: Demand, Supply, and Sustainability
xvii
from family and friends. At the same time, 23.75% of loanshad effective interest rates of more than 100% per year, and13.50% had effective rates in excess of 200% per year. Inother words, the vast majority of loans were either at zerointerest or at extremely high interest—only a small minorityfell in the mid-range.
The poorest quartile of households benefit from higheraccess to interest-free loans (53.7% of their loans comparedto 26% of loans borrowed by the richest quartile and 50.7%of loans borrowed by the population as a whole), but theyare also less able to access interest-bearing loans at therates prevailing in the commercial banking sector. Only 8.9%of the interest-bearing loans received by the poorest quartileof households were at less than 60% interest per year, while42.6% of the interest-bearing loans received by the richestquartile were at less than 60% per year. It is estimated that,nationwide, the poorest rural households borrowed 22,485loans at interest rates over 100%, while the richest ruralhouseholds borrowed 10,698 loans at these interest rates.Clearly, delivering sustainable, market-oriented credit at(unsubsidized) market interest rates to the poor through MFIsand APB could make a significant contribution to the well-being of the poor.
The results show considerable unsatisfied demand forcredit among rural households. Overall, unsatisfied demandequals KN4,341 billion for all rural households, which is6.7 times the amount actually borrowed over the previous12 months. This difference between actual borrowing andunsatisfied demand is most pronounced among householdsin the poorest quartile—unsatisfied demand is 39 times aslarge as actual borrowing. In contrast, for households in therichest quartile, unsatisfied demand is only 3.93 times aslarge as actual borrowing. The Lao rural finance system isclearly failing to satisfy the demand for credit from thepoorest households.
Geographically, the largest unmet demand is in theremote Other Rural households, with unsatisfied borrowingof KN2,250 billion. This accounts for 52% of all unmetdemand in the country and is likely a result of the low levelof outreach by financial institutions in the more remote areas.Relative to actual borrowing, Provincial Capital householdsand Other Rural households are the most underserved—with unmet demand exceeding actual borrowing by factorsof 15.76 and 11.43, respectively. This contrasts withProvincial Capital households, whose unmet demand is only2.28 times their actual borrowing. The conclusion is clear:there is a huge unsatisfied demand for loans by ruralhouseholds, covering a wide range of productionopportunities and nonproduction needs.
Conclusions and RecommendationsThe most overriding conclusion of this study is that the formalsector and semiformal sector are failing to serve the demandfor financial services of the vast majority of rural householdsin the Lao PDR. This is true for all geographic strata and forall wealth quartiles. The key findings of this study are:
• Only 5% of all rural households had any savings in abank;
• Only 4% had savings in a microfinance initiative;• Only 26.7% of rural savings is held in cash, while 73.3%
is held in-kind;• Only 2% had borrowed from APB in the 12 months
before the survey, and only 3% had borrowed from anybank;
• Only 4% had borrowed from a microfinance initiative;• In contrast, 33% had borrowed from an informal source,
including friends, family, moneylenders, and houay.

Rural Finance in the Lao People’s Democratic Republic: Demand, Supply, and Sustainability
xviii
These results are even more striking for households inthe poorest quartile:
• Only 1.5% had savings in a bank;• Only 1.4% had savings in a microfinance initiative;• Only 8.5% of savings is held in cash, while 91.5% is
held in-kind;• Only 1% borrowed from APB, and 1.9% had borrowed
from any bank;• Only 4.1% had borrowed from a microfinance initiative;• In contrast, 40% had borrowed from an informal source.
There is a high degree of multifunctionality among ruralhouseholds: 90% of rural households engage in multipleincome-generating activities, and this is similar across strataand wealth quartiles. And although 78% of householdsengaged in agriculture, livestock raising, or fishing as theirprimary economic activity, only 38% of total reported incomecame from these activities. Over half of reported incomecame from business activities, and this was similar acrossstrata and wealth quartiles, including the poorest quartile.While rural finance policies have traditionally focused ondirected lending programs that target agricultural activities,the high frequency of multifunctionality suggests a need forfinancial services that serve a broad range of economicactivities in rural households.
Among the formal sector financial institutions, APB hasthe mandate to provide financial services to rural areas andhas the largest rural service network. However, APB’s pastpractices have significantly weakened it financially. It hashigh NPLs and a large capital deficit, greatly limiting itsability to extend outreach. It also has limited capacity forproper credit assessment of customers despite receivingsignificant levels of technical assistance since 1993.However, its most significant constraint appears to be its
lack of autonomy in operational decisions as it continues tocarry out significant levels of directed, subsidized lending(policy lending) at the behest of the Government.
Three MFIs have begun to demonstrate the potential ofsustainably oriented microfinance in the Lao PDR. Moreover,these three MFIs also had the lowest percentage of borrowersin arrears at 7.8% (lower than other microfinance initiatives,and much lower than the SOCBs, including APB). However,most microfinance initiatives demonstrated weaknesses infinancial reporting.
It is also clear that, as in many other developingcountries, rural households have substantial savings,including the poor. However, due to the low outreach of formaland semiformal financial institutions, the vast majority(73.3%) of savings is held in-kind.
Almost 30% of rural households said their firstpreference was to save in APB or another bank (despite thefact that only 5% had savings in a bank). Similarly, 25%expressed a first preference to borrow from APB or anotherbank, despite the fact that less than 3% of households hadborrowed from a bank in the previous 12 months. There areclear opportunities for APB and perhaps other banks (e.g.,LDB) to expand their outreach.
At the same time, the results also offer hope for thepotential of sustainable microfinance. Rural householdsexpressed large unmet demand for loans of the kind thatMFIs can often deliver more effectively and efficiently thanformal banks—small, short-term loans that do not requiretraveling long distances to obtain. Also, the evidenceindicates that rural households (especially the poor) arewilling to pay sustainable MFI interest rates in the 30–50%range. Indeed, when rural households (especially the poor)are unable to borrow interest-free from friends and family,they typically have to borrow in informal markets at interestrates over 100% or even 200%.

Rural Finance in the Lao People’s Democratic Republic: Demand, Supply, and Sustainability
xix
The key issue is howhowhowhowhow to expand formal and semiformalfinancial services in rural areas. The Government, BOL,and APB need to carry out the concrete actions to realizethe policy embodied in the Prime Minister’s Policy Statementon Sustainable Rural and Microfinance and the NationalGrowth and Poverty Eradication Strategy. This includesphasing out policy lending in a short period of time andplacing remaining policy lending, if any, in a non-bank, non-deposit-taking policy lending mechanism. APB must makeloans on a strictly commercial basis. As illustrated by thisstudy, market orientation and poverty reduction can bemutually reinforcing objectives. However, to do this, theGovernment must grant APB genuine managementautonomy.
APB also needs to enhance its human resourcesmanagement and upgrade its information andcommunications systems. Finally, APB must be authorizedto write-off its loss-graded loans and be recapitalized by theGovernment, but conditional on a proven track record ofimproved performance. By operating in a sustainable,market-oriented manner, APB can generate profits, buildits capital, finance its expansion, and generate tax revenuesfor the Government.
A major improvement in the microfinance operatingenviroment was achieved in June 2005, with BOL’s issuanceof new regulations for MFIs. These regulations permit avariety of ownership and a variety of MFI models. They alsodistinguish between deposit-taking and non-deposit-takingMFIs, wisely requiring that non-deposit-taking MFIs onlyneed to register, while deposit-taking MFIs must be licensed.
The Government should also continue to take concretesteps to attract foreign investment in the microfinance sector.The authors of this study are unaware of any country in theworld where microfinance has been able to develop withoutsignificant funding and technical assistance from
international donors and development partners. Donors haverecently become more and more concerned about thesustainability and professional, transparent management ofMFIs that they support. Moreover, several internationalinvestment funds have developed in recent years. In thisnew environment, both donors and investors are requiring,as a condition of their support, a formal ownership shareand seat on the board to allow them to oversee the properuse of their funds. The Government has recognized the needfor foreign investment in many sectors of the economy tocontribute to technology transfer and management expertise.This applies to microfinance also.
For their part, microfinance donors, sponsors, andpractitioners must ensure that their microfinance initiativesfollow good practices and focus on sustainability from theoutset. Directed credit, interest rate subsidies, and otherunsustainable practices should be avoided. “Smartsubsidies” such as grants for training and capacity building,piloting of new and innovative services, accounting andmanagement information systems, and start-up capitalshould be encouraged. Donors, sponsors, and practitionersshould also actively participate in discussions with theGovernment to give feedback on the policy environment andsuggest revisions when necessary to encourage sectordevelopment.
Finally, the Government should regularly monitor thedevelopment of the sector. BOL should create a centraldatabase of microfinance initiatives, thus allowing it tomonitor the number and outreach of institutions of varioustypes. In addition to this direct monitoring, the Government’sRural and Microfinance Committee should meet regularlywith microfinance stakeholders to review progress indeveloping the sector, to receive feedback, to identifyimplementation and policy issues, and to propose newsolutions to further develop the sector.


1
Chapter 1Introduction—The Rural and Microfinance Survey
do they present an accurate picture of the characteristics,including poverty level, of the typical client. Hence, thedegree to which existing programs are reaching the pooror various rural strata and therefore contributing to povertyreduction is not clearly known. Similarly, the sources andterms of finance for different strata of households are notclear. Moreover, the perception of potential clients regardingthe financial services that they demand and their willingnessto pay for such services is not well understood. Now that theGovernment has committed to a major reform program inrural and microfinance, it also wishes to monitordevelopment of the sector to assess the impact of reformand to make adjustments as necessary. For these reasons, itwas timely for the 1996 data to be updated through a newsurvey of rural and microfinance in the Lao PDR. It is hopedthat the survey results will inform policy decisions and thedesign of microfinance initiatives, as well as provide abaseline from which the Government can assess theeffectiveness of its reform program.
Survey Components and DesignThe work that follows is based on a survey carried out inearly 2004. The overall approach had two distinctcomponents that required different survey designs andtechniques.
First, a Household Survey gathered information on thehousehold economy, financial management, assets andliabilities, and attitudes. This survey utilized a random
The Government of the Lao People’s Democratic Republic(Lao PDR) has committed to carrying out a major reformprogram in rural and microfinance consistent with the PolicyStatement on Sustainable Rural and Microfinance, whichthe Prime Minister’s Office issued in late 2003. This programincludes: (i) restructuring the Agriculture Promotion Bank(APB) to be a financially self-sustainable, market-orientedrural finance institution; (ii) adopting and implementing anappropriate regulatory framework for prudential supervisionof APB; (iii) preparing an enabling legal and regulatoryframework for a diversity of microfinance institution (MFI)models with minimum starting regulations, interest rateautonomy, and private and foreign investment; and (iv)actively promoting the creation of best-practice MFIs thatare private, autonomous, professionally managed, andfinancially self-sustainable.
Prior to the present study, the most recent national surveyof rural and microfinance had been conducted in 1996 withsupport from the United Nations Development Programme(UNDP). Results of this survey are still widely quoted asrepresenting the situation and outreach of rural andmicrofinance in the Lao PDR. However, the data from thissurvey are now outdated and therefore not appropriate as abasis either to inform national policy formulation or projectdesign. They do not present an accurate picture of currentoutreach by APB, MFIs, international nongovernmentorganizations (INGOs), Lao Women’s Union (LWU), or otherdevelopment projects with microfinance components. Nor

2
sample of households in rural and semi-rural areas of theLao PDR.
Second, a Rural Financial Services Survey was carriedout with banks, multilateral and bilateral developmentagencies, INGOs and MFIs to capture information aboutthe services provided, the outreach of services, and the termsof savings and credit offered.
A survey of moneylenders was undertaken to supplementthis data, and was carried out in conjunction with theHousehold Survey.
The Household SurveyThe Household Survey used four geographical areas tostratify villages. For rural areas that were not close to urbancenters, villages were assigned to strata using farmingsystems delineations for the Lao PDR developed by theUnited Nations Food and Agricultural Organization (FAO).1
Map 1 illustrates the villages selected.The strata used were:
• “Peri-urban” (areas within 25 kilometers (km) of, butoutside, the country’s four largest urban areas ofVientiane, Savannakhet, Luang Prabang, and Pakse);
• “Provincial Capital” (areas within 10 km of, but outside,the other provincial capital towns);
• “Rural Mekong” (areas with lowland rice farmingsystems, which do not fall within the Peri-urban orProvincial Capital strata areas); and
1 www.fao.org/countryprofiles/Maps/LAO/01/fs/index.html illustrates the farming systemsboundaries used. The farming systems classification was developed by the Food and AgriculturalOrganization (FAO) for the World Bank as part of Dixon J., Gulliver A., and Gibbon D., 2001,“Global Farming Systems Study–Challenges and Priorities to 2030.” This study identifies fourfarming systems for the Lao PDR: lowland rice (areas assigned to the Rural Mekong stratum inthe Household Survey), Upland Intensive, Upland Extensive, and Sparse Forest (areas assignedto the Other Rural stratum in the Household Survey).
Map 1

3
• “Other Rural” (areas using upland intensive andextensive systems, which do not fall within thePeri-urban or Provincial Capital strata).These strata mirror those used in the 1996 UNDP-
financed survey, and are based on the a priori assumptionthat the range and scale of economic activity are differentin these different areas. It was expected that, while economicactivity would be centered on agriculture in the RuralMekong and Other Rural strata, there would be morenonagricultural diversity in the areas just outside provincialcapitals and the major cities.
The sampling process involved classifying all villagesin the Lao PDR into their strata according to theirgeographical location and the subsequent random selectionof a predetermined number of villages within each stratum:17 villages in each of the Peri-urban and Provincial Capitalstrata and 25 villages for each of the Rural Mekong andOther Rural strata. There was no intermediate stratificationby district or province. In each village, a random sample of20 households was drawn using the most recent census data.The survey covered 1,189 households, being on average14.15 households in each of the 84 villages surveyed. In
total, there were 226 observations for the Peri-urban stratum,256 observations for the Provincial Capital stratum, 333observations for the Rural Mekong stratum, and 374observations for the Other Rural stratum. Table 1.1 presentsdata on the sample.
The Household Survey questionnaire collectedinformation on the following topics:• household demographics;• household financial manager;• household economic activities;• household assets;• household liabilities; and• attitudes and opinions to financial services.
To enhance the survey results, the analysis was alsocarried out by wealth quartile. To assign households to wealthquartiles for each household in the sample the probabilitythat each household was sampled was calculated. Theinverse of this probability was calculated to give the numberof households that a sampled household represents in thepopulation. Households were then sorted by wealth. Startingfrom the poorest household in ascending order of wealth,households in the survey were assigned to the poorest
Table 1.1 The Household Survey Sample by Stratum
Stratum Number of Villages Number of Villages Number of Number of Householdsin Sample Households in the Sample
Peri-urban 972 17 169,784 226Provincial Capital 381 17 45,458 256Rural Mekong 3,471 25 305,019 333Other Rural 5,839 25 388,552 374Xaysomboun Special Region 89 0 5,639 0Total 10,752 84 914,452 1,189
Source: Household survey and National Statistics Center.

4
3 It is common for informal moneylenders not to want to be identified. Even where moneylendersare identified, they may have been reluctant to provide full information about their business.Accordingly, data from the moneylender survey can only be used to supplement data abouthousehold borrowing, and since the aggregate incidence of money lending is not necessarilyindicated accurately by the survey (because of nondisclosure of moneylending activities), theoverall scale of moneylending is best assessed from information collected in the householdsurvey about sources of loans.
4 Multilateral and bilateral development agency projects with microfinance components,international nongovernment organizations (INGOs), and microfinance institutions (MFIs) facedconsiderable difficulty in providing much of the information requested in the questionnaires.INGOs, in particular, had difficulty providing information on financial performance and loanportfolios in a form that allowed an analysis of financial performance.
quartile until the cumulative number of householdsrepresented reached 25% of the total population. The processwas continued in ascending order of wealth to assignhouseholds to the remaining three quartiles. The result was291 survey observations for the poorest quartile, 290observations for the second poorest quartile, 287observations for the third poorest quartile, and 321observations for the richest quartile.
The Rural Financial Services SurveyThe Rural Financial Services Survey sought 100% coveragefor the state-owned and private commercial banks operatingin the Lao PDR. Every bank was interviewed. The Bank ofLao PDR (BOL) provided supplementary data.2
For multilateral and bilateral development agencies,INGOs, and MFIs, an initial telephone survey was carriedout to establish which semiformal agents were active in ruraland microfinance in the Lao PDR. Of the 25 semiformalagents that said they were active, a 100% coverage surveywas then attempted. Six multilateral and bilateral
development agencies, 14 INGOs, and 3 MFIs (a total of 23organizations) responded to the survey.
A small sample survey of informal moneylenders wasundertaken in conjunction with the Household Survey. Ineach village, the village head was asked to identify informalmoneylenders, if any, in each sample village. Every informalmoneylender identified was interviewed, if possible.3 A totalof 17 moneylenders were interviewed.
Separate questionnaires were designed for banks;multilateral and bilateral development agencies, INGO, andMFI projects; and informal moneylenders. In general, thequestionnaires collected similar information including thefollowing:• general information on the credit supplier, including the
outreach of the institution;• lending activities and loan portfolios; and• savings services.
Survey ImplementationThe Household Survey was carried out in January andFebruary 2004. The survey of banks was carried out inNovember 2003 and was supplemented with data from BOLin February 2004. The survey of multilateral and bilateraldevelopment agencies, INGOs, and MFIs was carried outintermittently between January and June 2004.4
2 Where data on individual banks is considered confidential, the survey results are reported onaggregate.
A survey in progress

5
CHAPTER 2An Economic Portrait of Rural Households
Characteristics of rural households’ demographic structureand income-generating activities are important determinantsof financial decisions and needs such as borrowing, saving,lending, and risk management. Therefore, this study of ruraland microfinance in the Lao PDR begins by presenting abrief economic portrait of the households surveyed. For thepurposes of analysis, each sampled household was assignedto a geographic stratum and a wealth quartile following themethodology described in Chapter 1.1 Figure 2.1 presentsthe distribution of households by wealth quartile in eachstratum.
The occurrence of households in the poorest quartile ishighest in the Other Rural stratum, where 27.27% ofhouseholds are in the poorest quartile, and is progressivelyless frequent in the Rural Mekong, Provincial Capital, andPeri-urban strata, respectively. The occurrence of ahousehold in the richest quartile follows the opposite pattern,being highest in the Peri-urban stratum (where 38.05% ofhouseholds are in the richest quartile) and progressivelyless frequent in the Provincial Capital, Rural Mekong, andOther Rural strata, respectively. These results indicate thatpoverty is more prevalent in more remote rural areas, whilethe Peri-urban and Provincial Capital strata tend to be
1 No effort was made to determine if households were under the official Lao poverty line as thedata collection necessary for this was beyond the scope of this study. However, the poverty ratein rural Lao PDR is 37.6% according to Lao Info Common Indicators Database System, NationalStatistics Center (the overall poverty rate in Lao PDR is 33.5%). Hence, as a roughapproximation, all households in the poorest quartile, as well as about half of households in thesecond quartile, can be considered poor.
Figure 2.1 Composition of Strata by Wealth Quartiles
Provincial Capital Households
Source: Household survey
Peri-urban Households
Other Rural HouseholdsRural Mekong Households
PoorestQuartile21.68%
RichestQuartile38.05%
2ndPoorestQuartile23.01%
2ndRichestQuartile17.26%
PoorestQuartile23.05%
RichestQuartile32.81%
2ndPoorestQuartile22.66%2nd Richest
Quartile21.48%
PoorestQuartile24.32%
RichestQuartile23.42%
2ndPoorestQuartile22.82%
2ndRichestQuartile29.43%
PoorestQuartile27.27%
RichestQuartile19.52%
2ndPoorestQuartile27.81%
2nd RichestQuartile25.40%

6
wealthier. However, they also indicate that large portions ofhouseholds in each stratum fall into each wealth quartile.
Households’ Income-generating ActivitiesFigure 2.2 shows the proportion of rural households thatreport deriving their primary source of income from self-employment or their own business (including self-employment in agriculture, i.e., working their own farm),salaried work, and wage labor. 2 For 90.34% of ruralhouseholds, the primary source of income is self-employmentor ownership of a business. Only 5.38% of rural householdshave salaried work as the primary source of income, whilewage labor provides the primary source of income for only4.28% of rural households.
Table 2.1 shows the distribution of sources of households’primary income, broken down by stratum and wealth quartile.
2 In this study, the “self-employed” work for themselves or for the household and do not employothers, while “business owners” may or may not work in the business that they own, but alwaysemploy others in their business.
Figure 2.2 Households’ Sources of Primary Income
Source: Household survey
The table shows relatively small differences between stratain the percentage of households with primary income fromself-employment or private business ownership as theprimary income source. However, more households in thewealthiest two quartiles have income from salaried work,while more households in the poorest two quartiles haveincome from wage labor.
To break this down further, Figure 2.3 illustrates thefrequency that households identified specific economicactivities as their primary source of income. Riceproduction is the most common primary source of income(64.65% of rural households), followed by livestock raising(10.24%), and trade (6.96%). Production of other crops isthe primary source of income for only 3.34% of households.The contrast between the poorest quartile—where riceproduction is the main activity for about 70% ofhouseholds—and the richest quartile—where it is the mainsource of income for only 51% of households—suggeststhat relative poverty is linked with the production of the
WageLabour4.28%
SalariedWork5.38%
Self-Employmentor BusinessOwnership
90.34%
Women comprise 40% of households’ financial managers

7
Table 2.1 Sources of Household Primary and Secondary Income
Primary Income from Self-Employment orBusiness Ownership (%) 90.34 88.05 88.67 92.49 89.84 89.87 90.57 89.40 91.52
Primary Income from Salaried Work (%) 5.38 6.19 6.64 2.40 7.22 3.32 4.50 7.66 6.04Primary Income from Wage Labor (%) 4.28 5.75 4.69 5.11 2.94 6.81 4.93 2.93 2.45Total 100.00 100.00 100.00 100.00 100.00 100.00 100.00 100.00 100.00
Source: Household survey
RuralIncome Source Household
Average
Wealth Quartile Results
Poorest 2nd 3rd RichestQuartile Quartile Quartile Quartile
Provincial Rural OtherCapital Mekong Rural
Peri-Urban
Strata Results
Figure 2.3 Household Primary Source of Income
Source: Household survey
All Rural Households Poorest Quartile
Other10.07%
Services0.94%
Wholesaleand Retail
Trade6.96%
Handicraft3.80%
Livestock10.24%
OtherCrops3.34%
Rice64.65%
Other10.50%
Services0%Wholesale
and RetailTrade3%
Handicraft3%
Livestock11%
OtherCrops2%
Rice70%
Other8.48%Services
2.96%
Wholesaleand Retail
Trade16.90%
Handicraft5.21%
Livestock11.00%
OtherCrops4.44%
Rice51.01%
Richest Quartile

8
Table 2.2 Household Income Generating Activities (% of Households Engaged in Activity)
Rice Production 84.78 65.93 85.55 92.79 86.63 88.33 87.11 89.12 74.52Poultry Raising 81.74 59.73 87.11 90.69 83.69 79.27 86.19 85.69 75.78Other Crop Production 57.19 49.56 61.33 44.44 70.05 53.47 63.18 62.74 49.37Pig Raising 56.60 24.78 61.33 63.96 64.17 60.68 57.83 61.82 46.04Fishing 46.99 23.89 41.41 45.95 58.56 55.01 51.12 49.20 32.60Buffalo Raising 45.78 33.19 42.97 52.25 46.52 29.57 49.40 56.32 47.83Handicraft 33.19 20.35 29.30 39.94 33.96 30.78 34.42 35.55 32.02Cow Raising 30.72 8.41 33.20 47.15 27.27 17.48 28.59 38.37 38.44Non-Timber Forest Products 27.85 9.73 21.09 11.41 49.47 34.78 34.58 27.71 14.31Trading 20.36 23.45 15.23 20.12 19.79 12.70 11.62 19.55 37.58Other 15.26 19.47 18.36 16.22 12.30 17.52 13.70 0.13 0.17Forestry for Timber 9.92 5.31 4.30 9.61 12.83 9.33 12.23 10.32 7.80Goat Raising 7.04 2.21 10.94 12.31 4.55 5.75 5.71 9.79 6.89Industry 4.90 3.98 4.30 6.31 4.28 2.21 4.08 5.66 7.67Service Business 2.28 5.75 4.30 0.90 1.60 1.12 1.12 1.40 0.05Transport Business 2.28 5.75 4.30 0.90 1.60 1.12 1.12 0.01 0.05Construction Business 1.71 2.21 1.56 0.90 2.14 1.87 0.08 2.69 2.19
Source: Household survey
AllIncome Source Rural
Households
Wealth Quartile Results
Poorest 2nd 3rd RichestQuartile Quartile Quartile Quartile
Provincial Rural OtherCapital Mekong Rural
Peri-Urban
Strata Results
Figure 2.4 Percentage of Households Engaged in Activities
Source: Household survey
81.74
56.60
46.99 45.78
33.19 30.72 27.85
20.3615.26
9.92 7.04 4.90 2.28 2.28 1.71
57.19
84.78
0
10
20
30
40
50
60
70
80
90
100
Poultry Raising
RiceProduction
Other Crop
ProductionPig RaisingFishingBuffalo RaisingHandicraftCow RaisingNTFP
TradingOther
Forestry for
Timber
Goat RaisingIndustry
Service
Business
Transport
Business
Construction
Business
Activity
Percent
subsistence crop as the primary household source ofincome. Households in the wealthiest quartile are alsomarkedly more engaged in wholesale and retail trade as aprimary source of income.
Figure 2.4 and Table 2.2 present the frequency thathouseholds reported engaging in specific income-generatingactivities (primary or otherwise). These data illustrate that:• the incidence of rice production as a household activity
is greatest in Rural Mekong households (92.79% ofhouseholds) and least in Peri-urban households(65.93%);
• there is a similar pattern with poultry production;• the percentage of households reporting other crop
production was lowest for Rural Mekong households,

9
89.51
81.42
90.63 90.69 91.98
0
20
40
60
80
100
All Rural Households Peri-Urban Provincial Capital Rural Mekong Other Rural
Stratum
Percent
Figure 2.5 Multifunctional Households Stratum Figure 2.6 Multifunctional Households by Wealth Quartile
Source: Household survey
consistent with the dominance of rice in the farmingsystems in the Rural Mekong area, and highest in OtherRural households, consistent with the more diversifiedfarming systems in the Other Rural stratum;
• other crop production was also less frequent in Peri-urbanhouseholds, reflecting the lower overall dependence ofthese households on agriculture;
• livestock raising and fishing were consistently lower inPeri-urban households than elsewhere;
• non-timber forest products (NTFP) as a source of incomewere reported most frequently in Other Rural areas(49.47%), consistent with the farming systems in thoseareas;
• forestry was most common in Other Rural and RuralMekong households, again consistent with their farmingsystems;
• trading was most common in Peri-urban households andleast common in Provincial Capital households;
• service, transport, and construction businesses weremore frequently reported as a source of income by house-holds in the Peri-urban and Provincial Capital stratathan by others, as would be expected given the greaterdemand for these activities near urban areas; and
• the richest quartile of rural households is less engagedin rice production and other agricultural activities, andmore engaged in trading and industry than the otherthree quartiles.Figures 2.5 and 2.6 illustrate the high frequency of
multifunctional households in the Lao PDR, i.e., householdsthat report receiving income from more than one source.Some 90% of rural households engage in multiple income-generating activities. Even the least multifunctional stratum,Peri-urban households, has an incidence of 81.42%, andall four wealth quartiles fall in the range of 88–92%. Thehigh level of multifunctionality is an important observationwith implications for the rural finance system in the Lao
Rural finance has focusedon directed lendingprograms to agriculture,but there is a need forfinancial services thatserve a broad range ofhousehold activities.

10
PDR. While rural finance policies have traditionally focusedon directed lending programs that target agriculturalactivities, the high frequency of multifunctionality suggestsa need for financial services that serve a broad range ofeconomic activities in rural households.
Household IncomeThe frequency with which households report engaging inparticular economic activities is not necessarily a reflectionof the importance of those sources in overall income. Thissection expands further on the previous analysis byexamining the amount of income derived from varioussources. Figures 2.7 and 2.8 illustrate the average incomesof households by stratum and wealth quartile.3
Peri-urban households reported an average income inthe 12 months preceding the survey of KN29.16 million,some 1.44 times the average of Provincial Capitalhouseholds, 2.14 times the average of Rural Mekonghouseholds, and 1.68 times the average of Other Ruralhouseholds. The average income of the richest quartile ofhouseholds at KN39.62 million was 5.08 times that of theaverage income of the households in the poorest quartile.4
Figure 2.9 provides a more detailed analysis of incomesources and illustrates the greater income of Peri-urban andProvincial Capital households, especially from business, incomparison to Rural Mekong and Other Rural households.
3 Incomes include the value of household production consumed by the household itself.4 In the survey the average income reported by the second poorest quartile was KN7.80 million
compared to the marginally higher average income reported for households in the poorestquartile of KN7.67 million. For the purpose of assigning households to the wealth quartiles,assets rather than income were used because assets represent the cumulative wealth positionof the household, while income data applies only to the 12 months preceding the survey. Whileit is beyond the scope of this analysis to investigate this further, it is noted that there aredifferences in the pattern of primary activities between the poorest quartile and the secondpoorest quartile. The second poorest quartile is more dependent on other crops and handicraftsas primary sources of income, and less dependent on rice crop production and livestockproduction than the poorest quartile of households.
Figure 2.7 Average Household Income by Stratum
Source: Household survey
Figure 2.8 Average Household Income by Wealth Quartile
18.48
7.80 7.67
18.86
39.62
0
5
10
15
20
25
30
35
40
45
All Rural Households Poorest Quartile Second Poorest Quartile Second Richest Quartile Richest Quartile
Wealth Quartile
Kip 000,000
0
5
10
15
20
25
30
35
40
45
All Rural Households Peri-Urban Provincial Capital Rural Mekong Other Rural
Stratum
Kip 000,000
18.48
29.15
20.25
13.65
17.35

11
Figure 2.9 Household Income by Source
Average for all Rural Households Peri-urban Provincial Capital Rural Mekong Other Rural
Average for all Rural Households Poorest Quartile 2nd Quartile 3rd Quartile Richest Quartile
It also illustrates the wide variation between the richest andthe poorest, stemming again largely from differences inbusiness income. The figure highlights the importance ofnonagricultural income in rural Lao PDR. Overall, only 38%of reported income came from agriculture, livestock, orfishing. Over half of reported income came from businessactivities. Only the Rural Mekong households, who depend
primarily on rice production, reported more than half of theirincome from agriculture, livestock, and fishing. Amongwealth quartiles, the poorest derived only 35% of theirincome from agriculture, livestock, and fishing; the secondpoorest derived 50% from these sources; and the richestand second richest each derived 37%.
Only 38% of income camefrom agriculture, livestock,or fishing. Over half camefrom business activities.
13.75
6.01
2.70
0.24
3.14
1.26
0.41
0 10 20 30 40 50
29.47
3.39
1.02
0.34
21.03
3.22
0.48
0 10 20 30 40 50
20.69
2.99
2.09
0.39
12.65
2.06
0.52
0 10 20 30 40 50
17.13
2.58
3.69
0.40
8.72
1.51
0.23
0 10 20 30 40 50
18.48
3.90
2.78
0.33
9.34
1.77
0.35
0 10 20 30 40 50
Total Income
Crops
Livestock
Fishing
Other Business
Salaries and Wages
Other IncomeIncomeSource
Kip 000,000
Source: Household survey
18.48
3.90
2.78
0.33
9.34
1.77
0.35
0 10 20 30 40 50
Total Income
Crops
Livestock
Fishing
Other Business
Salaries and Wages
Other IncomeIncomeSource
Kip 000,000
7.80
1.47
1.01
0.25
4.24
0.76
0.07
0 10 20 30 40 50
7.67
2.06
1.40
0.39
2.48
1.16
0.18
0 10 20 30 40 50
18.86
3.59
3.00
0.38
9.76
1.86
0.27
0 10 20 30 40 50
39.62
8.50
5.70
0.31
20.91
3.31
0.89
0 10 20 30 40 50

12
54.57
26.13
13.65
7.41
2.54
1.61
3.23
0 10 20 30 40 50 60
Total Assets
Land
Buildings
Vehicles
Agricultural Machinery and Equipment
Other Business Assets
Other Household AssetsAsset
Kip 000,000
Household AssetsFigure 2.10 summarizes household fixed asset ownership,while Figures 2.11 and 2.12 summarize household workingcapital ownership. The figures highlight:• households in the richest quartile have on average
73.41 times the average fixed assets of households inthe poorest quartile, and these differences arepronounced across each type of fixed asset;
30.22
13.60
8.72
2.61
1.40
0.46
3.42
0 50 100 150 200
Figure 2.10 Household Fixed Asset Ownership by Wealth Quartile
Average for all Rural Households Poorest Quartile 2nd Quartile 3rd Quartile Richest Quartile
Source: Household survey
Average for all Rural Households Peri-urban Provincial Capital Rural Mekong Other Rural
• Peri-urban households have fixed assets almost 3 timesthe average of rural households and almost 5 times theaverage of Other Rural households, and again thesedifferences are pronounced across each type of fixedasset; and
• Peri-urban households have on average 3.46 times theworking capital of the average rural household, and therichest quartile households have on average 10.31 timesthe working capital of the poorest households.
2.43
1.07
0.91
0.04
0.08
0.05
0.28
0 10 20 30 40 50 60
10.70
4.87
3.28
0.37
0.75
0.15
1.28
0 10 20 30 40 50 60
27.03
13.33
7.55
1.11
2.28
0.32
2.43
0 10 20 30 40 50 60
178.38
85.36
42.91
28.19
7.06
5.93
8.95
0 50 100 150 200
54.57
26.13
13.65
7.41
2.54
1.61
3.23
0 10 20 30 40 50 60
Total Assets
Land
Buildings
Vehicles
Agricultural Machinery and Equipment
Other Business Assets
Other Household AssetsAsset
Kip 000,000
149.09
69.90
33.62
28.57
4.91
6.59
5.51
0 50 100 150 200
49.83
24.41
14.96
4.15
2.73
0.77
2.81
0 50 100 150 200
33.67
17.97
8.61
2.24
2.65
0.41
1.78
0 50 100 150 200

13
Source: Household survey
Figure 2.11 Average Household Working Capital by Stratum
Figure 2.12 Average Household Working Capital by Wealth Quartile
Characteristics of HouseholdFinancial ManagersDuring the survey, each household was asked toidentify the household’s main financial manager.The financial manager was defined as the personmost responsible for allocating householdresources and managing the household’s moneyand financial decisions. As such, this person’scharacteristics can influence the household’soverall economic and financial decisions andactivities. Figure 2.13 and Table 2.3 present keycharacteristics of these financial managers,including: 60.5% of households had malefinancial managers, while 39.5% had femalefinancial managers; the average age of householdfinancial managers is almost uniform across strata;female household financial managers are mostprevalent in Peri-urban and Provincial Capitalhouseholds, and among the richer quartiles; andin general, the education level of the householdfinancial manager is lower in more remotehouseholds (Rural Mekong and Other Rural strata)and in poorer quartiles.
60.5% of householdshad male financialmanagers, while39.5% had femalefinancial managers.
5.36
1.702.27
3.84
13.67
0
2
4
6
8
10
12
14
All Rural Households Poorest Quartile Second Poorest Quartile
Second Richest Quartile
Richest Quartile
Wealth Quartile
Kip 000,000
Figure 2.13 Financial Manager Gender
Source: Household survey
FemaleFinancialManagers39.48%
MaleFinancialManagers60.52%
5.36
9.74
4.81 4.41 4.26
0
2
4
6
8
10
12
14
All Rural Households Peri-Urban Provincial Capital Rural Mekong Other Rural
Stratum
Kip 000,000

14
Table 2.3 Household Financial Manager Age, Gender and Educational Level
Average Age of Financial Manager (Years) 43 43 42 45 42 40 43 44 46Female Financial Managers (%) 39.48 53.10 42.19 37.84 34.49 29.04 37.37 44.73 46.78Male Financial Managers (%) 60.52 46.90 57.81 62.16 65.51 70.96 62.63 55.27 53.22Total 100.00 100.00 100.00 100.00 100.00 100.00 100.00 100.00 100.00Financial Manager with No Formal Education (%) 26.08 20.35 25.00 38.14 19.25 34.93 25.60 28.45 15.33Financial Manager with Primary School
Education (%) 48.92 53.54 43.75 42.34 52.67 47.99 51.34 50.64 45.71Financial Manager with Secondary School
Education (%) 20.74 19.91 25.78 16.22 24.06 15.31 19.42 18.71 29.54Financial Manager with Vocational School
Education (%) 2.86 3.10 2.34 2.70 2.94 1.77 1.58 1.14 6.97Financial Manager with Tertiary Education (%) 1.19 2.65 2.73 0.30 1.07 0.00 1.32 1.07 2.37Financial Manager with Other Education (%) 0.20 0.44 0.39 0.30 0.00 0.00 0.73 0.00 0.08Total 100.00 100.00 100.00 100.00 100.00 100.00 100.00 100.00 100.00
Source: Household survey
RuralFinancial Manager Characteristic Household
Average
Wealth Quartile Results
Poorest 2nd 3rd RichestQuartile Quartile Quartile Quartile
Provincial Rural OtherCapital Mekong Rural
Peri-Urban
Strata Results
Table 2.4 Household Financial Manager’s Occupation
Self-Employed (%) 83.64 78.32 82.81 87.69 82.89 91.13 88.10 84.98 70.33Business Owner (%) 3.11 4.87 4.69 2.10 2.94 0.00 0.89 2.92 8.63Employee in a Business (%) 1.22 1.77 2.34 0.60 1.34 1.14 1.45 0.61 1.69Government Employee (%) 6.60 4.87 5.08 3.60 9.89 3.62 5.67 5.35 11.78Unemployed (%) 4.08 9.29 3.52 5.11 1.07 3.32 3.02 4.22 5.77Homemaker (%) 0.26 0.44 1.17 0.00 0.27 0.46 0.41 0.08 0.08Retired (%) 1.09 0.44 0.39 0.90 1.60 0.33 0.46 1.85 1.72Total 100.00 100.00 100.00 100.00 100.00 100.00 100.00 100.00 100.00
Source: Household survey
RuralFinancial Manager Characteristic Household
Average
Wealth Quartile Results
Poorest 2nd 3rd RichestQuartile Quartile Quartile Quartile
Provincial Rural OtherCapital Mekong Rural
Peri-Urban
Strata Results

15
Table 2.5 Basic Characteristics of Rural Households
Self-Employed (%) 83.64 78.32 82.81 87.69 82.89 91.13 88.10 84.98 70.33Business Owner (%) 3.11 4.87 4.69 2.10 2.94 0.00 0.89 2.92 8.63Average Household Size (Persons) 6.1 5.5 6.3 6.5 6.0 5.7 5.9 6.5 6.2Multifunctional Households (%) 1 89.51 81.42 90.63 90.69 91.98 88.70 89.23 91.82 88.26Agriculture, Livestock, or Fishing as Primary
Activity (%) 79.18 71.67 77.34 81.97 80.47 84.18 83.56 82.44 66.53Income (KN million) 18.48 29.47 20.69 13.75 17.13 7.80 7.67 18.86 39.62Portion of Income from Agriculture, Livestock, or
Fishing (%) 37.93 16.12 26.44 65.09 38.94 35.00 50.20 36.96 36.62Average Physical Asset Value (KN million) 57.90 156.95 52.37 35.96 32.49 3.317 11.89 29.15 187.53Average Physical Asset Value ($) 5,450 14,772 4,929 3,384 3,058 312 1,119 2,744 17,650
Source: Household survey
RuralHousehold Characteristic Household
Average
Wealth Quartile Results
Poorest 2nd 3rd RichestQuartile Quartile Quartile Quartile
Provincial Rural OtherCapital Mekong Rural
Peri-Urban
Strata Results
Table 2.4 shows the distribution of the occupations ofhousehold financial managers by stratum and wealthquartile. The table illustrates that:• across strata and quartiles, the vast majority of
household financial managers are self-employed;however, household financial managers are most likelyto be self-employed in Rural Mekong households andthe poorest households;
• the financial managers in Peri-urban households andProvincial Capital households are more likely to ownbusinesses than those in the other two strata, andfinancial managers in the richest households are morelikely to be business owners than those in other quartiles;
• the employment of household financial managers byGovernment was higher in Other Rural households andin the richest households;
• unemployment among financial managers was mostfrequent in Peri-urban areas, and least in Other Ruralareas; and
• there is a very low incidence of household financialmanagers being homemakers or retired people, with98.65% of household financial managers being in theactive labor force.
Basic Household CharacteristicsTable 2.5 summarizes some basic characteristics of ruralhouseholds in the Lao PDR according to the survey results.As already noted, there is noticeable inequality, withhouseholds in the richest quartile owning total assets whosevalue is, on average, 56.5 times that of households in thepoorest quartile, 15.8 times that of the next poorest quartile,and 6.4 that of the next richest quartile. Relative povertytends to be associated with areas that are more remote andmore dependent on agriculture. Some 79% of householdsdepend on agriculture, livestock, or fishing as their primaryactivity but derive, on average, only 38% of their incomefrom these activities; almost 90% are multifunctional,engaging in more than one income-generating activity.
There is noticeableinequality, withhouseholds in the richestquartile owning totalassets whose value is56.5 times that ofhouseholds in thepoorest quartile.

16
Chapter 3Rural Financial Services Supply—The Formal Sector
The supply of rural financial services in the Lao PDR, aswith most developing countries, can be broken down intothe formal, semiformal, and informal sectors. For thepurposes of this study, the formal sector consists of thecommercial banks, which will be covered in this chapter.The semiformal sector comprises project-based interventionsto provide rural and microfinance services. The informalsector comprises loans between friends and family members,informal moneylending, and lending through the traditionalLao houay. The semiformal and informal sectors will bediscussed in the next chapter.
The Formal Sector—A Brief History1The development of the Lao banking system can be dividedinto distinct phases. During the first phase (1975–1988),the Government instituted a mono-banking systemcomprised of the State Bank of Lao PDR (SBL) as thecountry’s only bank. The introduction of the New EconomicMechanism in 1988 ushered in the second phase (1988–1992) by creating a two-tiered banking system. SBL’scommercial banking activities were placed in three state-owned commercial banks (SOCBs), and BOL was createdas the central bank. Four additional SOCBs were created in1990–1991, but all seven of the resultant SOCBs remained
under the management control of BOL.2 Moreover, the legaland regulatory framework was weak, bank supervision waslimited, and bank performance was poor.
The third phase (1992–1995) was characterized byfurther growth in the number of banks in the Lao PDR.Following the issuance of Prime Minister’s Decree No. 3 onthe Management of Commercial Banks and Other FinancialInstitutions (1992), branches of foreign banks (five Thaiand one Malaysian) were established, along with a jointventure bank. And, importantly for the evolution of the ruralfinance system, APB was created as a policy bank by anotherPrime Minister’s Decree in 1993 to make subsidized loansfor agriculture. Performance of the SOCBs remained weak,with nonperforming loans (NPLs) reported at 35% in 1994.To satisfy capital adequacy requirements, the Governmentthen proceeded with a first round of recapitalization of theSOCBs.
The fourth phase (1996–2002) was marked byimprovements in the legal and regulatory environment, withthe issuance of several prudential regulations that appliedto the SOCBs and other banks and a revised Decree on theManagement of Commercial Banks. However, continuedweak performance of the SOCBs led to a program toconsolidate them—by the end of 2002, their number had
1 The section draws on BOL, The Banking and Financial Sector of Lao PDR: Financial SectorNote, 15 July 2002.
2 The seven SOCBs were (with year of creation in parentheses): Nakhornluang Bank (1988),Sethathirath Bank (1988), BCEL (1989), Lao May Bank (1990), Phaktai Bank (1990), LanexangBank (1991), and Arounmay Bank (1991).
APB was created as apolicy bank by a Prime
Minister’s Decree in 1993to make subsidized loans
for agriculture.

17
been reduced to two SOCBs, along with APB.3 However, asof end-2002, all three banks maintained high NPLs,surpassing 80% in one case.
A fifth phase can be considered to have begun in early2003 under the Government’s Banking Sector ReformProgram. Under this program, two of the three state-ownedbanks (Banque pour le Commerce Exterieure du Laos[BCEL] and the Lao Development Bank [LDB]) haveoperated under governance agreements designed to improvecorporate governance and reduce NPLs through enhancedloan collection and improved credit decision making.Similarly, under this program, APB has adopted a newcorporate mandate and restructuring plan to become a
sustainable, market-oriented rural finance institution,operating free of subsidies and phasing out all policy lending.APB is due to receive further support for its reform programunder the Government’s Rural Finance Sector DevelopmentProgram, due to begin in 2006. All three banks are due tobe recapitalized, contingent on satisfactory performance.
Formal Sector ParticipantsThe commercial banking industry in the Lao PDR has threeprincipal groups:• Three SOCBs, namely: BCEL, LDB, and APB. All are
wholly owned by the Government, with BCEL focusedon foreign trade, LDB serving commerce, and APBserving the agricultural sector.
• Three joint-venture commercial banks (JVCBs), namely:the Joint Development Bank (JDB), VientianeCommercial Bank (VCB), and Lao-Viet Bank (LVB). TheJVCBs mainly service customers in the country’sprincipal cities. JDB was established in 1989. VCBbegan operating in 1995. LVB started operations in1999. JDB is a joint venture between the Governmentof the Lao PDR (30%) and private Thai interests. VCBis a joint venture between Lao private investors (25%),and private Australian, Taiwanese, and Thai bankinginterests. LVB is a joint venture between BCEL and theBank for Industrial Development of Viet Nam (BIDV).
• Six foreign commercial banks (FCBs), each operating asingle branch office in Vientiane, and one other UKbank—Standard Chartered Bank—with a representativeoffice in Vientiane. Five of the six FCBs are Thai—Bangkok Bank (BBL), Krung Thai Bank (KTB), SiamCommercial Bank (SCB), Bank of Ayudhya (BAY), andThai Military Bank (TMB)—and one, Public Bank (PBM),is Malaysian. The FCBs primarily service their homecountry clients who have operations in the Lao PDR.
3 The status of APB—as a state-owned commercial bank (SOCB) or as a policy bank—wasunclear after 1997. The wording of the revised decree and regulations indicated that theyapplied equally to APB (e.g, the revised decree included “agriculture promotion bank” in itsdefinition of commercial banks). However, in practice, APB continued to be treated as a policybank that was exempt from prudential regulations, and it was not supervised by BOL. Only inJune 2005 did BOL clarify its status by issuing a directive notifying APB that it will be consideredan SOCB and will be subject to the applicable regulations and supervision.
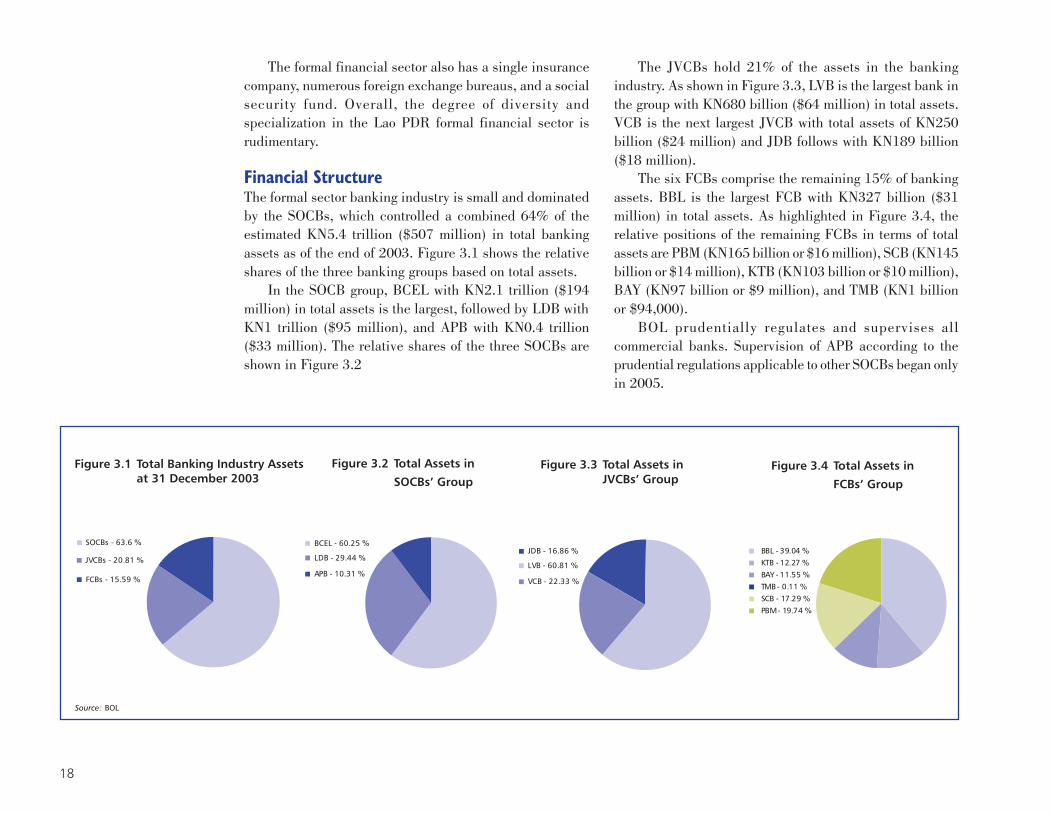
18
The formal financial sector also has a single insurancecompany, numerous foreign exchange bureaus, and a socialsecurity fund. Overall, the degree of diversity andspecialization in the Lao PDR formal financial sector isrudimentary.
Financial StructureThe formal sector banking industry is small and dominatedby the SOCBs, which controlled a combined 64% of theestimated KN5.4 trillion ($507 million) in total bankingassets as of the end of 2003. Figure 3.1 shows the relativeshares of the three banking groups based on total assets.
In the SOCB group, BCEL with KN2.1 trillion ($194million) in total assets is the largest, followed by LDB withKN1 trillion ($95 million), and APB with KN0.4 trillion($33 million). The relative shares of the three SOCBs areshown in Figure 3.2
The JVCBs hold 21% of the assets in the bankingindustry. As shown in Figure 3.3, LVB is the largest bank inthe group with KN680 billion ($64 million) in total assets.VCB is the next largest JVCB with total assets of KN250billion ($24 million) and JDB follows with KN189 billion($18 million).
The six FCBs comprise the remaining 15% of bankingassets. BBL is the largest FCB with KN327 billion ($31million) in total assets. As highlighted in Figure 3.4, therelative positions of the remaining FCBs in terms of totalassets are PBM (KN165 billion or $16 million), SCB (KN145billion or $14 million), KTB (KN103 billion or $10 million),BAY (KN97 billion or $9 million), and TMB (KN1 billionor $94,000).
BOL prudentially regulates and supervises allcommercial banks. Supervision of APB according to theprudential regulations applicable to other SOCBs began onlyin 2005.
Figure 3.1 Total Banking Industry Assetsat 31 December 2003
SOCBs - 63.6 %
JVCBs - 20.81 %
FCBs - 15.59 %
JDB - 16.86 %
LVB - 60.81 %
VCB - 22.33 %
BBL - 39.04 %KTB - 12.27 %BAY - 11.55 %TMB - 0.11 %SCB - 17.29 %PBM - 19.74 %
Figure 3.3 Total Assets inJVCBs’ Group
Figure 3.4 Total Assets in
FCBs’ Group
Figure 3.2 Total Assets in
SOCBs’ Group
BCEL - 60.25 %
LDB - 29.44 %
APB - 10.31 %
Source: BOL

19
The commercial banking industry has experiencedconsiderable growth over the past few years. Between 2002and 2003 alone, total banking assets grew by 28% in nominalterms.4 As a consequence of this growth, as well as continuingsupervisory weaknesses, NPLs in the industry have alsogrown. Ongoing restructuring efforts at the SOCBs and BOLare intended to address these problems.
The commercial banks’ attention toward rural areas andpopulations in the country is very limited. BCEL handlesforeign trade and as such does not concentrate on rural areas.LDB, with its focus on commerce, has interest in financingsmall- and medium-sized enterprises (SMEs), some of whichare in rural areas (though they are principally in provincialcapitals and Vientiane Municipality). APB, with its mandateto promote agriculture, is the SOCB most engaged in ruralareas but, in practice, the majority of its clients are locatedin urban areas. The JVCBs and FCBs do not service ruralareas with the exception of financing investments in rural-based dams, mines, and the like.
Branch NetworksAPB has the largest branch network in the Lao PDR. It hasa head office branch in Vientiane Municipality and 17 otherbranches in the 17 provincial capitals. APB also operates55 subservice units located at the district level.
LDB has its head office in Vientiane Municipality andoperates 17 branches, one in each province. LDB also has29 sub-branches at various district locations. LDB has thesecond largest branch network in the country, but its networkmay decrease as it intends to close some sub-branches.
BCEL has its head office in Vientiane Municipality andsix branches in the major population centers of Champasak,
Khammouane, Luang Namtha, Luang Prabang, Oudomxay,and Savannakhet. For the most part, BCEL does not considerrural populations to be its client base.
The remaining commercial banks have very limiteddistribution networks. LVB has its head office in VientianeMunicipality and a single branch in Champasak. JDB hasits head office branch in Vientiane Municipality and no otherbranches; it reports no intention of opening any newbranches. VCB has a single branch in VientianeMunicipality, but intends to open new branches inSavannakhet and Champasak. The FCBs each have a singlebranch—all located in Vientiane Municipality—with noplans for new branches.
Hence, the population in Vientiane Municipality has thegreatest access (in terms of physical proximity) to commercialbanks, followed by residents of the large urban centers, andthen by residents in the other provincial capitals. As wouldbe expected, residents of rural areas are most removed fromcommercial banks and the services they provide.
Savings ProductsAll commercial banks offer basic saving products in kip,US dollars and Thai baht—current accounts, savingsaccounts, and fixed-term deposits. The SOCBs and JVCBsoffer fixed term deposits out to 24 months in tenor, but theFCBs do not offer fixed-term deposits past 12 months induration. LVB also offers Vietnamese dong savings accountsout to 12 months in tenor.
All commercial banks’ savings products are voluntaryin nature except for LDB and APB who have compulsorysavings in addition to voluntary savings products.Compulsory savings are associated with group guaranteeloan products. As the name suggests, borrowers are requiredto place funds in noninterest-bearing current accounts as aloan conditionality.
4 Inflation as measured by the consumer price index was 12.6% between December 2002 andDecember 2003, implying real growth in banking assets of about 13.7%. See IMF. 2005. LaoPeople’s Democratic Republic: Selected Issues and Statistical Appendix. January, p. 33.

20
APB offers additional, more specialized saving productssuch as daily deposit accounts, lottery payout depositaccounts, and 5-year certificates of deposit. These productswere developed to improve deposit mobilization at APB.From a large deficit position in the mid-1990s, APB is nowclose to fully funding its loan portfolio with customerdeposits. As shown in Table 3.1, most commercial bankscan fund their loan portfolios with funds from their savingsproducts—indeed, many banks have excess liquidity in theform of low loan-to-deposit ratios.
Of total deposits in the commercial banking industry,the SOCBs hold the dominant market share position of 75%as shown in Figure 3.5. Within the SOCBs, BCEL has themost deposits with 61% of the total amount. LDB held about33% of the deposits in this group, while APB held about6%.
Table 3.1 Loan to Deposit Ratios in Commercial Banks
Bank Loans/Deposits Ratio
BCEL 0.39LDB 0.20APB 1.08JDB 0.64LVB 0.85VCB 0.63BBL 1.93KTB 0.47BAY 1.24TMB 0.77SCB 0.15PBM 0.43
Source: BOL.
Interest Rates on SavingsOn 31 December 2003, interest rates on kip-denominateddeposit accounts of different maturities varied between thecommercial banks. The SOCBs offered savings deposit ratesat or slightly above the inflation rate. As shown in Figures3.6 through 3.9, the SOCBs offer progressively higher ratesat longer maturities.
However, BCEL and LDB did not seem to need thesedeposits as their aggregate deposits exceeded theiroutstanding loan portfolios almost threefold at 31 December2003. APB was the only exception as its deposits almostequalled its loan portfolio. The deposit rates offered by BCELand LDB appear to be more policy than commerciallydirected, e.g., as a tool to manage the money supply.
With the exception of LVB, the JVCBs offered depositrates at a much lower level across the time horizon. JDBand VCB appeared to have sufficient liquidity to financetheir current and projected loan portfolios. LVB is similarto the SOCBs in pricing its deposit products. This is expectedas the bank is a joint venture between SOCBs of thegovernments of the Lao PDR and Viet Nam. LVB’s depositsand borrowings exceed its loan portfolio need by almost twotimes.
Figure 3.5 Total Banking Industry Deposits
Source: BOL
SOCBs - 75.31 %
JVCBs - 16.21 %
FCBs - 8.48 %

21
The FCBs, except PBM, do not offer rates at or abovethe rate of inflation for their savings deposits. For longer-dated maturity deposit products, the rates offered rangebetween 8–10 percentage points below the rates offered bythe SOCBs. At their lower pricing levels though, the FCBsappear to be able to attract sufficient funding for their loanportfolios.
All commercial banks also offer deposit accounts in Thaibaht and US dollars, some out to 2 years in maturity. Thedeposit rates offered on these foreign currency accounts arecompetitive with international rates.
Loans
Loan CharacteristicsThe commercial banks offer various loan products basedon their target market segments and appetite for credit risk.APB lends only in kip, but all other banks offer loan productsin US dollars and Thai baht in addition to kip. APB placesits dollar and baht deposits with other banks. LVB alsooffers Vietnamese dong loan products. Loan products areterm facilities as well as overdraft facilities.
0%
5%
10%
15%
20%
25%
BCEL
LDB
APB JDB
LVB
VCB
BBL
KTB
BAY
TMB
SCB
PBM
0%
5%
10%
15%
20%
25%
BCEL
LDB
APB JDB
LVB
VCB
BBL
KTB
BAY
TMB
SCB
PBM
Figure 3.6 Savings Deposit Rates Figure 3.7 3 Months Deposit Rates
Figure 3.8 6 Months Deposit Rates
Source: BOL
Figure 3.9 12 Months Deposit Rates
0%
5%
10%
15%
20%
25%
BCEL
LDB
APB JDB
LVB
VCB
BBL
KTB
BAY
TMB
SCB
PBM
0%
5%
10%
15%
20%
25%
BCEL
LDB
APB JDB
LVB
VCB
BBL
KTB
BAY
TMB
SCB
PBM

22
Loan products for all banks are mainly for workingcapital purposes (financing short-term agriculture andcommercial production) and longer-term financing of capitalassets. Consumer loan products such as hire purchase andhome purchase loan products are not yet offered in themarket. Financial leasing products are still in thedevelopment phase.
Collateral in the form of land, buildings, pledged depositaccounts, and precious metal deposits are usually requiredfor individual, SOE, and corporate borrowers. Groupguarantee loan products, offered only by APB and LDB, arenot secured by physical collateral; instead, they are securedby all members of the borrowing group guaranteeingrepayment of the sum total borrowed by all members of thegroup. Foreclosure and bankruptcy laws are still indevelopment, and a commercial bank’s ability to seize andliquidate collateral in the case of default is weak.
While the SOCBs price their loan products at differentrates based on the type of business in which the borrower isengaged, the other commercial banks use a single baselending rate approach in line with international practice—additional percentage margins are charged based on ananalysis of the borrowers’ credit risk characteristics.
BCEL offers loans for short- and medium-term periodsto individuals, SOEs, and private companies. The maximumloan tenor for kip loans for individuals and SOEs is 1 year.Companies can borrow out to 3 years. The time limits areput in place to manage perceived credit risk. In general,BCEL requires borrowers to pay interest monthly andprincipal quarterly.
LDB offers loan products to group guarantee borrowers,individuals, SOEs, and companies at all maturities rangingfrom short-term to periods greater than 3 years. Like BCEL,LDB generally requires borrowers to pay interest monthlyand principal quarterly.
APB’s loan products range from the short-term to over10 years in maturity for some policy-based loans. APB lendsto group guarantee borrowers, individuals, SOEs, andcompanies. Most group guarantee customers borrow forperiods of less than 1 year to finance agriculture production,though they can borrow money for up to 3 years for thingssuch as tractors and other agriculture capital assets. APBhas numerous repayment schedules for interest and principalbased on the particular characteristics of each loan product.The terms of loans have, in the past, often been determinedin consultation with donors providing project-specific creditlines.
The JVCBs restrict their loan products to fewer customersegments than the SOCBs. JDB only lends to individualsand companies at short maturities. VCB also lends toindividuals and companies, but only for periods of less than3 years. LVB restricts itself to lending to SOEs and
APB’s Luang Prabang Branch

23
5 Within the limits of the survey budget and because of the confidentiality of records on individualbank customers, it was not possible to determine from bank records whether a borrower was“rural” as defined in this study, and therefore not possible to determine to which rural strataborrowers belonged. Instead, outreach of banks to rural areas (and to different wealth quartiles)must be inferred from the survey of 1,189 households, which is reported in Chapter 6.
companies at short maturities. In general, the JVCBs allrequire their borrowers to pay interest and principal monthly.
The FCBs all offer some combination of overdrafts inkip, Thai baht, and US dollars, as well as short-, medium-,and long-term loans in all three currencies.
Because most SOCBs and JVCBs have significant NPLportfolios (this also being the case to a lesser extent for theFCBs), the banks do not aggressively market their loanproducts.
Credit PortfoliosThe three SOCBs (BCEL, LDB, and APB) dominate theindustry’s loan portfolio. They accounted for 59% of totaloutstanding gross loans in the banking sector at the end ofthe first quarter in 2004. Figures 3.10 through 3.14 illustratethe loan portfolio breakdowns for all of the commercial banks.The SOCBs’ lending mandates are evident in their portfoliocompositions, which show their respective shares in variouseconomic sectors.5
APB is the principal lender to forestry and agricultureborrowers. Of total industry lending to this sector, APB holds66% of the total portfolio. On the other hand, BCELdominates lending to industry (50%), construction andequipment (37%), trade (41%) and handicraft (62%). APBonly has a 5% share of handicraft lending.
LDB has a more balanced loan portfolio. It does notdominate any principal loan portfolio category. In most cases,LDB holds a second or third place position in each loanportfolio class.
Figure 3.10 Forestry and Agriculture Lending Figure 3.11 Industry Lending
Figure 3.12 Handicraft Lending
Source: Commercial banks and BOL
BCEL - 21.08 %LDB - 9.48 %APB - 65.93 %JDB - 0.22 %LVB - 1.57 %VCB - 1.64 %BBL - 0 %KTB - 0.08 %BAY - 0 %TMB - 0 %SCB - 0 %PBM - 0 %
BCEL - 50.14 %LDB - 4.13 %APB - 0.54 %JDB - 2.81 %LVB - 0.68 %VCB - 2.88 %BBL - 28.41 %KTB - 1.21 %BAY - 5.94 %TMB - 2.17 %SCB - 0 %PBM - 1.08 %
BCEL - 62.21 %LDB - 23.39 %APB - 5.12 %JDB - 0 %LVB - 2.95 %VCB - 0 %BBL - 0 %KTB - 0.69 %BAY - 1.69 %TMB - 0 %SCB - 0 %PBM - 3.95 %
Figure 3.13 Construction/
Equipment Lending
BCEL - 37.05 %LDB - 24.8 %APB - 7.19 %JDB - 7.15 %LVB - 19.91 %VCB - 3.73 %BBL - 0 %KTB - 0 %BAY - 0 %TMB - 0.17 %SCB - 0 %PBM - 0 %
Figure 3.14 Trade LendingBCEL - 40.58 %LDB - 17.61 %APB - 8.81 %JDB - 6.76 %LVB - 1.9 %VCB - 14.86 %BBL - 0 %KTB - 2.2 %BAY - 1.64 %TMB - 0.8 %SCB - 2.48 %PBM - 2.38 %

24
The JVCBs (JDB, LVB, and VCB) focus principally onthe loan market in Vientiane Municipality and, to a lesserdegree, the other principal cities. This loan market is mainlyfocused on construction and equipment, trade and transport,communications, and services lending.
The FCBs (BBL, KTB, BAY, TMB, SCB, and PBM)facilitate the borrowing needs of their home country clients.This fact can be seen in BBL’s strong market share (28%)in lending to industry.
As shown in Table 3.2, the number of borrowers thatSOCBs serviced is inversely related to the size of their loanportfolios. BCEL has the largest loan portfolio and the lowestnumber of borrowers. Its average loan size is KN1.5 billion($140,000). APB has the smallest loan portfolio among thethree SOCBs and the largest number of borrowers with anaverage loan size per borrower of KN3 million ($262).
Interest RatesTable 3.3 shows the published lending rates as of 31December 2003 for each bank, according to the type of loan.The JVBs and the FCBs in general price their loan productson the basis of perceived risk, the time value of money, andtheir underlying costs. They use a single base lending rateapproach in line with international practice—the ratesshown in Table 3.3 are their base rates. Additionalpercentage margins are charged based on an analysis ofthe borrowers’ credit risk characteristics. Their finallending rates cover these risks, as well as funding costs,administrative expenses, and loan loss provisioningcharges.
The SOCBs price their loans at similar or slightly lowerlevels, but vary rates by sector rather than by assessmentsof risk attached to any particular borrower. In addition, APBcontinues to conduct policy-based lending to agriculture atsubsidized rates that are administratively determined.
6 Rates below 30% per year apply to policy lending under APB management.
Table 3.2 SOCBs’ Portfolios
BCEL LDB APB
Borrowers 556 5,246 86,886Outstanding Loans (KN billion) 826 242 241Loan Amount Per Borrower (KN million) 1,485 46 3Loan Amount Per Borrower (US Dollars) 140,116 4,357 262
Source: BOL. (31 March 2004)
Table 3.3 Published Bank Lending Rates for Kip Loans (Percent) at 1 December 2003
Bank Sector Overdrafts Short-term Medium/Long-term
BCEL Agriculture 24 19 22Industry 24 22 24Services 24 25 27
LDB Agriculture 28 19 22Industry 28 22 24Services 28 24 26
APB6 Agriculture 30 12-30 7-30Industry 30 30 -Services 30 30 -
JDB All Sectors 28 25 25LVB All Sectors - 22 24VCB All Sectors - 32 30BBL All Sectors 24 20 20KTB All Sectors 24 24 24BAY All Sectors - - -TMB All Sectors 24 - 24SCB All Sectors - 24 24PBM All Sectors 22 22 34
Source: BOL.

25
However, APB is moving away from this practice and part ofits loan portfolio is already based on charging market lendingrates. Because the SOCBs’ practice of pricing across sectorsdoes not factor in an assessment of the risk of an individualborrower, the SOCB loan pricing likely does not reflect therisk of the transactions as accurately as the loan pricing ofother commercial banks. It is estimated from the survey thatthe SOCBs’ funding costs are in the range of 10–12%. Thecurrent lending rates charged provide a more than 10%margin to cover expenses and loan losses.
Given the level of kip lending rates in the market andthe increased probability of default for longer-term loans,most loans are short term in duration.
Other Products and ServicesIn addition to savings and loan products, the commercialbanks offer other credit-based as well as cash managementand foreign exchange products. Products include letters ofcredit (LCs) for domestic and international trade; bankguarantees (BGs) such as bid bonds, performance bonds,and advance payments bonds; international money transferssuch as SWIFT payments; domestic money transfers (DomMT); spot foreign exchange (Spot FX) trades; automatic tellermachines (ATM); VISA credit cards; and traveller’s cheques.Table 3.4 summarizes the product offerings of SOCBs andJVCBs. The FCBs are able to offer all these products.
Performance7
Generally, a commercial bank’s asset structure will consistof three primary categories—liquid assets, fixed assets, andloans and accrued interest receivable. The target level ofeach category with respect to total assets is determined by
Table 3.4 Other Products Offered
Bank LCs BGs Int’l MT Dom MT Spot FX ATM VISA TravellerChecks Cards
BCEL Yes Yes Yes Yes Yes Yes Yes NoLDB Yes Yes Yes Yes Yes No No NoAPB No Yes No Yes Yes No No NoJDB No No No No Yes No Yes NoLVB Yes Yes Yes No Yes No No NoVCB Yes Yes Yes No Yes No No Yes
Sources: Commercial Banks.
central bank regulations and the bank’s internal riskguidelines. For liquid assets, the liquidity reserverequirement regulation (cash and readily convertibleinvestment assets held against total deposits) will specifythe minimal level of liquid assets acceptable. Theinternational norm for commercial banks is that liquid assetsrange between 5% and 10% of total assets. Fixed assets,including a bank’s physical distribution network, are usuallyabout 10% of total assets. The remaining 80–85% of assetsare loans and interest receivable.
As shown in Table 3.5, commercial banks in the LaoPDR have much larger percentage holdings of liquid assetsand lower percentage holdings of loans and receivables thanthe international norm. A possible explanation for the highdegree of liquidity may be a general lack of profitable lendingopportunities resulting from an excessive degree of creditrisk in the overall economy. It is also possible that the banksretain large liquid asset holdings to provide depositors withadditional confidence in terms of the banks’ ongoingsustainability. In the case of the SOCBs, large liquid assetsmay reflect their use as an instrument for managing themoney supply, with high deposit interest rates used toincrease deposits and reduce the money supply to keepinflation in check.
7 At the request of BOL and some of the commercial banks, bank performance is reported hereonly in aggregate or by groups of banks to protect the confidentiality of data and performancespecific to individual banks.

26
A contributing factor to the lack of lending opportunitiesat the banks may be the low degree of investment the bankshave made in their physical distribution networks ashighlighted by the low percentage of fixed asset holdings.
Most central banks require commercial banks to haveequity of at least 8% of their risk-weighted assets; this isthe case in the Lao PDR too. The remaining 92% of fundingcapital will be deposits and borrowings. Deposits will usuallybe vastly greater than borrowings as they represent muchcheaper fund sources.
As the current three SOCBs are the direct result ofmergers between the previous seven SOCBs, the currentSOCBs have inherited the financial difficulties that causedthese consolidations in the first place.8 The SOCBs’ problemsrelate mainly to significant NPL portfolios and correspondingcapital impairments. As of 31 December 2003, the capitalof the three SOCBs was significantly negative, amounting to-36% of total assets. The SOCBs are currently undergoingrestructuring and performance-based recapitalizationprograms to address these problems.
Of the total NPLs in the system, the SOCBs hold thevast majority. At end-2003, the aggregate NPL rate in theSOCBs was 58%. The JVCBs hold a much lesser degree,and the FCBs with their limited loan portfolios and focus offoreign currency lending to clients from their home countrieshave the least percentage. Figure 3.15 highlights the relativeNPL rankings within the industry.
Given their large NPL portfolios, the SOCBs also havethe largest share of protective coverage against their impairedloans. The Government of the Lao PDR aims to increasethis level of loan loss provisioning further through therestructuring of the SOCBs. The SOCBs’ loan loss provision
8 While APB did not result from the merger of other SOCBs, it inherited some agriculture loansthat other SOCBs earlier made.
Table 3.5 Bank Asset Structures (Percent)
Asset Class SOCBs JVCBs FCBs All Banks
Liquid Assets 60.7 46.1 48.1 56.6Gross Loans and Receivables 33.7 50.3 39.5 38.9Net Fixed Assets 5.6 3.6 12.4 4.5Total Assets 100.0 100.0 100.0 100.0
Source: BOL.
Table 3.6 Bank Liability Structures (Percent)
Asset Class SOCBs JVCBs FCBs All Banks
Deposits 117.1 64.6 45.9 93.3Borrowings and Others 18.9 15.8 21.8 18.9Equity and Reserves -36.0 19.6 32.3 -12.2Total Liabilities, Equity, and 100.0 100.0 100.0 100.0 Reserves
Source: BOL.
APB’s subservice unit in Savannaket Province
27
percentages are similar percentages as their NPL holdingsas shown in Figure 3.16.
The FCBs hold a larger percentage of loan loss provisionsrelative to their NPL position than the other commercialbanks. This situation illustrates their general practice ofprudently providing more than the total amount of their NPLs,provisions on average being about 190% of actual NPLs.The SOCBs currently have four-fifths coverage over theirNPL portfolios, while the JVCBs have about one-thirdcoverage. The JVCBs and FCBs have substantial equitypositions, averaging about one third of total liabilities andequity, reflecting the high minimum capital requirementsfor nonstate-owned banks in the Lao PDR in relation to theoverall size of their balance sheets. They are also more reliantupon borrowings to finance their assets than the SOCBs.
Figure 3.15 Share of Nonperforming Loans by Value
Source: BOL.
SOCBs - 74.4 %
JVCBs - 23.7 %
FCBs - 1.9 %
Figure 3.16 Share of Loan Loss Provisions by Value
SOCBs - 83.6 %
JVCBs - 11.3 %
FCBs - 5.1 %
This is typical for FCBs with just one branch location.Normally, these types of operations are financed with asubstantial loan from the parent commercial bank (quasiequity) located in another country. The JVCBs’ borrowingpercentage is skewed somewhat by a large borrowing of LVB,from its parent development bank in Viet Nam. For JDB andVCB, borrowings are less of a funding source as depositsprovide 87% and 65% of their capital funding, respectively.All SOCBs, one JVCB, and a few FCBs recorded losses infiscal year 2003. Loan loss provision expenditures to coverNPL portfolios were the primary reason for the losses. Theother commercial banks reported positive earnings. Theirreturn on equity (ROE) varies between 2% and 11%.

28
The Semiformal Sector
Sector ParticipantsThe semiformal sector in the Lao PDR primarily comprisesproject-based interventions that provide rural andmicrofinance services. They are labelled “semiformal”because they share some characteristics with the formalsector and other characteristics with the informal sector.These interventions are “formal” in the sense that they falleither under Government-approved activities sponsored bymultilateral and bilateral development agencies and INGOs;or they operate under the current BOL regulations on creditcooperatives. They are “informal” in that the savings andcredit activities carried out are not supervised by BOL andtheir financial sector operations are not subject to officialfinancial reporting requirements.
Overall, the survey had 23 respondents (out of 25organizations contacted), who between them supported 33projects with a total of 50 microfinance initiatives. Therespondents comprised three groups. The first consisted of6 multilateral and bilateral development agencies supportingmicrofinance components in larger projects. These
Chapter 4Rural Financial ServicesSupply— the Semiformaland Informal Sectors
Map 2

29
Table 4.1 Microfinance Funded by Multilateral and Bilateral Development Agency Credit Lines
Name of Project withMicrofinance Component
European Union (EU) Provincial and District Authorities EU Phongsaly Forest Conservation and Phongsaly Boun Neua, Boun Tai, SamphanhRural Development Project (PFCRDP)
GTZ Bokeo/Rural Development LWU and Department of RDP Bokeo Bokeo and Xaysomboun Four districtsProject (RDP) Agriculture and Forestry (DAFO) Special Zone
International Fund for Agricultural LWU District Development Project Xieng Khouang Pek, Phoukout, Khoun, Phaxay,Development (IFAD) Kham, Nonghed
Lao Luxembourg Development District Community Development Lao Luxembourg Integrated Rural Bolikhamxay BolikhamsayCommittee Development Project
Asian Development Bank (ADB) Not stated Secondary Town Development Project Champasack Pakse
United Nations Office on Drugs and Not stated Shifting Cultivation Stabilization Pilot Huaphanh XamneuaCrime (UNODC) Project
Source: Rural Financial Services Survey
Name of Organization Local PartnerLocation
Province District(s)
microfinance components took the form of providing creditlines for onlending as microcredit. The second groupconsisted of 14 INGOs supporting microfinance componentsthat were included in larger projects. The third groupconsisted of three specialized MFIs set up specifically toprovide sustainable microfinance services.1
Not all projects and microfinance initiatives are strictly“rural” as defined in Chapter 1. Most operate exclusivelyor primarily in rural areas, but some operate equally in ruraland urban areas, and a few are primarily urban but stillwith some rural clients. Moreover, data on their borrowersare not comprehensive enough to determine the proportionsthat are rural and urban. However, to give a comprehensivepicture of the institutional terrain of rural finance, we attemptto include all known semiformal sector activities that touchon rural areas.2
Multilateral and Bilateral Development AgenciesOn 31 December 2003, multilateral and bilateraldevelopment agencies financed six credit lines deliveredthrough Lao PDR partners for onlending as microcredit.These are summarized in Table 4.1.
International Nongovernment OrganizationsThere are no domestic NGOs in the Lao PDR, but since theearly 1990s several INGO-sponsored projects have beenestablished. Sixteen INGOs were identified as having projectswith microfinance components. As shown in Table 4.2, 14responded to the survey.3 These 14 had 21 projects with a totalof 28 microfinance components. The financial services providedthrough these components are generally ancillary to the widerprojects of which they form part, and have generally not beenestablished with a view to creating sustainable MFIs.
1 See Map 2 for locations of semiformal sector projects.2 Chapters 5 and 6, which report the results of the household survey, present data on the rural
coverage of various sources of financial services.
3 In a pre-survey review of INGOs, Concern Worldwide and CUSO stated they were each managingone project with a microfinance component. Both organizations were invited to participate inthe survey but did not respond.

30
Table 4.2 INGOs with Projects with Microfinance Components
Name of Project withMicrofinance Component
Adventist Development and LWU SME Development Project Champasack Pakse, SoukoumarRelief Agency (ADRA)
Care international Ministry of Agriculture and Food Conservation and Livelihoods Xayaboury PaklaiForestry (MAF) Project
Coopération Internationale LWU XayBouathong Integrated Community Khammouane Xaybouathongpour le Développement et la Development ProgramSolidarité (CIDSE)
Phin Self-Help Rural Development Savannakhet PhinProgam
Community Action Abroad (CAA) LWU / MAF Sustainable Community Development Vientiane, Saravane, Med, Phuong (Vientiane); Thaoy,Project Sekong Toomhan (Saravane); Thanteng,
Lamam (Sekong)
Cooperation Committee for Laos Local community PDDP Phongsaly Phongsaly(CCL) Not stated Prodesa Xayaboury Botene
Danish Red Cross LWU Primary Health Care Project Huaphanh Haumuong
Foundation for Integrated LWU Women’s development Project/FIAM Vientiane Municipality, Xaithany, Xaithetta (VientianeAgricultural Management (FIAM) Vientiane, Khammouane Municipality); Thoulakhom,
Viengkham (Vientiane);Thakek,Hinboun (Khammouane)
Women’s development Vientiane Municipality Pak Ngeum, NaxaithongProject/FED/CODI
GAPE International/ Village Focus Local community Human Dignity Initiative Project Vientiane Municipality Sikhotabong, Xaysettha,Chanthabouly, Sisathanak
German Agro Action (GAA) MAF, Ministry of Health, Ministry of Nam Beng, Nam Mao Community Oudomxay Xay, BengEducation Development and Conservation ProjectLocal community Integrated Poverty Reduction Project Phongsaly Mai
Norwegian Church Aid (NCA) LWU / DAFO HIV/AIDS Protection Project Savannakhet Khanthanabury, Xaibouthong,Champorn, Songkhone, Xaiboury
LWU Long Alternative Development Project Luang Namtha Mouanglong(LADP)
LWU Bokeo Rural Development Project Bokeo Meung
Oxfam Belgium (Rural Development Not stated Phonesoury Development Project Vientiane PhonehongProject)
Save the Children Australia LWU Poverty Reduction at Community Level in Xayaboury XayabouryRemote Areas Project
World Concern Provincial Health Department Salavan Community Development Saravane WapiProject
World Vision Not stated Poverty Reduction Project: Savannakhet Savannakhet AthsaphongthongLWU / MAF Kan River Poverty Alleviation Project Luang Prabang Xieng Ngeun
Source: Rural Financial Services Survey
Name of Organization Local PartnerLocation
Province District(s)

31
Sustainable Microfinance InitiativesInitiatives targeting sustainable microfinance in the Lao PDRbegan in 1996. By the end of 2003, three such initiativeswere identified. First, the Coopérative de Crédit de Soutienaux Petits Producteurs (CCSP) was established in 1996 byLao entrepreneurs. It consists of 12 separately licensedcredit cooperatives, listed in Table 4.3, all overseen by acentral office in Vientiane. Second, the Microfinance Projectwas launched in 1997 with support from the United NationsCapital Development Fund (UNCDF) and the UNDP. It wastransferred in 2002 to the Ministry of Finance (MOF), whichcontinues to manage the project, now known as theMicrofinance Office. It consists of three project components,listed in Table 4.3. Third, the Rural DevelopmentCooperative (RDC) is a licensed credit cooperative and wasstarted in August 2001 with support from the VientianeMunicipal Development Fund.4 Table 4.3 summarizes the16 individual credit cooperatives or components of thesethree MFIs.5
Table 4.3 Sustainable Microfinance Initiatives 6
Name of Organization
CCSP Xieng Khouang M. PekCCSP Vientiane VangviengCCSP Vientiane Municipality Hong NgoaCCSP Champasack PaksongCCSP Luang Prabang Luang PrabangCCSP Vientiane Municipality Saysettha; NaxaithongCCSP Saravane KongsedoneCCSP Saravane Lao NgamCCSP Champasack PakseCCSP Vientiane KasiCCSP Sekong ThatengCCSP Saravane NateutMicrofinance Office (Oudomsay) Oudomxay XaiMicrofinance Office (SIPSACRES) Vientiane Municipality ChanthaboulyMicrofinance Office (Xayaboury) Xayaboury Xayaboury, Moungpheng, PaklaiRural Development Cooperative Vientiane Municipality Naxiaithong
Source: Rural Financial Services Survey
LocationProvince District(s)
4 At the time of the survey, the establishment of three member-owned savings and credit unions(SCUs) with support from ADB was getting underway, but the SCUs had not opened for businessand are not reported on here. Moreover, these three SCUs would fall outside the rural boundariesas defined in Chapter 1.
5 In the analysis that follows, each of the 16 cooperatives and components is treated as a separatemicrofinance initiative as each has considerable autonomy in determining its own productsand prices. Hence, the number of observations for sustainable MFIs in the analysis is 16 andnot 3.
6 As indicated under “location,” some MFIs are based in urban areas. As noted in the introductionto this chapter, data available from each organization did not permit a determination of howmany customers were rural or urban, and we have included all semiformal initiatives thattouch on rural areas, even those that are primarily (but not exclusively) urban. See Chapters 5and 6 on the household survey for data on the rural outreach of financial services. A village savings and credit group near Phon Hong, Vientiane Province

32
Local PartnersIn the Lao PDR, multilateral, bilateral, and INGO projectsare typically implemented through local partners. The LWUwas the most frequent local partner. Three multilateral andbilateral development agencies cooperate with LWU in theirmicrofinance components, and 9 INGO microfinancecomponents are implemented through LWU. The Ministryof Agriculture and Forestry (MAF) was the next most frequentpartner reported, being the partner in 4 INGO components(including 2 in conjunction with LWU and 1 in conjunctionwith other government departments). The 3 MicrofinanceOffice project components worked with the MOF. Six projectcomponents reported various other local partners, while 3components reported no local partner.
Types of Microfinance Organizational FormsThree main types of microfinance organizational formspredominate in the Lao PDR. These are defined in thisreport as:• Savings and Credit Unions (SCUs) and Credit
Cooperatives operating under BOL regulations, whichtake savings and make loans; project funds andmembers’ subscriptions and savings are combined tomake loans that are disbursed and repaid in cash
• Village Savings and Credit Groups (VSCGs) notoperating under BOL regulations, which take savingsand make loans; project funds and members’ savingsare combined to make loans that are disbursed andrepaid in cash or in kind, and
• Village Revolving Funds (VRFs) not operating underBOL regulations, which do not take savings; projectfunds are used for loans disbursed and repaid either incash or in kind.Five of the 6 multilateral and bilateral microfinance
components were reported as VSCGs, and the remaining 1operated as a VRF. Some 75% of INGO microfinance
Objectives of Microfinance InitiativesThe reported objectives of the microfinance initiatives varywith the overall project of which they form a part. Figure 4.1shows the percentage breakdown of the primary objectivesof microfinance initiatives: 68% reported income generationas their primary objective, while 18% stated food security.Poverty alleviation, rural or community development, andhealth were also mentioned as primary objectives. Figure4.2 shows the percentage breakdown of secondary objectivesof microfinance components. Secondary objectives ofmicrofinance initiatives were more varied than primaryobjectives.
Source: Rural Financial Services Survey
Figure 4.1 Primary Objectives of Microfinance Initiatives
Figure 4.2 Secondary Objectives of MicrofinanceInitiatives
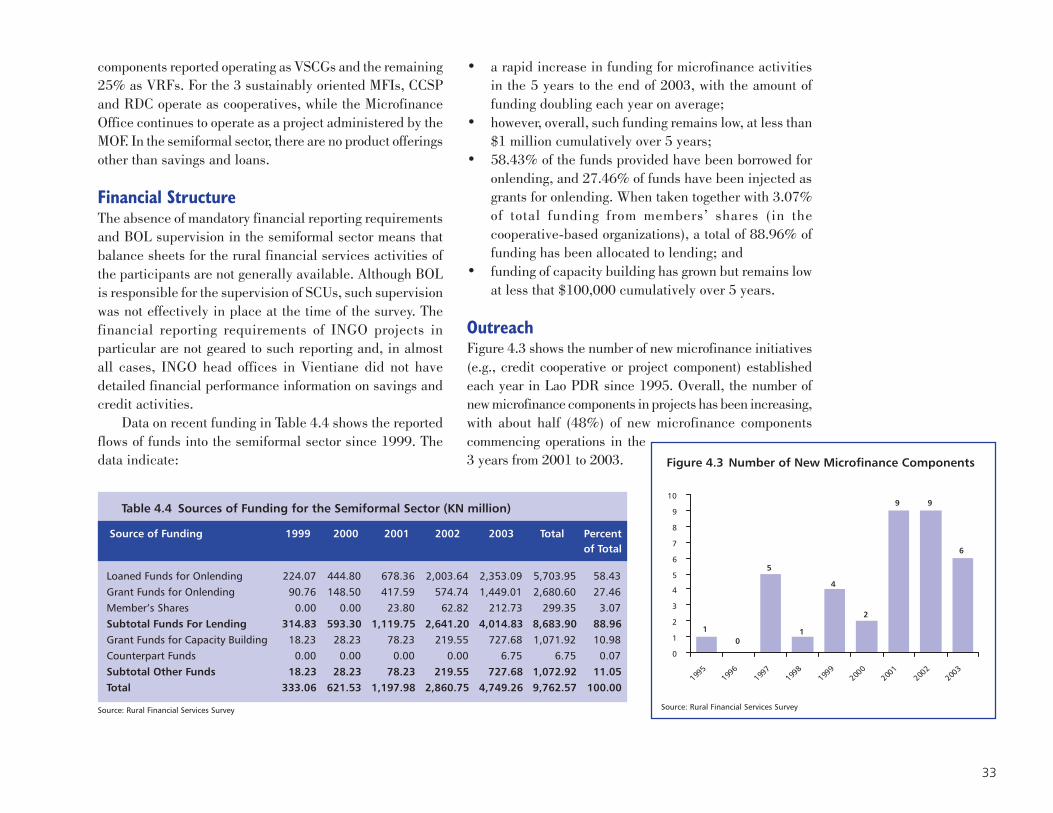
33
10
5
1
4
2
9 9
6
0
1
2
3
4
5
6
7
8
9
10
1995
1996
1997
1998
1999
2000
2001
2002
2003
components reported operating as VSCGs and the remaining25% as VRFs. For the 3 sustainably oriented MFIs, CCSPand RDC operate as cooperatives, while the MicrofinanceOffice continues to operate as a project administered by theMOF. In the semiformal sector, there are no product offeringsother than savings and loans.
Financial StructureThe absence of mandatory financial reporting requirementsand BOL supervision in the semiformal sector means thatbalance sheets for the rural financial services activities ofthe participants are not generally available. Although BOLis responsible for the supervision of SCUs, such supervisionwas not effectively in place at the time of the survey. Thefinancial reporting requirements of INGO projects inparticular are not geared to such reporting and, in almostall cases, INGO head offices in Vientiane did not havedetailed financial performance information on savings andcredit activities.
Data on recent funding in Table 4.4 shows the reportedflows of funds into the semiformal sector since 1999. Thedata indicate:
• a rapid increase in funding for microfinance activitiesin the 5 years to the end of 2003, with the amount offunding doubling each year on average;
• however, overall, such funding remains low, at less than$1 million cumulatively over 5 years;
• 58.43% of the funds provided have been borrowed foronlending, and 27.46% of funds have been injected asgrants for onlending. When taken together with 3.07%of total funding from members’ shares (in thecooperative-based organizations), a total of 88.96% offunding has been allocated to lending; and
• funding of capacity building has grown but remains lowat less that $100,000 cumulatively over 5 years.
OutreachFigure 4.3 shows the number of new microfinance initiatives(e.g., credit cooperative or project component) establishedeach year in Lao PDR since 1995. Overall, the number ofnew microfinance components in projects has been increasing,with about half (48%) of new microfinance componentscommencing operations in the3 years from 2001 to 2003.
Table 4.4 Sources of Funding for the Semiformal Sector (KN million)
Source of Funding 1999 2000 2001 2002 2003 Total Percentof Total
Loaned Funds for Onlending 224.07 444.80 678.36 2,003.64 2,353.09 5,703.95 58.43Grant Funds for Onlending 90.76 148.50 417.59 574.74 1,449.01 2,680.60 27.46Member’s Shares 0.00 0.00 23.80 62.82 212.73 299.35 3.07Subtotal Funds For Lending 314.83 593.30 1,119.75 2,641.20 4,014.83 8,683.90 88.96Grant Funds for Capacity Building 18.23 28.23 78.23 219.55 727.68 1,071.92 10.98Counterpart Funds 0.00 0.00 0.00 0.00 6.75 6.75 0.07Subtotal Other Funds 18.23 28.23 78.23 219.55 727.68 1,072.92 11.05Total 333.06 621.53 1,197.98 2,860.75 4,749.26 9,762.57 100.00
Source: Rural Financial Services Survey
Figure 4.3 Number of New Microfinance Components
Source: Rural Financial Services Survey
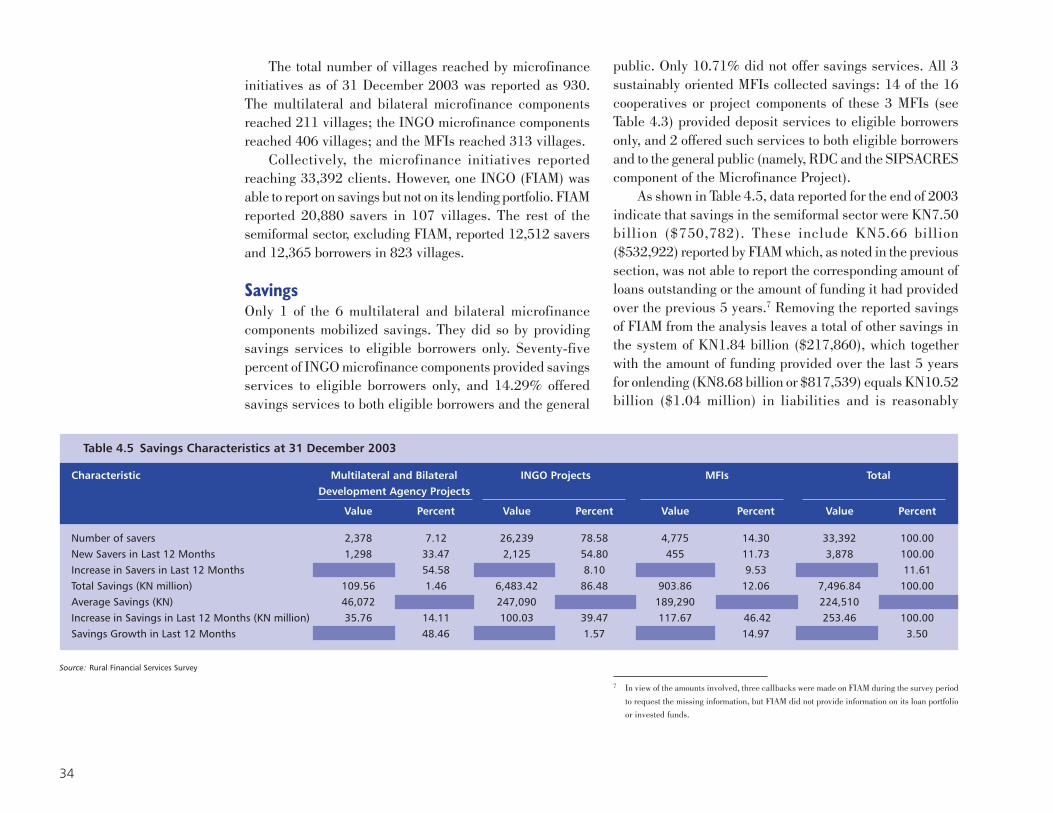
34
The total number of villages reached by microfinanceinitiatives as of 31 December 2003 was reported as 930.The multilateral and bilateral microfinance componentsreached 211 villages; the INGO microfinance componentsreached 406 villages; and the MFIs reached 313 villages.
Collectively, the microfinance initiatives reportedreaching 33,392 clients. However, one INGO (FIAM) wasable to report on savings but not on its lending portfolio. FIAMreported 20,880 savers in 107 villages. The rest of thesemiformal sector, excluding FIAM, reported 12,512 saversand 12,365 borrowers in 823 villages.
SavingsOnly 1 of the 6 multilateral and bilateral microfinancecomponents mobilized savings. They did so by providingsavings services to eligible borrowers only. Seventy-fivepercent of INGO microfinance components provided savingsservices to eligible borrowers only, and 14.29% offeredsavings services to both eligible borrowers and the general
public. Only 10.71% did not offer savings services. All 3sustainably oriented MFIs collected savings: 14 of the 16cooperatives or project components of these 3 MFIs (seeTable 4.3) provided deposit services to eligible borrowersonly, and 2 offered such services to both eligible borrowersand to the general public (namely, RDC and the SIPSACREScomponent of the Microfinance Project).
As shown in Table 4.5, data reported for the end of 2003indicate that savings in the semiformal sector were KN7.50billion ($750,782). These include KN5.66 billion($532,922) reported by FIAM which, as noted in the previoussection, was not able to report the corresponding amount ofloans outstanding or the amount of funding it had providedover the previous 5 years.7 Removing the reported savingsof FIAM from the analysis leaves a total of other savings inthe system of KN1.84 billion ($217,860), which togetherwith the amount of funding provided over the last 5 yearsfor onlending (KN8.68 billion or $817,539) equals KN10.52billion ($1.04 million) in liabilities and is reasonably
7 In view of the amounts involved, three callbacks were made on FIAM during the survey periodto request the missing information, but FIAM did not provide information on its loan portfolioor invested funds.
Table 4.5 Savings Characteristics at 31 December 2003
Characteristic Multilateral and Bilateral INGO Projects MFIs TotalDevelopment Agency Projects
Value Percent Value Percent Value Percent Value Percent
Number of savers 2,378 7.12 26,239 78.58 4,775 14.30 33,392 100.00New Savers in Last 12 Months 1,298 33.47 2,125 54.80 455 11.73 3,878 100.00Increase in Savers in Last 12 Months 54.58 8.10 9.53 11.61Total Savings (KN million) 109.56 1.46 6,483.42 86.48 903.86 12.06 7,496.84 100.00Average Savings (KN) 46,072 247,090 189,290 224,510Increase in Savings in Last 12 Months (KN million) 35.76 14.11 100.03 39.47 117.67 46.42 253.46 100.00Savings Growth in Last 12 Months 48.46 1.57 14.97 3.50
Source: Rural Financial Services Survey
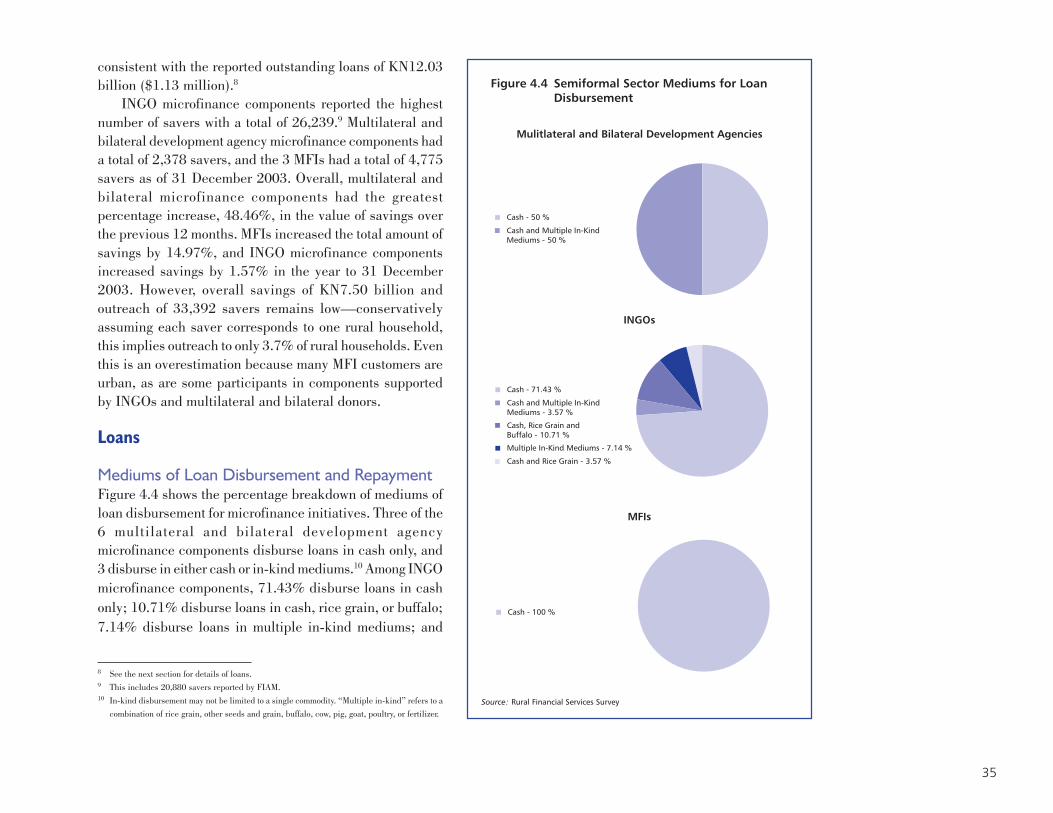
35
consistent with the reported outstanding loans of KN12.03billion ($1.13 million).8
INGO microfinance components reported the highestnumber of savers with a total of 26,239.9 Multilateral andbilateral development agency microfinance components hada total of 2,378 savers, and the 3 MFIs had a total of 4,775savers as of 31 December 2003. Overall, multilateral andbilateral microfinance components had the greatestpercentage increase, 48.46%, in the value of savings overthe previous 12 months. MFIs increased the total amount ofsavings by 14.97%, and INGO microfinance componentsincreased savings by 1.57% in the year to 31 December2003. However, overall savings of KN7.50 billion andoutreach of 33,392 savers remains low—conservativelyassuming each saver corresponds to one rural household,this implies outreach to only 3.7% of rural households. Eventhis is an overestimation because many MFI customers areurban, as are some participants in components supportedby INGOs and multilateral and bilateral donors.
Loans
Mediums of Loan Disbursement and RepaymentFigure 4.4 shows the percentage breakdown of mediums ofloan disbursement for microfinance initiatives. Three of the6 multilateral and bilateral development agencymicrofinance components disburse loans in cash only, and3 disburse in either cash or in-kind mediums.10 Among INGOmicrofinance components, 71.43% disburse loans in cashonly; 10.71% disburse loans in cash, rice grain, or buffalo;7.14% disburse loans in multiple in-kind mediums; and
8 See the next section for details of loans.9 This includes 20,880 savers reported by FIAM.10 In-kind disbursement may not be limited to a single commodity. “Multiple in-kind” refers to a
combination of rice grain, other seeds and grain, buffalo, cow, pig, goat, poultry, or fertilizer.
Figure 4.4 Semiformal Sector Mediums for LoanDisbursement
Mulitlateral and Bilateral Development Agencies
INGOs
Source: Rural Financial Services Survey
MFIs
Cash - 50 %
Cash and Multiple In-KindMediums - 50 %
Cash - 71.43 %
Cash and Multiple In-KindMediums - 3.57 %
Cash, Rice Grain and Buffalo - 10.71 %
Multiple In-Kind Mediums - 7.14 %
Cash and Rice Grain - 3.57 %
Cash - 100 %

36
3.37% disburse in cash and rice grain. All MFIs disburseloans in cash only.
Figure 4.5 shows the percentage breakdown of mediumsof loan repayment. Five of the 6 multilateral and bilateralmicrofinance components require loans to be repaid in cashonly and one requires loans to be repaid in-kind. Mediumsof loan repayment are more varied among INGO microfinancecomponents: 71.43% require loans to be repaid in cash only;17.86% require repayment in cash, rice grain, or the originalanimal borrowed; the remaining components require differentcombinations of cash and in-kind repayment. All MFIs requireloans to be repaid in cash only.
Loan ClientsFigure 4.6 shows the percentage breakdown of loan clientsfor microfinance initiatives—66.67% of multilateral andbilateral development agency microfinance componentsprovide loans to mixed groups only; 16.67% disburse loansto a broad spectrum of loan clients comprised of womenand men as individuals, women’s groups, men’s groups, and
Source: Rural Financial Services Survey
Figure 4.6 Loan Clients in the Semiformal Sector
Mulitlateral and Bilateral Development Agencies INGOs MFIs
Cash - 83.33 %
Cash, Rice Grain or Multiple In-KindMediums - 16.67 %
Source: Rural Financial Services Survey
Figure 4.5 Semiformal Sector Mediums for Loan Repayment
Mulitlateral and BilateralDevelopment Agencies
INGOs
Cash - 71.43 %
Cash, Rice Grain or Multiple In-KindMediums - 3.57 %
Cash, Rice Grain or the Original AnimalBorrowed - 17.86 %
Cash and Rice Grain - 3.57 %
Not Stated - 3.57 %
Cash - 100 %
MFIs

37
mixed groups; and 16.67% provide loans to mixed groupsand registered enterprises only. Individual INGOmicrofinance components tend to be more focused onlendingspecific to target client types: 60.71% provide loans to mixedgroups only, 22.73% to women and men as individuals only,7.14% to women and men as individuals and also mixedgroups, 7.14% to women only as individuals, and 7.14% towomen’s groups. Thirteen of the 16 sustainably oriented MFIcredit cooperatives or project components (81.25%) lendonly to women and men as individuals and to mixed groups,and 18.75% lend to mixed groups only.
Credit PortfoliosFigure 4.7 shows the percentage breakdown of creditportfolios by borrower’s declared loan purpose, accordingto the responses of the sponsoring organizations, as of 31December 2003. The MFI portfolios are distinguished bytheir concentration in the trade and handicraft sectors, theINGOs by concentration in livestock and crop production,and multilateral and bilateral development agencies byconcentration in livestock, crops, and handicrafts.
Loan Characteristics
Loan DurationFigure 4.8 shows the terms of loan products offered bymicrofinance initiatives for various purposes. Loan productsavailable from multilateral and bilateral development agencymicrofinance components have a median term of 12 months,while the median term for loan products from INGOmicrofinance components and MFIs is 6 months. The termsfor loans offered by multilateral and bilateral developmentagency microfinance components vary from 3 to 84 months—for crop production, they vary from 6 to 84 months11, and forlivestock production from 12 to 60 months. Terms for loans Source: Rural Financial Services Survey
Figure 4.7 Credit Portfolios in the Semiformal Sector
Mulitlateral and Bilateral Development Agencies
MFIs
INGOs

38
from INGO microfinance components vary from 3 to 36months, which is the same range for crop production andlivestock production loans. Terms for loans from MFIs varyfrom 1 to 12 months—for crop production, from 3 to 12months; for livestock raising, from 4 to 12 months; and forhandicraft, from 3 to 12 months. Overall, the terms of MFIloans are shorter than those of multilateral, bilateral, andINGO components, particularly for lending for livestock andcrops.
Loan AgreementsTwenty-two out of the 23 survey respondents stated that theyrequired written loan agreements for all loans made. Onlyone INGO did not use written loan agreements.
11 Lao Lux Development offers 7-year loans (84 months) for fruit trees. Other than this, the nextlongest loan term for multilateral and bilateral agencies is 60 months.Weaving is a common business activity of many women in the Lao PDR
Source: Rural Financial Services Survey
Figure 4.8 Loan Terms in the Semiformal Sector
Mulitlateral and Bilateral Development Agencies INGOs MFIs

39
Collateral RequirementsFigure 4.9 shows the percentage breakdown of collateralrequirements for microfinance initiatives: 54.35% of loanproducts offered by multilateral and bilateral developmentagency microfinance components required a group guaranteeas collateral, 23.91% did not require any collateral, and21.74% required physical collateral. For INGO microfinancecomponents, 83.41% of loan products required no collateral,11.71% required a group guarantee, and 4.88% requiredphysical collateral. All loan products that MFIs offeredrequired collateral: 81.82% required physical collateral, and18.18% required a group guarantee.
Interest RatesFigure 4.10 shows the median, maximum, and minimumeffective annual interest rates on loan products offered bymicrofinance initiatives.
Loans products offered by microfinance initiatives havea median effective interest rate of 48% (annual percentagerate, APR) per year, while loans products offered by INGOmicrofinance components have a median rate of 22% peryear (annual percentage rate, APR); and loan products frommultilateral and bilateral development agency microfinancecomponents have a median rate of 12% per year. However,median values of effective interest rates varied acrossdifferent loan products for each group. For multilateral andbilateral development agency microfinance components,they ranged from 3 to 22%; for INGOs, from 3 to 108%; andfor MFIs, from 24 to 84%. Survey results indicate thatmultilateral and bilateral development agencies and INGOsfrequently subsidize interest rates and offer credit at wellbelow costs. This is one reason why few, if any, of theseinitiatives are sustainable. Given the additional costsassociated with microfinance, rates of between 35% and
Source: Rural Financial Services Survey
Figure 4.9 Collateral Requirements in theSemiformal Sector
Mulitlateral and Bilateral Development Agencies
INGOs
MFIs

40
50% would be expected for sustainable operations.12 Onlythe three sustainably oriented MFIs regularly charge interestrates at these levels. As noted by CGAP: “Microcreditinterest rates are set with the aim of providing viable, long-term financial services on a large scale. MFIs must setinterest rates that cover all administrative costs, plus thecost of capital (including inflation), loan losses, and aprovision for increasing equity. Unless MFIs do so, they mayonly operate for a limited time; reach a limited number ofclients; and will tend to be driven by donor or government
12 The cost of microfinance is higher than the cost of bank lending for various reasons. Someadministrative costs for making a loan are fixed, regardless of the size of the loan. If those costswere $10, then they would require an additional interest rate margin of 10% on a 12-month$100 loan, but only 1% on a $1,000 loan. Microfinance clients also tend to be more remotelylocated, and need MFIs to bring the services to them, adding additional transaction costs.Finally, microfinance clients tend to be poorer, with no documented credit history and unableto provide collateral, adding to the costs of screening out risky borrowers.
goals, not client needs. Only sustainable MFIs can providepermanent access to financial services to the hundreds ofmillions who need them.”13
Repayment MethodsSome 57.53% of loan products were offered with repaymentof principal and interest at loan maturity, while 41.78% ofproducts were offered with monthly payments of interest andrepayment of principal at loan maturity. Only 0.68% ofproducts were offered with weekly payments of interest andrepayment of principal at loan maturity.
13 Consultative Group to Assist the Poor (CGAP). 2002. Making Sense of Microcredit InterestRates. Donor Brief No. 6. September. (Emphasis in the original.)
Source: Rural Financial Services Survey
Figure 4.10 Effective Interest Rates in the Semiformal Sector
Mulitlateral and Bilateral Development Agencies INGOs MFIs

41
Portfolio PerformanceTable 4.6 summarizes the reported characteristics ofsemiformal sector portfolios. As of 31 December 2003, thesemiformal sector reported 12,365 outstanding borrowerswith loans outstanding of KN12 billion. This included 3,945borrowers from multilateral and bilateral agency initiatives,with loans of KN4.4 billion; 5,544 from INGO initiatives,with loans of KN5.2 billion; and 2,876 from MFIs, with loansof KN2.5 billion. Over the 12 months before the survey,11,165 new loans had been made, including 2,741 frommultilateral and bilateral agency initiatives, 4,878 fromINGO initiatives, and 3,546 from MFIs.
Figures 4.11 and 4.12 show the percentage of borrowerswith overdues as of 31 December 2003, by type ofmicrofinance project and by type of borrower.
Table 4.6 Loan Portfolio Characteristics
Characteristic Multilateral and Bilateral INGO Projects MFIs TotalDevelopment Agency Projects
Value Percent Value Percent Value Percent Value Percent
Number of Borrowers at 31 December 2003 3,945 31.90 5,544 44.84 2,876 23.26 12,365 100.00Number of New Loans in Last 12 Months 2,741 24.55 4,878 39.45 3,546 28.70 11,165 100.00Number of Borrowers with Overdue Loans 570 14.46 1,450 26.16 339 11.81 2,359 19.08Total Loans Outstanding (KN million) 4,388 36.47 5,161 42.89 2,484 20.64 12,033 100.00Total Loans Overdue (KN million) 184 4.19 514 9.97 101 4.05 799 6.64Nonperforming loan rate (percent) 4.19 9.96 4.07 6.64Average Loan Outstanding (KN) 1,112,365 931,064 864,022 973,314Estimated New Loans in Last 12 Months 3,049 28.62 4,542 42.63 3,064 28.76 10,655 100.00 (KN million)
Source: Rural Financial Services Survey
MFIs had the lowest percentage of borrowers in arrears,at 7.68%. Multilateral and bilateral development agencyprojects reported 13.71% of borrowers in arrears. INGOsreported a slightly higher percentage of borrowers in arrearsat 14.84%. When borrowers are considered by type, men’sgroups had the highest overdues, with 25% of groups inarrears. Mixed groups of men and women had the secondhighest level of arrears at 18.20%. The percentages ofwomen’s groups and men as individuals in arrears were7.75% and 6.79% respectively. The lowest overdues wereby women as individual borrowers at 3.05%. Overall thissuggests that MFIs are better at controlling default, thatindividuals are less likely to default than groups, and thatwomen are less likely to default than men when they borrowas individuals or as groups.

42
Source: Rural Financial Services Survey
Figure 4.11 Percent of Borrowers with OverduesFigure 4.13 shows the percentage of total amounts in
arrears as of 31 December 2003 by borrower type. 14
Consistent with Figure 4.12, men as individuals accountedfor the largest amounts in arrears, followed by mixed groups,men’s groups, women as individuals, and women’s groups.
Profitability of MicrofinanceOf the 33 microfinance initiatives, 13 did not provide profitand loss information for 2003 in response to the survey.Fourteen provided profit and loss information that did notreconcile; 7 provided profit and loss information thatreconciled. Overall, the information is not sufficiently reliableto draw conclusions and indicates significant weaknesses infinancial reporting in the semiformal sector generally.
14 Nonperforming loan (NPL) rates were not available from these microfinance initiatives, whichwere able to report only the amounts of the installments overdue, rather than the full amount ofthe loan overdue. As a percentage of total loans outstanding, installments overdue amounted to3.59% for multilateral and bilateral components, 8.95% for INGO components, and 2.19% forMFIs.
Figure 4.12 Percent of Borrowers with Overduesby Borrower Type
3.06
89.23
7.76
25.00
46.51
0
10
20
30
40
50
60
70
80
90
100
Women asIndividuals
Men asIndividuals
Women’sGroups
Men’sGroups
MixedGroups
Figure 4.13 Percentage of Total Amounts in Arrearsby Borrower Type
Source: Rural Financial Services Survey

43
The Informal Sector
Sector ParticipantsIn the Lao PDR, the informal sector comprises loans betweenhouseholds, informal moneylending, and lending throughthe traditional Lao houay. Additional information on theinformal sector was gathered through the questions tohouseholds on their borrowing and is reported in greaterdetail in Chapter 6. In addition, the survey collectedinformation about lending by households, and by 17moneylenders who were prepared to identify themselves andparticipate in the survey. This section concerning theinformal sector draws on all 3 sources of data.
Informal Loans by HouseholdsTable 4.7 shows the estimated total lending by ruralhouseholds in the 12 months preceding the survey,extrapolated to the entire rural population from householdsurvey data on households making loans.
The table indicates that rural households made anestimated 217,415 loans to friends and family, valued atKN407.33 billion ($38.34 million), and about 136,159 loansto others (households in the same village, other villages,and urban areas), valued at KN253.36 billion ($23.9 million)in the 12 months preceding the survey. The total estimatedvalue of loans made by households in the period is KN660.69billion ($62.2 million), dwarfing the amount loaned in the
Table 4.7 Lending by Rural Households to Friends and Family and Others
All RuralLoan Recipients House-
holds
Wealth Quartile of Lending Household
Poorest Next Next Richest25% Poorest Poorest 25%
25% 25%
Provincial Rural OtherCapital Mekong RuralPeri-Urban
Strata of Lending Household
Borrower Type (KN billion)
Family and Friends 407.33 179.61 7.28 31.79 188.65 8.35 14.93 58.75 325.31Others 253.36 100.54 3.83 45.10 103.90 14.35 5.24 56.15 177.62Total 660.69 280.15 11.10 76.89 292.54 22.70 20.17 114.90 502.93
Borrower Type (Percent by Value)
Family and Friends 61.65 64.11 65.52 41.35 64.49 36.78 74.00 51.13 64.68Others 38.35 35.89 34.48 58.65 35.51 63.22 26.00 48.87 35.32Total 100.00 100.00 100.00 100.00 100.00 100.00 100.00 100.00 100.00
Borrower Type (Number of Loans)
Family and Friends 217,415 32,304 12,252 35,723 137,136 31,343 35,934 63,283 86,854Others 136,159 23,289 6,925 31,143 74,801 20,503 19,943 30,700 65,014Total 353,574 55,593 19,178 66,866 211,937 51,846 55,877 93,983 151,869
Borrower Type (Percent by Number of Loans)
Family and Friends 61.49 58.11 63.89 53.42 64.71 60.45 64.31 67.33 57.19Others 38.51 41.89 36.11 46.58 35.29 39.55 35.69 32.67 42.81Total 100.00 100.00 100.00 100.00 100.00 100.00 100.00 100.00 100.00
Source: Rural Financial Services Survey

44
semiformal sector (KN12 billion). Overall, about 61% ofloans by value and by number were made to friends andfamily.15
As would be expected, the vast majority of lending wasdone by households in the wealthiest quartile: 76% of alllending (by volume) was done by the richest quartile, whoalso account for 43% of loans by number. Analysis by strataindicates that Other Rural households account for the vast
Table 4.8 Characteristics of Loans Made by Households
All RuralLoan Characteristic House-
holds
Wealth Quartile Results
Poorest Next Next Richest25% Poorest Poorest 25%
25% 25%
Provincial Rural OtherCapital Mekong RuralPeri-Urban
Strata Results
Loans Made in Cash by Value (KN billion) 593.46 273.60 9.08 62.68 248.10 17.47 16.37 99.62 459.99Loans Made in Kind by Value (KN billion) 67.19 6.55 2.02 14.17 44.44 5.22 3.75 15.28 42.94Loans Made in Cash by Number 259,201 51,085 16,869 45,799 145,447 33,829 44,285 70,514 110,572Loans Made in Kind by Number 96,246 4,508 3,019 20,151 68,568 18,017 11,892 23,469 42,868Loans Repayable in Cash by Value (KN billion) 607.30 255.49 9.19 73.99 268.63 14.06 17.39 111.83 460.56Loans Repayable in Kind by Value (KN billion) 53.35 24.66 1.91 2.86 23.91 8.63 2.74 3.06 42.37Loans Repayable in Cash by Number 274,844 50,960 15,271 55,109 153,887 30,724 44,530 82,435 116,140Loans Repayable in Kind by Number 80,602 4,633 4,617 10,841 60,128 21,122 11,648 11,548 37,300Loans Made in Cash by Value (%) 89.83 97.66 81.77 81.56 84.81 77.00 81.35 86.70 91.46Loans Made in Kind by Value (%) 10.17 2.34 18.23 18.44 15.19 23.00 18.65 13.30 8.54Loans Made in Cash by Number (%) 72.92 91.89 84.82 69.44 67.96 65.25 78.83 75.03 72.06Loans Made in Kind by Number (%) 27.08 8.11 15.18 30.56 32.04 34.75 21.17 24.97 27.94Loans Repayable in Cash by Value (%) 91.93 91.20 82.76 96.28 91.83 61.96 86.40 97.33 91.58Loans Repayable in Kind by Value (%) 8.07 8.80 17.24 3.72 8.17 38.04 13.60 2.67 8.42Loans Repayable in Cash by Number (%) 77.32 91.67 76.79 83.56 71.90 59.26 79.27 87.71 75.69Loans Repayable in Kind by Number (%) 22.68 8.33 23.21 16.44 28.10 40.74 20.73 12.29 24.31Loans with Written Loan Agreements (Number) 71,635 9,766 2,841 9,160 49,868 11,127 6,998 13,094 40,415Loans with Written Collateral Agreements (Number) 22,007 1,503 888 916 18,700 4,333 916 3,294 13,463Loans with Written Loan Agreements (%) 20.15 17.57 14.29 13.89 23.30 21.46 12.46 13.93 26.34Loans with Written Collateral Agreements (%) 6.19 2.70 4.46 1.39 8.74 8.36 1.63 3.51 8.77Average Loan Term (Months) 4 6 5 6 3 2 5 4 5
Source: Rural Financial Services Survey
15 The estimate for household borrowing from friends and family from rural households receivingloans in the same period is KN307.09 billion ($28.91 million). This suggests that an estimatedKN100.24 billion ($9.4 million) was being lent by rural households to friends and family innonrural households.
majority of loans by number: they account for 60% of allloans, almost certainly the result of the lack of outreach bymore formal and semiformal institutions in the remote OtherRural areas and, therefore, the need to rely on informal inter-household loans. Other Rural areas also account for 44% ofinter-household lending by volume.
Table 4.8 summarizes other key facts about loans madeby rural households in the 12 months preceding the survey.
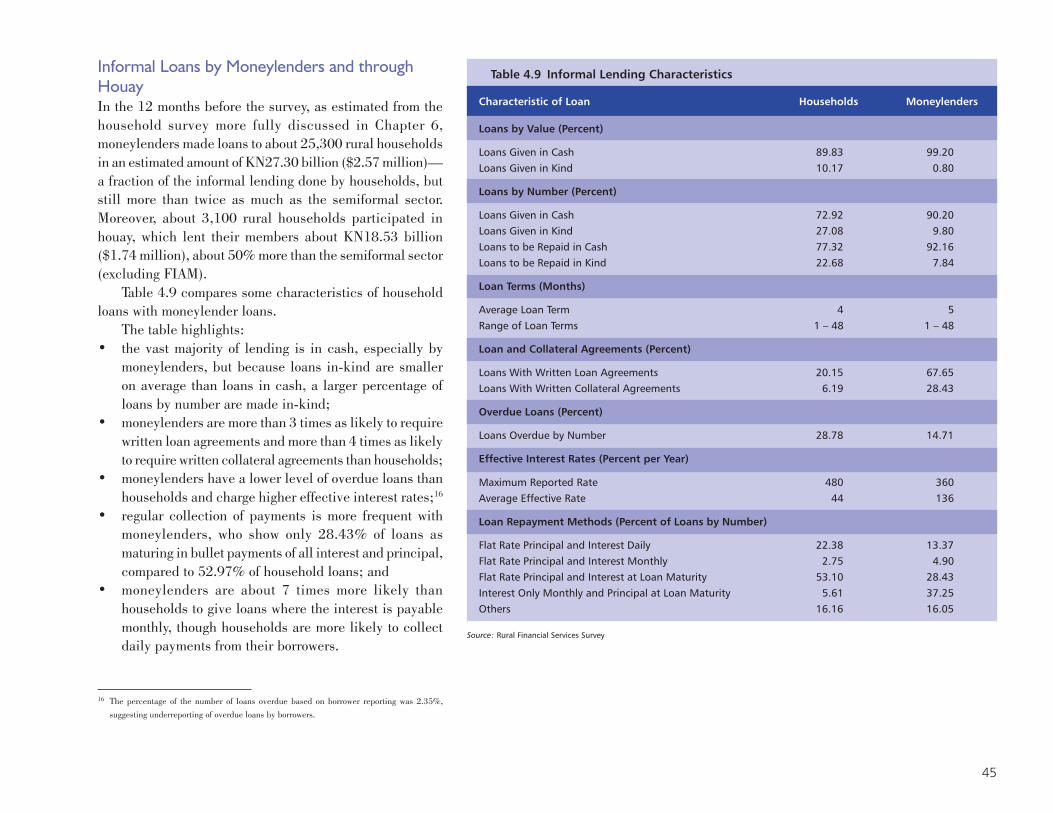
45
Informal Loans by Moneylenders and throughHouayIn the 12 months before the survey, as estimated from thehousehold survey more fully discussed in Chapter 6,moneylenders made loans to about 25,300 rural householdsin an estimated amount of KN27.30 billion ($2.57 million)—a fraction of the informal lending done by households, butstill more than twice as much as the semiformal sector.Moreover, about 3,100 rural households participated inhouay, which lent their members about KN18.53 billion($1.74 million), about 50% more than the semiformal sector(excluding FIAM).
Table 4.9 compares some characteristics of householdloans with moneylender loans.
The table highlights:• the vast majority of lending is in cash, especially by
moneylenders, but because loans in-kind are smalleron average than loans in cash, a larger percentage ofloans by number are made in-kind;
• moneylenders are more than 3 times as likely to requirewritten loan agreements and more than 4 times as likelyto require written collateral agreements than households;
• moneylenders have a lower level of overdue loans thanhouseholds and charge higher effective interest rates;16
• regular collection of payments is more frequent withmoneylenders, who show only 28.43% of loans asmaturing in bullet payments of all interest and principal,compared to 52.97% of household loans; and
• moneylenders are about 7 times more likely thanhouseholds to give loans where the interest is payablemonthly, though households are more likely to collectdaily payments from their borrowers.
Table 4.9 Informal Lending Characteristics
Characteristic of Loan Households Moneylenders
Loans by Value (Percent)
Loans Given in Cash 89.83 99.20Loans Given in Kind 10.17 0.80
Loans by Number (Percent)
Loans Given in Cash 72.92 90.20Loans Given in Kind 27.08 9.80Loans to be Repaid in Cash 77.32 92.16Loans to be Repaid in Kind 22.68 7.84
Loan Terms (Months)
Average Loan Term 4 5Range of Loan Terms 1 – 48 1 – 48
Loan and Collateral Agreements (Percent)
Loans With Written Loan Agreements 20.15 67.65Loans With Written Collateral Agreements 6.19 28.43
Overdue Loans (Percent)
Loans Overdue by Number 28.78 14.71
Effective Interest Rates (Percent per Year)
Maximum Reported Rate 480 360Average Effective Rate 44 136
Loan Repayment Methods (Percent of Loans by Number)
Flat Rate Principal and Interest Daily 22.38 13.37Flat Rate Principal and Interest Monthly 2.75 4.90Flat Rate Principal and Interest at Loan Maturity 53.10 28.43Interest Only Monthly and Principal at Loan Maturity 5.61 37.25Others 16.16 16.05
Source: Rural Financial Services Survey
16 The percentage of the number of loans overdue based on borrower reporting was 2.35%,suggesting underreporting of overdue loans by borrowers.
46
Chapter 5Household Savings
It is commonly believed that many ruralhouseholds in less developed countries,including the Lao PDR, are too poor to save.However, a considerable amount ofresearch disproves this view.1 In fact, thepoor save constantly. However, most ruralhouseholds in less developed countries,especially poor households, do not haveready access to savings facilities in banksor other formal financial institutions.Instead, they use alternative, informalvehicles for their savings, such as livestock,gold and other precious metals, jewelry, andhousing materials or other stocks ofphysical goods. They also maintain cashat home, or may deposit savings with afriend, family member, or moneylender. Orthey may participate in rotating savings andcredit associations with trusted familymembers or neighbors. Many of these
informal savings mechanisms involve high risk and hightransaction costs, resulting in savings that are not easilyturned into ready cash. For example, livestock may die andlose its value. If a household needs only $50, it may be
required to sell a water buffalo for $400, and it may taketime to find a buyer.
Much of the focus of governments in the past 50 yearshas been on delivering credit to rural households. However,experience has shown that households often value theavailability of appropriate deposit services as much as, andsometimes more than, access to credit. Poor rural households,as do most households, value deposit services that are secure,have low transaction costs, and are appropriate to their needs(e.g., allowing for small deposits and quick withdrawals whennecessary). Although these households prefer making apositive real return on their savings, they will accept smallnegative real returns in return for these other characteristics.
This chapter, therefore, presents survey results regardingsavings behavior and preferences of Lao rural householdsas well as the savings vehicles available to them.
The Volume of Cash SavingsTable 5.1 shows that, extrapolating from the survey sampleto the population, rural households in the Lao PDR in early2004 held an estimated KN2,290.28 billion ($215.62million) in cash2 savings. Almost 90% of rural householdsreported holding some cash savings. Cash in hand was mostfrequently reported, with some amount held by 89% ofsurveyed households, although it represented only 39.75%
1 E.g., Rutherford, Stuart. 2000. The Poor and Their Money. New Delhi: Oxford University Press;and Robinson, Marguerite. 2001. Savings and the New Microfinance, in The MicrofinanceRevolution. World Bank. Washington, DC. This section also draws on CGAP. 2002. SavingsAre As Important As Credit: Deposit Services For the Poor. Donor Brief No. 4. June.
2 “Cash” means cash in bank or other formal or semiformal financialinstitution or cash in hand.
Collecting savings at a villagesavings and credit group

47
3 Rotating savings and credit associations, known in the Lao PDR as houay are commonly observedthroughout the world, primarily but not exclusively in less developed countries. In a houay,members make a regular contribution to a fund, which is withdrawn for use by one member. Forexample, 12 members may contribute KN100,000 each month, with one of these memberswithdrawing this money (KN1.2 million) for use. Members who withdraw money early in ahouay cycle are effectively net borrowers, while members who withdraw money late in the cycleare effectively net savers. Many variations of this basic model exist, including bidding on thefund and gradually increasing the amount paid into the fund during the cycle to ensure thatsavers receive a positive rate of return.
4 See Chapter 3 for further details of the supply of formal sector financial services.
• The richest quartile of households account for 81.30%(KN1,862 billion) of the cash savings held in banks,while the poorest quartile of households account for only2.10% (KN48.4 billion) of such cash savings;
• Only 13.8% of households in the richest quartile and1.5% of households in the poorest quartile maintainany savings in the banking system; and
• Savings mobilization by semiformal and informal MFIs(including houay) at the grassroots level is only KN55.6billion, reflecting the low level of intermediation by theseorganizations.
The results suggest the potential to reduce the amount ofcash savings held as cash in-hand by rural households andincrease the levels of savings in licensed financialinstitutions if they can be more widely established.
Table 5.2 shows the distribution of cash savings bysurvey stratum and wealth quartile. The table illustratesthe marked differences between Peri-urban households withaverage cash savings of KN8.24 million, being:• 4.03 times the average cash savings of Provincial Capital
households;
of cash savings. Bank deposits represented the largestamount, at 55% of cash savings, but was held by less than5% of rural households, suggesting a very low level ofoutreach by the Lao banking sector (including APB) in ruralareas.
Of the balance, KN44.07 billion or 1.93% was held inrotating savings and credit associations (known as houay inthe Lao PDR),3 while smaller amounts of KN10.62 billionor 0.47%, and KN0.91 billion or 0.04% were saved in VSCGsand SCUs respectively.
Total estimated savings in the banking system fromrural households in early 2004 was KN1,254.37 billion.BOL reported that the total savings in the banking systemat 31 December 2003 was KN4,023.78 billion.4 Hence, anestimated 31.2% of savings in the banking system comesfrom rural households.
Figure 5.1 shows total national cash savings for all ruralhouseholds, as well as savings of the poorest and richestquartiles. Figure 5.2 shows the percentages of householdswith cash savings of a particular type for all rural householdsand the poorest and richest households.The figures illustrate that:• Banks hold 54.78% of rural households’ cash savings
(KN1,254 billion), with a further 39.76% (KN910billion) being held as cash in hand and the balance of5.46% (KN125 billion) being held in houays, VSGCs,SCUs, and other ways.
31.2% of savings in thebanking system comesfrom rural households.Only 13.8% ofhouseholds in the richestquartile and 1.5% ofhouseholds in thepoorest quartile maintainany savings in thebanking system.
Table 5.1 Household Cash Savings
Categoryof Percentage Cash Savings Cash Savings Percentage Average AverageSavings with Cash by Rural in Rural of Cash Cash Savings Cash Savings
Savings in Households Areas Savings Per Household PerCategory (KN billion) ($ million) (KN thousand) Household($)
Cash in Hand 88.98 910.72 85.74 39.76 1,002.10 94.34Current Account 0.19 1.66 0.16 0.07 1.83 0.17Savings Account 2.31 284.04 26.74 12.40 312.54 29.42Deposit Account 2.45 968.67 91.19 42.29 1,065.86 100.34Houay 2.02 44.07 4.15 1.93 48.49 4.57VSCG 3.76 10.62 1.00 0.47 11.69 1.10SCU 0.51 0.91 0.09 0.04 0.999 0.09Other 1.15 69.59 6.55 3.04 76.57 7.21Total 89.81 2,290.28 215.62 100.00 2,520.08 237.25

48
Source: Household survey.
Figure 5.1 Total National Cash Savings Figure 5.2 Percent of Households with Cash Savings Types
Table 5.2 Average Household Cash Savings by Stratum and Wealth Quartile (KN Million)
Cash 1.00 1.28 0.96 0.62 1.19 0.17 0.40 0.99 2.45Current Bank Account 0.002 0.00 0.03 0.00 0.00 0 0.00 0.00 0.01Savings Account 0.31 1.34 0.22 0.03 0.1 0 0.03 0.02 1.20Term Deposits 1.07 5.14 0.25 0.03 0.19 0.04 0.001 0.15 4.08Houay 0.05 0.16 0.06 0.03 0.02 0 0.02 0.02 0.15VSCG 0.01 0.05 0.04 0.00 0.001 0 0.02 0.01 0.02SCU 0.001 0.003 0.00 0.00 0.001 0 0.002 0.00 0.002Other 0.08 0.27 0.47 0.005 0.003 0 0.01 0.004 0.30Total Savings 2.52 8.24 2.04 0.71 1.50 0.21 0.48 1.19 8.21
Source: Household survey
RuralSavings Type Household
Average
Wealth Quartile Results
Poorest 2nd 3rd RichestQuartile Quartile Quartile Quartile
Provincial Rural OtherCapital Mekong Rural
Peri-Urban
Strata Results

49
• 11.67 times the average cash savings of Rural Mekonghouseholds; and
• 5.48 times the average cash savings of Other Ruralhouseholds.These variations are even more marked when savings
are examined by wealth group. The poorest 25% ofhouseholds had average cash savings of just KN213,000,compared to the richest 25% who had on average 38.58times as much cash savings (KN8.21 million). The findingsalso reconfirm that Peri-urban and richer households aremore likely to save in banks, while few of the poorest 25%of households hold savings in banks, or even in houay,VSCGs, and SCUs.
The Volume of Non-cash SavingsAs discussed in the introduction to this chapter, ruralhouseholds often save informally using in-kind savingsvehicles such as livestock, gold, jewelry, or stocks of housingmaterials. Figure 5.3 shows total noncash national savingsfor all rural households in the Lao PDR, as well as the poorestand richest quartiles. Figure 5.4 shows percentages ofhouseholds with non-cash savings of a particular type forall rural households and the poorest and richest households.The figures illustrate that:• Livestock is the most common means of non-cash
savings in Lao rural households, used by 98.2% of ruralhouseholds and accounting for KN4,268 billionnationally;
• Livestock as a means of savings is more important forhouseholds in the poorest quartile where it accounts for77.09% of non-cash savings, compared to 56.90% of non-cash savings in the richest quartile; and
• Precious metals and jewelry are the second most commonmeans of savings for households in the richest quartile(with 60.8% of households reporting savings in this
Source: Household survey.
Figure 5.3 Total National Non-Cash Savings
Figure 5.4 Households with Non-cash Savings Types

50
Table 5.3 Average Household Non-cash Savings by Stratum and Wealth Quartile (KN Million)
Precious Metals and Jewelry 1.47 2.43 1.26 0.58 1.78 0.04 0.39 1.08 4.37Livestock 4.70 2.16 4.65 5.24 5.38 2.10 3.38 5.46 7.86Housing Materials 0.76 1.06 0.57 0.65 0.72 0.14 0.50 0.80 1.58Total Non-cash Savings 6.92 5.65 6.48 6.47 7.88 2.28 4.27 7.35 13.81
Source: Household survey
RuralSavings Type Household
Average
Wealth Quartile Results
Poorest 2nd 3rd RichestQuartile Quartile Quartile Quartile
Provincial Rural OtherCapital Mekong Rural
Peri-Urban
Strata Results
form), while housing materials were the second mostcommon form of savings for poorest quartile householdswith 20.4% of households holding such savings.
Table 5.3 illustrates how non-cash savings are held inthe most prevalent forms of precious metals and jewelry,livestock, and housing materials, by survey stratum and bywealth quartile.
Differences in non-cash savings across strata are lesspronounced than differences across wealth quartiles. OtherRural households hold, on average, the greatest amount,primarily in the form of livestock. Peri-urban householdshold proportionately more precious metals and jewelry andless livestock. Households in the richest quartile held onaverage 6.05 times the value of non-cash savings held byhouseholds in the poorest quartile.
Comparing Cash and Non-cash SavingsA comparison of the savings reported above indicates thattotal non-cash savings (KN6,291.7 billion) of ruralhouseholds nationwide exceed cash savings (KN2,290.3billion) by a factor of 2.75; i.e., non-cash savings accountfor 73.3% of total rural savings in the Lao PDR. Figure 5.5illustrates the importance of non-cash savings in the Lao
Non-cash savingsaccount for 73.3% of
total rural savings. Forthe poorest quartile ofhouseholds, non-cash
savings constitute91.48% of total savings
PDR across all strata and all wealth groups, especially forthe poor and most remote households.
For example, for the poorest quartile of households, non-cash savings constitute 91.48% of total savings; for thesecond poorest quartile, 89.85% of savings, for the secondrichest quartile, 86.08%; and for the richest quartile,
Figure 5.5 Households Average Cash and Non-cashSavings by Stratum and Wealth Quartile
Source: Household survey.

51
for them. In the case of SCUs, this low preference is likelydue to the lack of familiarity with this model, as only a smallhandful of SCUs exist in the Lao PDR. By comparison,VSCGs have been widely established and are a familiarmodel. 5 However, there appears to be little preference forthem. A much stronger preference was expressed for simplykeeping cash in hand as a savings vehicle: 14.62% expresseda first preference for this, and 49.36% expressed somepreference for this.
Among non-cash alternatives, livestock is clearly themost preferred vehicle for savings, with preferences on thesame order as that for banks. More than a quarter of allhouseholds (27.97%) stated that livestock was their first
Table 5.4 Households Savings Preferences
Type of Savings Percent with Percent with Percent with TotalVehicle 1st Preference 2nd Preference 3rd Preference (Percent with 1st,
2nd, or 3rd Preference)
Cash in Hand 14.62 17.22 17.52 49.36APB 12.43 10.04 5.16 27.63Other Bank 17.29 10.13 8.18 35.60Houay 0.75 0.81 0.66 2.22VSCG 0.17 0.44 0.17 0.78SCU 1.13 1.62 1.34 4.09Precious Metals and Jewellery 3.33 7.04 6.50 16.87Livestock 27.97 19.90 8.73 56.60Housing Materials 8.55 7.96 6.17 22.68Other 12.86 14.10 5.34 32.30Total 99.11 89.26 59.76 99.11
62.71%. Similarly, for Other Rural households, non-cashsavings comprise 84.00% of total savings; for Rural Mekonghouseholds, it comprises 90.17% of total savings; forProvincial Capital and Peri-urban households, non-cashsavings comprise 76.02% and 40.68%, respectively, of totalsavings. As shown in Table 5.3, the importance of livestockacross all groups is evident, though it declines with wealthin favor of precious metals and jewelry.
Savings Vehicle PreferencesAlthough household preferences are revealed to some extentby actual practices illustrated above, underlying preferencesfor various savings vehicles may differ from practicedepending on the availability of options. For example, thefrequent use of livestock (by 98% of households) as a savingsvehicle may reflect the dearth of other options rather than apreference for saving this way.
Table 5.4 shows the preferences of rural households fordifferent types of cash savings. In the survey, 99.11% ofhouseholds expressed a first preference, 89.26% expresseda second preference, and 59.76% expressed a thirdpreference.
Almost 30% of households said their first preferencewas to save in APB or another bank (12.43% in APB and17.29% in another bank). Some 27.63% expressed somepreference (first, second, or third) for APB, while 35.6%expressed some preference for other banks. It will be recalledfrom Table 5.1 that less than 5% of households actually havesavings in any bank, suggesting a large unmet demand forformal savings services in rural Lao PDR, and a largepotential market for the banks.
In contrast, little preference was expressed for informaland semiformal facilities for cash savings: collectively, only2.05% of households expressed a first preference for houay,VSCGs, or SCUs, and only 7.09% expressed any preference
Despite APB’s extensivebranch network, it is lesspreferred as a savingsvehicle when comparedto other commercialbanks, cash in hand, orlivestock
5 Some figures are conflicting. The UNDP/UNCDF survey in 1996 reported 1,650 village creditassociations established in Lao PDR, often with the assistance of international donors and/orLWU. In the present survey, international donors reported that they helped establish additionalvillage-based schemes in 580 villages. So, at a minimum, it would appear that some 2,230schemes have been created, though it is unclear how many are still operating. Moreover, not allare VSCGs (which accept deposits)—many are less sustainable village revolving funds (VRFs)that do not accept deposits and have been frequently decapitalizaed. See Chapter 4 for a moredetailed discussion of the supply of financial services by semiformal institutions.

52
preference for savings, and 56.6% expressed somepreference for this savings method. A further 8.55%expressed a first preference for saving in housing materials,while 22.68% expressed some preference for this savingsvehicle; and 3.33% expressed a first preference for preciousmetals and jewelry, while 16.87% expressed some preferenceof this method.
Traditional non-cash methods of savings continue to bethe first preference of about half of Lao rural households,and despite APB’s extensive branch network, it is lesspreferred as a savings vehicle when compared to othercommercial banks, cash in hand, or livestock. This providessome evidence of the limited success of APB in providingsavings services that rural households value.
Figure 5.6 and Table 5.5 break down rural households’first savings preferences by stratum and wealth quartile.The evident pattern is a more frequent preference for noncashinstruments (especially livestock) as savings vehiclesamongst the poorer and more remote households, and a
Source: Household survey.
All Rural Households Poorest Quartile Richest Quartile
Figure 5.6 Households’ First Preferences for Type of Savings
A village house in rural Champusak Province

53
Table 5.5 Households’ First Preferences for Type of Savings by Strata and Wealth Group (% of Households)
Cash 14.62 14.16 14.45 14.11 15.24 16.30 15.86 11.90 14.43APB 12.43 15.93 15.23 7.51 14.44 10.29 12.32 15.69 11.42Other Commercial Bank 17.29 21.24 23.05 16.52 15.51 7.31 10.92 20.61 30.36Houay 0.75 2.21 0.78 0.90 0.00 0.33 0.41 0.08 2.21SCU 0.17 0.00 1.17 0.00 0.27 0.46 0.08 0.16 0.00VSCG 1.13 3.98 3.13 0.00 0.53 0.87 1.43 0.41 1.81Precious Metals and Jewelry 3.33 8.41 1.56 3.30 1.34 1.47 2.64 3.45 5.76Livestock 27.97 17.70 18.75 24.02 36.63 36.26 34.44 25.01 16.14Housing Materials 8.55 5.75 14.06 12.01 6.42 13.03 7.59 8.54 5.04Other 12.86 10.62 7.03 20.12 8.82 12.35 13.46 13.75 11.88Total Households Expressing a First Preference 99.11 100.00 99.22 98.50 99.20 98.66 99.14 99.60 99.06
Source: Household survey
AllSavings Type Rural
Household
Wealth Quartile Results
Poorest 2nd 3rd RichestQuartile Quartile Quartile Quartile
Provincial Rural OtherCapital Mekong Rural
Peri-Urban
Strata Results
greater preference for APB and other commercial banksamongst richer and less remote households. While only17.60% of the poorest quartile expressed a first preferencefor APB or other commercial banks as a savings vehicle,41.78% of the richest quartile expressed a first preferencefor saving in the banking system. However, 30.36% of therichest quartile preferred other commercial banks and only11.42% preferred APB.
Across the strata, it is noteworthy that Rural Mekonghouseholds were least likely to express a first preference forAPB—only 7.5% compared to 14–15% of households inthe other strata. As APB’s traditional mandate has been toserve rice farmers who are primarily located in the RuralMekong area, this result should give pause to policy makersregarding the success of APB in fulfilling its mandate.
A micro-entrepreneur in Saravan Province.

54
Table 5.6 Important Characteristics of Different Types of Savings (Percentage of households mentioning characteristics)
Ability to retain or increase in value 74.41 66.37 75.00 66.97 83.69 73.67 72.37 78.19 73.39Liquidity (ease of access to or conversion into cash) 59.62 65.49 64.84 57.96 57.75 54.13 59.01 62.33 63.02Safety (low risk of loss) 43.82 47.35 44.53 36.94 47.59 33.07 39.60 46.22 56.40Short distance / short time taken to savings location 10.04 7.52 14.45 4.50 14.97 7.57 5.35 13.75 13.50Simple savings procedures (low amount of paperwork) 3.16 6.64 5.47 1.50 2.67 2.56 2.34 4.13 3.60Ability to deposit small amounts 3.74 5.75 3.52 0.60 5.35 3.35 3.41 2.57 5.63Friendliness of savings institution staff 0.88 0.88 3.13 0.30 1.07 0.73 0.87 1.23 0.69
Source: Household survey
AllSavings Type Rural
Household
Wealth Quartile Results
Poorest 2nd 3rd RichestQuartile Quartile Quartile Quartile
Provincial Rural OtherCapital Mekong Rural
Peri-Urban
Strata Results
Savings Characteristic PreferencesIn the survey, rural households were asked to state whatcharacteristics were important to them when choosing howto save. (Households were not asked to rank characteristicsor express them in any order of preference) Figure 5.7 andTable 5.6 show the characteristics that rural householdsconsidered important in choosing how to save.Consistently,across all wealth groups, the ability to retain or increase invalue was the most frequently cited characteristic in choosinga savings product. Almost three quarters of households saidthis was an important factor in choosing a savings product.Liquidity and low risk of loss were also very important factors.Other factors were of much less importance across all strataand wealth quartiles.
Figure 5.7 Percentage of Households Indicating a SavingsCharacteristic is Important
Source: Household survey.

55
Chapter 6Household Borrowing
One cause of poverty in less developed countries is the lackof access to credit, especially among rural households. Thepoor often find themselves in a vicious cycle: producing ata subsistence level makes it difficult to accumulate savingsor other assets, thus making it difficult either to invest anysurplus or to gain access to credit in formal financial markets,which leads to low productivity and continued poverty.
In many less developed countries, local moneylendersare a principal source of credit to rural households. However,moneylenders often charge annual interest rates of more than100%. Given that interest rates in most formal credit marketsare in the range of 10–24%, many potentially profitableprojects are not undertaken in rural areas of less developedcountries. Hence, finding ways to reduce delivery costs toprovide sustainable credit to the poor should lead toincreases in income and equity.
Commercial banks generally do not cater to the needsof the rural poor. The projects that most rural poor wouldundertake are small scale, requiring small loans. Therefore,the costs of obtaining the information necessary to selectborrowers, evaluate their creditworthiness, monitor the useof the loans, and enforce repayment outweigh the potentialprofits to most lending institutions. Hence, government-ledefforts to deliver formal credit to rural areas have oftenincluded setting up special agricultural banks to lend torural borrowers. This has also been the case in the Lao PDR.However, such efforts have generally failed because suchbanks typically fail to enforce repayment of loans, and
1 This introduction draws on B. E. Coleman, “The Impactof Group Lending in Northeast Thailand,” Journal ofDevelopment Economics, October 1999.
because subsidized interest rates and incentives to maximizethe amount loaned have resulted in lending primarily to therelatively wealthy and politically connected, rather than tothe poor.1
This chapter examines household borrowing in the LaoPDR, by lending source, by loan purpose, by strata, and bywealth quartile. It also examines household preferences forlending sources and for loancharacteristics, and estimatesunsatisfied demand for credit.
Household BorrowingAs noted in Chapter 3, the Laofinancial sector (as is the case in thefinancial sectors of most developingcountries) can be divided into theformal sector, semiformal sector, andinformal sector. Generally speaking,loans from the formal sector tend tobe larger and carry lower interestrates, while semiformal and informalloans will be smaller and often carryhigher interest rates, though theremay be individual exceptions (e.g.,
Demand for microenterprise financing is high

56
loans between family members and friends may be interestfree). It is typically a goal of financial sector developmentto expand the outreach of the formal sector as much asfeasible.
Table 6.1 shows comparisons between households thatborrowed in the formal and informal sectors.The table highlights:• 35.89% of financial managers who borrowed in the
formal sector had a secondary education or higher,compared to 30.00% who borrowed in the semiformalsector and 24.29% who borrowed in the informalsector—i.e., higher education level is correlated withgreater access to formal sector loans;
• households who borrowed in the formal sector wereslightly more likely to be engaged in industry or servicesas their primary activity than households who borrowedin the semiformal and informal sectors;
• conversely, households who borrowed in the semiformaland informal sectors were more likely to be engaged inagriculture as their primary activity, although even66.67% of formal sector borrowers also engage inagriculture as their primary activity; and
• households that borrowed in the formal sector hadaverage assets of KN105.42 million, about three timesas much as households borrowing in the semiformal andinformal sectors.
These findings indicate that the formal financial sectortends to favor relatively wealthy households, while poorerhouseholds are more dependent on the informal sector.
Overall, about 40% of all rural households had borrowedin the 12 months before the survey, including 41.0% of allhouseholds with male financial managers and 37.2% of allhouseholds with female financial managers. Among borrowinghouseholds, 9.4% of households with female financialmanagers accessed formal sector borrowing compared to 6.0%of the households with male financial managers. At the sametime, 35% of households with male financial managers and27.9% of households with female financial managers borrowedin the informal sector. Hence, contrary to the experience inmany other countries, households with female financialmanagers (40% of all surveyed households) in the Lao PDRtend to have slightly greater access to the formal financialsector than households with male financial managers. Thisshould not be unexpected, however, given the matriarchaltradition among the Lao Loum ethnic group, the most populousin the country.2
2 Further analysis, broken down by ethnic group, would presumably indicate greater access bymen in patriarchal ethnic groups, but this analysis has not been done on the current data set.
Table 6.1 Comparative Characteristics of Household Financial Managers andHouseholds that had Borrowed in the Formal or Informal Sectors
Characteristics of Households Formal Semi-formal Informal RuralSector Sector Sector Households
Borrowers Borrowers Borrowers as a Whole
Financial Manager with Secondary or Higher Education (%) 35.89 30.00 24.29 24.99Agriculture as Primary Household Activity (%) 66.67 80.00 72.42 80.60Industry as Primary Household Activity (%) 2.56 0.00 1.16 2.43Services as Primary Household Activity (%) 2.56 0.00 0.09 1.26Average Household Assets (KN Million) 105.42 33.43 37.33 54.57
Source: Household survey.
The formal financialsector tends to favor
relatively wealthyhouseholds, while poorer
households are moredependent on the
informal sector.

57
Volume and Source of BorrowingTable 6.2 and Figure 6.1 illustrate the total estimated numberof households borrowing from formal, semiformal, andinformal sources for rural households during the 12 monthspreceding the survey.
Overall, 40% of rural households borrowed in the 12months before the survey. The formal sector made loans toless than 3% of rural households, while the semiformal sectorreached 4% of rural households. In contrast, informal sourcesmade loans to 33% of rural households. The poorest twoquartiles relied on informal sources markedly more thanthe richest two quartiles; while the richest two quartiles hadgreater access to formal sources.
Table 6.3 shows that, extrapolating from the surveysample to the population, rural households had borrowedan estimated KN636.82 billion ($59.95 million) in the 12months preceding the survey.
Borrowing from family and friends was the most common.Some 25.05% of households borrowed from friends or familyin the preceding 12 months, in an amount equal to KN307billion when extrapolating to the rural population of the LaoPDR. The average original loan size was KN1.38 million($130). Friends and family accounted for 48.22% of loansby value.
Table 6.2 Estimated Number of Households Borrowing by Sector in the 12 Months Preceding the Survey
All RuralBorrowing Source House-
holds
Wealth Quartile Results
Poorest Next Next Richest25% Poorest Poorest 25%
25% 25%
Provincial Rural OtherCapital Mekong RuralPeri-Urban
Strata Results
All Sources 365,869 76,628 15,981 123,656 149,603 103,631 112,338 79,318 70,582Formal Sector 26,895 8,264 1,953 7,328 9,350 4,373 2,596 7,435 12,491Semiformal Sector 36,561 6,761 2,308 11,908 15,584 9,172 13,093 5,987 8,310Informal Sector 302,413 61,603 11,720 104,421 124,669 90,086 96,649 65,896 49,781
Source: Household survey.
Supplier credit was the nextcommon means of financing, withloans taken by 6.14% of house-holds, with estimated overallborrowing in the previous 12months being KN134.81 billion.The average original loan size fromsuppliers was KN3.76 million($354).
The third most common meansof financing, in terms of the numberof households borrowing, wasVRFs. An estimated 19,812 or2.18% of rural householdsborrowed from VRFs in the 12months preceding the survey. Theaverage original loan size wasKN612,000 (about $58).
APB was the fourth most common means of financing,reaching an estimated 18,267 rural households, or 2.01%of all rural households in the 12 months preceding the survey.It is noteworthy that APB reports about 87,000 totalborrowers in the Lao PDR. The survey findings indicatethat only about 18,267 of these borrowers (or about 21% of
Figure 6.1 Estimated Number of HouseholdsBorrowing by Sector in the 12 MonthsPreceding the Survey
Source: Household survey.
Friends and familyaccounted for 48.22% ofloans by value.
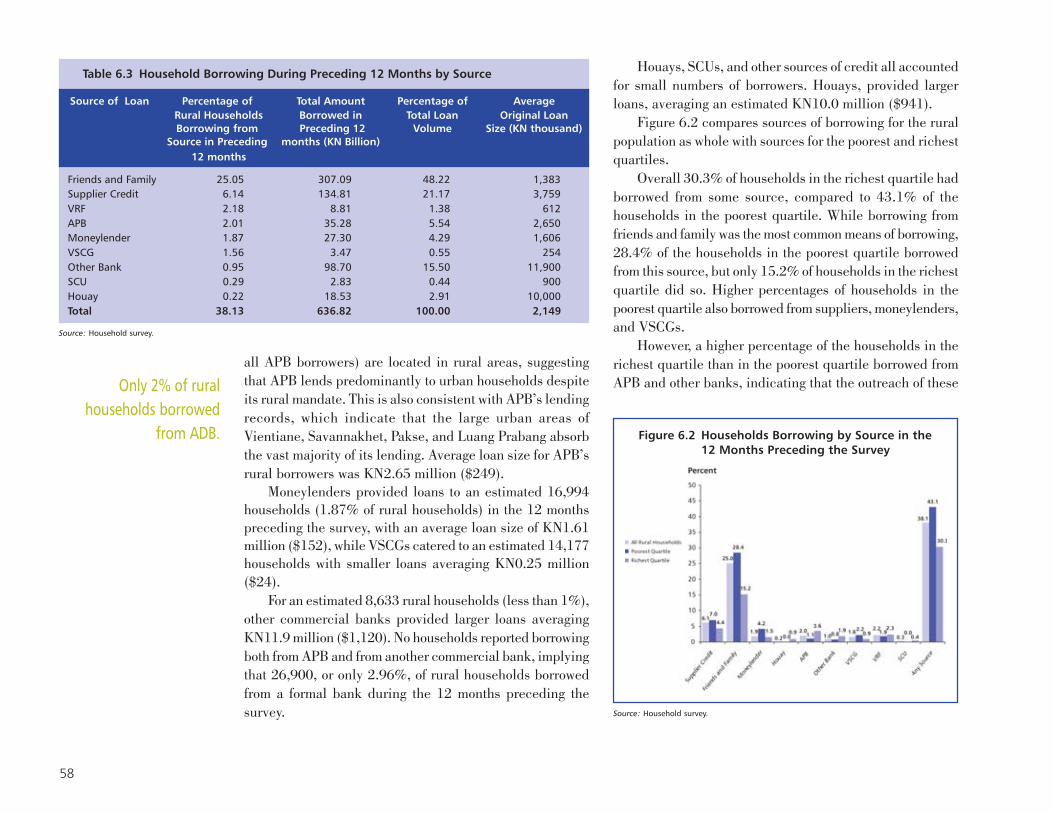
58
Houays, SCUs, and other sources of credit all accountedfor small numbers of borrowers. Houays, provided largerloans, averaging an estimated KN10.0 million ($941).
Figure 6.2 compares sources of borrowing for the ruralpopulation as whole with sources for the poorest and richestquartiles.
Overall 30.3% of households in the richest quartile hadborrowed from some source, compared to 43.1% of thehouseholds in the poorest quartile. While borrowing fromfriends and family was the most common means of borrowing,28.4% of the households in the poorest quartile borrowedfrom this source, but only 15.2% of households in the richestquartile did so. Higher percentages of households in thepoorest quartile also borrowed from suppliers, moneylenders,and VSCGs.
However, a higher percentage of the households in therichest quartile than in the poorest quartile borrowed fromAPB and other banks, indicating that the outreach of these
Figure 6.2 Households Borrowing by Source in the12 Months Preceding the Survey
Source: Household survey.
Table 6.3 Household Borrowing During Preceding 12 Months by Source
Source of Loan Percentage of Total Amount Percentage of Average Rural Households Borrowed in Total Loan Original LoanBorrowing from Preceding 12 Volume Size (KN thousand)
Source in Preceding months (KN Billion) 12 months
Friends and Family 25.05 307.09 48.22 1,383Supplier Credit 6.14 134.81 21.17 3,759VRF 2.18 8.81 1.38 612APB 2.01 35.28 5.54 2,650Moneylender 1.87 27.30 4.29 1,606VSCG 1.56 3.47 0.55 254Other Bank 0.95 98.70 15.50 11,900SCU 0.29 2.83 0.44 900Houay 0.22 18.53 2.91 10,000Total 38.13 636.82 100.00 2,149
Source: Household survey.
all APB borrowers) are located in rural areas, suggestingthat APB lends predominantly to urban households despiteits rural mandate. This is also consistent with APB’s lendingrecords, which indicate that the large urban areas ofVientiane, Savannakhet, Pakse, and Luang Prabang absorbthe vast majority of its lending. Average loan size for APB’srural borrowers was KN2.65 million ($249).
Moneylenders provided loans to an estimated 16,994households (1.87% of rural households) in the 12 monthspreceding the survey, with an average loan size of KN1.61million ($152), while VSCGs catered to an estimated 14,177households with smaller loans averaging KN0.25 million($24).
For an estimated 8,633 rural households (less than 1%),other commercial banks provided larger loans averagingKN11.9 million ($1,120). No households reported borrowingboth from APB and from another commercial bank, implyingthat 26,900, or only 2.96%, of rural households borrowedfrom a formal bank during the 12 months preceding thesurvey.
Only 2% of ruralhouseholds borrowed
from ADB.

59
formal sources is more often to the richest than the poorest.Specifically, 5.5% of households in the richest quartileborrowed from a bank, while only 1.9% of households inthe poorest quartile did so. and despite APB’s mandate toprovide subsidized loans to the poor, its richest-quartileclients outnumbered its poorest-quartile clients by more than3 to 1. However, outreach of APB and other banks wasextremely low to all rural households and all quartiles.
Table 6.4 shows average household borrowing by sourcein the 12 months preceding the survey by stratum and wealthquartile.
The table illustrates the marked differences betweenPeri-Urban households with average borrowing of KN1.71million ($161) and other households on average, being: 1.60times the average borrowings of Provincial Capitalhouseholds; 5.12 times the average borrowings of RuralMekong households; and 3.41 times the average borrowingsof Other Rural households. The difference comes almost
entirely from borrowing from friends and family. Householdsin the Provincial Capital stratum also borrow markedly morethan all other households from both APB and other banks.
The variations are more marked when borrowings areexamined by wealth group, and these differences are broughtout in Figure 6.3, which compares the richest and poorestquartiles. Households in the poorest quartile borrowed justKN126,620 ($12) on average, compared to the richestquartile which borrowed KN2.15 million ($202) on average(some 17 times as much as the poorest households). In termsof access to the formal sector, households in the richestquartile borrowed 33.6 times as much as households in thepoorest quartile from banks. This included 12.6 times asmuch from APB.
Figure 6.4 shows the composition of total borrowing byvalue in the 12 months preceding the survey for ruralhouseholds as a whole and for the richest and poorestquartiles. The figure shows the greater access of the richest
Table 6.4 Average Household Borrowing by Source in the 12 Months Preceding the Survey (KN Thousand)
Supplier Credit 148.34 328.87 505.90 42.10 111.02 19.03 69.92 26.26 478.95Friends and Family 337.91 1,126.40 91.04 189.34 138.87 78.83 148.93 205.33 919.86Moneylender 30.03 146.44 14.11 2.70 2.49 7.19 2.81 1.03 109.28Houay 20.39 35.40 46.88 0.00 26.74 0.00 0.00 0.00 81.70Pawnshop 0.00 0.00 0.00 0.00 0.00 0.00 0.00 0.00 0.00APB 38.82 42.88 162.89 8.59 46.26 9.56 5.67 19.33 120.89Other Commercial Bank 108.60 20.80 207.03 64.86 169.79 6.44 0.00 12.46 416.19VSCG 3.81 7.52 3.13 2.67 3.17 2.93 6.06 2.54 3.74VRF 9.70 2.65 36.91 16.85 3.97 2.64 7.37 11.83 16.95SCU 3.11 2.65 1.95 7.51 0.00 0.00 0.33 10.06 2.05
All Sources 700.71 1,713.62 1,069.84 334.62 502.30 126.62 241.10 288.86 2,149.61
Source: Household survey
RuralBorrowing Source Household
Average
Wealth Quartile Results
Poorest 2nd 3rd RichestQuartile Quartile Quartile Quartile
Provincial Rural OtherCapital Mekong Rural
Peri-Urban
Strata Results
Despite APB’s mandate toprovide subsidized loansto the poor, its richest-quartile clientsoutnumbered its poorest-quartile clients by morethan 3 to 1.

60
Source: Household survey.
All Households Poorest Quartile Richest Quartile
Figure 6.4 Composition of Borrowing in the 12 Months Preceding the Survey
Figure 6.3 Average Household Borrowing by Sourcein the 12 Months Preceding the Survey(KN Thousand)
Source: Household survey.
quartile to the banks and supplier credit in particular as apercentage of their overall borrowing, and the greaterreliance of the poorest households on family and friends.
Figure 6.5 shows that overall, the richest quartileaccounted for 76.6% of the borrowing by value in the 12months preceding the survey. It also shows that 77.7% ofthe borrowing from APB by value was by households in therichest quartile. This further evidences that APB lending isnot specially oriented to the poorest households, and thatthe richest quartile of households are APB’s main clients invalue terms.
Preferences for Lending SourcesTable 6.5 shows the preferences of rural households fordifferent sources of loans. Specifically, households wereasked, “If your household needed a loan, please indicatethe first three sources of finance you would approach inorder of preference.” In the survey, 94.63% of householdsexpressed a first preference for a borrowing source, 55.77%

61
expressed a second preference, and 21.83% expressed athird preference; 5.37% expressed no preference.
Overall, 57.22% of households said borrowing fromfamily and friends was their first preference; 74.88% saidborrowing from family or friends was either their first, second,or third preference.
Next in order of first preference, 18.94% of ruralhouseholds expressed a first preference for APB as a sourceof loans, and 36.16% expressed some preference for this.This compared to only 5.78% that expressed a firstpreference for borrowing from another bank and smallerpercentages that expressed a first preference for othersources. It will be recalled, from Table 6.3, that only 2% ofrural households actually borrowed from APB in the 12months before the survey. Hence, despite this limitedoutreach, a large number of households (36.16%) expressedsome preference for borrowing from APB. There is clearly asignificant untapped market for APB, and perhaps for otherlenders.
Table 6.6 shows rural households’ borrowing firstpreferences by stratum and wealth quartile. Figure 6.6illustrates these first preferences for rural households as awhole and for the poorest and richest quartiles.
Across strata and wealth quartiles, preferences aredominated by (i) friends and family, (ii) APB, and (iii) othercommercial banks. Each other source of loans was first-preferred by less than 4% of households. The results indicatethat the richer the household, on average, the greater thepreference for borrowing from APB and other banks. Incontrast, the poorer the household, on average, the greaterpreference for borrowing from family and friends. While13.01% of the poorest quartile of rural households expresseda first preference for borrowing from APB and 1.72% had afirst preference for other commercial banks as a source ofloans, 24.99% of the richest quartile of rural householdsexpressed a first preference for APB and 10.82% a first
Table 6.5 Households Borrowing Preferences
Type of Percent with Percent with Percent with TotalBorrowing 1st Preference 2nd Preference 3rd Preference (Percent with 1st,
2nd, or 3rd Preference)
Friends and Family 57.22 14.03 3.63 74.88APB 18.94 14.24 2.98 36.16Other Bank 5.78 6.09 3.05 14.92VRF 2.67 4.88 3.53 11.08Informal Moneylender 1.92 7.09 3.00 12.01VSCG 1.44 2.18 1.27 4.89Supplier Credit 1.04 0.75 0.32 2.11SCU 0.30 0.77 0.32 1.39Pawn Shop 0.23 0.80 0.53 1.56Houay 0.10 0.39 0.82 1.31Other 4.98 4.56 2.39 11.93Total 94.63 55.77 21.83 94.63
Source: Household survey.
Source: Household survey.
APB All Sources
Figure 6.5 Share of Borrowing in the 12 Months Preceding the Survey by Quartile

62
Table 6.6 Household First Preferences for Type of Borrowing by Wealth Group
Friends or Family 57.22 52.65 54.69 69.67 49.73 66.77 60.61 53.72 47.75Agricultural Promotion Bank 18.94 19.03 19.53 15.02 21.93 13.01 18.28 19.51 24.99Other Commercial Bank 5.78 9.73 6.25 2.70 6.42 1.72 3.18 7.41 10.82Village Revolving Fund 2.67 3.98 3.91 2.10 2.41 3.04 3.00 2.61 2.04Informal Moneylender 1.92 3.98 1.17 0.60 2.14 3.53 1.52 0.89 1.73Village Savings and Credit Group 1.44 1.77 3.52 2.10 0.53 0.69 1.91 2.02 1.14Supplier Credit 1.04 1.77 1.56 1.20 0.53 0.89 0.86 1.59 0.82Savings and Credit Union 0.30 0.44 0.00 0.30 0.27 0.00 0.46 0.00 0.74Pawnshop 0.23 0.00 0.00 0.00 0.53 0.00 0.46 0.46 0.00Houay 0.10 0.00 0.00 0.30 0.00 0.00 0.00 0.00 0.40Other 4.98 3.98 3.52 1.20 8.56 3.88 6.18 4.78 5.09Total Households Expressing a First Preference 94.63 97.35 94.14 95.20 93.05 93.53 96.46 92.99 95.53
Source: Household survey
RuralBorrowing Source Household
Average
Wealth Quartile Results
Poorest 2nd 3rd RichestQuartile Quartile Quartile Quartile
Provincial Rural OtherCapital Mekong Rural
Peri-Urban
Strata Results
Source: Household survey.
All Households Poorest Quartile Richest Quartile
Figure 6.6 Household First Preferences for Borrowing (% of Households)

63
preference for other commercial banks. In contrast, while66.77% of the poorest quartile households had a firstpreference to borrow from family and friends, only 47.75%of the richest quartile of households expressed thispreference.
No strong pattern emerges from analyzing the stratumresults. However, it is noteworthy, given APB’s mandate forchannelling policy loans to rice farmers in the Rural Mekongregion, that Rural Mekong households expressed lesspreference for APB (15.02%) than the other strata, andexpressed a greater preference for friends and family(69.67%) than the other strata.
Borrowing Characteristic PreferencesIn the survey, rural households were asked to state what theimportant characteristics were for them when choosing whereto apply for a loan. (Households were not asked to rankcharacteristics or express them in any order of preference).
Table 6.7 and Figure 6.7 show the characteristics that ruralhouseholds considered important in choosing where to applyfor a loan.
Consistently across all wealth quartiles, confidence thata loan would be made was the most frequently cited importantcharacteristic—households want to be sure of being able toaccess the loan. Almost 60% of households regarded this asan important factor in choosing where to apply for a loan. Inall wealth groups, this was more frequently cited as importantthan the interest rate. Households in the poorest quartilenamed this characteristic almost twice as frequently as theinterest rate (52.89% to 27.64%), indicating that confidenceabout receiving a loan (i.e., access to the loan) is markedlymore important than price for them. By contrast, while therichest quartile stated even more frequently than the poorthat confidence that a loan will be made is important whenchoosing where to apply for a loan (65.11%), they cited theinterest rate almost as often (50%). These results for the
Table 6.7 Important Characteristics of Borrowing (% of Households)
Confidence a Loan Will Be Made 58.75 61.50 64.06 57.36 58.02 52.89 59.40 57.62 65.11Interest Rate 35.48 42.48 35.94 32.43 34.76 27.64 29.93 34.37 50.00Short Time/Distance to the Loan Provider 26.42 19.03 31.25 37.24 20.59 24.35 25.74 28.90 26.68Long-term Loan Available 22.32 35.40 29.69 11.71 24.06 25.41 23.14 15.95 24.77Low Collateral Requirements 18.24 25.22 20.70 22.22 11.76 15.17 19.39 15.22 23.19Simple Loan Procedures 17.19 13.72 10.16 18.92 18.18 14.66 20.28 16.75 17.09Flexible Repayment Terms 9.22 12.83 5.47 1.80 13.90 9.88 11.54 8.78 6.68Simple Savings Procedures (low amount of paperwork) 5.50 3.98 5.86 2.40 8.56 1.85 4.66 6.66 8.84Friendliness of the Person Making the Loan 4.10 5.31 7.42 2.70 4.28 1.68 2.55 4.36 7.82
Source: Household survey
RuralBorrowing Characteristic Household
Average
Wealth Quartile Results
Poorest 2nd 3rd RichestQuartile Quartile Quartile Quartile
Provincial Rural OtherCapital Mekong Rural
Peri-Urban
Strata Results

64
Lao PDR are consistent with results in other countries: thepoor are more concerned with sustained access to financialservices than they are with low interest rates.
For the poorest quartile of rural households, conveniencein terms of a short journey to the source of the loan was almostas important as price (24.35% of the poorest quartile citingthis as an important factor compared to 27.64% who said theinterest rate was an important factor in their choice). For therichest quartile, 50% of households cited interest rates asbeing an important factor compared to only 26.68% who citeda short journey to the loan provider as being important.
The availability of long-term loans, low collateralrequirements, and simple loan procedures were the nextmost important factors across all households. While long-term loan availability was the fourth most frequently cited
important characteristic when determining where to applyfor a loan, it is noteworthy that only 22.32% cited this.Hence, 77.68% did not consider this important. Aconsiderable amount of policy lending by the Government,as well as donor credit lines (including those from ADB),has been justified by the perception that there is a highdemand for long-term loans. The evidence of this surveyindicates that such policies may be misguided.
For the poorest quartile of households, flexiblerepayment terms were more frequently cited as importantthan for the richest quartile, while for the richest quartilesimple procedures and friendly service were more frequentlycited as important than for the poorest quartile, but still lessimportant than other factors.
Source: Household survey.
All Households Poorest Quartile Richest Quartile
Figure 6.7 Important Characteristics of Borrowing
The poor are moreconcerned with sustainedaccess to financialservices than they arewith low interest rates.

65
Loan PurposeTable 6.8 presents the estimated total borrowing by ruralhouseholds (extrapolated to the entire rural population) inthe 12 months prior to the survey, broken down by loanpurpose, strata, and quartile. Table 6.9 does the same forthe total number of loans borrowed by rural households.3
Table 6.8 indicates that, for all rural householdscombined, borrowing is concentrated in the transport,services, and trade businesses, as well as livestock, riceproduction, and medicine and health care. Virtually allborrowing for service businesses takes place in Peri-Urbanareas (99.3%); and virtually all is borrowed by householdsin the richest quartile (99.5%). While borrowing for tradeis more equally distributed across strata, it is alsoconcentrated in the richest quartile, who borrow 90.6% ofsuch lending. Similarly, borrowing for transport businessesis concentrated in Peri-Urban households (67.3%) andhouseholds in the richest quartile (91.7%).
Table 6.8 also indicates the dominance of borrowing forrice production in Provincial Capital and Rural Mekonghouseholds, which together comprise 81% of such borrowing.Again, however, such borrowing is concentrated in the richestquartile, which borrowed 63% of total lending for riceproduction. Borrowing for livestock production is clearlyconcentrated in Other Rural households, which borrowed96.7% of such lending; again, the richest quartile accountfor most of this, borrowing 95% of total lending for livestock.
Finally, Table 6.8 points to the importance of loans forhealth and medical purposes in Other Rural areas, and inthe three poorer quartiles, which together borrowed 95% ofsuch lending. Households in the poorest quartile borrowedover five times as much as households in the richest quartilefor health and medicines, and this accounted for 34.9% byvalue of poorest quartile households borrowings, comparedto 0.4% by value of the borrowings of the households in therichest quartile. Domestic consumption goods accounted for9.5% of the borrowing by value of households in the poorestquartile, compared to 0.8% of borrowing for richest quartilehouseholds. The importance of credit for nonproductivepurposes by the poorest households is demonstrated by thispattern.
3 It should be noted that the stated purpose of a loan may be different from the actual impact ofthe loan. For example, a household might state that it is borrowing to finance a marriage andmight indeed use its loan to pay for the marriage. However, without the loan, the householdmight sell a water buffalo to finance the marriage. Hence, the impact of the loan would be toprevent the sale of a water buffalo, rather than to finance the marriage, which would have beenfinanced even without the loan. For a fuller discussion of the difficulties and methodology ofmeasuring impact, see B. E. Coleman, “The Impact of Group Lending in Northeast Thailand,”Journal of Development Economics, October 1999.
Households in thepoorest quartileborrowed over five timesas much as households inthe richest quartile forhealth and medicines.
Testing new rice varieties in Savannakot province

66
4 This is not to ignore the important increases in productivity that can be obtained throughimproved health, education, housing, etc. Rather, it is to emphasize the number of loans thatare not invested directly in production activities.
Table 6.8 Estimated Borrowing by Rural Households by Loan Purpose in the 12 Months Preceding the Survey (KN Billion)
All RuralLoan Purpose House-
holds
Wealth Quartile Results
Poorest 2nd 3rd RichestQuartile Quartile Quartile Quartile
Provincial Rural OtherCapital Mekong Rural
Peri-Urban
Strata Results
Rice Production 50.91 4.54 23.12 18.12 5.14 1.57 11.87 5.43 32.05Other Crop Production 5.97 4.55 0.00 0.32 1.10 1.53 0.27 1.44 2.72Livestock 70.72 0.00 2.32 0.05 68.36 1.29 0.10 2.44 66.89Fishing 5.23 2.70 0.13 2.29 0.10 0.00 2.94 2.29 0.00Forestry 0.00 0.00 0.00 0.00 0.00 0.00 0.00 0.00 0.00Construction Business 0.62 0.00 0.00 0.00 0.62 0.00 0.21 0.42 0.00Industry 6.00 0.77 0.04 0.00 5.19 0.02 0.04 5.19 0.75Handicraft 16.44 0.00 0.14 11.82 4.48 2.49 3.69 1.56 8.70Wholesale and Retail Trade 49.89 11.34 8.11 10.90 19.53 2.48 0.00 2.18 45.22Services 56.43 56.04 0.12 0.27 0.00 0.00 0.00 0.27 56.16Transport 72.00 48.46 6.96 1.83 14.76 0.01 0.15 5.87 65.99House Construction 16.08 3.42 0.88 6.29 5.50 0.00 1.61 7.35 7.12Domestic Consumption Goods 18.10 6.98 0.23 2.13 8.76 2.84 6.56 4.66 4.03Health / Medicine 42.22 4.70 0.91 11.64 24.96 10.39 12.22 17.59 2.02Education 7.20 1.05 3.63 2.11 0.42 0.00 0.19 1.32 5.70Marriage 2.80 0.75 0.00 1.30 0.75 0.84 0.48 0.73 0.75Funeral 5.87 2.86 0.36 1.83 0.83 0.00 3.34 0.83 1.71Other 212.72 142.79 1.24 32.40 36.28 6.33 10.94 7.71 187.74Total Borrowing 639.20 290.95 48.18 103.29 196.78 29.77 54.59 67.29 487.55
Source: Household survey.
Table 6.9 (showing the number of loans borrowed)confirms many of the findings from Table 6.8 (showing theamount borrowed). But it also brings out in stark relief thelarge number of loans borrowed for health and medical care.This loan purpose alone makes up 26.7% of all loansborrowed. The average size of these loans was KN370,000($34). Borrowing for medicine and health care wasconcentrated in the more remote Other Rural and RuralMekong strata, as well as in the three poorer quartiles—they made up 36.4% of all loans borrowed by the poorestquartile, while they comprised only 6% of loans borrowedby the richest quartile.
A further 14.93% of all loans, with an average size ofKN0.28 million ($26), were for domestic consumption goods.
These were concentrated in the Other Rural stratum (53.6%of such loans) and in the two poorest quartiles (combined,79.8% of such loans).
Overall, an estimated 308,884 loans or just over 72%of all loans were for nonproductive purposes (houseconstruction, domestic consumption goods, health andmedicines, education, marriage, funereal or other purposes)4
at an average size of KN990,000 ($93), evidencing the verysubstantial demand for the type of lending that can often bedelivered through MFIs more effectively than through theformal banking system.

67
Table 6.9 Estimated Numbers of Rural Loans by Loan Purpose in the 12 Months Preceding the Survey
All RuralLoan Purpose House-
holds
Wealth Quartile Results
Poorest 2nd 3rd RichestQuartile Quartile Quartile Quartile
Provincial Rural OtherCapital Mekong Rural
Peri-Urban
Strata Results
Rice Production 38,104 9,015 3,374 17,403 8,311 6,451 12,846 9,513 9,293Other Crop Production 10,207 5,259 0 1,832 3,117 1,503 916 3,457 4,332Livestock 9,076 0 888 916 7,272 2,994 1,039 1,394 3,649Fishing 3,800 751 178 1,832 1,039 0 1,968 1,832 0Forestry 0 0 0 0 0 0 0 0 0Construction Business 2,078 0 0 0 2,078 0 1,039 1,039 0Industry 2,719 1,503 178 0 1,039 751 178 1,039 751Handicraft 22,036 0 533 10,076 11,428 9,897 4,826 3,404 3,910Wholesale and Retail Trade 19,378 6,010 2,308 2,748 8,311 3,868 0 3,759 11,751Services 2,774 1,503 355 916 0 0 0 916 1,858Transport 9,430 2,254 1,065 916 5,195 1,039 929 3,868 3,594House Construction 22,772 3,005 888 6,412 12,467 0 7,204 9,226 6,341Domestic Consumption Goods 63,975 17,279 1,421 10,992 34,284 23,780 27,254 6,587 6,354Health / Medicine 114,443 21,035 3,729 43,967 45,712 47,211 34,346 28,267 4,618Education 6,123 1,503 710 1,832 2,078 0 929 2,829 2,365Marriage 6,493 751 0 3,664 2,078 2,994 1,832 916 751Funeral 3,813 1,503 355 916 1,039 0 1,667 1,039 1,106Other 91,265 13,523 2,664 36,639 38,440 29,224 25,097 20,012 16,932Total Loans 428,484 84,892 18,645 141,060 183,887 129,712 122,069 99,097 77,605
Source: Household survey.
Borrowing and Repaying In Cash and Kind /Loan and Collateral Agreements / Loan TermsTable 6.10 summarizes some key facts about householdborrowing. The table highlights:• 81.34% of loans by value and 79.53% of loans by
number were taken in cash; 18.66% by value and20.47% by number were taken in kind;
• Provincial Capital households borrowed markedly more(45.67%) in-kind than households in other strata;
• households in the two poorest quartiles tended to borrowand repay in kind more than households in the tworichest quartiles;
• only 22.81% of loans had written loan agreements andonly 9.87% had written collateral agreements;
• written loan agreements and collateral agreements weremost common in Provincial Capital households and leastcommon in Rural Mekong households; and they weremost common for households in the richest quartile,reflecting these households’ greater access to the formalsector; and
• the average loan term is around 6 months, but someloans of up to 4- and 5 year-duration were found inhouseholds outside Peri-Urban areas.
Interest RatesTable 6.11 shows the distribution of effective annual interestrates paid by rural households on their loans. About half ofall loans (50.71%) had zero interest—the vast majority of

68
Table 6.11 Distribution of Interest Rates (% of Household Loans in Interest Rate Band)
Interest Rate Band All Loans
Wealth Quartile Results
Poorest 2nd 3rd RichestQuartile Quartile Quartile Quartile
Provincial Rural OtherCapital Mekong Rural
Peri-Urban
Strata Results
0.0% 50.71 53.42 51.28 40.82 53.40 53.68 61.81 56.47 26.000.1 – 9.9% 1.23 1.37 0.00 2.04 0.97 1.50 0.00 0.00 3.6010 – 29.9% 4.43 1.37 5.13 0.00 7.77 7.09 0.00 0.84 9.7330 – 59.9% 12.21 13.70 15.38 6.12 13.59 0.26 13.52 11.07 29.3460 – 99.9% 7.66 9.59 5.13 8.16 6.80 4.99 10.76 6.80 8.25100 – 199% 10.25 8.22 6.41 24.49 5.83 12.99 7.60 13.46 6.84200% and higher 13.50 12.33 16.67 18.37 11.65 19.49 6.32 11.36 16.24Total 100.00 100.00 100.00 100.00 100.00 100.00 100.00 100.00 100.00
Source: Household survey.
Table 6.10 Loan Characteristics
All RuralLoan Characteristic House-
holds
Wealth Quartile Results
Poorest 2nd 3rd RichestQuartile Quartile Quartile Quartile
Provincial Rural OtherCapital Mekong Rural
Peri-Urban
Strata Results
Total Loans Taken by Value (KN billion) 639.20 290.95 48.18 103.29 196.78 29.77 54.59 67.29 487.55Total Loans Taken by Number 428,484 84,892 18,645 141,060 183,887 129,712 122,069 99,097 77,605Loans Taken in Cash by Value (KN billion) 526.61 231.06 26.38 79.49 189.68 25.65 38.76 59.55 402.64Loans Taken in Kind by Value (KN billion) 113.08 59.89 22.29 23.80 7.10 4.15 16.28 7.74 84.91Loans Taken in Cash by Number 344,821 71,369 15,093 110,833 147,525 102,021 94,993 81,710 66,097Loans Taken in Kind by Number 84,196 13,523 4,084 30,227 36,362 27,691 27,609 17,387 11,508Loans Repaid in Cash by Value (KN billion) 607.49 285.36 45.75 87.65 188.73 24.09 39.06 62.44 481.90Loans Repaid in Kind by Value (KN billion) 32.20 5.58 2.92 15.64 8.06 5.71 15.99 4.85 5.65Loans Repaid in Cash by Number 350,206 71,369 16,514 119,992 142,331 97,238 98,340 83,596 71,032Loans Repaid in Kind by Number 78,810 13,523 2,664 21,067 41,556 32,474 24,261 15,501 6,573Loans with Written Loan Agreements (National Count) 97,860 18,030 6,393 25,647 47,790 28,033 22,033 15,458 32,335Loans with Written Collateral Agreements (National Count) 42,352 11,269 4,262 9,160 17,661 6,012 8,023 10,265 18,053Average Loan Term (Months) 5.56 4.52 7.25 6.04 5.44 4.35 4.30 6.62 7.09
Source: Household survey.

69
these came from family and friends. At the same time,23.75% of loans had effective interest rates of more than100% per year, and 13.50% had effective rates in excess of200% per year. In other words, the vast majority of loanswere either at zero interest or at extremely high interest—only a small minority fell in the mid range.
This illustrates clearly that any preoccupation withcontinuing to deliver subsidized credit through the formalsector in the Lao PDR is misguided. In a sustainablemicrofinance sector, effective interest rates are likely to bebetween 30% and 50%. Although this is higher than, forexample, the administratively influenced rates of APB andother commercial banks, it is well below the average effectiverates currently faced by many borrowers in rural the LaoPDR.
Figures 6.8 and 6.9 illustrate the differences in thedistribution of interest rates on loans to all rural households,and the richest and poorest quartiles, by number of loans
and percentage of loans respectively. The figures show thatalthough the poorest quartile of households benefit from ahigher number and percentage of interest-free loans (53.7%of their loans compared to 26% of loans borrowed by therichest quartile and 50.7% of loans borrowed by thepopulation as a whole), they are much less able to accessinterest-bearing loans at the rates prevailing in thecommercial banking sector or typical of microfinance (inthe region of 20–60% per year). More specifically, only 8.9%of the interest-bearing loans received by the poorest quartileof households were at less than 60% interest per year, while42.6% of the interest-bearing loans received by the richestquartile were at less than 60% per year. In contrast, 37.5%of interest-bearing loans received by the poorest quartile ofhouseholds were at interest rates of over 60%, compared to31.3% of such loans for the richest quartile of households.Moreover, in sheer numbers, the poorest quartile borrowed athigh interest more than twice as frequently as the richest
Source: Household survey.
All Households Poorest Quartile Richest Quartile
Figure 6.8 Distribution of Interest Rates (Number of Loans in Interest Rate Band)
Many loans had effectiveinterest rates of morethan 100% per year. In asustainable microfinancesector, effective interestrates are between30% and 50%.

70
quartile. It is estimated that, nationwide, the poorest ruralhouseholds borrowed 22,485 loans at interest rates over 100%,while the richest rural households borrowed 10,698 loans atthese interest rates. Clearly, delivering sustainable, market-oriented credit to the poor through MFIs and APB could makea significant contribution to the well-being of the poor.
Physical Proximity to Credit SourcesTable 6.12 and Figure 6.10 show the average distances thatborrowing households reported they had to travel to thesources of their loans.5
The data shows the “grassroots” level of the semiformalsector and informal moneylenders and houays comparedto the more urban locations of formal banks. Distances ofborrowers to their informal and semiformal sources,
5 These data are only for borrowing households to the sources of their own loans. The data do notinclude distances of non-borrowing households to the various potential sources of loans.
Source: Household survey.
All Households Poorest Quartile Richest Quartile
Figure 6.9 Interest Rate Ranges and Percent of Households Paying Rate in Interest Rate Band
especially in the more remote Rural Mekong and OtherRural Strata, are considerably less than distances ofborrowers to formal sources. In contrast, distances for ruralborrowers to their formal sector sources are relatively highreflecting the location of APB and other commercial bankbranches in urban areas. The data also illustrate the greaterproximity of APB and other commercial banks to ruralhouseholds in the Provincial Capital and Rural Mekongareas compared to Other Rural areas. (It should be recalledthat Peri-Urban households, by definition, are located inthe area outside the municipal boundaries, but within 25km of the urban center. Hence, they inevitably have totravel some distance to the nearest branches that arelocated in the urban centers).
Similarly, the poor (who depend much more on informalsources than formal sources) are on average much closerthan the relatively rich to their informal and semi-formalsources of loans.
The poorest quartileborrowed at high interestmore than twice asfrequently as the richestquartile.

71
Table 6.12 Average Distance from Borrowing Households to Source of Their Loans (Kms)
All RuralSource of Loan House-
holds
Wealth Quartile Results
Poorest 2nd 3rd RichestQuartile Quartile Quartile Quartile
Provincial Rural OtherCapital Mekong Rural
Peri-Urban
Strata Results
Suppliers 13.44 1.62 2.76 6.07 22.47 3.93 2.66 16.08 45.43APB 7.80 10.00 3.63 2.30 10.67 6.21 10.75 3.75 9.77Friends or Family 7.21 3.13 9.93 8.12 8.41 2.15 3.39 16.33 10.71Other Bank 6.57 10.87 3.17 2.83 7.33 4.00 NA 16.82 1.58Informal Moneylender 3.21 7.64 2.23 0.45 0.72 0.09 1.60 2.37 13.84VRF 1.32 0.03 2.35 0.87 1.70 0.06 2.01 2.16 0.86Houay 1.30 3.00 0.00 NA 0.30 NA NA NA 1.30VSCG 0.46 0.13 0.52 0.05 0.91 0.96 0.28 0.00 0.15SCU 0.15 0.25 0.01 0.00 NA NA 0.00 0.00 0.41All Loans 7.33 3.88 6.22 6.48 9.91 2.23 3.13 14.30 13.66
Source: Household survey.
Figure 6.10 Average Distance to Source ofLoans (Kms)
Source: Household survey.
Important policy conclusions derive from these results.The poor typically have less mobility than the relativelywealthy, both because they have less to spend on transportationand because of lower transportation infrastructure in poor,remote areas. Accordingly, financial services need to be takento the poor. In the Lao PDR, policy makers have focused ontwo means of doing this: APB, through its mobile creditofficers, and village level organizations. The data shows thatAPB is failing in extending its catchment area through mobilecredit officers - it is only serving areas slightly larger thanordinary commercial banks, and in so doing, it is primarilyreaching rural households in the richer quartiles and urbanhouseholds.
The data also reflect the paucity of outreach of sustainablemicrofinance institutions, which typically work at more of agrassroots level and practice mobile banking that reaches morevillages. These results should encourage policies to developsustainable MFIs operating at the village level.

72
Table 6.13 Household Estimated Unsatisfied Loan Demand in the 12 Months Preceding the Survey (KN Billion)
All RuralLoan Purpose House-
holds
Wealth Quartile Results
Poorest 2nd 3rd RichestQuartile Quartile Quartile Quartile
Provincial Rural OtherCapital Mekong Rural
Peri-Urban
Strata Results
Livestock 1,022.18 52.06 67.56 154.51 748.05 185.04 255.50 348.10 233.54Non-Income Generating Activities 992.57 219.52 39.65 217.56 515.84 448.38 56.49 179.52 308.17Other Crop Production 663.52 11.42 527.02 5.50 119.59 11.24 27.95 28.61 595.72Other 421.47 87.66 16.89 90.23 226.70 203.06 22.45 71.81 124.16Wholesale and Retail Trade 326.80 95.75 22.52 11.45 197.08 5.61 8.42 32.96 279.81Rice Production 223.91 46.08 8.50 43.51 125.82 99.86 21.83 35.90 66.32House Construction 203.63 43.83 7.93 43.51 108.36 94.87 11.22 35.90 61.63Transport 201.56 43.83 7.93 43.51 106.29 89.47 11.22 35.90 64.96Services 143.82 31.48 40.84 22.90 48.60 3.12 0.00 21.59 119.11Fishing 79.04 18.79 13.96 34.35 11.95 3.90 18.71 35.59 20.84Handicraft 50.14 12.02 1.86 0.00 36.26 16.05 1.15 0.00 32.94Forestry 8.27 0.00 1.24 1.83 5.19 0.36 0.89 1.83 5.19Construction Business 3.55 0.00 3.55 0.00 0.00 0.00 0.00 0.00 3.55Industry 0.75 0.75 0.00 0.00 0.00 0.00 0.75 0.00 0.00Total 4,341.23 663.18 759.46 668.86 2,249.73 1,160.95 436.59 827.72 1,915.96
Source: Household survey.
6 This is not to say that prudent lending decisions would necessarily satisfy the entire differencebetween actual and unmet demand for borrowing. On the other hand, the poor have, time andtime again, in the Lao PDR and other countries, demonstrated high repayment rates whenloans are structured to meet their needs and when cost-saving measures are introduced toreduce the higher transaction costs of serving the poor. In the Lao PDR, nonperforming loanrates of sustainable MFIs, which target the poor, are considerably lower than NPLs in the state-owned commercial banks. The data presented here, therefore, merely suggest the degree towhich the current system is failing to serve the needs of the poor.
Unsatisfied Loan DemandTable 6.13 and Figure 6.11 show the estimated unsatisfiedloan demand of rural households by stratum, quartile, andloan purpose. Specifically, each survey household was asked,“Was your household unable to carry out planned activitiesin the last 12 months because it could not borrow sufficientfunds?” If a household answered “yes” then it was asked tospecify the amounts and purposes of loans that it was unableto obtain.
The results show the considerable unsatisfied demandfor credit among rural households. Overall, unsatisfieddemand equals KN4,341 billion for all rural households,which is 6.7 times the amount actually borrowed over the12 months before the survey. This difference between actualborrowing and unsatisfied demand is most pronounced
among households in the poorest quartile—unsatisfieddemand is 39 times as large as actual borrowing. In contrast,for households in the richest quartile, unsatisfied demandis only 3.93 times as large as actual borrowing. Currently,the Lao rural finance system is clearly failing to satisfy thedemand for credit from poorest households.6
Table 6.13 shows that the highest unmet demand is forlivestock loans, which account for 23.5% of total unsatisfied
Unsatisfied demand is 6.7times the amount
borrowed. In the poorestquartile, unsatisfied
demand is 39 times theamount borrowed.

73
Geographically, the largest unmet demand is in theremote Other Rural households, with unsatisfied borrowingof KN2,250 billion. This accounts for 52% of all unmetdemand in the country and is likely a result of the low levelof outreach in the more remote areas. Relative to actualborrowing, Provincial Capital households and Other Ruralhouseholds are the most underserved—with unmet demandexceeding actual borrowing by factors of 15.76 and 11.43,respectively. This contrasts with Provincial Capitalhouseholds, whose unmet demand is only 2.28 times theiractual borrowing.
In Peri-Urban areas the highest demand (after non-income generating purposes) is for trade. In ProvincialCapital areas the demand for loans for non-rice cropproduction is the highest and comprises 79% of suchdemand. In the Rural Mekong and Other Rural areas,demand for livestock loans is highest.
The conclusion is clear: there is a huge unsatisfieddemand for loans by rural households, covering a wide rangeof production opportunities and nonproduction needs.
demand; Other Rural households account for 73% of thisunmet demand. This is followed closely by unsatisfieddemand for non-income generating activities (e.g.,education, medicine and heath care, marriage and funeralceremonies, domestic consumption), which accounts for22.9% of unsatisfied demand; the poorest quartile accountsfor 45% of this. The third highest unsatisfied demand is for“other crop production” (i.e., non-rice crops), whichcomprises 15.3% of all unmet demand; the richest quartileaccounts for 90% of this. High unsatisfied demand(exceeding KN140 billion) also exists for trade, riceproduction, house construction, transport business, andservices business.
Source: Household survey.
Figure 6.11 Comparison of Actual Borrowing toUnsatisfied Demand

74
Conclusions and Recommendations
ConclusionsThe most overriding conclusion of this study is that the formalsector (banks) and semiformal sector (microfinanceinitiatives) are failing to serve the demand for financialservices of the vast majority of rural households in the LaoPDR. This is true for all geographic strata and for all wealthquartiles, but it is especially so for the poor and most remotehouseholds. The key findings of this study are:
• Only 5% of all rural households had any savings in abank;
• Only 4% had savings in a microfinance initiative;• Only 26.7% of rural savings is held in cash (bank
deposit, cash in hand, etc.), while 73.3% is held in-kind (primarily livestock but also precious metals andjewelry, and housing materials);
• Only 2% had borrowed from APB in the 12 monthsbefore the survey, and only 3% had borrowed from anybank;
• Only 4% had borrowed from a microfinance initiative;• In contrast, 33% had borrowed from an informal source,
including friends, family, moneylenders, and houay.
These results are even more striking for households inthe poorest quartile:
• Only 1.5% had savings in a bank;• Only 1.4% had savings in a microfinance initiative;
• Only 8.5% of rural savings is held in cash, while 91.5%is held in-kind;
• Only 1% borrowed from APB, and 1.9% had borrowedfrom any bank;
• Only 4.1% had borrowed from a microfinance initiative;• In contrast, 40% had borrowed from an informal source.
As a result of the low outreach of the formal andsemiformal sectors, rural households depend largely oninformal sources. Informal loans accounted for 55% of totalloan volume for rural households—KN353 billion out ofKN637 billion. Moneylenders made loans to about 25,300rural households, in an estimated amount of KN27.30billion, a fraction of the informal lending done byhouseholds, but still more than twice as much as thesemiformal sector.
There was a large reported unmet demand for credit.Unsatisfied demand for credit was almost 7 times as largeas actual borrowing by all rural households: actual borrowingfrom all sources was KN639 billion, while unsatisfieddemand was KN4,341 billion. Again, this was most strikingamong the poorest quartile, for whom unsatisfied demandwas almost 40 times as large as actual borrowing (KN30billion vs. KN1,161 billion). Geographically, the largestunmet demand is in the remote Other Rural households,with unsatisfied borrowing of KN2,250 billion. This accountsfor 52% of all unmet demand.

75
While each stratum and each wealth quartile expressedunmet demand for a diversity of economic activities, unmetdemand was also strongly related to the economicopportunities in the particular geographic strata. Forexample, in remote Other Rural areas, there was high unmetdemand for livestock loans. In Provincial Capital areas, therewas high unmet demand for non-rice crop production. InPeri-urban areas, there was high unmet demand for tradeand other business. In all areas except Peri-urban areas,there was a high unmet demand for non-income generatingactivities (e.g., education, medicine and heath care, marriageand funeral ceremonies, domestic consumption), whichaccounts for 23% of unsatisfied demand. The conclusion isclear: outreach of financial services is low, and there is ahuge unsatisfied demand for loans by rural households,covering a wide range of production opportunities andnonproduction needs.
The economic characteristics of households also pointto the diversity of needs for financial services. Perhaps mostimportantly, there is a high degree of multifunctionalityamong rural households: 90% of rural households engagein multiple income-generating activities, and this is similaracross strata and wealth quartiles. And although 78% ofhouseholds engaged in agriculture, livestock raising, orfishing as their primary economic activity, only 38% of totalreported income came from these activities. Over half ofreported income came from business activities, and this wassimilar across strata and wealth quartiles, including thepoorest quartile. The high level of multifunctionality is animportant observation with implications for the rural financesystem in the Lao PDR. While rural finance policies havetraditionally focused on directed lending programs that targetagricultural activities, the high frequency ofmultifunctionality suggests a need for financial services thatserve a broad range of economic activities in rural
households. The results highlight the importance ofnonagricultural income in rural Lao PDR.
Among the formal sector financial institutions, APB hasthe mandate to provide financial services to rural areas andhas the largest rural service network. However, APB’s pastpractices have significantly weakened it financially. It hashigh NPLs and a large capital deficit, greatly limiting itsability to extend outreach. It also has limited capacity forproper credit assessment of customers despite receivingsignificant levels of technical assistance since 1993.However, its most significant constraint appears to be itslack of autonomy in operational decisions as it continues tocarry out significant levels of directed, subsidized lending(policy lending) at the behest of the Government.
LDB also has a significant branch network and thereforethe potential to increase its provision of rural financialservices. Like APB, it also has experience in group lendingtechniques, which are well suited to lending to groups ofrural households without collateral or credit history. LDB isparticularly well suited, however, to lend to rural small andmedium enterprises, including agriculture processingoperations. Also like APB, however, it has high NPLs and alarge capital deficit, limiting its ability to extend outreach.It also has limited capacity, but again its lack of autonomyappears to be the most important constraint. No other bankshave a significant branch network in rural areas, or aninterest in increasing provision of rural financial services.
While funding for semiformal microfinance initiativeshas significantly increased in recent years (roughly doublingeach year from 1999 to 2003), overall funding remains low,at less than $1 million cumulatively over 5 years. Fundingof capacity building has also grown but remains low, at lessthat $100,000 cumulatively over 5 years. As a result,outreach of these initiatives remains low, as does theircapacity.

76
However, three MFIs have begun to demonstrate the potentialof sustainably oriented microfinance in the Lao PDR. Loanproducts offered by the three MFIs that are striving forsustainability have a median effective interest rate of 48%per year, while loan products offered by INGO andmultilateral/bilateral microfinance components have medianinterest rates from 12% to 22% per year. Only the MFIscharge interest rates at sustainable levels, thus creating thepotential to provide permanent access to financial services.Moreover, these three MFIs also had the lowest percentageof borrowers in arrears at 7.8% (lower than othermicrofinance initiatives, and much lower than the SOCBs,including APB). However, most microfinance initiativesdemonstrated weaknesses in financial reporting.
Households’ expressed preferences for financial servicesare also telling. In assessing the importance of variouscharacteristics of loan products, households most frequentlycited “confidence that a loan would be made” (59%),whereas the interest rate was cited less frequently (38%).Households in the poorest quartile named “confidence thata loan would be made” almost twice as frequently as theinterest rate (52.89–27.64%). These results for the Lao PDRare consistent with results in other countries: the poor arethe poor arethe poor arethe poor arethe poor aremore concerned with sustained access to financial servicesmore concerned with sustained access to financial servicesmore concerned with sustained access to financial servicesmore concerned with sustained access to financial servicesmore concerned with sustained access to financial servicesthan they are with low interest ratesthan they are with low interest ratesthan they are with low interest ratesthan they are with low interest ratesthan they are with low interest rates.
It is also clear that, as in many other developing countries,rural households have substantial savings, including the poor.However, due to the low outreach of formal and semiformalfinancial institutions, the vast majority (73.3%) of savings isheld in-kind. And even among cash savings, almost 50% isheld outside formal financial institutions.
RecommendationsEmbedded in the critical assessment and conclusions abovelie the seeds of opportunity and optimism for developingthe rural finance sector in the Lao PDR.
When it comes to preferences for savings vehicles, almost30% of rural households said their first preference was tosave in APB or another bank (despite the fact that only 5%had savings in a bank). Similarly, regarding preferences forloan sources, 25% expressed a first preference for APB oranother bank, despite the fact that less than 3% of householdshad borrowed from a bank in the previous 12 months. Thereare clear opportunities for APB and perhaps other banks (e.g.,LDB) to expand their outreach.
At the same time, the results also offer hope for thepotential of sustainable microfinance. Although few ruralhouseholds expressed a preference for borrowing or savingin an MFI, this is probably the result of their lack offamiliarity with using MFIs. Moreover, unfortunately, withso few microfinance initiatives operating sustainably, manysuch initiatives have had short lives, thus discouraginghouseholds’ reliance on them for sustainable access. At thesame time, however, rural households expressed large unmetdemand for loans of the kind that MFIs can often delivermore effectively and efficiently than formal banks—small,short-term loans that do not require traveling long distancesto obtain. Also, importantly, rural households (especiallythe poor) more frequently noted the importance of sustainedaccess to loans than they did the interest rate. Hence, theevidence indicates that they are willing to pay sustainableMFI interest rates in the 30–50% range. Indeed, when ruralhouseholds (again, especially the poor) are unable to borrowinterest-free from friends and family, they typically have toborrow in informal markets at interest rates over 100% oreven 200%.
The key issue then is howhowhowhowhow to expand formal andsemiformal financial services in rural areas. The Governmenthas already taken important and helpful steps in recent years.The Policy Statement on Sustainable Rural andMicrofinance, issued by the Prime Minister’s Office in late

77
2003, establishes a new and improved framework fordeveloping the sector. Much of this policy has also beenincorporated in the National Growth and Poverty EradicationStrategy (NGPES) approved by the National Assembly in2004. These high-level documents call for phasing outdirected, subsidized lending by APB and transforming itinto a self-sustaining, market-oriented rural financialinstitution with genuine management autonomy inoperational decisions. This is indeed a key and necessaryreform. APB, with its branch and service network, has thegreatest potential to rapidly expand access to rural financeon a sustainable basis. When such transformations fromagricultural policy bank to market-oriented rural bankoccurred in Indonesia and Mongolia, both outreach and bankprofits grew rapidly.
The Government, BOL, and APB therefore need to carryout the concrete actions to realize the policy embodied inthe Policy Statement and NGPES. This includes adopting aconcrete plan to phase out policy lending in a short periodof time and placing remaining policy lending, if any, in anon-bank, non-deposit-taking policy lending mechanism,preferably on the Government budget where it can betransparently monitored. APB must make loans on a strictlycommercial basis, but within the framework of theGovernment’s poverty reduction objectives. As illustratedby this study, market orientation and poverty reduction canbe mutually reinforcing objectives. However, to do this, theGovernment must grant APB genuine managementautonomy. While the Government can (and should) set theoverall objectives of APB, APB management must then havefull independence in operational decisions (including creditallocation) to meet those objectives.
APB must also be brought under the full prudential,regulatory, and supervisory regime for state-ownedcommercial banks to ensure sound operations, rather thanbeing treated as a special “policy bank” that is not
supervised. APB also needs to enhance its human resourcesmanagement and develop a comprehensive staff trainingprogram to ensure capacity. External assistance may benecessary. APB’s information and communications systemsalso need to be upgraded for it to operate as a modern bank,providing quality services and lowering costs. Finally, APBhas inherited a precarious financial position as a result ofits past operations—capital is highly negative and NPLsare high. APB must be authorized to write-off its loss-gradedloans and be recapitalized by the Government, butconditional on a proven track record of improvedperformance. By operating in a sustainable, market-orientedmanner, APB can generate profits, build its capital, financeits expansion, and generate tax revenues for the Government.
At the same time, the Government should continue tosupport the microfinance sector through improvements inthe policy, legal, and regulatory environment, as well assupporting pilot projects focused on the creation anddevelopment of sustainable MFIs. The Prime Minister’sPolicy Statement notes that donors and private businesses,both local and foreign, would invest in microfinance if theenvironment were conducive, and that MFIs need to haveaccess to national and international public and privateinvestors to expand. Moreover, the Policy Statement callsfor a sector comprised of several new, autonomous MFIswith a diversity of legal ownership, including private andpublic ownership, and practicing a variety of methodologiesto meet demand.
The Policy Statement marks a sea change in Governmentpolicy to support microfinance. Again, the key is tooperationalize these policies through concrete actions. Amajor improvement was achieved in June 2005, with BOL’sissuance of new regulations for MFIs. These regulationspermit a variety of ownership—including public, private,domestic, and international—and a variety of MFI modelsThey also distinguish between deposit-taking and non-

78
deposit-taking MFIs, wisely requiring that non-deposit-taking MFIs only need to register, while deposit-taking MFIsmust be licensed. At the same time, the regulations allowBOL to authorize registered MFIs to accept some deposits ifno other deposit services are available from a licensedfinancial institution in a given location. These regulationsare in fact a model that many other countries would benefitfrom following.
The Government should also continue to take concretesteps to attract foreign investment in the microfinance sector.The authors of this study are unaware of any country in theworld where microfinance has been able to develop withoutsignificant funding and technical assistance frominternational donors and development partners. Asmicrofinance has evolved over the past 20 years, shiftingfrom a “social” to a more “commercial” orientation, donorshave become more and more concerned about thesustainability and professional, transparent management ofMFIs that they support. Moreover, several internationalinvestment funds have developed in recent years in responseto the recognition that MFIs often need equity investmentsmore than they need credit lines for onlending. In this newenvironment, both donors and investors are requiring, as acondition of their support, a formal ownership share andseat on the board to allow them to oversee the proper use oftheir funds. The Government has recognized the need forforeign investment in many sectors of the economy tocontribute to technology transfer and management expertise.This applies to microfinance also. Such investments will
also complement the currently limited capacity andresources of BOL to supervise MFIs.
For their part, microfinance donors, sponsors, andpractitioners must ensure that their microfinance initiativesfollow good practices and focus on sustainability from theoutset. Directed credit, interest rate subsidies, and otherunsustainable practices should be avoided. “Smartsubsidies” such as grants for training and capacity building,piloting of new and innovative services, accounting andmanagement information systems, and start-up capitalshould be encouraged. Donors, sponsors, and practitionersshould also actively participate in discussions with theGovernment to give feedback on the policy environment andsuggest revisions when necessary to encourage sectordevelopment. They should also consider developing a “codeof conduct” to reflect their commitments to supportingsustainable microfinance.
Finally, the Government should regularly monitor thedevelopment of the sector. Under the new microfinanceregulations issued by BOL, all microfinance initiatives willneed to either register or be licensed by BOL. BOL shouldcreate a central database of such initiatives, thus allowingit to monitor the number and outreach of institutions ofvarious types. In addition to this direct monitoring, theGovernment’s Rural and Microfinance Committee shouldmeet regularly with microfinance stakeholders to reviewprogress in developing the sector, to receive feedback, toidentify implementation and policy issues, and to proposenew solutions to further develop the sector.