demifer demographic and migratory flows affecting european ... · figure 18 components of change...
TRANSCRIPT
September 2010
The ESPON 2013 Programme
DEMIFER Demographic and migratory flows
affecting European regions and cities
Applied Research Project 2013/1/3
Deliverable 12/11 Demifer Case Studies
West Yorkshire
Prepared by Phil Rees, John Stillwell, Peter Boden and Adam Dennett
School of Geography University of Leeds
Leeds, UK
EUROPEAN UNION Part-financed by the European Regional Development Fund INVESTING IN YOUR FUTURE
This report presents results of an Applied Research Project conducted within the framework of the ESPON 2013 Programme, partly financed by the European Regional Development Fund. The partnership behind the ESPON Programme consists of the EU Commission and the Member States of the EU27, plus Iceland, Liechtenstein, Norway and Switzerland. Each partner is represented in the ESPON Monitoring Committee. This report does not necessarily reflect the opinion of the members of the Monitoring Committee. Information on the ESPON Programme and projects can be found on www.espon.eu The web site provides the possibility to download and examine the most recent documents produced by finalised and ongoing ESPON projects. This basic report exists only in an electronic version. © ESPON & CNR, 2010. Printing, reproduction or quotation is authorised provided the source is acknowledged and a copy is forwarded to the ESPON Coordination Unit in Luxembourg.
Table of contents 1. Introduction ........................................................................................... 1
2. Study area definition and data availability................................................... 2
3. A summary of population change .............................................................. 4
4. Fertility and mortality .............................................................................. 9
5. Internal migration ..................................................................................12
6. International migration ...........................................................................18
7. Changing profile of the West Yorkshire population.......................................22
8. The impact of the DEMIFER scenarios on West Yorkshire..............................28
9. Concluding comments.............................................................................34
Figures
Figure 1 Components of population change, West Yorkshire, 2001-2008............... 5 Figure 2 Components of population change, West Yorkshire’s NUTS3 regions, 2001-
2008 .............................................................................................. 8 Figure 3 Total fertility rate, West Yorkshire and its NUTS3 regions, 1990-2007 ...... 9 Figure 4 Standardised Mortality Ratios (SMR), West Yorkshire and its NUTS3
regions, 1990-2006 .........................................................................11 Figure 5 Life expectancy at birth, 2006-08, West Yorkshire and its NUTS3 regions 12 Figure 6 Net migration balances and rates, West Yorkshire and its NUTS3 regions ,
1999-2008 .....................................................................................13 Figure 7 Net migration exchanges between districts within West Yorkshire and
between West Yorkshire districts and the rest of the UK, 1999-2008.......16 Figure 8 Net migration rates by age for West Yorkshire and its NUTS3 regions,
2008. ............................................................................................17 Figure 9 Immigration statistics, West Yorkshire, 2004-2008...............................20 Figure 10 Immigration statistics, Leeds and Bradford, 2004-2008.........................21 Figure 11 NINo registration profile, West Yorkshire, 2004-2008............................21 Figure 12 NINo registration profile, Leeds, 2004-2008 ........................................22 Figure 13 NINo registration profile, Bradford, 2004-2008 ....................................22 Figure 14 Population pyramids, England and West Yorkshire, 2031 .......................23 Figure 15 Non-white British ethnic groups as a percentage of total population, UK
and West Yorkshire, 2006.................................................................25 Figure 16 Location quotients for ethnic groups, West Yorkshire, 2006 ...................26 Figure 17 Scenario summary, West Yorkshire, 2005-2050 ...................................29 Figure 18 Components of change under alternative scenarios, West Yorkshire, 2005-
2050 .............................................................................................31 Figure 19 Age-profiles under alternative scenarios, West Yorkshire, 2005-2050......32 Figure 20 Dependency ratios under alternative scenarios, West Yorkshire, 2005-205033

ii
Maps
Map 1 NUTS regions within West Yorkshire .............................................................. 3 Map 2 Net migration exchanges between districts within West Yorkshire and
between West Yorkshire districts and the rest of the UK, 2008 ........................ 14 Map 3 Immigration and emigration rates, West Yorkshire districts, 2007.................... 19 Map 4 Index of diversity, West Yorkshire districts, 2006 .......................................... 27
1
1 Introduction
The DEMIFER project aims to examine the historical and future impact of
demographic change upon the 27 members of the European Union (EU) plus the
four additional European states that have a close relationship with the EU (EEA
plus Switzerland). To achieve this aim, a comprehensive database of
demographic statistics has been constructed, capturing information about trends
and patterns of fertility, mortality, internal migration and international migration
for each NUTS2 region in the 31 ‘ESPON’ countries.
These data have been used to examine how the components of demographic
change combine to exert different impacts upon population change, the size of
the labour force and the ageing of the population in each of the NUTS2 regions.
Historical analysis, coupled with multi-regional forecasting methods, has been
used to assess how future developments in fertility, mortality and migration
might affect population growth or decline and drive changes in the age structure
in different types of regions. The impact of migration, both internal and
international, has been a particular focus of the study, in order to establish its
influence upon the labour force, to establish how migration between European
countries and migration to Europe compensate or reinforce each other, and to
consider how climate change may drive migration flows within, between and into
countries and regions.
A key part of the project has been a more detailed examination of the complexity
of the demographic process within a series of ‘Case Studies’ that draw together
the various strands of analysis undertaken in the DEMIFER project; from
connecting the historical analysis, developing the regional typology, building
scenarios and formulating policy implication, to illustrating the results and
impacts at a more disaggregate, NUTS3 regional geography. Case Study areas
have been selected from DEMIFER’s regional typology, with at least one region
from each cluster selected. Two Case Studies have been prepared for the UK:
West Yorkshire and Greater London. This paper reports on the West Yorkshire
Case Study.
2
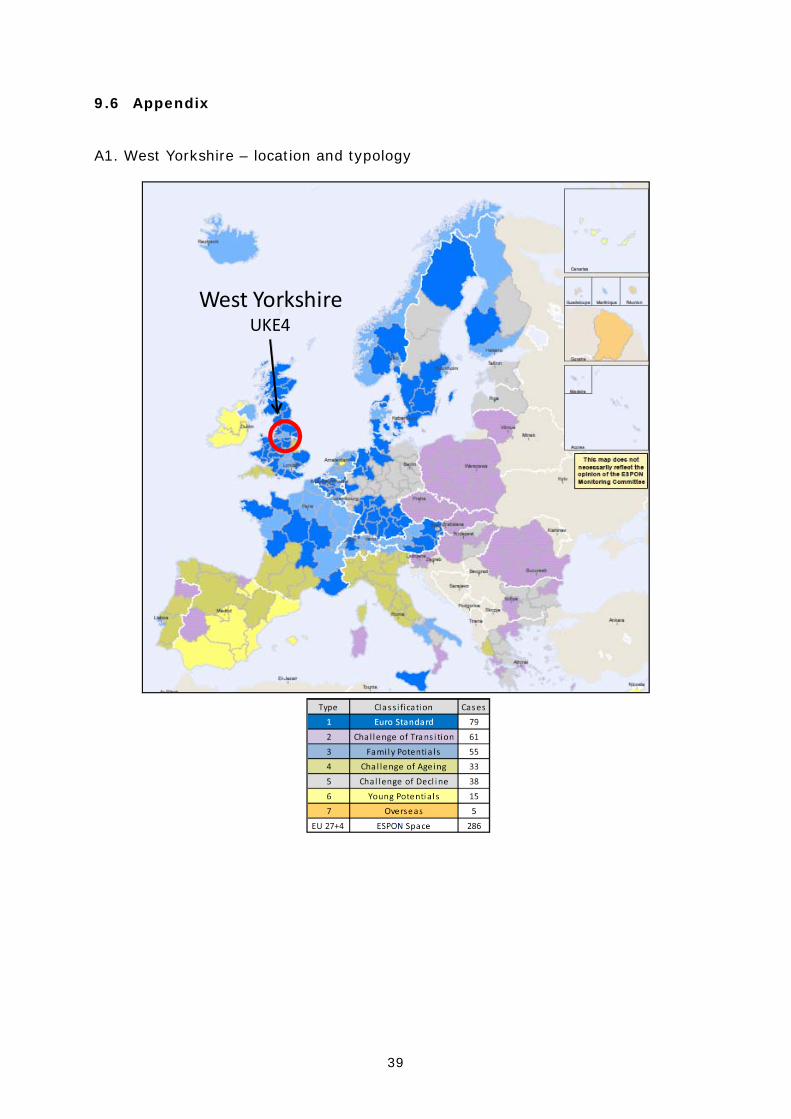
West Yorkshire is a NUTS2 region classified as ‘Family Potentials’ in the DEMIFER
typology (see Appendix 1). Areas with this classification typically have a labour
force population in the younger adult ages (aged 20-39) of average size, lower
than average population beyond retirement (65+) and higher than average
growth due to both natural increase and net migration. This study examines how
well West Yorkshire fits its typology classification. Two other regions in the
‘Family Potentials’ cluster have also been selected for more detailed Case
Studies: Alsace (FR42) and Stockholm (SE4).
Section 2 of this report provides the geographical context for the West Yorkshire
study and briefly summarises the nature of the demographic data available for
analysis in the UK. Section 3 reviews some of the more recent studies of
demographic change in West Yorkshire, drawing in particular on the expertise in
migration analysis that exists at the School of Geography at the University of
Leeds. Section 4 summarises the historical picture of population change and its
key components, with Section 5 taking a more detailed look at the importance of
migration in this process. Section 6 examines how demographic change is likely
to impact upon the profile of the population: its age structure, its labour force, its
elderly sub-population and its ethnic composition. Section 7 indicates how the
DEMIFER scenarios would impact upon West Yorkshire and a concluding section
draws together the analysis and policy-relevant findings of the Case Study.
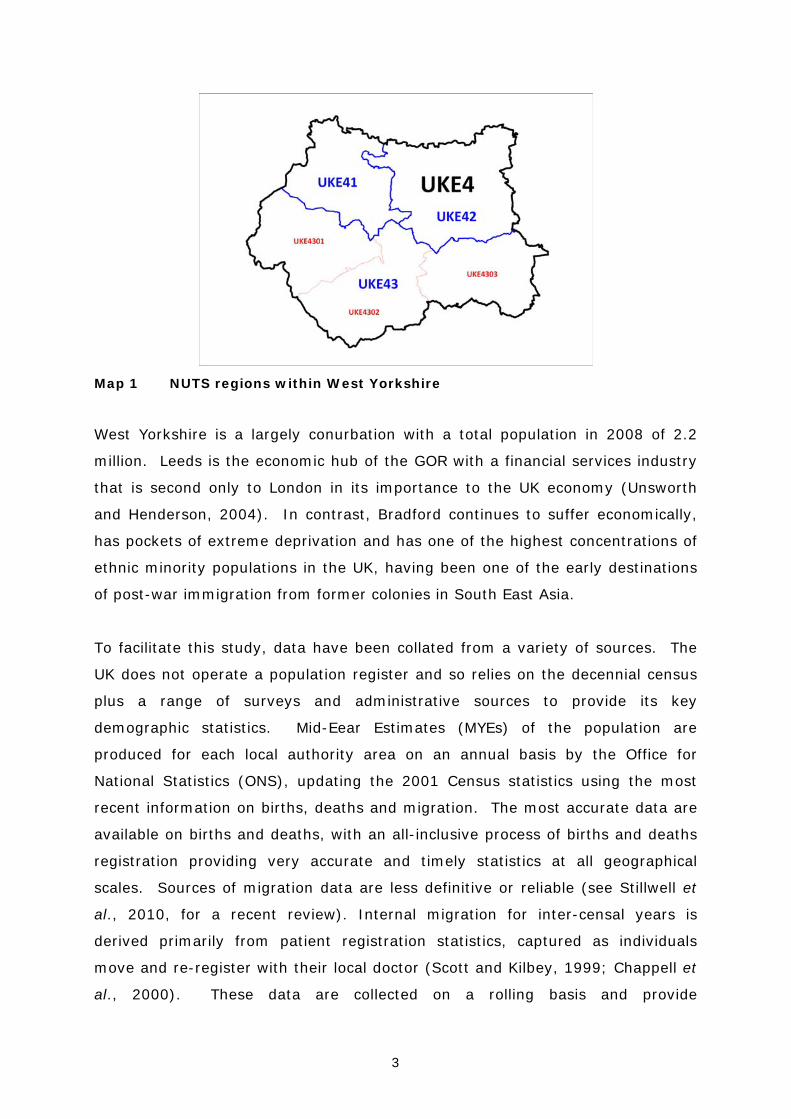
2 Study area definition and data availability
West Yorkshire (UKE4) is situated in the north of England and is one of four
NUTS2 regions (South Yorkshire, North Yorkshire and East Yorkshire/North
Lincolnshire being the others) within the UK’s Government Office Region (GOR)
of Yorkshire and Humber. The NUTS3 geography of West Yorkshire identifies
three separate areas: the individual metropolitan district local authorities of
Leeds (UKE42) and Bradford (UKE41) plus a third area (UKE43) combining the
local authority districts of Calderdale (UKE4301), Kirklees (UKE4302) and
Wakefield (UKE4303). The analysis in this report uses both the NUTS3
geography and the local authority geography for presentation purposes (Map 1).
3
Map 1 NUTS regions within West Yorkshire
West Yorkshire is a largely conurbation with a total population in 2008 of 2.2
million. Leeds is the economic hub of the GOR with a financial services industry
that is second only to London in its importance to the UK economy (Unsworth
and Henderson, 2004). In contrast, Bradford continues to suffer economically,
has pockets of extreme deprivation and has one of the highest concentrations of
ethnic minority populations in the UK, having been one of the early destinations
of post-war immigration from former colonies in South East Asia.
To facilitate this study, data have been collated from a variety of sources. The
UK does not operate a population register and so relies on the decennial census
plus a range of surveys and administrative sources to provide its key
demographic statistics. Mid-Eear Estimates (MYEs) of the population are
produced for each local authority area on an annual basis by the Office for
National Statistics (ONS), updating the 2001 Census statistics using the most
recent information on births, deaths and migration. The most accurate data are
available on births and deaths, with an all-inclusive process of births and deaths
registration providing very accurate and timely statistics at all geographical
scales. Sources of migration data are less definitive or reliable (see Stillwell et
al., 2010, for a recent review). Internal migration for inter-censal years is
derived primarily from patient registration statistics, captured as individuals
move and re-register with their local doctor (Scott and Kilbey, 1999; Chappell et
al., 2000). These data are collected on a rolling basis and provide
4
disaggregation by age and local authority area; they do, however, suffer from
issues of under-registration, particularly for young adult males who are least
likely to register with a doctor when they move.
International migration statistics are the least robust. The UK relies upon the
International Passenger Survey (IPS) as the primary source of its data on
immigration and emigration, combining it with a number of other sources to
produce estimates for local areas (ONS, 2008). These estimation methods have
been subject to considerable scrutiny and comment (House of Commons, 2008;
Rees et al., 2009) at a time when net immigration has been a dominant driver of
population change in the UK. Alternative estimates of immigration have been
produced using a variety of administrative sources (Boden and Rees, 2009;
2010) and the ONS has recently completed a consultation process on its own
methodological revisions (using administrative data) which will see local
authority population estimates revised for 2001-2008. In the absence of
definitive statistics on international migration, local authorities have been
encouraged to use alternative sources to gather information (Audit Commission,
2007; Green et al., 2008) with administrative sources such as the Department of
Works and Pensions’ (DWP) National Insurance Number (NINo) statistics,
Workers Registration Scheme (WRS) data from the UK Borders Agency and the
registration of foreign nationals with the UK health service, providing useful, if
incomplete, evidence on this key element of local population change.
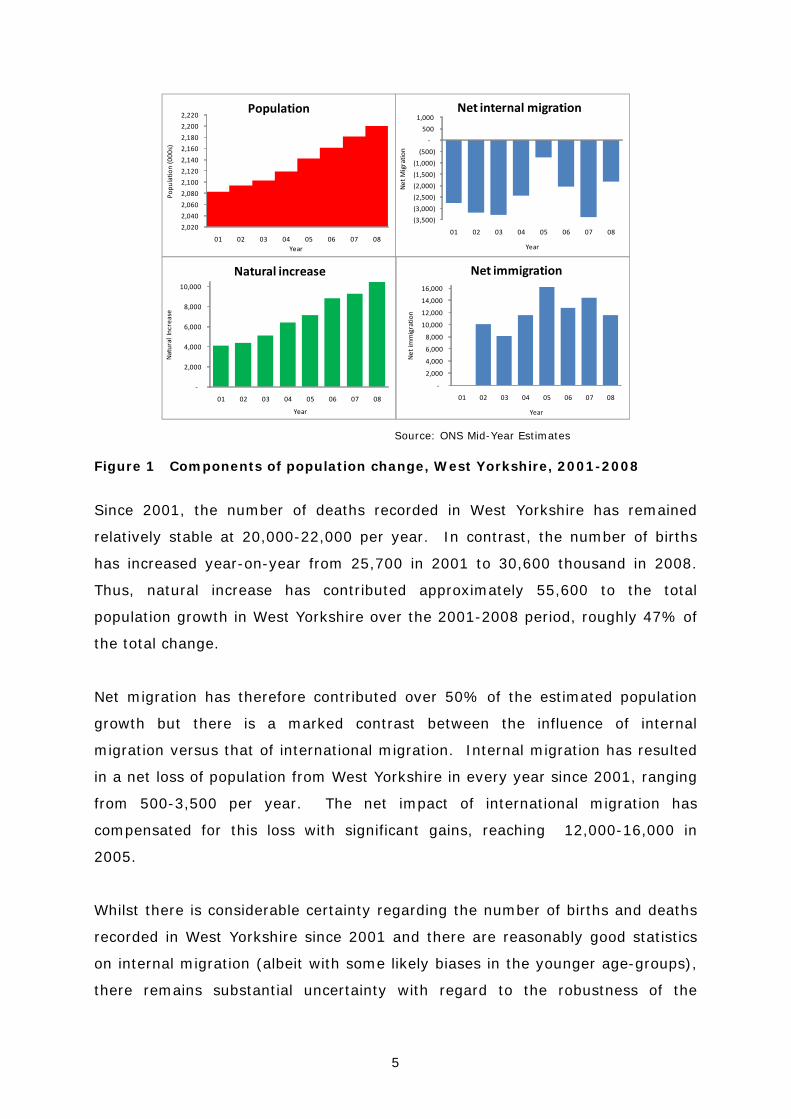
3 A summary of population change Since 2001, the population of West Yorkshire is estimated to have increased by
6%, reaching 2.2 million in 2008. The components of demographic change are
clearly exerting different influences on this growth but there exists particular
uncertainty regarding the true impact of the international migration component
(Figure 1).
5
2,020
2,040
2,060
2,080
2,100
2,120
2,140
2,160
2,180
2,200
2,220
01 02 03 04 05 06 07 08
Popu
latio
n (000
s)
Year
Population
‐
2,000
4,000
6,000
8,000
10,000
01 02 03 04 05 06 07 08
Natural In
crease
Year
Natural increase
(3,500)
(3,000)
(2,500)
(2,000)
(1,500)
(1,000)
(500)
‐
500
1,000
01 02 03 04 05 06 07 08
Net M
igratio
n
Year
Net internal migration
‐
2,000
4,000
6,000
8,000
10,000
12,000
14,000
16,000
01 02 03 04 05 06 07 08
Net im
migratio
nYear
Net immigration
Source: ONS Mid-Year Estimates
Figure 1 Components of population change, West Yorkshire, 2001-2008
Since 2001, the number of deaths recorded in West Yorkshire has remained
relatively stable at 20,000-22,000 per year. In contrast, the number of births
has increased year-on-year from 25,700 in 2001 to 30,600 thousand in 2008.
Thus, natural increase has contributed approximately 55,600 to the total
population growth in West Yorkshire over the 2001-2008 period, roughly 47% of
the total change.
Net migration has therefore contributed over 50% of the estimated population
growth but there is a marked contrast between the influence of internal
migration versus that of international migration. Internal migration has resulted
in a net loss of population from West Yorkshire in every year since 2001, ranging
from 500-3,500 per year. The net impact of international migration has
compensated for this loss with significant gains, reaching 12,000-16,000 in
2005.
Whilst there is considerable certainty regarding the number of births and deaths
recorded in West Yorkshire since 2001 and there are reasonably good statistics
on internal migration (albeit with some likely biases in the younger age-groups),
there remains substantial uncertainty with regard to the robustness of the
6
international migration estimates. Research has shown that immigration
estimates for the larger Yorkshire and Humber GOR are likely to be in error (too
high) which has a knock-on effect for the estimates for the component local
authority areas (Boden and Rees, 2009). The scale of the over-estimation could
be as high as 20-30% which, given the importance of international migration as
a driver of demographic change, would have a substantial impact upon
population estimates and projections; altering the age-group profile, the size of
the labour force and the scale and speed of population ageing that is expected.
The uncertainty surrounding the net international migration and therefore the
estimated population growth should be borne in mind when examining the
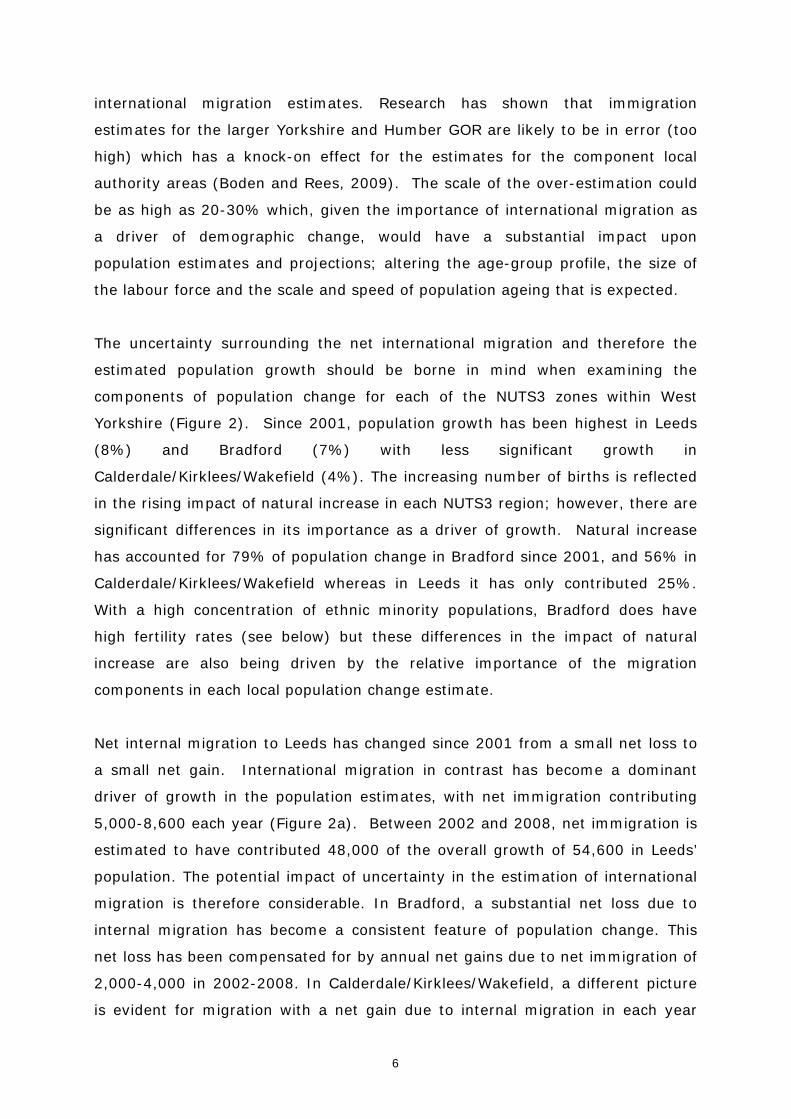
components of population change for each of the NUTS3 zones within West
Yorkshire (Figure 2). Since 2001, population growth has been highest in Leeds
(8%) and Bradford (7%) with less significant growth in
Calderdale/Kirklees/Wakefield (4%). The increasing number of births is reflected
in the rising impact of natural increase in each NUTS3 region; however, there are
significant differences in its importance as a driver of growth. Natural increase
has accounted for 79% of population change in Bradford since 2001, and 56% in
Calderdale/Kirklees/Wakefield whereas in Leeds it has only contributed 25%.
With a high concentration of ethnic minority populations, Bradford does have
high fertility rates (see below) but these differences in the impact of natural
increase are also being driven by the relative importance of the migration
components in each local population change estimate.
Net internal migration to Leeds has changed since 2001 from a small net loss to
a small net gain. International migration in contrast has become a dominant
driver of growth in the population estimates, with net immigration contributing
5,000-8,600 each year (Figure 2a). Between 2002 and 2008, net immigration is
estimated to have contributed 48,000 of the overall growth of 54,600 in Leeds’
population. The potential impact of uncertainty in the estimation of international
migration is therefore considerable. In Bradford, a substantial net loss due to
internal migration has become a consistent feature of population change. This
net loss has been compensated for by annual net gains due to net immigration of
2,000-4,000 in 2002-2008. In Calderdale/Kirklees/Wakefield, a different picture
is evident for migration with a net gain due to internal migration in each year

7
declining and becoming a net loss in 2007 and 2008. A net annual inflow of
1,000-2,000 through international migration has also contributed to population
growth since 2002. The migration components are therefore primarily
responsible for the different growth trajectories of each of these NUTS3 regional
populations.
8
(a) Leeds
680
690
700
710
720
730
740
750
760
770
780
01 02 03 04 05 06 07 08Po
pulatio
n (000
s)
Year
Population
‐
2,000
4,000
6,000
8,000
10,000
01 02 03 04 05 06 07 08
Natural In
crease
Year
Natural increase
(3,500)
(3,000)
(2,500)
(2,000)
(1,500)
(1,000)
(500)
‐
500
1,000
01 02 03 04 05 06 07 08
Net M
igratio
n
Year
Net internal migration
‐
2,000
4,000
6,000
8,000
10,000
12,000
14,000
16,000
01 02 03 04 05 06 07 08
Net im
migratio
n
Year
Net immigration
(b) Bradford
455
460
465
470
475
480
485
490
495
500
505
01 02 03 04 05 06 07 08
Popu
latio
n (000
s)
Year
Population
‐
2,000
4,000
6,000
8,000
10,000
01 02 03 04 05 06 07 08
Natural In
crease
Year
Natural increase
(3,500)
(3,000)
(2,500)
(2,000)
(1,500)
(1,000)
(500)
‐
500
1,000
01 02 03 04 05 06 07 08
Net M
igratio
n
Year
Net internal migration
‐
2,000
4,000
6,000
8,000
10,000
12,000
14,000
16,000
01 02 03 04 05 06 07 08
Net im
migratio
n
Year
Net immigration
(c) Calderdale, Kirklees and Wakefield
880 885 890 895 900 905 910 915 920 925 930 935
01 02 03 04 05 06 07 08
Popu
latio
n (000
s)
Year
Population
‐
2,000
4,000
6,000
8,000
10,000
01 02 03 04 05 06 07 08
Natural In
crease
Year
Natural increase
(3,500)
(3,000)
(2,500)
(2,000)
(1,500)
(1,000)
(500)
‐
500
1,000
01 02 03 04 05 06 07 08
Net M
igratio
n
Year
Net internal migration
‐
2,000
4,000
6,000
8,000
10,000
12,000
14,000
16,000
01 02 03 04 05 06 07 08
Net im
migratio
n
Year
Net immigration
Note: Scale on population graph varies by area; other graphs have a fixed scale for all areas.
Source: ONS mid-year estimates
Figure 2 Components of population change, West Yorkshire’s NUTS3 regions, 2001-2008
9
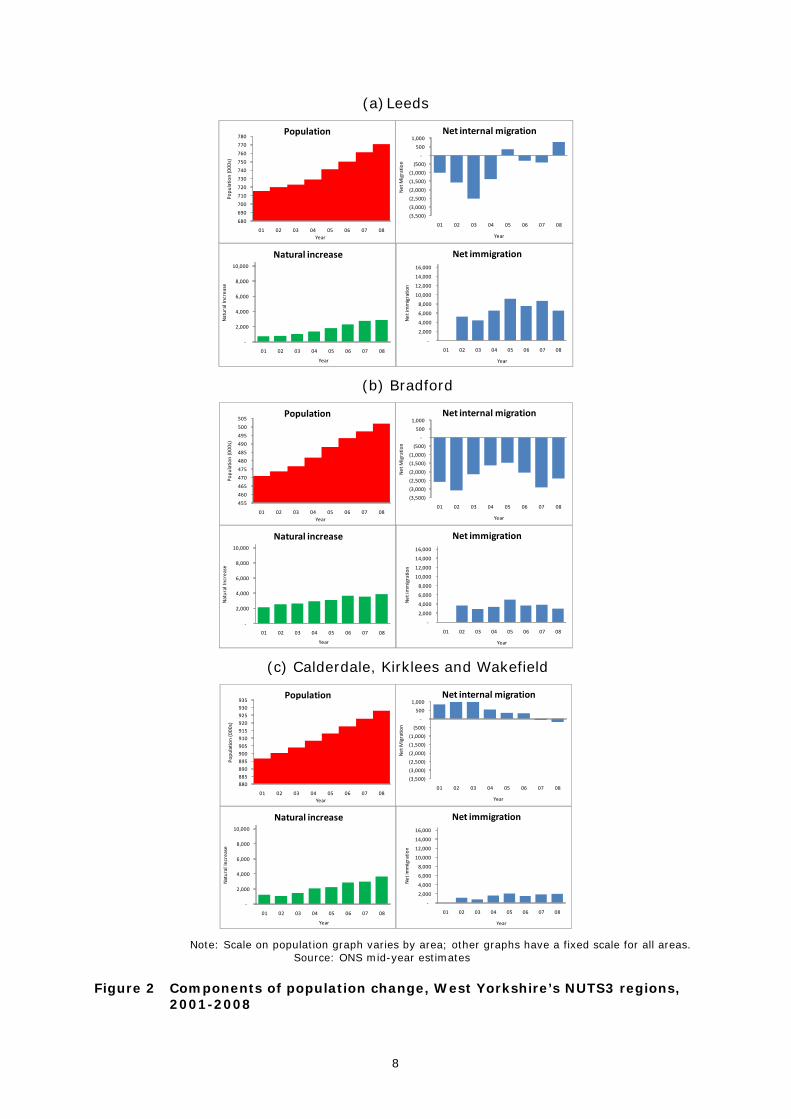
4 Fertility and mortality
The increasing contribution of natural increase to population growth in West
Yorkshire since 2001 has been driven by a reversal in the downward trend in
fertility rates that were experienced throughout the UK to the end of the last
century. This turnaround has been underpinned by the trend towards late
childbearing that has led to an increase in fertility for females in older age-
groups and by the increasing percentage of births to mothers born outside the
UK. Each of the three NUTS3 regions has experienced a rise in its total fertility
rate (TFR) since 2001 but it is interesting to examine the differences that exist
between the levels of the three curves (Figure 3).
1.30
1.50
1.70
1.90
2.10
2.30
2.50
90 92 94 96 98 00 02 04 06 08
TFR
Year
Total Fertility Rate
West Yorkshire Leeds
Bradford Calderdale, Kirklees & Wakefield Source:
Figure 3 Total fertility rate, West Yorkshire and its NUTS3 regions, 1990-2007 With ‘replacement’ fertility rates now standing at slightly below 2.1, Bradford has
maintained an above-replacement TFR since the 1990s, rising to almost 2.4 in
2007. With its diverse ethnic mix, the percentage of total births to mothers
whose country of birth was outside the UK now exceeds 30%. In Leeds, the TFR
is much lower than in Bradford, declined quite steeply throughout the 1990s and
then climbed from a low-point of 1.4 in 2001 to reach 1.6 in 2007; still well
below replacement. The large student population is likely to play a significant
role in depressing the TFR but the uncertainty over the true population size due
to the inadequacies of immigration estimation may also be playing a part, with
an artificially inflated population denominator keeping the TFR at its low level.

10
Leeds has a TFR lower than any of the other major metropolitan areas in the UK.
Births to mothers born themselves outside the UK is also an increasingly
important component of the birth mix in Leeds; 13% in 2004 rising to 19% by
2008. The TFR schedule for the third NUTS3 region of
Calderdale/Kirklees/Wakefield is midway between Leeds and Bradford and
appears to experience the sharpest rise since 2001, approaching replacement
level by 2007; with Calderdale and Kirklees above replacement by 2007 and
Wakefield just below.
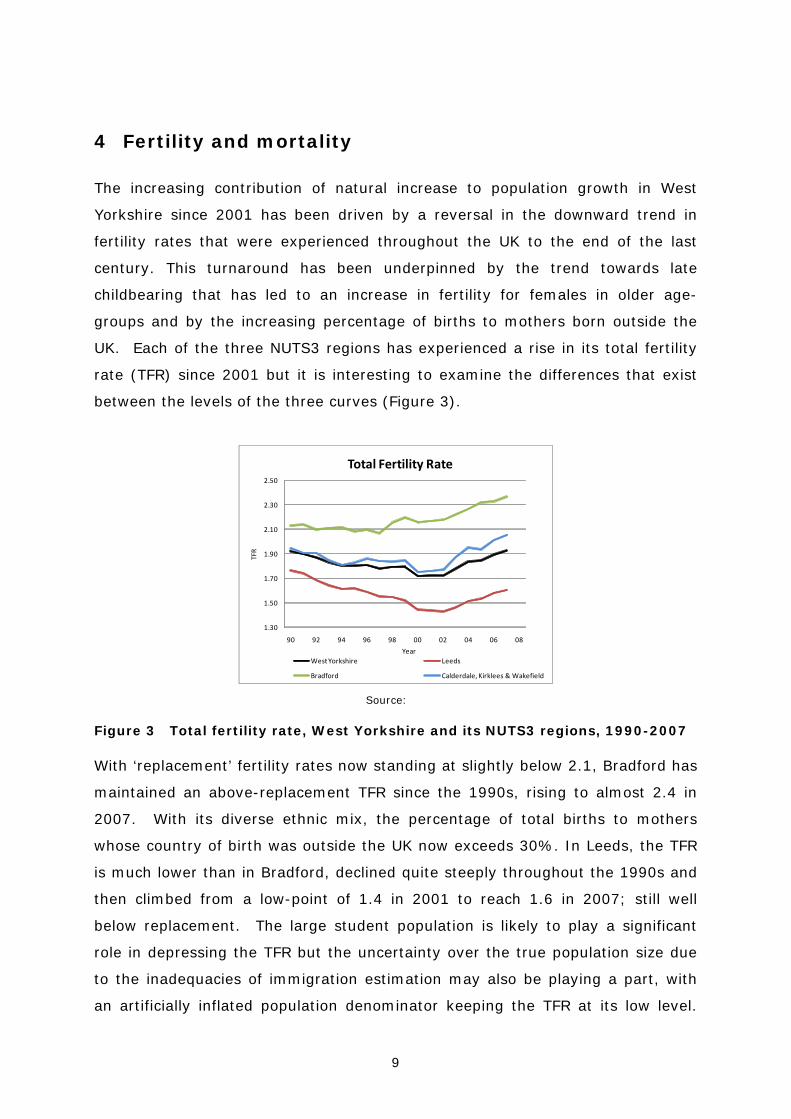
Mortality rates in West Yorkshire are 5% higher than the England and Wales
average. Bradford has the highest levels over the period in West Yorkshire with
its Standardised Mortality Ratio (SMR) for males 15% above than the England
and Wales benchmark (100 in Figure 4) in certain years. Female standardised
mortality in Bradford also fluctuates over time, with a low pint in 1996 at 4%
above the national average and a high point at the end of the period when the
SMR has risen to 18% of the national average. Leeds, in contrast, has an SMR
for males that has remained above the England and Wales average since 1997
whilst the female SMR has tended to remain below the 100 from 1995 until
2006, The SMR for Calderdale/Kirklees/Wakefield more or less reflects the West
Yorkshire average for both males and females.
11
90.00
95.00
100.00
105.00
110.00
115.00
120.00
90 92 94 96 98 00 02 04 06
SMR
Year
Standardised Mortality Ratio ‐ male
West Yorkshire Leeds
Bradford Calderdale, Kirklees & Wakefield
90.00
95.00
100.00
105.00
110.00
115.00
120.00
90 92 94 96 98 00 02 04 06
SMR
Year
Standardised Mortality Ratio ‐ female
West Yorkshire Leeds
Bradford Calderdale, Kirklees & Wakefield Note: SMR for England & Wales = 100Source: Office for National Statistics
Figure 4 Standardised Mortality Ratios (SMR), West Yorkshire and its NUTS3 regions, 1990-2006
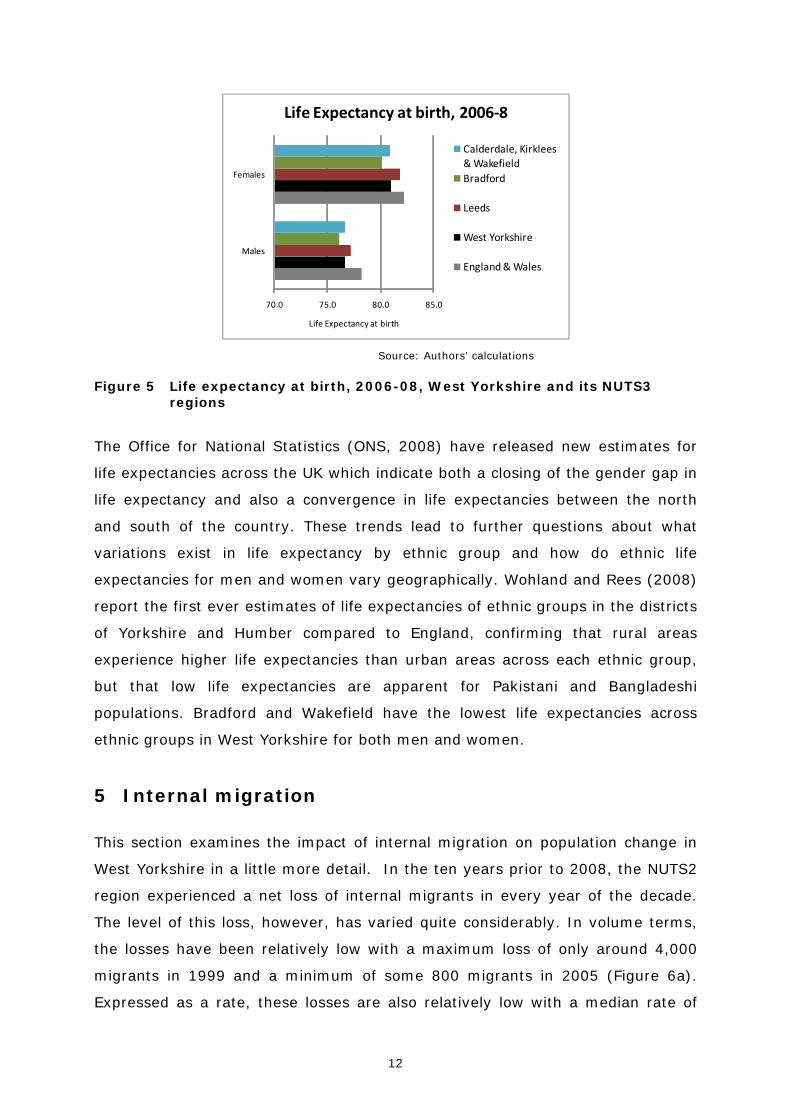
Statistics on life expectancy at birth reflect these SMR differences, with West
Yorkshire residents expected to live one year less than the England and Wales
average would suggest (Figure 5). Bradford has the lowest life expectancy for
both males (76 years) and females (80 years), whereas life expentancy in Leeds
is closer to the England and Wales average for females and males.
12
70.0 75.0 80.0 85.0
Males
Females
Life Expectancy at birth
Life Expectancy at birth, 2006‐8
Calderdale, Kirklees & WakefieldBradford
Leeds
West Yorkshire
England & Wales
Source: Authors’ calculations
Figure 5 Life expectancy at birth, 2006-08, West Yorkshire and its NUTS3 regions
The Office for National Statistics (ONS, 2008) have released new estimates for
life expectancies across the UK which indicate both a closing of the gender gap in
life expectancy and also a convergence in life expectancies between the north
and south of the country. These trends lead to further questions about what
variations exist in life expectancy by ethnic group and how do ethnic life
expectancies for men and women vary geographically. Wohland and Rees (2008)
report the first ever estimates of life expectancies of ethnic groups in the districts
of Yorkshire and Humber compared to England, confirming that rural areas
experience higher life expectancies than urban areas across each ethnic group,
but that low life expectancies are apparent for Pakistani and Bangladeshi
populations. Bradford and Wakefield have the lowest life expectancies across
ethnic groups in West Yorkshire for both men and women.
5 Internal migration
This section examines the impact of internal migration on population change in
West Yorkshire in a little more detail. In the ten years prior to 2008, the NUTS2
region experienced a net loss of internal migrants in every year of the decade.
The level of this loss, however, has varied quite considerably. In volume terms,
the losses have been relatively low with a maximum loss of only around 4,000
migrants in 1999 and a minimum of some 800 migrants in 2005 (Figure 6a).
Expressed as a rate, these losses are also relatively low with a median rate of
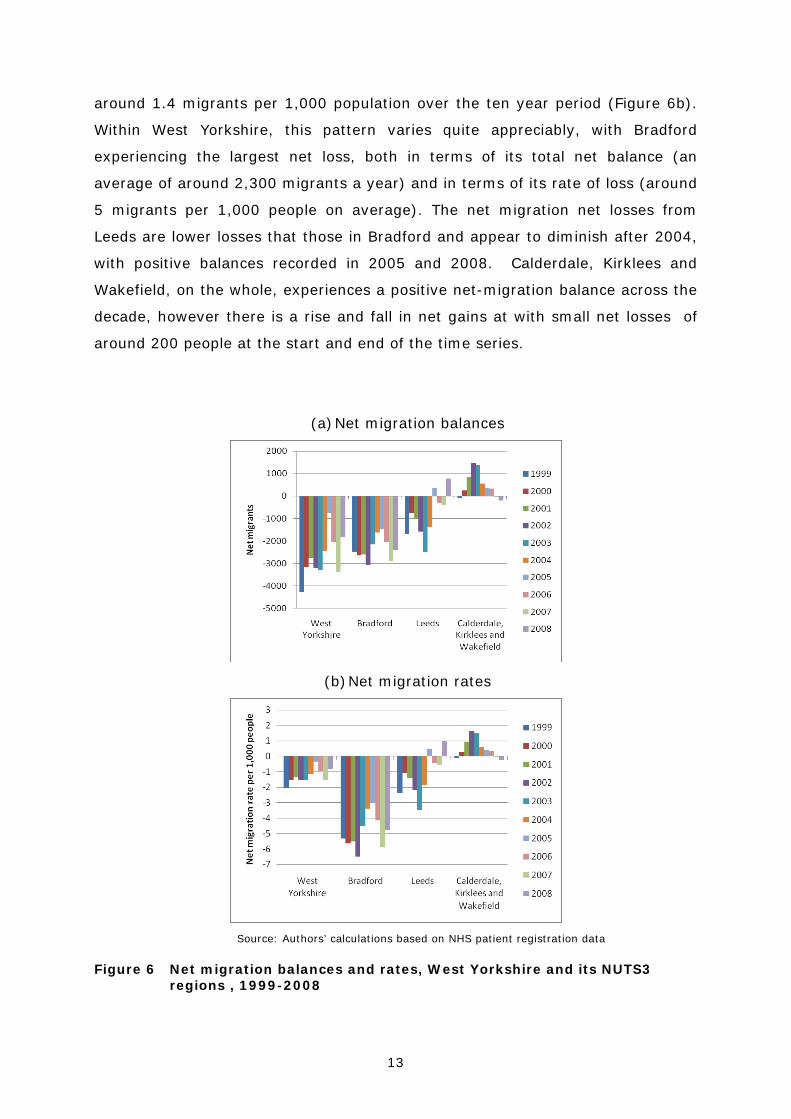
13
around 1.4 migrants per 1,000 population over the ten year period (Figure 6b).
Within West Yorkshire, this pattern varies quite appreciably, with Bradford
experiencing the largest net loss, both in terms of its total net balance (an
average of around 2,300 migrants a year) and in terms of its rate of loss (around
5 migrants per 1,000 people on average). The net migration net losses from
Leeds are lower losses that those in Bradford and appear to diminish after 2004,
with positive balances recorded in 2005 and 2008. Calderdale, Kirklees and
Wakefield, on the whole, experiences a positive net-migration balance across the
decade, however there is a rise and fall in net gains at with small net losses of
around 200 people at the start and end of the time series.
(a) Net migration balances
(b) Net migration rates
Source: Authors’ calculations based on NHS patient registration data
Figure 6 Net migration balances and rates, West Yorkshire and its NUTS3 regions , 1999-2008
14
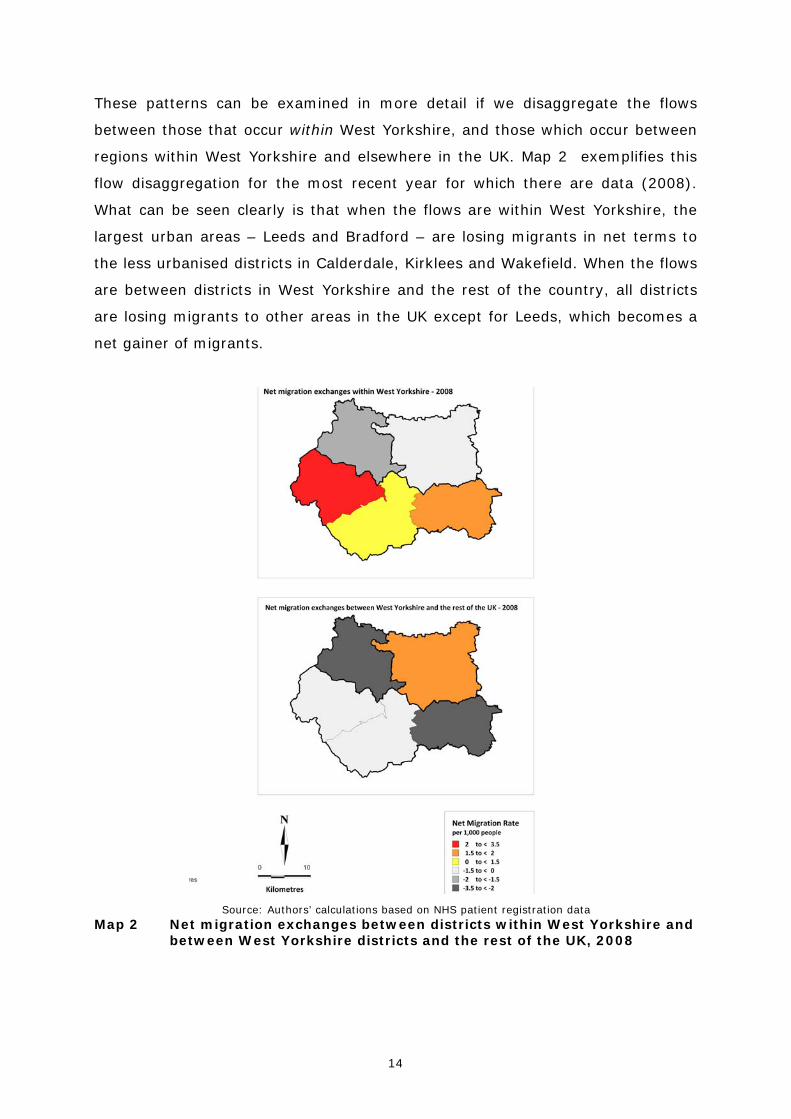
These patterns can be examined in more detail if we disaggregate the flows
between those that occur within West Yorkshire, and those which occur between
regions within West Yorkshire and elsewhere in the UK. Map 2 exemplifies this
flow disaggregation for the most recent year for which there are data (2008).
What can be seen clearly is that when the flows are within West Yorkshire, the
largest urban areas – Leeds and Bradford – are losing migrants in net terms to
the less urbanised districts in Calderdale, Kirklees and Wakefield. When the flows
are between districts in West Yorkshire and the rest of the country, all districts
are losing migrants to other areas in the UK except for Leeds, which becomes a
net gainer of migrants.
Source: Authors’ calculations based on NHS patient registration data
Map 2 Net migration exchanges between districts within West Yorkshire and between West Yorkshire districts and the rest of the UK, 2008

15
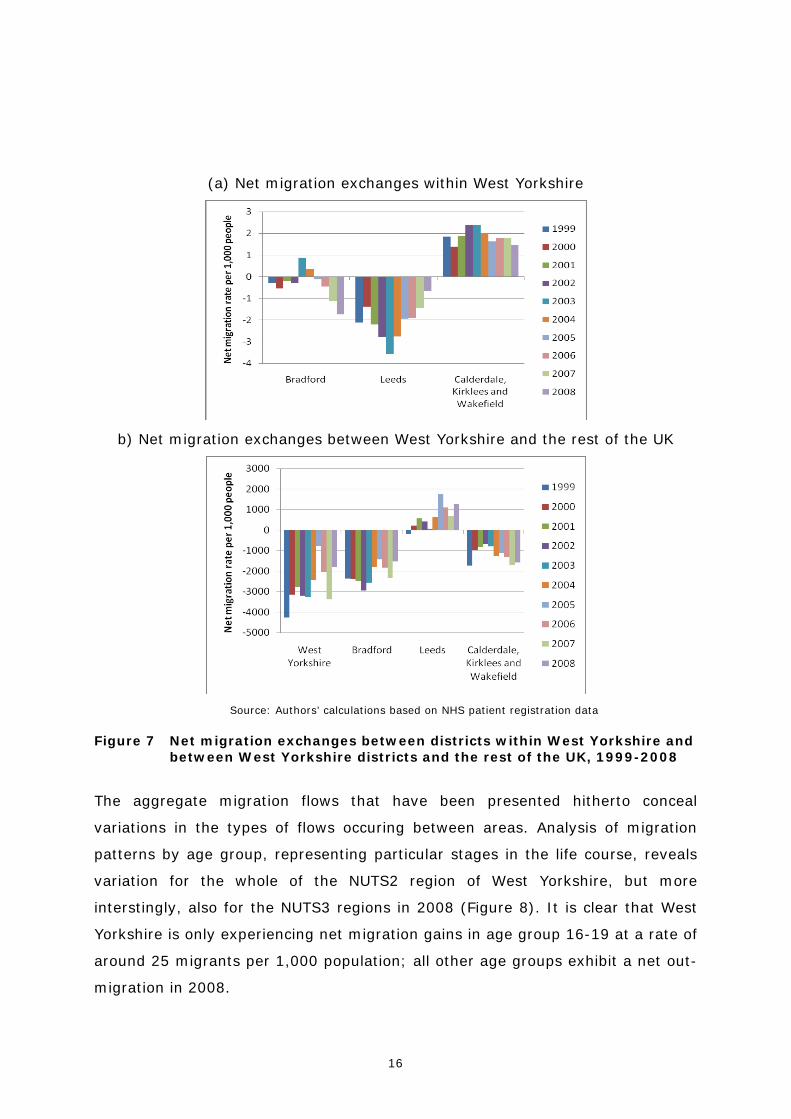
Figure 7 shows how this pattern varies over time. Calderdale, Kirklees and
Wakefield maintains a relatively constant level of net in-migration from the rest
of West Yorkshire and net out-migration to the rest of the UK over the decade
leading up to 2008. Bradford varies somewhat more, net migration losses to
other areas in West Yorkshire, except for in 2003 and 20004 when it experienced
a modest net gains. Bradford is a consistent net loser of population with the rest
of the country; however, the level of this net loss reduces towards 2008. Leeds is
the only region within West Yorkshire that experiences a net gain of migrants
from the rest of the UK. In 1999, it experienced a small net loss, but from 2000
onwards, there has been net migration gain from the rest of the UK. In contrast,
with the rest of West Yorkshire it has consistently been losing population,
although the rate of loss has varied, with a peak in 2004.
16
(a) Net migration exchanges within West Yorkshire
b) Net migration exchanges between West Yorkshire and the rest of the UK
Source: Authors’ calculations based on NHS patient registration data
Figure 7 Net migration exchanges between districts within West Yorkshire and between West Yorkshire districts and the rest of the UK, 1999-2008
The aggregate migration flows that have been presented hitherto conceal
variations in the types of flows occuring between areas. Analysis of migration
patterns by age group, representing particular stages in the life course, reveals
variation for the whole of the NUTS2 region of West Yorkshire, but more
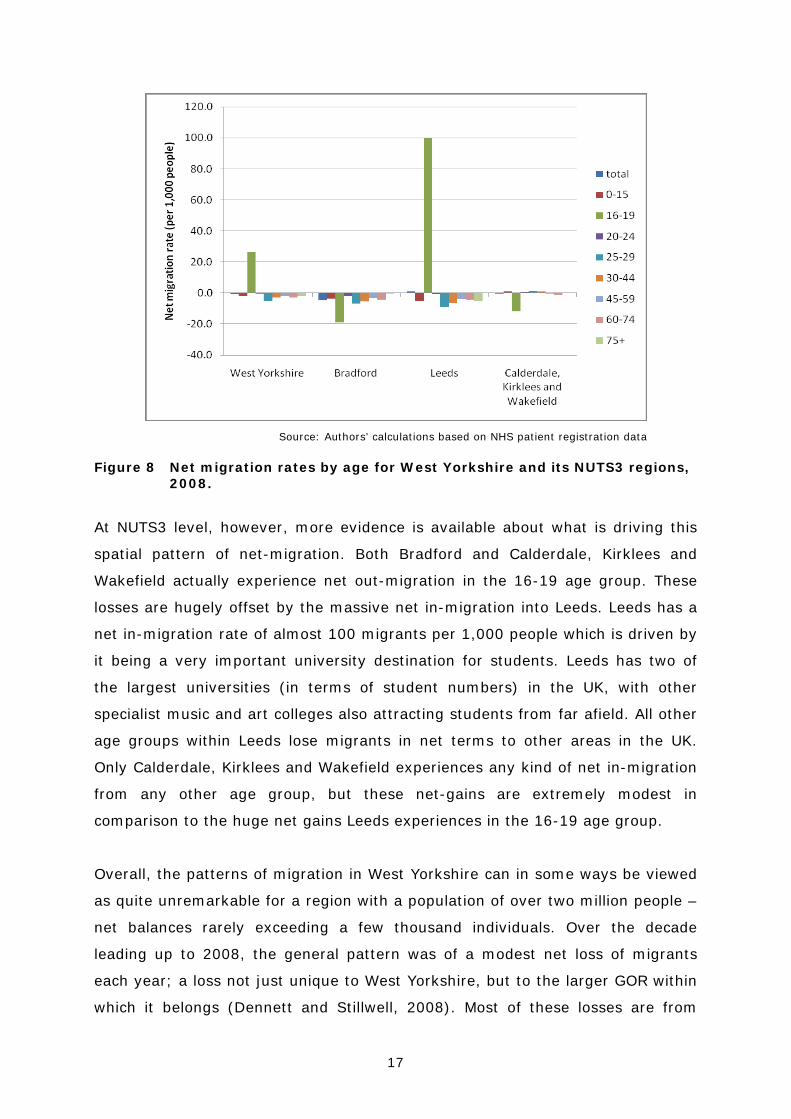
interstingly, also for the NUTS3 regions in 2008 (Figure 8). It is clear that West
Yorkshire is only experiencing net migration gains in age group 16-19 at a rate of
around 25 migrants per 1,000 population; all other age groups exhibit a net out-
migration in 2008.
17
Source: Authors’ calculations based on NHS patient registration data
Figure 8 Net migration rates by age for West Yorkshire and its NUTS3 regions, 2008.
At NUTS3 level, however, more evidence is available about what is driving this
spatial pattern of net-migration. Both Bradford and Calderdale, Kirklees and
Wakefield actually experience net out-migration in the 16-19 age group. These
losses are hugely offset by the massive net in-migration into Leeds. Leeds has a
net in-migration rate of almost 100 migrants per 1,000 people which is driven by
it being a very important university destination for students. Leeds has two of
the largest universities (in terms of student numbers) in the UK, with other
specialist music and art colleges also attracting students from far afield. All other
age groups within Leeds lose migrants in net terms to other areas in the UK.
Only Calderdale, Kirklees and Wakefield experiences any kind of net in-migration
from any other age group, but these net-gains are extremely modest in
comparison to the huge net gains Leeds experiences in the 16-19 age group.
Overall, the patterns of migration in West Yorkshire can in some ways be viewed
as quite unremarkable for a region with a population of over two million people –
net balances rarely exceeding a few thousand individuals. Over the decade
leading up to 2008, the general pattern was of a modest net loss of migrants
each year; a loss not just unique to West Yorkshire, but to the larger GOR within
which it belongs (Dennett and Stillwell, 2008). Most of these losses are from
18
Bradford, and to a lesser extent Leeds, with only Calderdale, Kirklees and
Wakefield experiencing a net gain, although this net gain is small even in
comparison with the small net-losses from the more urban regions. When only
the flows within the region are taken into consideration, the more urban regions
of Leeds and Bradford tend to lose to the less urban districts of Calderdale,
Kirklees and Wakefield although the major flows are between Leeds and Bradford
with Bradford being the district of net gain, as reported in Stillwell and Dennett
(2009). For flows between West Yorkshire and the rest of the country, however,
Leeds is the only district of net gain in the region, driven as we have seen, by
the huge inflows of young in-migrants to study at one of the large higher or
further education instituitons in the city. In fact, in a region which exhibits
relative low levels of internal migration, the huge net inflows of students into
Leeds stand out as a defining feature.
6 International migration
Since 2001, international migration has been a dominant driver of population
change yet because of the inadequacies of current data collection methods, it
remains the most difficult to estimate accurately. We have noted already that the
UK relies upon a combination of census and survey data to estimate immigration
and emigration flows at a local level. However, in the face of much public
scrutiny of its data and methods, ONS has begun to evaluate alternative
approaches to the measurement and estimation of international migration, with
administrative data sources now providing important information. Existing
approaches to estimation have been shown to be less than robust (Boden and
Rees, 2009) but these methods still underpin the population estimates produced
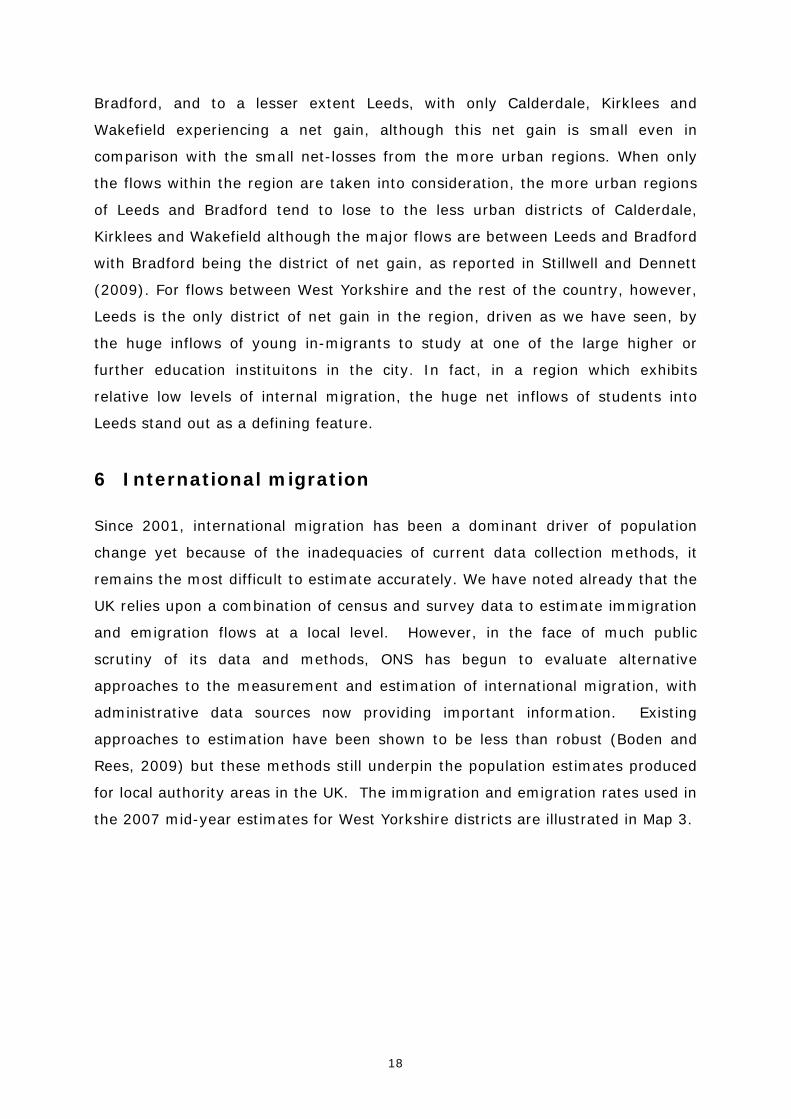
for local authority areas in the UK. The immigration and emigration rates used in
the 2007 mid-year estimates for West Yorkshire districts are illustrated in Map 3.
19
Source: ONS mid-year estimates
Map 3 Immigration and emigration rates, West Yorkshire districts, 2007
Over time, as in 2007, Leeds and Bradford have the highest immigration and
emigration rates, with the impact upon net migration flows illustrated in Figure
3.
To examine the robustness of estimates of international migration, ‘official’
estimates of immigration (migrants whose duration of stay is more than 12
months) can be compared with empirical evidence from alternative
administrative sources, most notably the registration of foreign nationals with a
General Practitioner (GP) and the registration of foreign workers for a National
Insurance Number (NINo). Both these administrative sources provide continuous
data capture, albeit for a different population to that captured by the ONS
estimates. GP registration is not compulsory and may not capture certain groups
of migrants, young males in particular. No length of stay information is captured
by the registration process and migrants are not required to de-register when
20
they leave the country. NINo registration captures workers only, excluding
students and dependents. Again length of stay is not recorded and de-
registration is not required. Despite these drawbacks, the two administrative
sources do provide a large sample of statistical evidence on migrant activity at a
local level that is based upon factual data and not on estimates derived from a
combination of national surveys and 2001 Census information.
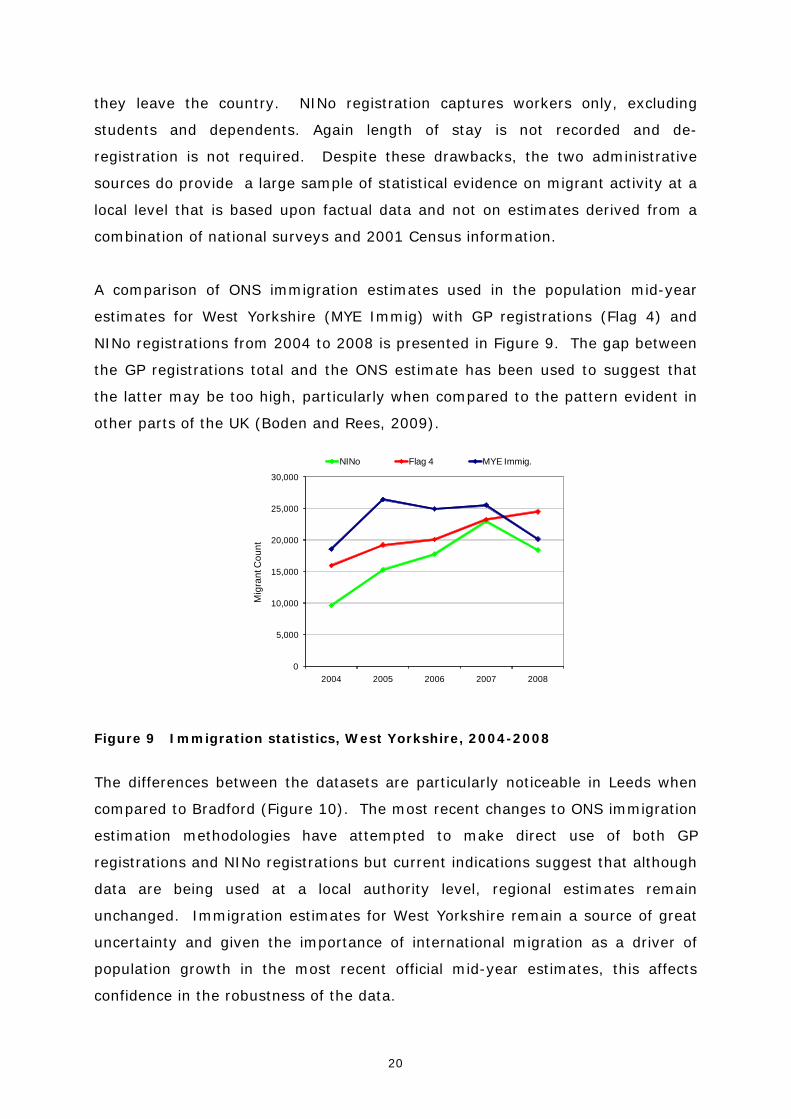
A comparison of ONS immigration estimates used in the population mid-year
estimates for West Yorkshire (MYE Immig) with GP registrations (Flag 4) and
NINo registrations from 2004 to 2008 is presented in Figure 9. The gap between
the GP registrations total and the ONS estimate has been used to suggest that
the latter may be too high, particularly when compared to the pattern evident in
other parts of the UK (Boden and Rees, 2009).
0
5,000
10,000
15,000
20,000
25,000
30,000
2004 2005 2006 2007 2008
Mig
rant
Cou
nt
NINo Flag 4 MYE Immig.
Figure 9 Immigration statistics, West Yorkshire, 2004-2008
The differences between the datasets are particularly noticeable in Leeds when
compared to Bradford (Figure 10). The most recent changes to ONS immigration
estimation methodologies have attempted to make direct use of both GP
registrations and NINo registrations but current indications suggest that although
data are being used at a local authority level, regional estimates remain
unchanged. Immigration estimates for West Yorkshire remain a source of great
uncertainty and given the importance of international migration as a driver of
population growth in the most recent official mid-year estimates, this affects
confidence in the robustness of the data.

21
0
2,000
4,000
6,000
8,000
10,000
12,000
14,000
16,000
2004 2005 2006 2007 2008
Mig
rant
Cou
nt
NINo Flag 4 MYE Immig.
0
2,000
4,000
6,000
8,000
10,000
12,000
14,000
16,000
2004 2005 2006 2007 2008
Mig
rant
Cou
ntNINo Flag 4 MYE Immig.
Figure 10 Immigration statistics, Leeds and Bradford, 2004-2008
NINo statistics provide an interesting, alternative picture of immigration in the
UK, despite the inability to measure length of stay and the corresponding process
of emigration. After EU expansion in 2004, there was a surge of in-migration
from Accession states, supplementing the existing non-Accession migrant
streams (Figure 11). It is interesting to see that the latter have remained
relatively stable since 2004 as Accession flows have peaked and then fallen
sharply in 2008. New Commonwealth flows are a particular feature of the
established immigration streams into the existing communities in Bradford,
Kirklees and Leeds.
-
2,000
4,000
6,000
8,000
10,000
12,000
14,000
2004 2005 2006 2007 2008
NIN
o R
egis
tratio
ns
Accession Other EuropeOld Commonwealth New CommonwealthOther
0
5,000
10,000
15,000
20,000
25,000
2004 2005 2006 2007 2008
NIN
o R
egis
tratio
ns
Total Accession Non-Accession
Figure 11 NINo registration profile, West Yorkshire, 2004-2008
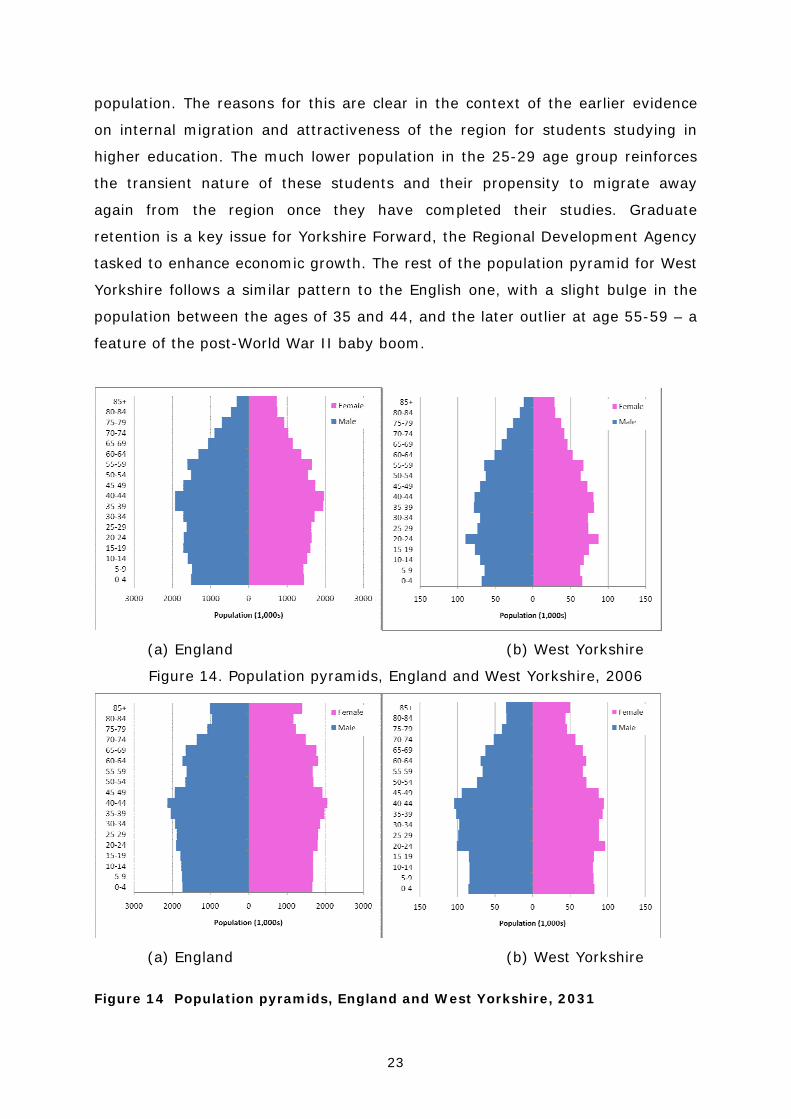
The West Yorkshire pattern is reflected in both Leeds and Bradford, although
non-Accession flows to Leeds have remained higher than Accession flows since
2004 (Figure 12). In Bradford, the level of Accession and non-Accession migrant
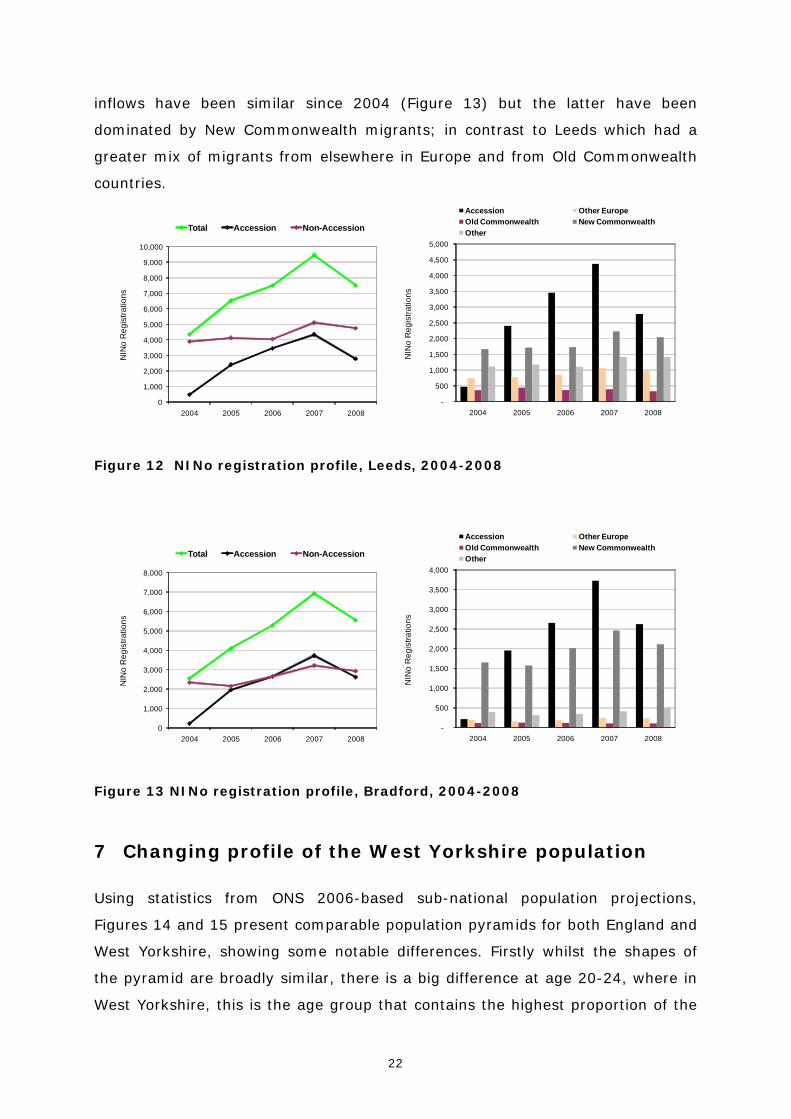
22
inflows have been similar since 2004 (Figure 13) but the latter have been
dominated by New Commonwealth migrants; in contrast to Leeds which had a
greater mix of migrants from elsewhere in Europe and from Old Commonwealth
countries.
-
500
1,000
1,500
2,000
2,500
3,000
3,500
4,000
4,500
5,000
2004 2005 2006 2007 2008N
INo
Reg
istra
tions
Accession Other EuropeOld Commonwealth New CommonwealthOther
0
1,000
2,000
3,000
4,000
5,000
6,000
7,000
8,000
9,000
10,000
2004 2005 2006 2007 2008
NIN
o R
egis
tratio
ns
Total Accession Non-Accession
Figure 12 NINo registration profile, Leeds, 2004-2008
-
500
1,000
1,500
2,000
2,500
3,000
3,500
4,000
2004 2005 2006 2007 2008
NIN
o R
egis
tratio
ns
Accession Other EuropeOld Commonwealth New CommonwealthOther
0
1,000
2,000
3,000
4,000
5,000
6,000
7,000
8,000
2004 2005 2006 2007 2008
NIN
o R
egis
tratio
ns
Total Accession Non-Accession
Figure 13 NINo registration profile, Bradford, 2004-2008
7 Changing profile of the West Yorkshire population
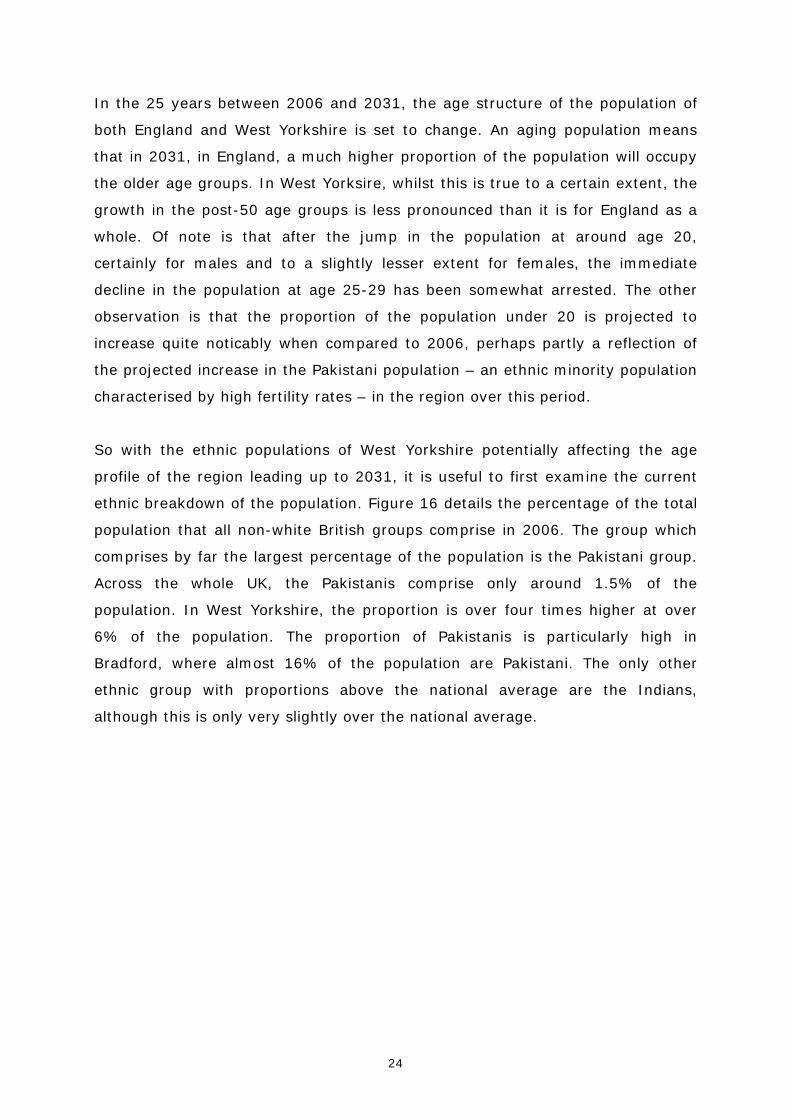
Using statistics from ONS 2006-based sub-national population projections,
Figures 14 and 15 present comparable population pyramids for both England and
West Yorkshire, showing some notable differences. Firstly whilst the shapes of
the pyramid are broadly similar, there is a big difference at age 20-24, where in
West Yorkshire, this is the age group that contains the highest proportion of the
23
population. The reasons for this are clear in the context of the earlier evidence
on internal migration and attractiveness of the region for students studying in
higher education. The much lower population in the 25-29 age group reinforces
the transient nature of these students and their propensity to migrate away
again from the region once they have completed their studies. Graduate
retention is a key issue for Yorkshire Forward, the Regional Development Agency
tasked to enhance economic growth. The rest of the population pyramid for West
Yorkshire follows a similar pattern to the English one, with a slight bulge in the
population between the ages of 35 and 44, and the later outlier at age 55-59 – a
feature of the post-World War II baby boom.
(a) England (b) West Yorkshire
Figure 14. Population pyramids, England and West Yorkshire, 2006
(a) England (b) West Yorkshire
Figure 14 Population pyramids, England and West Yorkshire, 2031
24
In the 25 years between 2006 and 2031, the age structure of the population of
both England and West Yorkshire is set to change. An aging population means
that in 2031, in England, a much higher proportion of the population will occupy
the older age groups. In West Yorksire, whilst this is true to a certain extent, the
growth in the post-50 age groups is less pronounced than it is for England as a
whole. Of note is that after the jump in the population at around age 20,
certainly for males and to a slightly lesser extent for females, the immediate
decline in the population at age 25-29 has been somewhat arrested. The other
observation is that the proportion of the population under 20 is projected to
increase quite noticably when compared to 2006, perhaps partly a reflection of
the projected increase in the Pakistani population – an ethnic minority population
characterised by high fertility rates – in the region over this period.
So with the ethnic populations of West Yorkshire potentially affecting the age
profile of the region leading up to 2031, it is useful to first examine the current
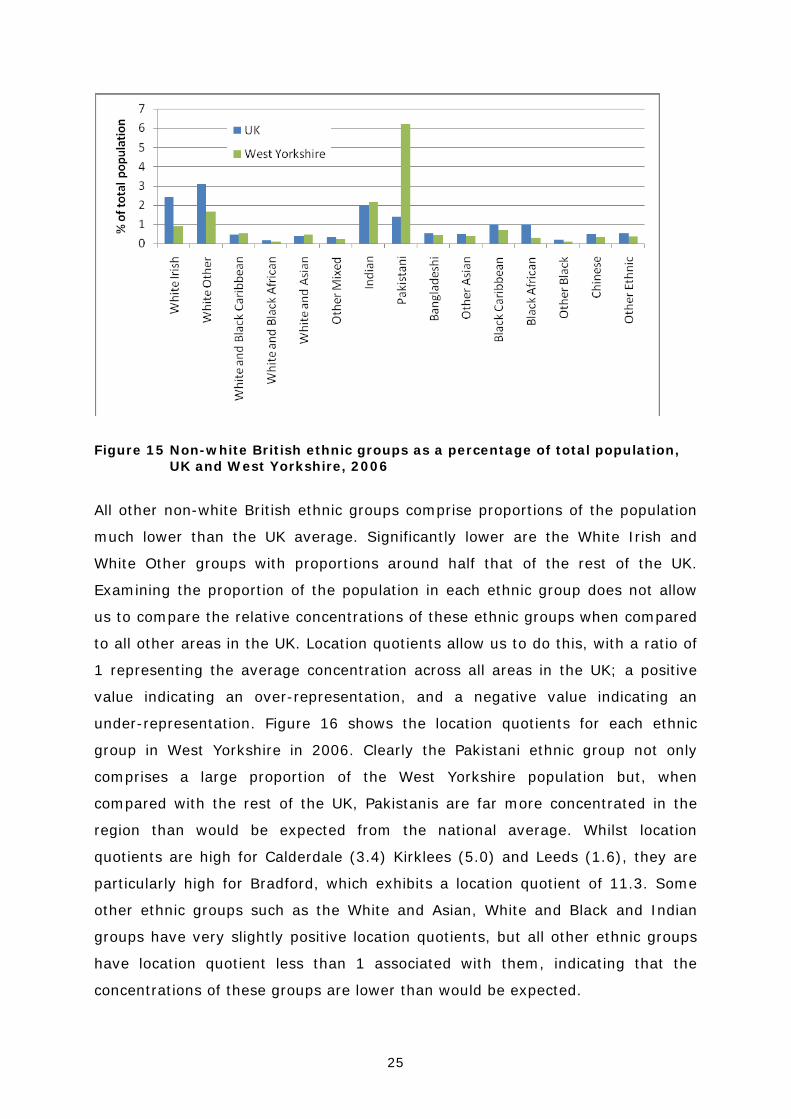
ethnic breakdown of the population. Figure 16 details the percentage of the total
population that all non-white British groups comprise in 2006. The group which
comprises by far the largest percentage of the population is the Pakistani group.
Across the whole UK, the Pakistanis comprise only around 1.5% of the
population. In West Yorkshire, the proportion is over four times higher at over
6% of the population. The proportion of Pakistanis is particularly high in
Bradford, where almost 16% of the population are Pakistani. The only other
ethnic group with proportions above the national average are the Indians,
although this is only very slightly over the national average.
25
Figure 15 Non-white British ethnic groups as a percentage of total population, UK and West Yorkshire, 2006
All other non-white British ethnic groups comprise proportions of the population
much lower than the UK average. Significantly lower are the White Irish and
White Other groups with proportions around half that of the rest of the UK.
Examining the proportion of the population in each ethnic group does not allow
us to compare the relative concentrations of these ethnic groups when compared
to all other areas in the UK. Location quotients allow us to do this, with a ratio of
1 representing the average concentration across all areas in the UK; a positive
value indicating an over-representation, and a negative value indicating an
under-representation. Figure 16 shows the location quotients for each ethnic
group in West Yorkshire in 2006. Clearly the Pakistani ethnic group not only
comprises a large proportion of the West Yorkshire population but, when
compared with the rest of the UK, Pakistanis are far more concentrated in the
region than would be expected from the national average. Whilst location
quotients are high for Calderdale (3.4) Kirklees (5.0) and Leeds (1.6), they are
particularly high for Bradford, which exhibits a location quotient of 11.3. Some
other ethnic groups such as the White and Asian, White and Black and Indian
groups have very slightly positive location quotients, but all other ethnic groups
have location quotient less than 1 associated with them, indicating that the
concentrations of these groups are lower than would be expected.

26
Figure 16 Location quotients for ethnic groups, West Yorkshire, 2006
Another metric which is useful in the study of ethnic group populations is the
index of diversity. Rather than measuring the concentration of the ethnic group,
the index of diversity measures how mixed an area is, i.e. the likelihood that two
people who bumped into each other in the street in an area would differ by
ethnicity. An index value of 1 would mean that it is 100% likely that they would
differ; a value of 0 means that it is 100% likely they will not differ. Of course,
with large areas, the indices close to 1 or 0 will not occur. In 2006, the index of
diversity for the whole of the UK was 0.27 – in West Yorkshire the figure was
0.27 as well, indicating that the region lies on the national average for diversity.
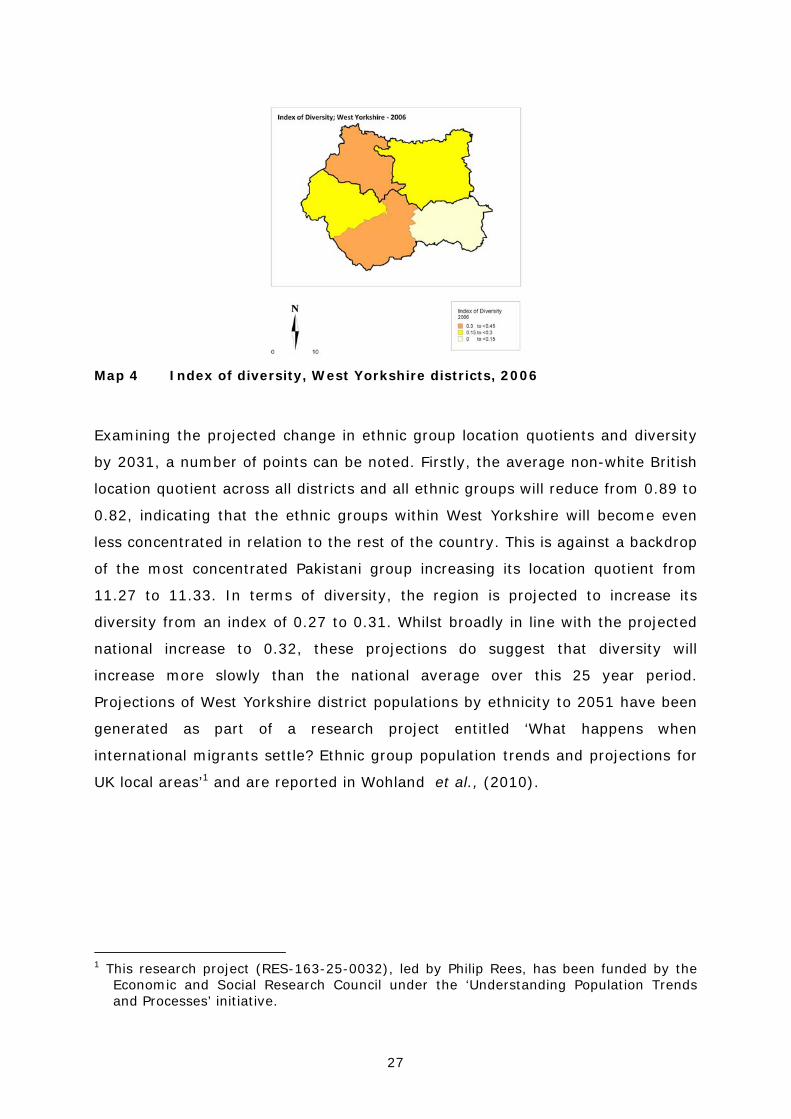
Of course, within the region, diversity varies quite considerably (Map 4), with
Wakefield being the least diverse district with a diversity index of only 0.07
compared to Bradford which exhibits a diversity index of 0.44. Surprisingly,
Leeds, despite being the largest city in the region, has a diversity index which is
lower than the UK average at 0.22.
27
Map 4 Index of diversity, West Yorkshire districts, 2006
Examining the projected change in ethnic group location quotients and diversity
by 2031, a number of points can be noted. Firstly, the average non-white British
location quotient across all districts and all ethnic groups will reduce from 0.89 to
0.82, indicating that the ethnic groups within West Yorkshire will become even
less concentrated in relation to the rest of the country. This is against a backdrop
of the most concentrated Pakistani group increasing its location quotient from
11.27 to 11.33. In terms of diversity, the region is projected to increase its
diversity from an index of 0.27 to 0.31. Whilst broadly in line with the projected
national increase to 0.32, these projections do suggest that diversity will
increase more slowly than the national average over this 25 year period.
Projections of West Yorkshire district populations by ethnicity to 2051 have been
generated as part of a research project entitled ‘What happens when
international migrants settle? Ethnic group population trends and projections for
UK local areas’1 and are reported in Wohland et al., (2010).
1 This research project (RES-163-25-0032), led by Philip Rees, has been funded by the
Economic and Social Research Council under the ‘Understanding Population Trends and Processes’ initiative.
28
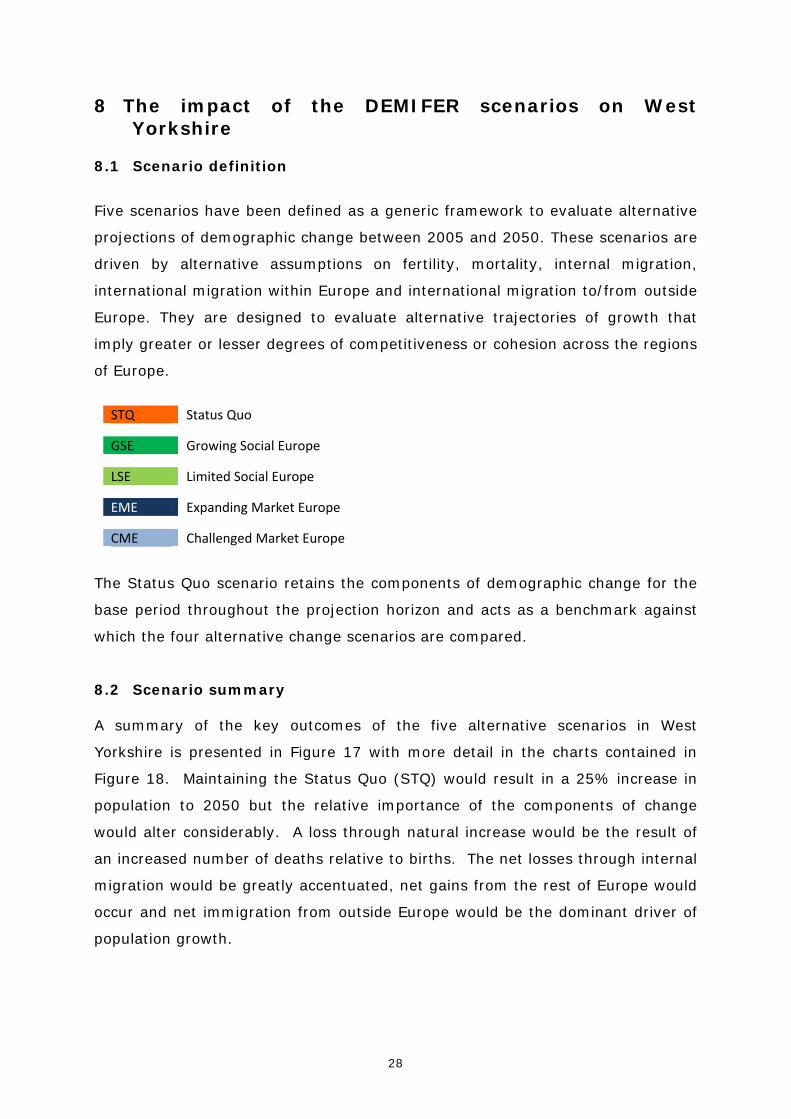
8 The impact of the DEMIFER scenarios on West Yorkshire
8.1 Scenario definition
Five scenarios have been defined as a generic framework to evaluate alternative
projections of demographic change between 2005 and 2050. These scenarios are
driven by alternative assumptions on fertility, mortality, internal migration,
international migration within Europe and international migration to/from outside
Europe. They are designed to evaluate alternative trajectories of growth that
imply greater or lesser degrees of competitiveness or cohesion across the regions
of Europe.
STQ Status Quo
GSE Growing Social Europe
LSE Limited Social Europe
EME Expanding Market Europe
CME Challenged Market Europe
The Status Quo scenario retains the components of demographic change for the
base period throughout the projection horizon and acts as a benchmark against
which the four alternative change scenarios are compared.
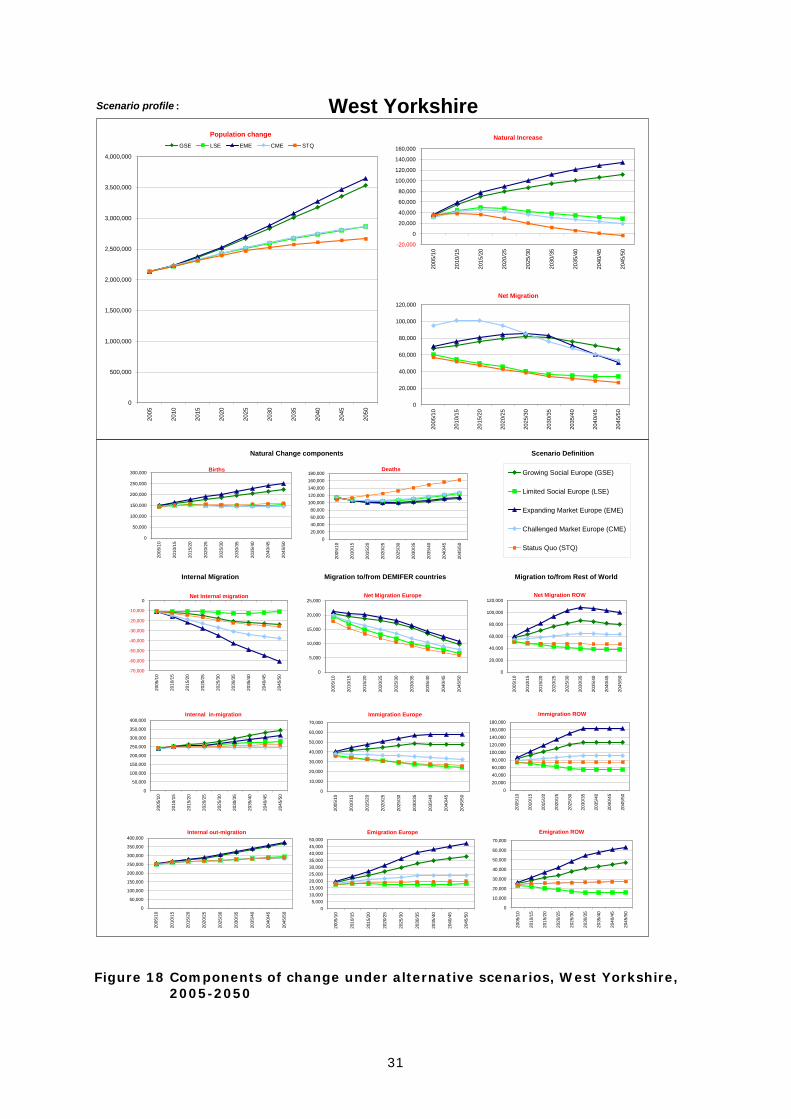
8.2 Scenario summary A summary of the key outcomes of the five alternative scenarios in West
Yorkshire is presented in Figure 17 with more detail in the charts contained in
Figure 18. Maintaining the Status Quo (STQ) would result in a 25% increase in
population to 2050 but the relative importance of the components of change
would alter considerably. A loss through natural increase would be the result of
an increased number of deaths relative to births. The net losses through internal
migration would be greatly accentuated, net gains from the rest of Europe would
occur and net immigration from outside Europe would be the dominant driver of
population growth.

29
Population change 2005-2050
Components of change 2005/10 2045/50 2005/10 2045/50 2005/10 2045/50 2005/10 2045/50 2005/10 2045/50
Natural Increase 35,821 -2,959 34,541 111,393 31,697 28,159 35,940 134,264 30,925 18,854
Net Internal -10,602 -25,656 -10,877 -23,808 -10,624 -11,069 -11,025 -60,484 -10,762 -37,453
Net Europe 17,774 5,778 20,527 9,808 19,366 6,685 21,177 10,666 19,989 7,901
Net External 49,843 46,566 57,406 80,333 51,524 38,520 60,307 100,325 54,378 63,813
All components 92,836 23,729 101,597 177,726 91,963 62,295 106,399 184,771 94,530 53,115
66% 35% 71% 34%
GSE LSE EME CMESTQ
25%
Figure 17 Scenario summary, West Yorkshire, 2005-2050
The ‘Social Europe’ scenarios imply greater cohesiveness across the European
regions with more convergence on fertility and mortality inequalities and a more
balanced attractiveness of individual regions as migrant destinations. The
Growing Social Europe (GSE) scenario achieves 66% population growth in 2005-
2050. High fertility results in an increasing number of births and a significant
contribution to growth through natural increase. Net internal migration losses
occur despite greater convergence being achieved between the relative
attractiveness of UK destinations. Migration to and from Europe continues to
increase throughout the projection period but the net impact is gradually
reduced. Net immigration from outside Europe remains a dominant driver of
growth throughout.
With a smaller increase in fertility, the Limited Social Europe (LSE) scenario
results in less significant growth to 2050 (35%) compared to GSE, and a reduced
influence of natural increase as a component of this growth. Net out-migration to
other regions of the UK remains stable throughout the projection period. Net
immigration both from within Europe and from outside Europe remain as key
drivers of growth although the volume is reduced from the base period due to
lower inflows.
The ‘Market Europe’ scenarios imply greater competitiveness between European
regions. The Expanding Market Europe (EME) scenario achieves the most
substantial population growth (71%) over the projection period but results in a
substantial and increasing net loss through internal migration as West Yorkshire
loses out to more attractive regional destinations. Population growth is driven by
very high net immigration from within and outside Europe, which in turn fuels a
large increase in the number of births to the more youthful migrant population.
30
The EME scenario presents a diluted version of the Status Quo scenario with an
increasingly diverse population resulting from the high net migration from abroad
and continued net loss through internal migration.
The Challenged Market Europe (CME) scenario achieves less significant growth to
2050 (34%) than the EME scenario. The retention of mortality and fertility
inequalities significantly reduces the impact of natural change. Net losses
through internal migration are significant as the competitive nature of regions
draws migrants away from West Yorkshire. Net immigration is the dominant
driver of growth, primarily from outside Europe.
31
Scenario profile :
Scenario Definition
West Yorkshire
Internal Migration Migration to/from DEMIFER countries Migration to/from Rest of World
Natural Change components
Population change
0
500,000
1,000,000
1,500,000
2,000,000
2,500,000
3,000,000
3,500,000
4,000,00020
05
2010
2015
2020
2025
2030
2035
2040
2045
2050
GSE LSE EME CME STQNatural Increase
-20,000
0
20,000
40,000
60,000
80,000
100,000
120,000
140,000
160,000
2005
/10
2010
/15
2015
/20
2020
/25
2025
/30
2030
/35
2035
/40
2040
/45
2045
/50
Net Migration
0
20,000
40,000
60,000
80,000
100,000
120,000
2005
/10
2010
/15
2015
/20
2020
/25
2025
/30
2030
/35
2035
/40
2040
/45
2045
/50
Births
0
50,000
100,000
150,000
200,000
250,000
300,000
2005
/10
2010
/15
2015
/20
2020
/25
2025
/30
2030
/35
2035
/40
2040
/45
2045
/50
Deaths
020,00040,00060,00080,000
100,000120,000140,000160,000180,000
2005
/10
2010
/15
2015
/20
2020
/25
2025
/30
2030
/35
2035
/40
2040
/45
2045
/50
Growing Social Europe (GSE)
Limited Social Europe (LSE)
Expanding Market Europe (EME)
Challenged Market Europe (CME)
Status Quo (STQ)
Net Internal migration
-70,000
-60,000
-50,000
-40,000
-30,000
-20,000
-10,000
0
2005
/10
2010
/15
2015
/20
2020
/25
2025
/30
2030
/35
2035
/40
2040
/45
2045
/50
Net Migration Europe
0
5,000
10,000
15,000
20,000
25,000
2005
/10
2010
/15
2015
/20
2020
/25
2025
/30
2030
/35
2035
/40
2040
/45
2045
/50
Net Migration ROW
0
20,000
40,000
60,000
80,000
100,000
120,000
2005
/10
2010
/15
2015
/20
2020
/25
2025
/30
2030
/35
2035
/40
2040
/45
2045
/50
Internal in-migration
0
50,000
100,000
150,000
200,000
250,000
300,000
350,000
400,000
2005
/10
2010
/15
2015
/20
2020
/25
2025
/30
2030
/35
2035
/40
2040
/45
2045
/50
Internal out-migration
0
50,000
100,000
150,000
200,000
250,000
300,000
350,000
400,000
2005
/10
2010
/15
2015
/20
2020
/25
2025
/30
2030
/35
2035
/40
2040
/45
2045
/50
Immigration Europe
0
10,000
20,000
30,000
40,000
50,000
60,000
70,000
2005
/10
2010
/15
2015
/20
2020
/25
2025
/30
2030
/35
2035
/40
2040
/45
2045
/50
Emigration Europe
05,000
10,00015,00020,00025,00030,00035,00040,00045,00050,000
2005
/10
2010
/15
2015
/20
2020
/25
2025
/30
2030
/35
2035
/40
2040
/45
2045
/50
Immigration ROW
020,00040,00060,00080,000
100,000120,000140,000160,000180,000
2005
/10
2010
/15
2015
/20
2020
/25
2025
/30
2030
/35
2035
/40
2040
/45
2045
/50
Emigration ROW
0
10,000
20,000
30,000
40,000
50,000
60,000
70,000
2005
/10
2010
/15
2015
/20
2020
/25
2025
/30
2030
/35
2035
/40
2040
/45
2045
/50
Figure 18 Components of change under alternative scenarios, West Yorkshire, 2005-2050
32
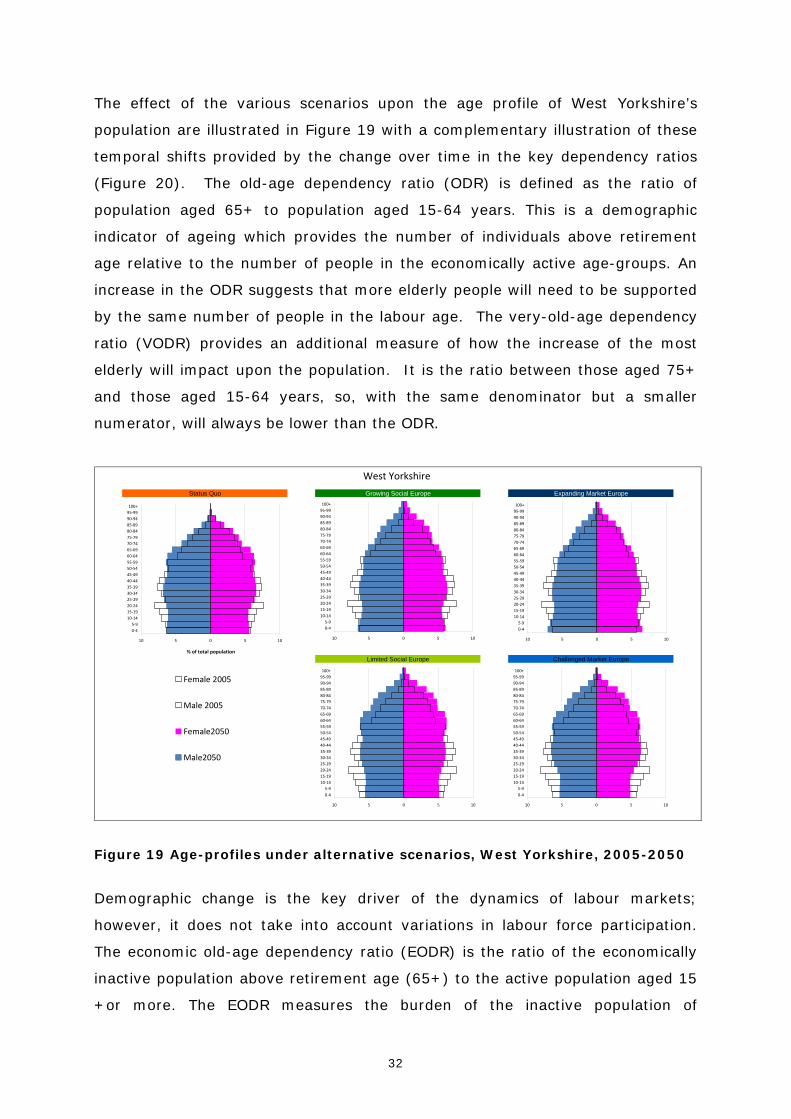
The effect of the various scenarios upon the age profile of West Yorkshire’s
population are illustrated in Figure 19 with a complementary illustration of these
temporal shifts provided by the change over time in the key dependency ratios
(Figure 20). The old-age dependency ratio (ODR) is defined as the ratio of
population aged 65+ to population aged 15-64 years. This is a demographic
indicator of ageing which provides the number of individuals above retirement
age relative to the number of people in the economically active age-groups. An
increase in the ODR suggests that more elderly people will need to be supported
by the same number of people in the labour age. The very-old-age dependency
ratio (VODR) provides an additional measure of how the increase of the most
elderly will impact upon the population. It is the ratio between those aged 75+
and those aged 15-64 years, so, with the same denominator but a smaller
numerator, will always be lower than the ODR.
Limited Social Europe Challenged Market Europe
West Yorkshire
Status Quo Growing Social Europe Expanding Market Europe
10 5 0 5 10
0‐45‐9
10‐1415‐1920‐2425‐2930‐3435‐3940‐4445‐4950‐5455‐5960‐6465‐6970‐7475‐7980‐8485‐8990‐9495‐99100+
10 5 0 5 10
0‐45‐9
10‐1415‐1920‐2425‐2930‐3435‐3940‐4445‐4950‐5455‐5960‐6465‐6970‐7475‐7980‐8485‐8990‐9495‐99100+
10 5 0 5 10
0‐45‐9
10‐1415‐1920‐2425‐2930‐3435‐3940‐4445‐4950‐5455‐5960‐6465‐6970‐7475‐7980‐8485‐8990‐9495‐99100+
10 5 0 5 10
0‐45‐9
10‐1415‐1920‐2425‐2930‐3435‐3940‐4445‐4950‐5455‐5960‐6465‐6970‐7475‐7980‐8485‐8990‐9495‐99100+
10 5 0 5 10
0‐45‐9
10‐1415‐1920‐2425‐2930‐3435‐3940‐4445‐4950‐5455‐5960‐6465‐6970‐7475‐7980‐8485‐8990‐9495‐99100+
% of total population
Female 2005
Male 2005
Female2050
Male2050
Figure 19 Age-profiles under alternative scenarios, West Yorkshire, 2005-2050
Demographic change is the key driver of the dynamics of labour markets;
however, it does not take into account variations in labour force participation.
The economic old-age dependency ratio (EODR) is the ratio of the economically
inactive population above retirement age (65+) to the active population aged 15
+or more. The EODR measures the burden of the inactive population of
33
pensionable age on the working population and is an indicator that could be used
to assess the sustainability of state pension systems.
Finally, the labour market dependency ratio (LMDR) is defined as the ratio of the
total economically inactive population to the total active population. This
indicator measures the overall economic burden of the inactive population on the
labour market. The LMDR value depends not only on the size of the retired
population, but also on the labour market participation of young people who may
be in higher education rather than actively employed in the labour force.
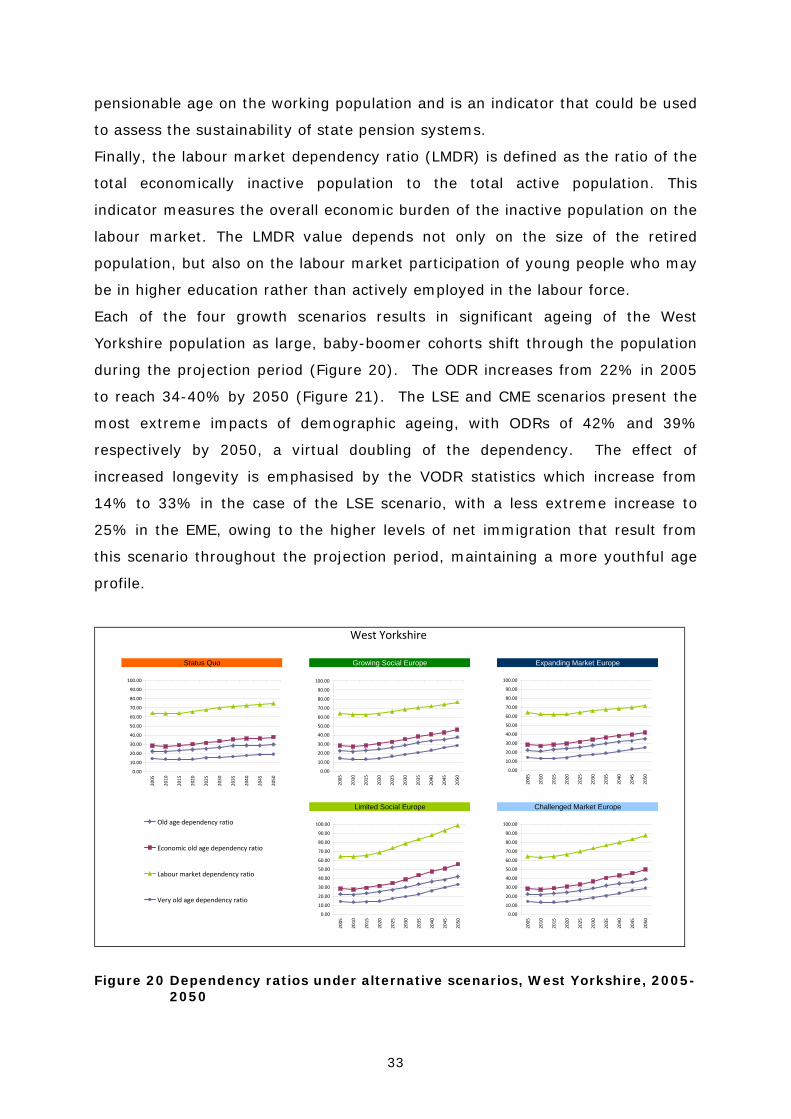
Each of the four growth scenarios results in significant ageing of the West
Yorkshire population as large, baby-boomer cohorts shift through the population
during the projection period (Figure 20). The ODR increases from 22% in 2005
to reach 34-40% by 2050 (Figure 21). The LSE and CME scenarios present the
most extreme impacts of demographic ageing, with ODRs of 42% and 39%
respectively by 2050, a virtual doubling of the dependency. The effect of
increased longevity is emphasised by the VODR statistics which increase from
14% to 33% in the case of the LSE scenario, with a less extreme increase to
25% in the EME, owing to the higher levels of net immigration that result from
this scenario throughout the projection period, maintaining a more youthful age
profile.
West Yorkshire
Status Quo Growing Social Europe Expanding Market Europe
Limited Social Europe Challenged Market Europe
0.00
10.00
20.00
30.00
40.00
50.00
60.00
70.00
80.00
90.00
100.00
2005
2010
2015
2020
2025
2030
2035
2040
2045
2050
Old age dependency ratio
Economic old age dependency ratio
Labour market dependency ratio
Very old age dependency ratio
0.00
10.00
20.00
30.00
40.00
50.00
60.00
70.00
80.00
90.00
100.00
2005
2010
2015
2020
2025
2030
2035
2040
2045
2050
0.00
10.00
20.00
30.00
40.00
50.00
60.00
70.00
80.00
90.00
100.00
2005
2010
2015
2020
2025
2030
2035
2040
2045
2050
0.00
10.00
20.00
30.00
40.00
50.00
60.00
70.00
80.00
90.00
100.00
2005
2010
2015
2020
2025
2030
2035
2040
2045
2050
0.00
10.00
20.00
30.00
40.00
50.00
60.00
70.00
80.00
90.00
100.00
2005
2010
2015
2020
2025
2030
2035
2040
2045
2050
Figure 20 Dependency ratios under alternative scenarios, West Yorkshire, 2005-2050
34
The LMDR provides a more effective illustration of the effect of demographic
ageing through the application of participation rates that might result from
alternative scenarios of competitiveness or cohesion. In a Limited Social Europe
(LSE) and a Challenged Market Europe (CME) with lower rates of labour force
participation, the level of dependency rises most sharply, approaching 100% in
the case of LSE, from a base of 64% in 2005. This means that the size of the
active labour force would be equal in size to the dependent population, taking
into account inactivity in the labour force ages, including students, in addition to
the inactivity of the elderly. With higher levels of particpation in the GSE and
EME scenarios, LMDR are maintained below 80%, lowest for the more
competitive Expanding Market Europe scenario. All of these labour force patterns
displayed in West Yorkshire, are broadly in line with the patterns shown in the
rest of the UK.
9 Summary comments Located in the north of England, 200 miles north of London, West Yorkshire
appears as a ‘peripheral’ region on the European map but it remains an
important commercial hub with Leeds as a key node in the UK’s economy.
However, with the largest financial services industry outside London, Leeds will
continue to feel the impact of the economic recession well into 2011 and
Yorkshire’s latest jobless statistics suggest that the region as a whole, along with
the West Midlands, is suffering the highest rates of unemployment in the UK.
Most areas of the region, including West Yorkshire, are more dependent on
publicly funded employment than the national average; consequently, the public
expenditure cuts announced in the 2008 and 2009 budgets, together with more
recent announcements by the new Coalition Government, will have huge labour
market implications and represent one of the key future challenges (Homer et
al., 2010).
Leeds and Bradford provide two very contrasting sub-areas within West
Yorkshire. Leeds has a very large student population and in the last twenty
years has attracted significant investment to develop its retail centre, expand
residential accommodation in and around its central business district and to
35
generally benefit from sustained economic growth prior to the credit crunch
(Unsworth and Stillwell, 2004). The diversity of its service economy and a
relatively small percentage of workers within the public sector compared to other
regions will assist its economic recovery.
Bradford, in contrast, has suffered through lack of investment. Its city centre re-
development plans have been put on ice leaving a large un-developed hole in the
heart of the city that is symptomatic of its current economic position. It remains
in the shadow of Leeds and continues to experience significant net out-migration
through internal migration, particularly to adjacent areas in Leeds, Calderdale,
Kirklees and Wakefield. This net outflow is balanced by a large net inflow due to
international migration that continues to enhance one of the largest
concentrations of Asians s in the country.
In a more competitive market economy West Yorkshire as a region is likely to
experience mixed benefits, with the local dominance of Leeds being the magnet
for investment and growth. But Leeds, like most other UK cities is fast reaching
its capacity in terms of the road traffic that it can accommodate and it is faced
with challenging new targets for new housing developments that are designed to
meet a growing population. Given the proposed abolition of regional spatial
strategies by the Coalition Government, a strategy that positions Leeds within a
wider ‘City Region’ is emerging that will enable a more spatially integrated
approach to economic development, address the much needed enhancements to
public transport infrastructure and the need to provide adequate market and
affordable housing to a growing population. A more cohesive market economy,
which seeks to reduce economic and demographic inequalities between regions,
is a challenging scenario, particularly in a region like West Yorkshire with such
diversity within its borders. The Northern Way initiative, has brought the three
regions of the north of England (North East, North West and Yorkshire and
Humber) together to facilitate a more ‘cohesive’ approach to economic
development (Gonzalez, 2006) but it again is faced with a network of cities which
see themselves very much in competition with each other and sub-regions which
demonstrate huge spatial inequalities and significant demographic diversity.
36
9.1 Abbreviations ASFR Age Specific Fertility Rate
CLG Communities and Local Government
DEMIFER Demographic and Migratory Flows affecting European
Regions and Cities
DWP Department for Works and Pensions
EU European Union
GAD Government Actuary Department
GOR Government Office Regions
LLTI Limiting Long-Term Illness
LSOA Lower Super Output Area
NPP National Population Projections
NUTS2 Nomenclature of Territorial Units for Statistics, level 2
OAD Old Age Dependency (ratio)
ONS Office for National Statistics
PBS Points Based System
SMR Standardised Mortality Ratios
SNPP Sub-national Population Projections
SPA State Pension Age
TFR Total Fertility Rate
37
9.2 References
Audit Commission (2007) Crossing borders. Responding to the local challenges of migrant workers. http://www.audit-commission.gov.uk/nationalstudies/localgov/crossingborders/Pages/Default.aspx
Boden, P. and Rees, P. (2009) Using administrative data to improve the estimation of immigration to local areas in England. Journal of the Royal Statistical Society, Series A (Statistics in Society). Submitted. http://arxiv.org/ftp/arxiv/papers/0903/0903.0507.pdf
Boden, P. and Rees, P. (2010) A New Migrant Databank: Concept and development, in Stillwell, J., Duke-Williams, O. and Dennett, A. (eds.) Technologies for Migration and Commuting Analysis Spatial Interaction Data Applications, IGI Global, Hershey, pp.111-132.
Chappell, R., Vickers, L. and Evans, H. (2000) The use of patient registers to estimate migration, Population Trends, 101: 19-24.
Dennett, A. and Stillwell, J. (2008) Yorkshire and Humber’s internal migration exchanges. Yorkshire and Humber Regional Review, 18(3): 17-19.
Gonzalez, S. (2006) City regions, regional governance and the Northern Way, The Yorkshire and Humber Regional Review, 16(3): 5-7.
Green, A. E., Owen, D. and Adam, D. (2008) A resource guide on local migration statistics. Report prepared for the Local Government Association. http://www.lga.gov.uk/lga/publications/publication-display.do?id=1308025
Homer, J., Matthews, S., Jones, A. and Morris, K. (2010) The challenges ahead: responding to reduced public expenditure in Yorkshire and Humber, The Yorkshire and Humber Regional Review, 20(1): 14-17
House of Commons Treasury Committee (2008) "Counting the Population" The Stationery Office, London. http://www.publications.parliament.uk/pa/cm200708/cmselect/cmtreasy/183/183.pdf
ONS (2008a). 2006-based Subnational Population Projections for England - Methodology Guide. Office for National Statistics. http://www.statistics.gov.uk/downloads/theme_population/SNPP-2006/2006_Methodology_Guide.pdf
ONS (2008b) Life Expectancy at Birth in the UK 2005-07, News Release 30/10/08, Available at http://www.statistics.gov.uk/pdfdir/leb1008.pdf.
Rees, P., Stillwell, J. and Boden, P. (2009) Migration Statistics. The Way Ahead? Report produced for the UK Statistics Authority. http://www.statisticsauthority.gov.uk/reports---correspondence/reports/index.html
38
Scott, A. and Kilbey, T. (1999) Can patient registers give an improved measure of internal migration in England and Wales?, Population Trends, 96: 44-55. Stillwell, J. and Dennett, A. (2009) Inter-district migration flows within Yorkshire
and Humber, Yorkshire and Humber Regional Review, 19(3): 19-20. Stillwell, J., Duke-Williams, O. and Dennett, A (2010) Interaction data: definitions, concepts and sources, in Stillwell, J., Duke-Williams, O. and Dennett, A. (eds.) Technologies for Migration and Commuting Analysis Spatial Interaction Data Applications, IGI Global, Hershey, pp. 1-30 9.3 Unsworth, R. and Henderson, R. (2004) Accommodating financial and business services, in Unsworth, R. and Stillwell, J. (eds.) Twenty-first Century Leeds Geographies of a Regional City, University of Leeds Press, Leeds, pp. 191-214.
9.4 Unsworth, R. and Stillwell, J. (eds.) Twenty-first Century Leeds Geographies of a Regional City, University of Leeds Press, Leeds.
9.5 Wohland, P. and Rees, P. (2008) Is it who wer are or where we live? Life expectancy in Yorkshire and the Humber by ethnicity, The Yorkshire and Humber Regional Review, 18(3): 20-22.
Wohland, P., Rees P., Norman, P., Boden, P. and Jasinska, M. (2010) Ethnic population projections for the UK and local areas, 2001-2051, Working Paper 10/02, School of Geography, University of Leeds, Leeds. Online at: http://www.geog.leeds.ac.uk/research/wpapers.
39
9.6 Appendix
A1. West Yorkshire – location and typology
West YorkshireUKE4