democratic capitalism at the crossroads -- book manuscript
TRANSCRIPT

DEMOCRATIC CAPITALISM AT THE CROSSROADS
Carles Boix*
(November 17th, 2017)†
* Robert Garrett Professor of Politics and Public Affairs, Princeton University, E‐mail: [email protected].
† All or parts of this manuscript have been presented at Harvard University, MIT, Texas A & M and Yale University. I thank the comments of all participants and especially those of James E. Alt, Benjamin Amstrong, Pablo Beramendi, Elissa Berwick, Peter Hall, Dani Rodrik, David Stasavage, and Kathleen Thelen.

i
TABLE OF CONTENTS
INTRODUCTION 1
PRELUDE: MANCHESTER 17
The Factory as a Mechanical Monster 19
The Immiseration of the Working Class 24
The Threat of Revolution 30
GOLDEN AGE: DETROIT 41
The Technology of Mass Production 41
The Affluent Worker 49
Falling Inequality 56
The End of Ideology 73
Catch‐all Parties 82
TRANSFORMATION: SILICON VALLEY 92
The Power of Information and Computation 94
Computer Algorithms and the Evolution of Employment 96
Globalization 2.0 102
Wage Polarization 114
The Employment‐Equality Dilemma 124
Alternative Explanations 135
DIRE STRAITS 142
Disaffected Democracies 143
The Stability of Mainstream Parties 159
Politics Unhinged 164

ii
CONCLUDING THOUGHTS 179
Some Guidelines for a Prognosis 182
Democracy in the West 190
Democracy in the Rest 199
Responding to Automatization 208
REFERENCES 216

1
INTRODUCTION
The story of the twentieth century, particularly in the advanced world, is the story of the triumph of
democratic capitalism: almost generalized popular support for both free markets and representative
elections, underpinned by fast economic growth and the construction of a generous welfare state.
Yet, exactly one hundred years ago, as World War One was drawing to a close, few observers
would have foretold such a happy ending. Parliaments elected by male universal suffrage were in place
only in a handful of countries – and even there they were usually checked by unelected upper houses or
powerful monarchs. Business‐ and capital‐owners fretted about the potential entry of the masses in the
political arena, the triumph of socialism, and the abolition of private property. At the opposite extreme
of the political spectrum, socialist unions and parties, growing in popular support since the end of the
nineteenth century and loosely organized in an international cartel, rejected any form of “bourgeois
democracy” as a political and economic empty shell. Instead, believing Marx’s forecasts about the
eventual collapse of capitalism, many backed assaulting the state by revolutionary means and
nationalizing the economy. In short, full democracy, with its strictly egalitarian one‐man‐one‐vote rule,
looked incompatible with the philosophy of individual effort and unfettered markets that defined
nineteenth‐century liberalism and with the inequalities generated by the first industrial revolution.
Indeed, by the time of the war armistice in the fall of 1918, a revolutionary wave, pushed by
militant workers and demobilized soldiers, threatened to engulf Europe. Russia had already fallen under
the control of Lenin and the Bolshevik faction of the social democratic party a year before. In the first
days of November of 1918, the German and Austrian‐Hungarian monarchs collapsed. The Hungarian
Communist Party took over the state a few weeks later. In Germany the Spartakist movement
attempted to proclaim a dictatorship of the proletariat in January of 1919.
The latter’s failure, however, marked a political turning point in the industrial world. With the
support of a broad coalition including Christian democrats, social democrats and liberals, Germany

2
enacted one of the most democratic constitutions of the time. At around the same time, Britain,
Belgium, the Netherlands and the Scandinavian countries conceded, without much political opposition,
the right to vote to all adult men. In turn, Western social democratic parties accepted elections as the
means to allocate power and signalled their willingness to respect some regulated version of the market
economy. Less than two decades later, Franklin D. Roosevelt’s “New Deal” institutionalized the concept
of a “mixed economy”, according to which capitalism was to operate embedded in a regulatory
framework aimed at stabilizing the market and where the state was to protect its citizens from the
poverty associated with unemployment, sickness and old age.
After World War Two, the United States and the United Kingdom extended the same logic of
limited public intervention to the international arena. In the Bretton Woods conference, held in a town
resort in New Hampshire in the summer of 1944, officials from forty‐four nations, led by Harry Dexter
White, a senior official at the U.S. Treasury, and British economist John Maynard Keynes, reaffirmed
their countries’ commitment to the goals of currency stability and convertibility and to the principle of
trade openness that had characterized the international system before 1914. At the same time,
however, they agreed to design an international set of rules and institutions that could give enough
autonomy to each country to respond to the particular economic and social demands of its voters. After
reestablishing an international monetary system of fixed exchange rates, they called for the introduction
of capital controls to enable governments to adjust their economies without sacrificing the goals of full
employment and growth. In addition, they accepted the possibility of orderly currency realignments
and, to minimize economic crises across the world, they provided for direct short‐term financial support
to domestic authorities from a newly created International Monetary Fund. In addition, the General
Agreement on Trade and Tariffs restored a philosophy of open borders nesting it in a framework of
multilateral negotiations in which national governments had de facto veto power over trade policy.
The birth and institutionalization of democratic capitalism has been generally explained as the

3
result of a grand political bargain between what had been secular political and economic enemies. The
Left, mobilizing the urban working class born with the Industrial Revolution, accepted private property,
the underlying logic of a market economy, the legitimacy of profits (paid to capital), and the need of
tying wages to the productivity of their earners. Those individuals that disagreed split from socialist
parties to form communist movements allied with Moscow. In turn, the Right (and business elites
associated with it) consented to the introduction of universal suffrage and accepted the construction of
a system of taxes and transfers directed at mitigating the potential inequities of capitalism.
In some instances, that political bargain took place in a quite explicit manner. In several
European small countries, business organizations and trade unions signed comprehensive agreements to
regulate the labor market. Governments then backed them up, eventually supplementing them with
specific social and economic policies. In most cases, however, it took shape in an implicit fashion. After
winning one or several elections, progressive parties ranging from the American Democratic Party to
Britain’s Labor and Scandinavian social democracy pushed for an ambitious agenda of social and political
reforms. Its implementation, met with ideological skepticism if not downright hostility, was often
riotous. In the United States, for example, Roosevelt threatened an uncooperative Supreme Court with a
court‐packing plan only to encounter considerable backlash from public opinion and the Congress. In
continental Europe, interwar governments faced business lockouts, general strikes, and military unrest.
In fact, democracy collapsed in Austria, Germany and Eastern Europe in the 1930s. Over time, however,
the institutional arrangements of democratic capitalism took root everywhere. After World War Two,
they did in France and Germany under the direct leadership of the Mouvement Républicain Populaire –
a postwar center‐to‐the‐left Christian Democracy organization – and the CDU, respectively. Four
decades later, they came into place in nations formerly controlled by the Soviet Union.
Politics and the willingness of each party to make compromises arguably mattered to seal the
democratic capitalist pact. But they were not sufficient to give birth to and sustain that broad social and

4
political bargain. After all, modern capitalism and the institutions of representative democracy had been
at odds with each other throughout the nineteenth century. The first industrial revolution, born in
Manchester and its agglomeration of cotton factories, led to growth rates that, at an annual rate of
slightly over 1 percent until 1914, were certainly higher than in the old agrarian societies it replaced.
Nevertheless, the newly generated wealth was anything but fairly distributed. Displacing a pre‐industrial
economy based on farming and a thin stratum of skilled craftsmen working in artisanal shops, the
Manchester factory system, based on the fragmentation, routinization and mechanization of very simple
tasks in rudimentary machines, relied on the employment of very unskilled individuals, offering them
low wages. By contrast, profits rose continuously and capital accumulated steadily. In that context of
growing inequality, labor and the owners of industrial capital remained locked in a protracted conflict. It
is unsurprising that Marx and Engels predicted the eventual immiseration of the proletariat and urged
workers to engage in revolutionary action while conservative and liberal thinkers alike opposed mass
democracy and the introduction of universal suffrage rather adamantly.
By the turn of the twentieth century, however, a critical wave of technical innovations
transformed the production system of Manchester capitalism with momentous consequences for the
economy and labor markets. In turn, those changes pacified, in due time, the political arena and that
provided the foundations of the deal of democratic capitalism. On the one hand, the invention of the
assembly line and of mass production techniques by the Detroit car industry and their extension to a
whole range of industries – from glass to cigarette‐making and newspaper printing, the automation of
whole parts of the manufacturing process, and, finally, the use of electricity and electric motors to
power hauling and conveying operations generated large productivity gains and fueled an
unprecedented period of economic growth. From 1900 onwards, the economy expanded at an annual
rate of about 2.5 percent in the USA and almost 3 percent in Western Europe – a pace two times faster
than in the previous century. As shown in Figure 1, per capita income doubled in the forty years that

5
preceded World War Two. It then doubled again during the Cold War.
On the other hand, and even more crucially, labor markets changed in two fundamental ways.
First, demand for unskilled workers, whose time and brawn power had fed the first wave of
industrialization, declined sharply. Instead, twentieth‐century factories needed individuals capable of
reading the operating instructions of machines as well as installing, repairing and improving them.
Second, a secular fall in communication and transportation costs, due to the invention of the telegraph
and the railway and the naval application of the steam engine, spawned the formation of large firms
and, with them, the growth of new layers of white‐collar jobs to manage those corporations. As semi‐
skilled and skilled workers became complementary to capital over other types of labor, wages grew
across the board and the general distribution of earnings became much flatter.
Growth and the equalization of the labor and income conditions gave rise to a relatively affluent
working class. The number of working households living under conditions of absolute poverty declined
precipitously over the first half of the twentieth century. Buying food and clothing, which had absorbed

6
two thirds of the budget of the average American family right after the Civil War, dropped to about a
third of its expenditures on the eve of World War Two. The number of goods (from furniture to phones
and automobiles) owned by a growing middle class expanded exponentially. By the 1960s, life
expectancy had almost doubled in years. Average height, which is a relatively good proxy of access to
food and good health habits, rose by about four inches in Europe over the span of a century. The overall
quality of the health and lifestyles of seniors became extraordinarily high in developed countries: one
only has to compare the photographs of 40‐years‐old men and women in poor countries with those 70‐
years‐old individuals in the United States or Europe to realize how much better off the latter are today.
Overall, economic inequality declined. In England and Wales, the fraction of total income in the
hands of the top ten percent of the population was slightly below 50 percent in 1914. In the late 1960s it
was below 30 percent in the United Kingdom. In Australia, the United States or France, to name a few
countries, it dropped by about 15 percentage points to around 30 percent. Figure 2 depicts the level of
income inequality, measured through the Gini index, in the United States, the United Kingdom, and
7
Japan over the long run. The Gini index ranges from 0 to 100. In a perfectly equal society where
everyone has the same income, it scores 0. In an economy where one person receives all country’s
income, the index reaches 100. During the first stage of the industrial revolution, it increased in all those
countries. In both the United Kingdom, which spearheaded the Manchester model of capitalism, and the
United States, which followed England closely, it did until the last third of the nineteenth century. In
Japan, a late industrializer, it rose until World War Two. Inequality then declined everywhere
throughout the middle decades of the twentieth century.1
Detroit capitalism, characterized by its timely‐run assembly lines and spotless factories,
balanced power relations between corporate management and union bosses, and well‐paid and well‐fed
employees, eventually tempered the politics of the twentieth century. The red scare of the end of World
War One and the electoral contentiousness or outright civil conflict of the 1920s and 1930s gave way to
the middle‐of‐the‐road electioneering of the 1950s and 1960s. Survey after survey in the postwar era
showed wide and systematic support for democracy and free markets and little interest in radical
change. By 1981 the share of people backing revolutionary action to transform social relations hovered
around 5 percent or less in Western Europe (Inglehart 1990: 39). Extreme, anti‐system parties collected
few votes in Europe – with the exception of postwar France and Italy, which had large Communist
parties. By the 1960s, however, the Italian Communist Party formally renounced to the use of
revolutionary action. Electoral support for the French Communist party, which retained its orthodox
positions up until the fall of the Berlin Wall, dipped below 10 percent in the mid‐1980s.
Figure 3 displays the average position of the main center‐right and social democratic parties in
the left‐right scale in those advanced countries that had been democratic since the end of World War
1 Sources for the USA data: for the nineteenth century, Lindert & Williamson (2016); for 1913‐63, Smolensky and Plotnick (1992) Figure 2; after 1963, Milanovic (2016). Sources for the United Kingdom: until 1913, Lindert‐Williamson (1983); after 1960, Milanovic (2016). Sources for Japan: before World War Two, Minami 2008; after World War Two, WIID 3.3.

8
Two.2 Early during the Cold War, the mass parties founded at the end of the nineteenth century started
to moderate their electoral platforms to compete for the center of the political space, turning
themselves into “catch‐all” parties that strove to attract all kinds of voters, regardless of the latter’s
class or income. Liberal, Christian democratic and conservative parties pivoted to the center first.
Spearheaded by German social democrats’ decision to drop the use of Marxism doctrine in their Bad
Godesberg party congress of 1959, socialist parties shifted right in the following two decades, eventually
prompting European left‐wing intellectuals to characterize democratic elections as meaningless events
contested by politicians acting as Tweedledum and Tweedledee, the twins of Lewis Carroll’s tale, or as a
choice between “gin and tonic and tonic and gin.” 3
The combination of economic growth and the presence of stable democratic elections resulted
2 Party positions are derived from the data collected in the “Party Manifesto Project” (Volkens et al. 2012). See a full description of the measure and how it is calculated in footnote 48.
3 In Cohn‐Bendit Brothers. 1968. Obsolete Communism: The Left‐wing Alternative. New York: McGraw‐Hill. Cited in Przeworski and Meseguer (2006), p. 184.
-30
-20
-10
010
20Le
ft-R
ight S
cale
(-1
00 to
100)
1940 1950 1960 1970 1980 1990 2000 2010Year
Social democratic parties Center right parties
Source: Manifesto Project Dataset - Volkens et al. (2015)
Figure 3. Political Polarization in Advanced Democracies 1945-2010

9
in the construction of fully‐fledged welfare states. The creation of an insurance system to cover
industrial accidents and employment shocks and of modest pension schemes took place in several
countries in the early decades of the twentieth century (Flora and Heidenheimer, eds. 1981). But the
traumatic experiences of the Great Depression of 1929 and World War Two ushered the construction of
formidable social programs across the Atlantic. Roosevelt signed the Social Security Act in 1933, creating
a broad old‐age pension system as well as unemployment insurance, old‐age assistance, and aid to
dependent children programs. In Scandinavia, the union‐business agreements of the 1930s opened the
door to even more comprehensive welfare states. In Britain, Lord Beveridge’s Report, published in
November of 1942, called for the extension of social rights to every citizen in the form of universal
health care, a general pension scheme with compulsory retirement ages, subsidized public housing, and
free schooling.
Socialist and Christian democratic parties set up most of those programs. Once in office,
however, conservative and liberal parties maintained and occasionally expanded them. As a result, the
role of government in the economy grew dramatically. In 1870, public spending was less than 10 percent
of the total economy in the United States and Europe – with most of it directed to police and the
military. Transfers and subsidies accounted for less than 1 percent of the total economy. A hundred
years later, public spending had risen to around 40 percent of GDP in large economies and to over 50
percent in small countries – with half of the spending devoted to health, pensions, education, and labor
market programs. Although modern welfare states were mainly designed as insurance mechanisms to
alleviate individual risks, such as the loss of employment or old‐age infirmity, their impact on income
inequality was substantial – reinforcing the wage compression trends of twentieth‐century capitalism.
Before taxes, the Gini index of industrial democracies fluctuated around 40. After public transfers, it was
less than 30 (Pontusson 2005).
What many have come to label the golden age of democratic capitalism started to unravel,

10
however, in the 1970s. In the wake of two oil shocks, the economy expanded at a more leisurely pace.
The annual average growth rate in OECD economies, which had reached 6.6 per cent from 1945 to 1960
and then fluctuated around 5 per cent until the mid‐1970s, fell to about 2 per cent afterward. Economic
growth picked up in the 1990s, arguably lifted by the invention of the personal computer, internet,
email, and mobile phones, as well as a set of promising steps in robotics and biotechnology. But that
improvement proved short‐lived. Per capita income growth fell to a snail‐pace of 1.4 percent in the
United States (Gordon 2014).
More fundamentally, those new information and communication technologies have started to
reshape the structure of employment – in a way reversing the labor effects of the second industrial
revolution. In the big factories and large corporations of the first half of the twentieth century, capital
and semi‐skilled labor had been complementary to each other. The great inventions of the turn of the
late nineteenth century and early twentieth century, from electricity to the steam engine and from the
assembly line to the big corporation, had multiplied the demand for qualified blue‐collar workers and
white‐collar employees. Now, instead, capital is rendering a substantial fraction of that labor redundant,
in a way similar to what had happened to artisans in the early part of the nineteenth century. The
acceleration of automatized processes – the result, in turn, of having extraordinarily fast
microprocessors – are making production processes more efficient and a growing number of traditional
manufacturing jobs obsolete. The number of U.S. factory workers shrunk from a postwar peak of nearly
19.5 million in 1979 to about 12 million in 2014 even though total manufacturing output (in real dollars
adjusted for inflation) roughly doubled in the same period of time.4 Europe experienced a similar
downward trend: manufacturing jobs accounted for over one fifth of all employment in 1970 but less
than one tenth in the middle of the 2010s.
4 Data on manufacturing employment comes from the Bureau of Labor Statistics: https://fred.stlouisfed.org/series/MANEMP. Data on industrial output is taken from the Bureau of Economic Analysis: https://bea.gov/industry/index.htm.

11
The impact of automation has not been limited to industrial jobs. Complex software programs
can now perform an increasing number of the routinary tasks that were part and parcel of a wide range
of white‐collar jobs, from accounting and administrative support to travel agencies. Routine
occupations, that is, those jobs composed of tasks that imply following a well‐defined number of rules
and procedures, employed almost 45 percent of the working‐age population in the United States until
the mid‐1980s. By 2014 that share had declined to around 31 percent (Cortes et al. 2016). Similar trends
have taken place in Europe. By contrast, the number of professional and managerial jobs, which are low
in routinized tasks and highly reliant in abstract, relatively creative thought processes, have risen
steadily. In the United States, whereas the share of high‐skill occupations (managers and professionals)
over total employment grew from almost 28 percent of all civilian employment in 1980 to 39 percent in
2010, the employment shares of all the remaining occupational categories remained flat or fell (Katz and
Margo 2014).
A sharp drop in transportation costs as well as the information and communication revolution
globalized trade at a true world scale after the late 1970s, intensifying, as a result, the employment
trends triggered by the invention of the personal computer. The emergence of newly industrialized
countries and the growing practice of job offshoring put to an end the international system of the
postwar period, characterized by a rich northern core strongly interconnected through intra‐industry
trade and a southern periphery specialized in exporting raw materials. An increasing number of
American, European and Japanese companies, from toy‐ and other consumer‐good‐makers in the 1970s
to electronics in the 2000s, proceeded to unbundle production operations across the world, maintaining
highly‐paid tasks in advanced economies while moving low‐wage jobs to developing countries. The
hyperglobalization of the late twentieth century eroded the job status and wages of blue‐collar
industrial workers and the administrative middle class in advanced industrial economies. Recent
estimations attribute between one third and two fifths of all employment losses in the last decades to

12
trade and the relocation of production abroad.
Those divergent trends in the structure of employment – with demand falling for manual and
clerical positions and rising for highly educated individuals – translated into a wider wage structure and
a more unequal distribution of incomes. Since the middle of the 1970s, median male earnings, that is,
the income received by men at the fiftieth percentile of the earnings distribution, have remained
stagnant in the United States – once we adjust them for inflation. In Japan and Europe, median salaries
have performed slightly better but they have still risen much less that the overall economy. Wages for
those in the bottom quintile of the earnings distribution have done much worse – dropping in real terms
in the United States and the United Kingdom and barely increasing in the rest of advanced economies. In
the meantime, earnings have doubled for individuals with postgraduate education and grown by almost
50 percent for those with bachelor degrees in the United States in the last half century. Less dramatic
but similar wage dynamics have taken place in the majority of advanced industrial economies so that by
2010 the earnings of an individual in the ninetieth percentile of the wage distribution were three to five
times bigger than the earnings of an individual at the tenth percentile of the same distribution. In those
European countries where earnings inequality has remained unchanged, the cost has often been very
tepid employment growth.
The unwinding of the Detroit economic model eventually shook the social and political
consensus of the postwar period. Dissatisfaction with political institutions and the political
establishment grew across almost all countries. The proportion of respondents stating that politicians
care about what ordinary people think dropped from about a half in the early seventies to less than a
third in the late nineties in most European countries. In the United States, the share of people believing
that government is run for the benefit of a few big interests doubled to over 70 percent in two decades
(Dalton 2004, Figures 2.2 and 2.3). Much of the growing mistrust was concentrated among those most
hurt by economic change. In 2012, almost 40 percent of British respondents with no educational

13
qualifications and a third of working‐class respondents agreed strongly with the statement “people like
me have no say in government” – more than twice the rate for university‐educated respondents (Ford
and Goodwin 2014). In the United States, individuals with a high school degree were (and are) much less
likely to trust the federal government than those with a graduate or postgraduate education. Over time,
political disaffection morphed into political disengagement. The rate of electoral abstention in Europe
rose from 17 percent in 1974 to 33 percent in 2016. Most of the drop in turnout took place among social
strata most affected by economic change. Abstention rates among low income voters became two to
three times higher than among high income individuals. Young cohorts, who have born a good share of
the costs of a changing labor market, are now abstaining at twice the rate of senior voters.
The political and electoral landscape became more heterogeneous – marked by a growing gap
between business owners (particularly those in 2.0 firms with huge stock valuations and minimal
workforces) and the rest of society and by increasingly divergent interests between highly educated
individuals, able to benefit from the spread of computational technologies and hyperglobalization, and
the rest of the workforce. Tracking those new disparities, American politics has become much more
polarized than in the past. The broad bipartisan consensus that was a feature of American politics in the
1950s and 1960s has given way to highly ideological and strict party‐line voting behavior. According to
recent indexes developed to measure party programmatic positions in the American Congress,
Democratic and Republican senators are today as far apart from each other in ideological terms as they
were in the Reconstruction period. Indeed, the ideological distance between Democratic and Republican
members of the House of Representatives is larger now than after the American Civil War. In Europe,
support for liberal, Christian democratic and social democratic parties, who had dominated the political
landscape since the interwar period, fell by 25 percentage points between 1975 and 2015 – mostly to
abstention. Then, in the wake of the great recession, the share of voters casting their ballots to either
anti‐immigration, anti‐European Union right‐wing platforms (mostly in Northern Europe) or to radical,

14
populist left‐wing movements (particularly, in Southern Europe) grew to 22.5 percent in 2015.
Provided current trends are any good guide to the future, the pace of technological and
employment change will continue unabated and may even accelerate in the next few decades.
According to some recent estimates, almost half of all current jobs will end up being automatized in the
next twenty to thirty years. Most of this substitution for robots will first affect the least qualified
individuals. But, it may not be limited to them, hitting, at some point in time, relatively creative, non‐
routine jobs. Now, if such a scenario of employment dislocation and economic polarization persists, will
Silicon Valley capitalism and democracy be able to coexist? Will we have the resources and willingness
to respond successfully to those challenges while maintaining the key political and social institutions of
twentieth‐century democratic capitalism? Or, buckling under the weight of mounting joblessness and
growing wage inequality, will we end up witnessing the emergence of a political system closer to the
one that prevailed under Manchester capitalism?
Technological optimists, who equate the pain brought about by Silicon Valley capitalism with the
transitory pangs associated with the birth of any new society, believe that automation will disrupt the
labor market, hurt the wages of the least educated, and alienate them from the old forms of political
engagement, only temporarily. In due time, an overabundant economy will make most work redundant,
free the great majority or perhaps all of us from the bondages of work and ruthless interpersonal
competition, and allow humankind to hunt in the morning, fish in the afternoon, and, perhaps, read
poetry after dinner. Sitting on the other side of the aisle, technological dystopians predict, instead, the
coming of a brave new world. As jobs disappear, wages will fall freely. Among those still employed, the
workplace will become “uberized”, with self‐employed individuals juggling through several occupations,
tied by round‐the‐clock schedules, and frustrated by sluggish or even negative earnings growth. At the
top of the labor market, there will be a small creative and professional class enjoying most of the
benefits of automation and globalization – a thin layer of inventors, top managers and highly educated

15
individuals. If anything, Silicon Valley will take us back to the politics of Manchester capitalism, finally
vindicating Karl Marx’s dire predictions about the final substitution of machines for workers, the
immiseration of the masses, and a horde of angry men armed with pitchforks and torches marching
down on the wealthy few, is back.
The enthusiasm of techno‐optimists seem to be off the mark. Automatizing all and even most
tasks looks highly improbable – at least for a long while. In any case, it is not clear that we should be
able to employ our leisure to pursue the kind peaceful and virtuous ends announced by technological
utopians. Likewise, nothing assures us that the winners and losers of automation will share their gains
fairly and that states will set up the right mechanisms to compensate the permanently unemployed and
badly employed (and badly paid). But the gloom of techno‐pessimists is unconvincing too. It is true that
today’s economic transformations are pushing the democratic capitalist deal that defined a good part of
the twentieth century into a major crossroads – tearing it between the equalizing tendencies and
demands of a democratic system and the creative destruction dynamics inherent to market economies
and technological progress. Still, that does not mean that there is a unique, predetermined social and
political outcome ahead of us.
Silicon Valley capitalism and Manchester capitalism may resemble each other in their disruptive
impact on employment, in the stagnation of wages among certain strata, and in the level of economic
inequality. But, they differ, at the very least, on two critical dimensions. First, we are now much
wealthier. In North America and Europe, today’s average income is about ten to fifteen times larger than
one hundred and fifty years ago. Second, fully democratic institutions have been in place for several
decades. It should therefore be possible to use our representative institutions to harness this massive
buildup in wealth to smooth the technological transformations of the present and, in the process, to
pursue the main collective objective – guaranteeing relatively equal life chances to all – that defined the
middle and late decades of the twentieth century. The fundamental question is, of course, how. To

16
answer it, we need, first of all, to explore the basis of the democratic deal of the twentieth century. We
must then describe the origins and nature of the forces that could jeopardize that deal in the near
future.

142
DIRE STRAITS
The technological and economic transformations spurred by Detroit capitalism reshaped – mostly over
the span of one or two generations – the nature of politics in the advanced industrial world. The rapid
expansion of the economy, a much high rate of social mobility, and a secular trend toward a more equal
distribution of earnings pacified the social and class struggles of the nineteenth century. Roosevelt’s
New Deal relied on the economic and productivity gains of the previous three decades to overcome the
Great Depression and buttress public support for a free market economy in the United States. Europe’s
postwar growth miracle put to rest the dramatic confrontations that had erupted in that continent
during the interwar period. As affluence and relative equality became the new norm everywhere, left
and right parties came to see democracy and capitalism as inextricably intertwined, converging in their
policy promises and competing at the ballot box on the basis of the professionalism and competence of
their leaders.
Likewise, the unfolding of Silicon Valley capitalism transformed both public discourse and the
political arena – albeit in a different, often opposite, direction. As both new information and
communication technologies and a much deeper form of globalization disrupted the employment and
wage patterns that had prevailed during the twentieth century, the liberal postwar consensus has begun
to look increasingly fragile. A generalized pattern of attachment to parties and trade unions and of
deference toward political elites has given way to a growing sense of mistrust and political alienation –
mostly among the American and European working class. In the 1970s, at least 50 percent of
respondents in surveys taken in countries as diverse as Austria, France, Germany, Sweden and the
United States believed that politicians cared about what people thought. Thirty years later, that
proportion has plunged to 30 percent or even less (Dalton 2004: 26‐30). Political mistrust eventually
spilled over into actual political behavior. Electoral participation in Europe, which peaked at over 80

143
percent during the Cold War, fell after 1980. By the early 2010s, almost one out of every three
Europeans – most of them clustered within low‐income strata and young cohorts – abstained in national
elections. In due time, new populist parties sprang, at the right and left tips of the political spectrum, to
give voice to that growing number of unsatisfied voters. And, rattling the prevailing system of orderly
alternation of mainstream parties in government, they threatened to reconfigure the structure and
dynamics of political competition in place since the end of World War Two.
Disaffected Democracies
Well after the effects of computerization and globalization percolated into the economy,
hollowing the demand for semi‐skilled jobs and flattening wages for the bottom half of the income
distribution, conservative, Christian democratic and social democratic parties continued to run on their
traditional, middle‐of‐the‐ground programs and to govern from the center of the policy space. Electoral
politics retained its usual share of moderate ideological conflict and partisan discord. Center‐right and
center‐left candidates still disagreed on the optimal level of taxes, the generosity of welfare spending,
the type of macroeconomic policy, and, marginally, the extent of trade and financial integration. But
they all ultimately subscribed to the key tenets of the political‐economic model that had become
ensconced in all advanced democracies: the program of classical liberalism – free markets and free trade
– now embedded within a welfare state that minimized the risks of economic downturns and protected
citizens from illness and aging, and integrated within an international framework that gave national
governments enough autonomy to achieve full employment at home.
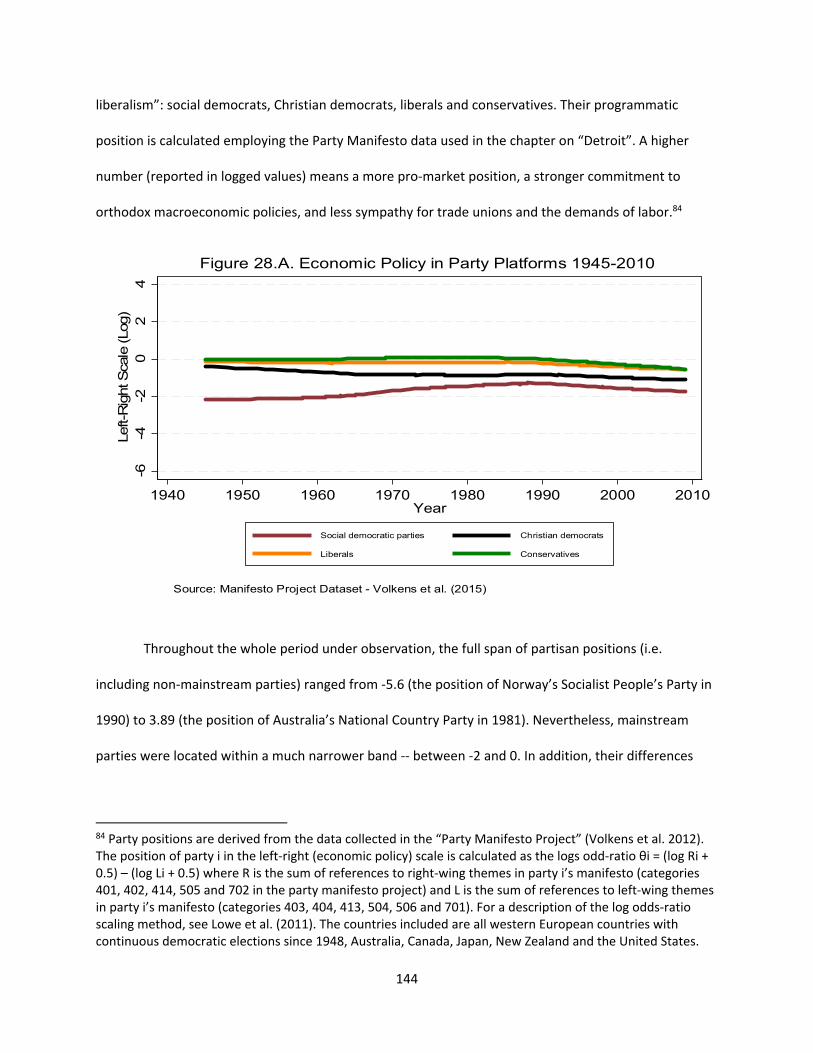
Figure 28.A plots the average position of mainstream political parties in the advanced world
since the end of World War Two in economic policy (excluding trade and migration). Mainstream parties
are those political organizations that embraced the economic and institutional architecture of the
golden age of democratic capitalism, which political scientist John Ruggie (1982) coined as “embedded
144
liberalism”: social democrats, Christian democrats, liberals and conservatives. Their programmatic
position is calculated employing the Party Manifesto data used in the chapter on “Detroit”. A higher
number (reported in logged values) means a more pro‐market position, a stronger commitment to
orthodox macroeconomic policies, and less sympathy for trade unions and the demands of labor.84
Throughout the whole period under observation, the full span of partisan positions (i.e.
including non‐mainstream parties) ranged from ‐5.6 (the position of Norway’s Socialist People’s Party in
1990) to 3.89 (the position of Australia’s National Country Party in 1981). Nevertheless, mainstream
parties were located within a much narrower band ‐‐ between ‐2 and 0. In addition, their differences
84 Party positions are derived from the data collected in the “Party Manifesto Project” (Volkens et al. 2012). The position of party i in the left‐right (economic policy) scale is calculated as the logs odd‐ratio θi = (log Ri + 0.5) – (log Li + 0.5) where R is the sum of references to right‐wing themes in party i’s manifesto (categories 401, 402, 414, 505 and 702 in the party manifesto project) and L is the sum of references to left‐wing themes in party i’s manifesto (categories 403, 404, 413, 504, 506 and 701). For a description of the log odds‐ratio scaling method, see Lowe et al. (2011). The countries included are all western European countries with continuous democratic elections since 1948, Australia, Canada, Japan, New Zealand and the United States.
-6-4
-20
24
Left-
Rig
ht S
cale
(Lo
g)
1940 1950 1960 1970 1980 1990 2000 2010Year
Social democratic parties Christian democrats
Liberals Conservatives
Source: Manifesto Project Dataset - Volkens et al. (2015)
Figure 28.A. Economic Policy in Party Platforms 1945-2010

145
shrunk over time, particularly after both Christian democrats and social democrats tacked to the center
in the later 1960s. By the early 2000s, the economic programs of all mainstream parties were within a
one‐point range in the economic policy left‐right scale.85
Figure 28.B displays the average positions on globalization of the same party families. This
synthetic index is based on the number and type of references on trade openness, multiculturalism, and
the European Union project in their electoral manifestos. A higher positive number implies stronger
support for globalization.86 The full range of party positions turns out to be wider than the previous one
for economic policy – from a minimum of ‐4.76 (the case of France’s National Front in 2008) to a
maximum of 5.8 (Belgium’s Reform Movement in 2010). Yet the differences among mainstream parties
85 A separate examination for each country of the evolution of party positions shows the same pattern. Mainstream parties converged everywhere in the economic policy dimension.
86 The position of party i in the globalization scale is calculated as the logs odd‐ratio θi = (log Oi + 0.5) – (log Ci + 0.5) where O is the sum of references to pro‐globalization themes in party i’s manifesto (categories 108, 407 and 607 in the party manifesto project) and C is the sum of references to anti‐globalization themes in party i’s manifesto (categories 110, 406 and 608).
-6-4
-20
24
6G
loba
lizat
ion
Sca
le (Lo
g)
1940 1950 1960 1970 1980 1990 2000 2010Year
Social democratic parties Christian democrats
Liberals Conservatives
Source: Manifesto Project Dataset - Volkens et al. (2015)
Figure 28.B. Globalization in Party Platforms 1945-2010

146
on globalization were even smaller than on economic policy. They fluctuated within a two‐point band
until the 1980s and became negligible after Christian democratic parties, which had been the strongest
supporters of open economies throughout the postwar period, veered toward slightly less pro‐
globalization policies.87
In light of the historical experience of advanced countries, embracing the program of embedded
liberalism made economic and political sense. Twentieth‐century democratic capitalism had proved to
be both successful and resilient: it had delivered high growth; it had allowed governments to fund
generous social programs; and it had sent its main political and economic competitor – communism – to
the ash heap of history. Its accomplishments may explain also why policy‐makers (and voters) decided
to double down on their support for free markets and open economies in response to the oil shocks of
the 1970s and the first signs of structural change as well as a productivity slowdown in the 1980s. To
jumpstart growth, globalization was deepened through the substitution of the World Trade Organization
for GATT, the signature of NAFTA, the transformation of the European Common Market into the
European Union and the latter’s territorial expansion, and the introduction of the euro. In addition,
labor markets and competition policy were made more flexible – particularly in Anglo‐American
economies.
Once the economic and social conditions that had made the postwar consensus started to
change, however, that quasi‐universal commitment to free and open economies proved precarious and,
to some extent, politically dangerous. By opening a wedge between mainstream parties and a fraction
of its traditional voters, it resulted in a substantial drop in the latter’s political support for the former.
Popular trust in the Western political establishment reached record highs during the golden age of
87 A separate examination for each country of the evolution of party positions on the globalization dimension shows also a process of generalized convergence – except for Austria, Switzerland, the United Kingdom and, moderately, Denmark, in the 2000s.

147
democratic capitalism. Figure 29 shows the percentage of people who agreed with the statement that
politicians care about what people like them think from the Cold War period until today. Long‐run
consistent series (i.e. relying on a statement with the same wording) are only available for a few
countries. The question was asked for the first time in the United Stated in 1952. It was then added (in
that form or a similar one) in other major democracies in the late 1960s and early 1970s. 88
Until the mid‐1960s, more than 60 percent of Americans thought that politicians cared about
88 The exact question and the sources of the data are as follows. For the USA, “I don't think public officials care much what people like me think”, from ANES. For France, “A votre avis, est‐ce que les hommes politiques, en général, se préoccupent beaucoup, assez, peu ou pas du tout de ce que pensent les gens comme vous?” in Enquêtes Electorales Françaises (1978‐1997) and European Social Survey (2014). For Germany, “I do not think public officials care much for what people like me think”, from “Politics in the Federal Republic” study (1969), German Election Studies (1972‐2009). The question in Finland and the United Kingdom is different. In Finland, it is “Political parties are only interested in people’s votes, not in their opinions,” taken from Gallup Polls (1978‐88) and Finish Election Studies (1990‐2015). In Britain the series reports the percentage of respondents that disagreed with the statement "Parties are only interested in votes, not opinions”. The sources for Britain are “Political Action – An Eight Nation Study (ICPSR no. 7777) for 1975, and British Social Survey (1986‐2014).
020
4060
80
Pol
itici
ans
care
abo
ut w
hat p
eop
le li
ke m
e th
ink
(%)
19501955
19601965
19701975
19801985
19901995
20002005
20102015
Year
USA France Germany Britain Finland
Figure 29. Political Disaffection -- 1952-2015

148
their opinions. If anything, their confidence in politicians’ responsiveness appears to have risen at the
peak of the Cold War – by 10 percentage points between 1952 and 1960. Coinciding with the Vietnam
War and Watergate, it slid to slightly below 50 percent in the late 1960s. Those critical moments could
not account, however, for the steadily growing disaffection of public opinion towards its
representatives. After a brief upturn in the early 1980s, the percentage of American respondents that
thought politicians cared plummeted to about 20 percent. It then remained at those levels, excluding a
short‐lived upsurge around 9/11, for the next quarter of a century. The same downward trend in
political trust took place in France, where the proportion of satisfied citizens dropped from almost 40
percent in 1978 to about 10 percent in 2014, in Germany, where it fell from 43 percent in 1976 to
around 20 percent in the 2010s, and in Britain, where in 2014 only 10 percent of respondents thought
parties cared about their opinions. Although they are not drawn in Figure 29, Australia, Canada, Italy and
Japan exhibit similar negative attitudes towards politicians. By contrast, in small countries the evolution
of public opinion turned out to be more heterogeneous. Confidence levels declined in Austria and
Sweden but rose in Finland, which is displayed in Figure 29, and the Netherlands (Dalton 2004).
Given how generalized those downward trends were, it is difficult to attribute them to some
idiosyncratic national characteristic or singular political event. Moreover, as shown by a growing body of
research, the growth of voters’ mistrust toward politicians was not driven by the presence of a particular
party in power or by the vagaries of the business cycle (Pharr and Putnam, eds. 2000; Dalton 2004).
Political trust did not pick up during the high‐growth period of the late 1990s and early 2000s. Approval
rates towards politicians were already at dismal levels right before the Great Recession. The rise of
political disaffection coincided with much more fundamental transformations: a permanent drop in the
rate of economic growth and relatively flat median wages since the 1980s.
Political disaffection bred political disengagement. Figure 30 plots the proportion of non‐voters
as well as the percentage of the vote for both mainstream parties and extreme parties over the whole

149
electorate in legislative elections conducted in Western Europe from 1918 until 2016. Again,
mainstream parties belonging to the conservative, Christian democratic, liberal or social democratic
political families. Vote for extreme parties comprise both far left organizations (mainly, communist
parties but also, and more recently, parties such as Syriza and Podemos) and far right organizations
(such as the Nazi party in Germany or radical anti‐immigration parties today).89
After the generalization of universal suffrage following World War One, mainstream parties
experienced a steady increase in electoral support – from about 56 percent of the whole electorate in
1918 to 69 percent right before the crash of 1929. Most of their growth resulted from a process of
electoral mobilization that cut the rate of abstention by half to about 20 percent in the early 1930s. The
89 The countries included are Austria, Belgium, Cyprus, Denmark, Finland, France, Germany, Greece, Ireland, Italy, Luxembourg, Netherlands, Norway, Portugal, Spain, Sweden, Switzerland and the United Kingdom. Each year’s data corresponds to the result from the previous year’s election, or (for a very small number of years) as the closest election (resulting in a t2‐year lag). A country and year are counted as “democratic” if in that year the country had a POLITY score of >5 OR a POLCOM score of >5. The data has been generously shared by Simon Hix at the London School of Economics.

150
new voters came from low‐income citizens who had been recently enfranchised and whose participation
benefited center‐left and left parties. The rise of the Nazi party in Germany temporarily brought the
support of mainstream parties down to its levels of 1918. Everywhere else, however, their vote share
remained high. After World War Two, about seventy percent of the whole electorate voted
systematically for parties that favored some variant of the political and economic architecture of
“embedded liberalism”. With abstention at a secular low, the vote for extremist parties represented
about 10 percent of all the electorate – mostly held by the communist parties of Finland, France and
Italy.
The golden age of middle‐of‐the‐road politics started to erode in the late 1970s. In the
aftermath of two oil shocks and in what at first looked like a natural response to a lackluster
macroeconomic performance, support for mainstream parties slid gently. Nonetheless, even after
unemployment and inflation had been contained, the traditional political forces continued to bleed
votes. By 1990, their total vote equaled 60 percent of the electorate. At the onset of the Great
Recession, it was 55 percent. The economic crisis exacerbated the negative trend. In 2016, only 45
percent of all those entitled to vote turned out to support them.
The decline of mainstream parties did not benefit their competitors for a long while. Except for a
short‐lived uptick in the vote for communist parties in the mid and late 1970s, the share of extreme
parties remained unchanged at 10 percent until 2010. Most of the loss in support for center‐right and
center‐left went into the abstention camp. Electoral turnout started to fall consistently in the early
1980s (Franklin et al. 2004, Hooghe and Kern 2016). By 2016 almost one out of every three European
adults refrained from voting. Figure 31 displays the non‐voting share of the electorate in the United
States’ presidential elections for the sake of comparison. Abstention rates were similar in Western
Europe in 1918 and the American presidential election of 1916. Nonetheless, as a result of strong
socialist and Christian democratic mass parties in Europe, unmatched by American parties in

151
organizational terms, the non‐voting gap between the two continents grew to 20 percentage points in a
single decade and by an additional 5 points in the 1970s. The participation differential only started to
shrink after 1990. By the end of the Great Recession it had been cut to just 7 percentage points.
The collapse in turnout took place across all advanced democracies with very few exceptions.
Figure 31 plots average abstention rates in 1965‐1974 against the absolute change in non‐voting from
that period to the middle of the 2010s for all industrial economies with continuous democratic elections
since the end of World War Two. The data refer to legislative elections. Electoral participation did not
vary in the United States, where non‐voting was already low during the golden age of Detroit capitalism,
and in Australia, Belgium and Luxembourg, which retained a system of compulsory voting. In Denmark
and to some extent Sweden turnout dropped marginally. Otherwise, abstention rates rose rather
sharply: by 10 percentage points in the United Kingdom; by 15 percentage points in Japan, Germany,
Italy, the Netherlands or Japan; and by almost 20 percentage points in France.
The nature of the electoral system employed in each country, which has always enjoyed a
OST
DK
FIN
FRA
GER
IRLNOR
SWE
UK
USA
JAP
NZ
BELLUX
AUT
ITANL SWI
05
1015
20C
hang
e in
Abst
entio
n from
Lat
e 1
960s
to M
id 2
010s
0 10 20 30 40Average Abstention 1965-1974
No Compulsory Vote Compulsory Vote Throughout Period
Compulsory Vote in 1970s but not in 2010s
Figure 31. The Evolution of Abstention

152
considerable predicament among political scientists as an explanatory variable of turnout, cannot
account for such a widespread declining trend. It is true that all countries that abrogated compulsory
vote (in the Netherlands and the majority of Swiss cantons in the early 1970s and in Italy in the 1990s)
experienced a quick drop in participation. But turnout fell too in countries that had never compelled
their citizens to vote. Likewise, using different electoral rules to allocate parliamentary seats were not
behind that shift either. Abstention rates rose in both majoritarian systems (like France, Japan or the
United Kingdom) and extremely proportional countries (like Austria and the Netherlands).
The fall of turnout seemed to be related, instead, to the growth of political disaffection among
public opinion. Figure 32.A displays the percentage of Western European respondents that did not vote
in their country’s latest legislative election – according to the European Social Survey of 2014 – as a
function of four questions: the extent to which respondents believed most people take advantage of
others; their trust in politicians; their satisfaction with the economy; and their satisfaction with the way
in which democracy works in their country. The four surveys instruments, which are strongly correlated

153
with each other, show that the level of political alienation, independently of how one measures it,
covaries with the probability of not voting. Abstention climbs up to 40 percent among those that are
completely alienated from the political system but amounts to less than 15 percent (or the overall
proportion of non‐voters in the 1970s) among those claiming to be fully contented with their country’s
political and economic performance.
Figure 32.B shows the proportion of non‐voters in the USA in the early 2000s as a function of
their response to similar questions.90 The relationship between political disaffection and political
disengagement is remarkably similar to Europe´s. Abstention was twice larger among those stating that
people try to take advantage of them than among those that said that people are fair. Their subjective
90 Numerous studies show that in surveys respondents overreport their true electoral participation. Overreporting does not seem to be biased in terms of income or satisfaction with the political system, at least positively – that is, richer and more satisfied individuals do not lie more about voting. If anything, the opposite may be true. Less satisfied citizens seems to hide their abstention more frequently. Therefore, the slope in Figures 32. A and 32.B may be steeper in the real world.

154
level of political efficacy exhibits the same pattern. Citizens that felt disempowered abstained at much
higher rates than those that believed they had a say in government.
While electoral participation had remained high, socioeconomic status had been unrelated to
the likelihood to vote. After carefully examining the behavior of British voters in the four parliamentary
elections that took place between 1966 and 1974, Crewe, Fox and Alt (1977) concluded that class and
education “fail to have any bearings on propensity to vote regularly” (p. 54). In fact, low‐income voters
turned out to vote at slightly higher rates than high‐income individuals – although the effect was driven
by retirees’ slightly higher participation rate with respect to the whole electorate. In Germany, the
probability of voting hardly differed by any class or occupational characteristics in the early 1980s. The
participation rate of college‐degree holders was only 5 points higher than the one of unschooled
individuals. Skilled blue‐collar workers voted at the same rate of professionals. Unskilled workers’
turnout rate was only 6 percentage points lower than the former (Kleinhenz 1998). A similar lack of any
relationship between vote and class or income was true for France (Abrial et al. 2003), Italy (Tuorto
2010), and Scandinavia (Goul‐Andersen and Hoff 2001, Martikainen et al. 2005). Electoral participation
depended, if anything, on the “level of psychological involvement” of citizens, that is, “their attachment
to a party, their interest in politics generally and the election in particular, and their degree of exposure
to news and discussion about politics in the media or amongst their own circle of relatives and friends”
(Crewe et al. 1977: 63‐64).
By contrast, the gradual rise of political disengagement has taken on very distinctive sociological
contours. Figure 33 (Panels A through D) plots the share of non‐voters in four countries that have
witnessed a substantial fall in turnout: Finland, France, the Netherlands and the United Kingdom. Each
graph reports non‐voting shares by income quintile and, within each quintile, three age groups: younger
than 35, between 35 and 54 years of age, 55 or older. The Finnish data, taken from Martikainen et al.
(2005), refers to the parliamentary elections of 1999. It consists of actual individual‐level observations of

155
turnout linked, through Finland’s national population register, to the demographic, social and economic
characteristics of each elector. The data analyzed cover all Finnish electors between 25 and 69 years of
age – a total of 2,941,834 persons. This unique data base, which gives us the true distribution of voters
and non‐voters by their social characteristics, avoids two standard problems confronted by any analysis
of electoral participation that relies on survey data: first, the possibility that response rates to pollsters
differ across individuals and that those differences could be related to the decision not to participate in
elections and in politics in general; second, the fact that some respondents tend to overreport their
participation at the polls. As a result of those two problems, surveys tend to produce much higher voting
rates (by around 10 percentage points) than the official turnout figures.
The data for France, the Netherlands and the United Kingdom come from the latest wave of the
European Social Survey, a multi‐country survey with a vast array of political, economic, demographic and
attitudinal questions administered in over 30 countries. I select those three countries for two reasons.
First, they differ substantially in their economic structure and political institutions, therefore providing

156
us with a reasonable coverage of all the variation of advanced democracies. Second and perhaps more
important, the deviation between the official turnout data in their latest legislative elections and the
aggregate turnout rate uncovered through the survey is relatively small: 1.8 percent in the Netherlands,
2.3 percent in the United Kingdom, and 6.0 percent in France. By contrast, the deviation between survey
and official data is much higher in the majority of the remaining countries, reaching 11 percentage
points in Germany and 19 percentage points in Switzerland, for example.
Non‐voters amounted to 35.4 percent of all the Finnish electorate in 1999 – or twice the rate
thirty years earlier. But the level of abstention differed widely by income and age (Figure 33.A). While 40
percent of all individuals in the bottom quintile of the income distribution did not vote, less than 20
percent of those in the richest quintile did not. Age had its own independent effect on turnout. Within
each income quintile, electors whose age was 55 or higher were twice more likely to vote than those
younger than 35. The differential behavior by age cohort can be the result of either a life cycle effect or
a generational effect (or both). A life cycle effect takes place when all individuals vary in their probability
of voting as a function of the age they have: for example, abstaining when young but then turning out to
vote as marriage, parenting and work concerns, all of them correlated with age, make them participate
more. By contrast, a generational effect occurs when different cohorts behave differently (regardless of
the age they have), generally in response to common historical experiences: for example, individuals
that become adults under a situation of war mobilization may be more prone to engage in politics than
those that do not. Pulling together electoral surveys for Finland from 1979 through 1999, Wass (2007)
shows that the decrease in turnout correlated with age has been mainly driven by a cohort or
generational effect. New generations have been consistently voting at lower rates. Whereas 70.4
percent of those those born in 1960 voted when they were 19 years (in the 1979 election), only 57.7
percent and 49.6 percent of those who were 19 in 1987 and 1999 did respectively. By contrast, there is
no discernible life cycle effect in place: the probability of voting remained stable within each generation

157
– in fact falling slightly with age. For example, among those born in 1960, the average turnout in 1979
fell 1.7 percentage points to 68.7 percent in both 1987 and 1999. Similar generational effects have been
found in Canada, where turnout among the generation born in the 1970s has been 25 points lower than
amongst pre‐baby‐boomers (Blais et al. 2004).
Income differences were also strongly correlated with turnout in the Dutch elections of 2012.
While only 10 percent in the top quintile abstained, about 40 percent of those in the bottom quintile did
not vote (Figure 33.B). Although age mattered, it did only for the bottom 60 percent of the income
distribution, where between 40 and 50 percent of those 34 or younger abstained. Among the two top
quintiles, age had a marginal impact on voting behavior.91
Age played a larger role in French participation rates of 2013 (Figure 33.C). About two thirds of
91 Notice that whereas the young cohort in the Finnish data only includes those between 25 and 34, it encompasses those between 18 and 34 in the other three countries. Because very young voters tend to participate less this may explain higher abstention rates in the Netherlands and, particularly, in France and the United Kingdom.

158
all young electors in the three lowest quintiles abstained in the legislative elections of 2013. But even
among people younger than 35 years in the top quintile of the income distribution the non‐voting share
was, at 50 percent, very high. Income was strongly correlated with participation only among electors
that were 35 years of age or older. While more than 60 percent of middle‐aged electors in the bottom
quintile abstained, only 20 percent did in the top quintile. Abstention rates were generally lower among
senior voters but income still mattered: seniors in the lowest quintile were three times likelier to abstain
than seniors in the top quintile.
The United Kingdom displays an extreme version of the French case (Figure 33.D). With the
exception of young individuals in the top quintile, whose abstention is close to the national average,
young individuals’ non‐participation rate was uniformly high at around 50 percent ‐‐ peaking at a dismal
73.4 percent among 34‐years‐old or younger in the bottom quintile. In turn, senior electors (those 55‐
years‐old or older) continued to vote at the participation rates of previous decades. Income shaped the
decision to vote among middle‐age voters: low‐income electors abstained at the rates of young
individuals; high‐income individuals voted almost like senior citizens.
With age and income rising as key correlates of voting, most European democracies converged
to the participation patterns that had already been in place in the United States throughout the
twentieth century. As detailed by a voluminous literature on turnout in American elections (Lipset 1963,
Rosenstone and Hansen 1993, Leighley and Nagler 2014), electoral participation was strongly correlated
with socioeconomic status. Throughout the period from 1972 to 2008, about 80 percent of all American
in the top quintile of the income distribution voted in presidential elections. Only half of those in the
bottom quintile did. Likewise, age covaried heavily with vote. Turnout among people younger than 25
was 20 to 30 percentage points lower than electors older than 45.
In short, the structure of electoral participation became strongly polarized across the Atlantic –
very much in line with the economic transformations brought about by the decline of industry and by

159
globalization in the last forty years. High‐income, well‐educated electors, who benefited from the ICT
revolution, global trade and immigration, as well as the oldest cohorts, protected by a robust pension
system, remained as politically engaged as previous cohorts with the same social characteristics thirty to
forty years ago. By contrast, a disappointing economic performance triggered political disaffection.
Voting plummeted among the least affluent social sectors. But abstention rates soared too among
young cohorts, particularly in countries they had been most punished by the structural transformations
of the last decades.92 As a young individual in the constituency of Barking and Dagenham, a thriving part
of East London from the time Ford opened its first factory in 1931 until the American car company
started winding down all its operations in the 1980s and then closing its last plant in 2002, put it: “The
government means nothing to me. If the Queen died tomorrow, the only thing that would change in my
life is the head printed on my bank notes. It’s everyone out for themselves. As soon as we start getting
involved, we get arrested.”93 In short, withdrawal from labor markets and ballot booths seemed to be
happening simultaneously.
The Stability of Mainstream Parties
The strong commitment of all mainstream, “Detroit”‐style parties to free markets and open borders did
not mean at all that they left unaddressed the disruption brought about by technological innovation and
globalization. If anything, the architects of the model of democratic capitalism built over the course of
the twentieth century deliberately designed a set of publicly‐funded mechanisms to protect and
compensate those individuals hurt by economic change: unemployment benefits, universal (or quasi‐
universal) health care, and old‐age pensions since at least the first years of the Cold War; followed, after
92 The effect of age and income on turnout is also present for all the other Western European countries, also surveyed in the European Social Survey but not plotted in Figure 33.
93 Reported in Gest (2016), page 57.

160
the 1970s, by the deployment of active industrial policies in response to trade shocks and the expansion
of public‐sector jobs (Katzenstein 1985). Seemingly, however, their policy responses did not go far
enough to absorb a rising tide of disaffected voters.
In retrospect, softening the blow of structural change had been relatively easy during the golden
age of democratic capitalism. But a much lower growth rate and the sharpening equality‐employment
trade‐off examined at the end of the chapter of “Silicon Valley” made policymakers’ choices harder.
Making markets more flexible risked widening the distribution of life chances among voters. And vice
versa: more generous social policies were seemingly preserving equality at the cost of very tepid
employment growth. In addition, directing more public resources to fund those programs appeared to
be increasingly out of reach for at least two reasons – both working in tandem. The first one was
demographic. The other one stemmed from the globalized nature of advanced economies.
The ageing of European, Japanese and North Americans and a correlated increase in public
spending in pensions and health care reduced policy‐makers’ fiscal capacity to address the structural
transformation of Silicon Valley. Among the seven largest advanced economies, public expenditure grew
by almost 10 percentage points of GDP between 1960 and 2007, driven almost entirely by pensions and
health programs (Schaechter and Cotarelli 2010). In 2010, public spending on pensions amounted to 8.4
percent of GDP in all advanced countries belonging to the OECD – or almost 2 percentage points more
than in 1980.94 Public health expenditure in European OECD countries also trended upward from less
than 5 percent of GDP in 1970 to about 8.6 percent of GDP in 2001 (Huber and Orosz 2003). Absent high
growth rates (of the kind in place until the 1970s), higher levels of public spending could only be funded
either by borrowing from private actors or by raising taxes. Indeed, public debt doubled from about 40
94 This includes all western European countries (except for Iceland), Australia, Canada, Japan, New Zealand and the USA. Figures are based on the OECD social expenditure database, available at http://www.oecd.org/social/expenditure.htm.

161
percent of GDP in the mid‐1970s to over 80 percent before the Great Recession in advanced industrial
economies.95 Given the considerable size of public expenditure, which generally ranged from 40 to over
50 percent of GDP across the OECD, the available room for substantial tax hikes was rather limited.
Moreover, competition from new industrializing countries with much lower taxes and labor costs made
it riskier for advanced countries to increase firms’ fiscal burden. In fact, and arguably in response to
globalization and constrained by the growth of footloose capital, OECD governments shifted the
structure of taxation starting in the 1980s. Corporate taxation fell sharply – from an average tax rate of
47.7 percent in 1981 to 27.3 percent in 2010. By contrast, personal income taxes and social security
contributions remained roughly stable over the same period. Value added taxes rose in all OECD
economies by 3 percentage points from the year they were first introduced in each country (which
varied between the late 1960s and, more frequently, the 1990s) to 2010 (Boix 2011a, Tables 1 through
3).
At the end of the day, however, the reluctance of OECD governments to recalibrate the existing
policy consensus more drastically derived from straightforward electoral calculations (greatly shaped by
the structure of abstention examined earlier in this chapter). Figure 34 examines the electoral
performance of European mainstream parties from 1918 to 2016 – both as a proportion of the whole
electorate (dashed line) and of all votes (solid line). The graph reports both trends for all mainstream
parties together. It displays them too for center‐right and center‐left party families separately. As
pointed earlier (when discussing Figure 30), mainstream parties started to lose support as a fraction of
all the electorate after 1980. But, more crucially for their parliamentary representation and their
chances to form government, their share over actual votes barely changed until 2008. Mainstream
95 The figure comes from Cecchetti et al. (2010). The list of countries included are Australia, Austria, Belgium, Canada, Denmark, France, Finland, Germany, Greece, Ireland, Italy, Japan, the Netherlands, New Zealand, Norway, Portugal, Spain, Sweden, Switzerland, the United Kingdom and the United States.
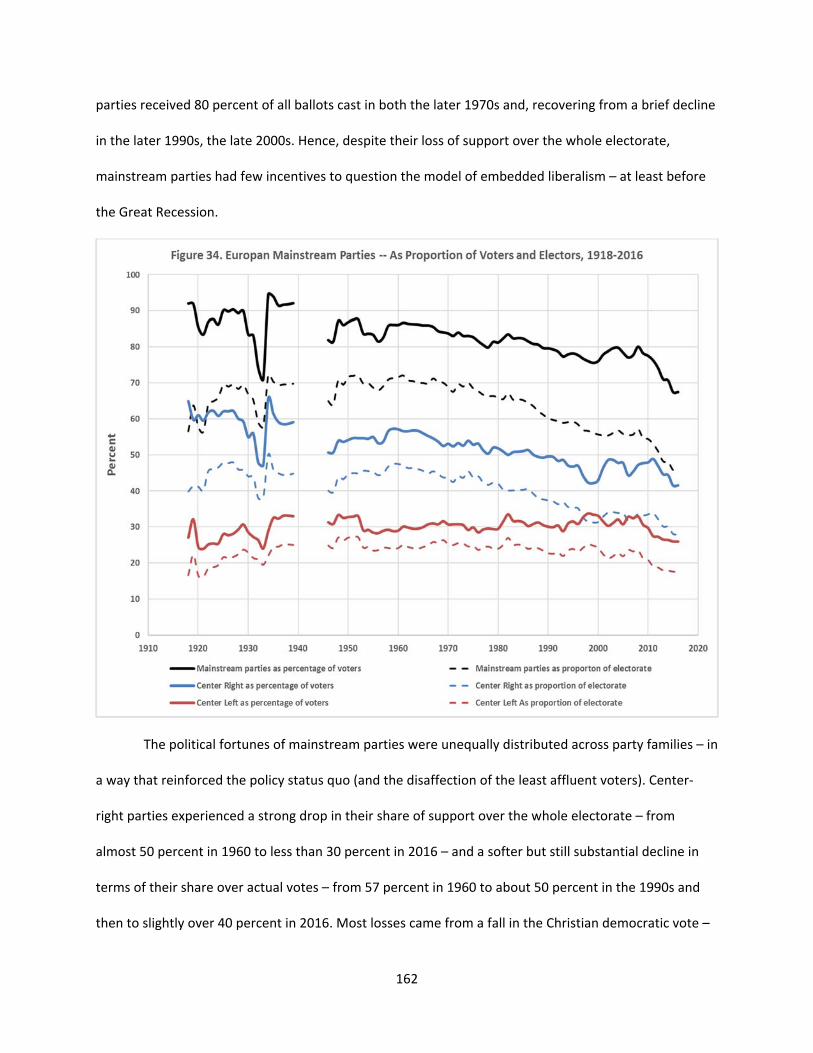
162
parties received 80 percent of all ballots cast in both the later 1970s and, recovering from a brief decline
in the later 1990s, the late 2000s. Hence, despite their loss of support over the whole electorate,
mainstream parties had few incentives to question the model of embedded liberalism – at least before
the Great Recession.
The political fortunes of mainstream parties were unequally distributed across party families – in
a way that reinforced the policy status quo (and the disaffection of the least affluent voters). Center‐
right parties experienced a strong drop in their share of support over the whole electorate – from
almost 50 percent in 1960 to less than 30 percent in 2016 – and a softer but still substantial decline in
terms of their share over actual votes – from 57 percent in 1960 to about 50 percent in the 1990s and
then to slightly over 40 percent in 2016. Most losses came from a fall in the Christian democratic vote –

163
an outcome of a process of secularization in the European continent.96 In contrast to the flagging
performance of conservatives and Christian democrats, center‐left parties, which at first sight should
have been the most damaged by the gradual political alienation of poor and young voters, enjoyed
remarkably stable levels of support until 1980 – at around 30 percent of all voters. Afterward, their vote
share enjoyed a modest upward trend – reaching 33 percent of all ballots cast in 2007.
Social democracy’s relative robust electoral performance was rooted in the explicit decision
taken by socialist politicians to court middle class voters even to the point of sacrificing their historical
reliance on blue‐collar workers. A secular decline of the manufacturing sector, which fell from
comprising a third or more of all employment until the 1970s to about one tenth of all jobs in 2010,
made it impossible to remain a viable governmental party by appealing only to blue‐collar workers. To
attract service‐sector employees, who represented more than two thirds of total employment in most
countries by the early twenty‐first century, socialist parties offered two main policies: liberal social
policies and the expansion of public employment. In addition to shoring up their electoral coalition,
increasing the number of public employees was defended as a way to ease the employment‐equality
trade‐off faced since the 1980s and to absorb the entry of women into the labor market.
As recently shown by Silja Häusermann (2017), in 1980 social democrats mobilized about twice
as many working‐class voters than middle‐class individuals. That proportion is roughly the opposite
today.97 A great deal of that compositional shift within the center‐left electorate was a direct outcome
of the growth of non‐manufacturing jobs and the decision of center‐left parties to court their holders.
But following such a “supraclass” strategy (as opposed to relying on the strict mobilization of working‐
96 By contrast, the electoral fortunes of Liberal parties hardly changed after World War Two: they were supported by 10.7 percent of the electorate (12.9 percent of all voters) in 1950, 8.5 percent of all the electorate (and 10.4 percent of votes cast) in 1970, and 7.6 percent of the electorate (and 10.6 percent of all votes) in 2007.
97 For additional research on the electoral transformation of social democratic parties, see Cronin et al. (2011), Keating and McCrone, eds. (2013), Kitschelt and Rehm (2015), Rennwalf and Evans (2014).

164
class individuals) reinforced the electoral disengagement of part of the historical electoral supporters of
socialist parties. The proportion of workers voting for left‐wing candidates fell from about two thirds in
1980 to less than one half in 2010. By contrast, the share of middle class voters voting for left parties
rose from 40 to 50 percent on average (with considerable variation across countries) over the same
period of time (Gringich and Häusermann 2015). In line with the social democratic strategies to expand
the public sector, within the service or tertiary sector, public employees were more likely to vote for
social democratic parties than private employees– at least in Northern Europe (Häusermann and Kriesi
2015).
The new electoral composition of left‐wing (and, in fact, all mainstream) parties had important
programmatic consequences. It weakened any incentives they may have had to move away from their
commitment to globalization (to protect blue‐collar workers) because relative broad swaths of middle‐
class voters benefited from the importation of cheap manufactures and from the employment of foreign
workers in low‐paid jobs ranging from restoration to domestic services (Scheve and Slaughter 2001;
Scheve and Slaughter 2006). In other words, socialists’ continuous commitment to the principles of
economic openness was reinforced – even if that meant paying a strong price among their old electoral
core – by the electoral strategy they developed in response to the transformation of the labor market.98
Politics Unhinged
The polarizing effects of a changing employment structure and rising wage inequality took time
to become explicit at the ballot box. Figure 35 displays the evolution of extreme parties in Europe over
the twentieth century – both as a percentage of actual votes (solid line) and as a proportion of the
98 In fact, many European social democratic parties ended up reinforcing some of the macroeconomic policies (most fundamentally, the adoption of the euro with its quasi gold‐standard quality) that “narrowed” their room of maneuver in monetary and regulatory policies.

165
electorate (dashed line). As in Figure 34, the graph also distinguishes between (in this case, far) left
parties, drawn in red, and (far) right parties, depicted in blue. Throughout the Cold War, support for
extreme parties fluctuated at 15 percent of total vote (and 10 to 12 percent of the whole electorate),
with four fifths of all those ballots going to communist parties. After 1980, the electoral performance of
the far left declined steadily. At the time of the collapse of the Soviet Union, political radicalism seemed
close to extinction.
The near death of extreme parties proved short‐lived, however. An increasingly anxious and, at
points, angry fraction of the electorate switched to a set of new actors promising to tackle, tame or even
block the sources of change: free trade, immigration and, much less so, technological innovation. Far
right parties started to grow in the late 1980s, tying at the polls with the extreme left by the early 1990s.

166
The Great Recession then ratcheted up votes for both extreme right organizations and, mostly in
Southern Europe, new far left parties. Still, the aggregate support for all extreme parties over the whole
electorate was only marginally above their postwar average. Nevertheless, in the context of very
substantial abstention levels, that meant gathering close to one out of every four votes cast by 2015 –
an unprecedented number since the Great Depression.
These new alternatives to mainstream politics often emerged employing the colorful language
of populism. As Donald Trump proclaimed in his inaugural speech, “… we are transferring power from
Washington, D.C., and giving it back to you, the people. For too long, a small group in our nation's
capital has reaped the rewards of government while the people have borne the cost. Washington
flourished, but the people did not share in its wealth. Politicians prospered, but the jobs left. And the
factories closed. The establishment protected itself but not the citizens of our country. Their victories
have not been your victories. Their triumphs have not been your triumphs. And while they celebrated in
our nation’s capital, there was little to celebrate for struggling families all across our land. That all
changes starting right here and right now. Because this moment is your moment. It belongs to you.”99 A
few years earlier, and at the other geographic (and economic) extreme of the Atlantic block, George
Tsipras, the leader of Syriza, a coalition of radical left parties, framed the Greek election of 2012 using
the same language and defining it “not [as] a simple confrontation between Syriza and the political
establishment of the Memorandum [but] between the Greece of the oligarchy and the Greece of
democracy.”100
Such opposition between the “ordinary people as a noble assemblage not bounded narrowly by
class” and “their elite opponents as self‐serving and undemocratic” resonated among voters not
99 NPR Illinois. “Transcript: Donald Trump Inaugural Speech”. Accessed in: http://nprillinois.org/post/transcript‐donald‐trump‐inaugural‐speech#stream/0
100 Quoted in Judis (2016), p, 116.

167
because it merely triggered emotional and prejudiced responses, as many of the critics of populism
claim, but because it blamed directly their fortunes on the “immobilism” of the traditional parties and
their unwavering commitment to the “Detroit” consensus. 101 Policy stability in the face of deep
structural change could be attributed to the “technocratic”, arms‐length style of governing of the
professional political class, who had become the manager of democratic capitalism without any of the
energy or idealism of its founders. For that very reason, it could be rejected in the name of democracy.
At the end of the day, however, populism is hardly a meaningful term: politicians and the media
throw it around to stigmatize and discredit political opponents; and different academics employ it to
name different political movements that turn out to have very little in common with each other.102
Instead, to understand the emergence of American and European “populist” parties, it is more useful to
think of most (if not all) of them as the creation of political entrepreneurs intent on transforming the
political arena through the introduction of a new policy dimension on which to compete (and succeed)
electorally: one that, as a shortcut, we may refer as pitting globalism versus nationalism.
To make sense of the new structure of politics (and the irruption of “populist” parties), Figure
36.A starts by graphing a political or electoral space defined by two policy dimensions and then locates
old and new political actors in it as a function of their most preferred position on each policy issue. The
horizontal axis measures the extent to which voters and parties support public compensation
mechanisms to redress market‐induced outcomes: political actors favoring higher (lower) taxes and
more (less) spending are located to the right (left) of the space. The vertical axis picks up variation in
support for economic openness (i.e, trade, immigration and, more generally, the need to foster or
accept economic innovation): pro‐globalization actors are placed at the top of the axis; nationalist ones,
101 The quotations come from Michael Kazin’s definition of populism as reproduced by Judis (1016), p. 14.
102 For a systematic review of populism and its multiple meanings, see, for example, Gidron and Bonikowski (2013).

168
at the bottom.
To map the policy preferences of voters, the latter are depicted, for the sake of simplicity, as
one of two types: middle‐class and working‐class individuals. Middle‐class voters comprise a broad set
of individuals that range from low clerical workers to firm managers – they correspond, roughly
speaking, to the relatively educated individuals of Figure 25 (displayed in the chapter on “Silicon
Valley”). Working‐class voters would be mostly blue‐collar workers – those semiskilled and unskilled
individuals occupying the left half of Figure 25. Given the constrained nature of globalization before
1980 (with intra‐industry trade taking place within the North; hardly any competitive industries in the
South; and scant South‐to‐North migratory flows), voters generally favored the liberal postwar
consensus embodied by GATT. Middle‐class and working‐class voters disagreed, above all, over taxes
and the redistributive role of the state. Broadly speaking, working‐class voters favored higher taxes and
more public spending.103 Still, preferences within each social group were not completely homogeneous.
Within our very broadly defined middle class, individuals in lower‐paid clerical occupations may be
103 See, among a vast literature on voters’ preferences toward public policy, Hibbs (1978, 1987).
Figure 36.A. Electoral Politics under Detroit Capitalism
High |
|
| MD R L WD
| Globalism | (Trade, Immi‐ | gration, etc.) |
| | |________________________________________ High 0 Compensation (Taxes, Public Spending)

169
safely assumed to prefer a more generous welfare state than top managers and professionals.
Accordingly, middle class voters occupy the elliptical area demarcated with a blue solid line and centroid
MD (and where D denotes preferences under Detroit capitalism): narrower on the globalization axis and
quite elongated on the tax dimension.104 In turn, working‐class voters would also exhibit some internal
heterogeneity regarding the ideal size of the public sector as a function of their incomes, intensity of
their egalitarian commitments, union membership, etc. Hence, in Figure 36.A they are located within
the elliptical structure drawn with a solid red line and denoted by WD.
Mirroring public opinion, center‐left and center‐right parties were divided, at least in economic
issues, over the appropriate level of taxes and public spending, with left‐wing parties typically
supporting a more expansive view of the public sector and the welfare state than right‐wing parties. By
contrast, their disagreements on economic openness were marginal and, in fact, declined in importance
over time. Their preferences are reproduced at points L and R respectively: with the left promising more
taxes than the right but both political parties supporting the same level of economic openness. To
construct an electoral majority, both parties espouse more moderate policies than the majority of
voters: their ideal points L and R are closer to the midpoint of the space than the voters that naturally
vote for each of them. In the context of this extremely stylized model of electoral politics, in which
voters vote for the party that promises the policy closer to their position, blue‐collar workers are more
likely to vote for the left. In turn, middle class voters were likelier to vote for center‐right parties. As
shown in the chapter on “Detroit” (and at the beginning of this chapter), that is indeed what the
electoral politics of the postwar period looked like. Mainstream parties, offering similar trade policies
104 A more precise representation would consist of graphing the location of each individual voter as a dot or point in Figure 35. Here, the elliptical figure simply indicates that all middle‐class voters are contained within it (and distributed inside with equal probability). Notice also that the circles do not represent, as is standard in spatial models of elections, the structure of the utility function of one voter (a representative agent of the middle class, for example) with respect to his ideal or bliss point. Once again, they represent the location of all the ideal points of voters.

170
and partially different tax‐and‐spend agendas, commanded the support of most voters. Generally
speaking and at least until the 1980s, voters cast their ballots according to income and class – even if the
latter’s effect declined over time, in line with the powerful equalizing tendencies of Detroit capitalism.105
There is no doubt that the structure displayed in Figure 36.A is a very simplified rendition of electoral
politics in advanced democracies. Many other factors may drive the vote, such as religion, ethnic
identity, beliefs about the efficacy of particular policies (such as favoring low taxation as a precondition
to spur growth) and personal judgments about the competence of particular politicians. Whenever they
mattered, one would expect a fraction of middle‐sector employees to lean leftwards and a fraction of
blue‐collar voters to vote for support center‐right parties. That is, for example, what Figure 16.B
(displayed in the “Detroit” chapter) revealed: in countries with a second strong political cleavage, voting
along class was more subdued.
Silicon Valley capitalism modified voters’ preferences. Particularly in countries where highly
educated individuals benefited from a high wage premium, reluctance towards more compensation
tended to rise, at least among a fraction of non‐working‐class voters. That transformation is captured in
Figure 36.B by the blue dashed ellipsis – larger than the solid‐line ellipsis (reproduced following Figure
36.A) to capture the lightly higher heterogeneity among middle‐class voters and the representative
middle‐class voter MSV slightly moving to the left in the graph. By contrast, globalization 2.0 did not
affect their positions towards economic openness because middle class voters were its net beneficiaries:
immigrants are employed in occupations that are complementary to their jobs; and offshoring has
mostly jeopardized tasks that require few skills or education (Scheve and Slaughter 2001; Dancygier and
Walter 2015).
Policy preferences among working‐class voters changed as well. In response to flat or negative
105 For a review of the recent voting literature, see cf. Häusermann (2017).

171
wage growth, they could react in two (not necessarily incompatible) directions. On the one hand, and
provided they attributed their new economic position to globalization 2.0, they could push back against
trade and migration. On the other hand, they could ask for more compensation (and higher taxes).
Figure 36.B represents the potential anti‐globalization turn of working‐class voters by shifting
their location from WD to WSV. (The dashed circle around the latter represents the fact that workers may
have slightly more heterogeneous positions over the extent of openness.) In response to that change,
and as long as mainstream parties remained firmly committed to their standard programmatic positions,
a new, “populist” candidate may eventually enter into parliaments by appealing to a growing number of
voters that felt unrepresented after she identified globalization as the main culprit behind economic
(and cultural) change and promised to reject it once in office – in a word, by locating herself somewhere
on the bottom part of the electoral space of Figure 36.106
106 Notice that a simple move from the left toward middle‐class positions in response to a reduction in the number of blue‐collar workers would not have in itself changed the structure of electoral competition, which would have been still dominated by the compensation axis. The electoral space only changed – adding a new dimension – when some fraction of the electorate believed (or was persuaded to believe) that globalization
Figure 36.B. Electoral Politics under Silicon Valley
High |
|
| MSV MD R L WD
| L’ Globalism | (Trade, Immi‐ | WSV gration, etc.) |
| <‐‐‐‐‐ “Populism” ‐‐‐‐‐> | |________________________________________ High 0 Compensation (Taxes, Public Spending)

172
The populist breakthrough amounted, therefore, to the construction of a new electoral coalition
in which the “old” working class (but also outsiders in the labor market such as the younger cohorts
entering into the labor market) played again a critical role. Already in the French presidential elections
of 1995, the leader of the National Front, Jean‐Marie Le Pen, referred to his party as “the party of the
working class”. A few electoral cycles later, her daughter, Marine Le Pen, hired Florian Philippot, a
former supporter of Pierre Chevènement, a left‐wing member of the French Socialist Party, to write a
new economic platform for the National Front. In subsequent declarations to a French newspaper,
Phillipot was adamant to state that “Jean‐Pierre Chevènement’s project is carried forward by Marine Le
Pen.”107 Across the Atlantic, Donald Trump would defend his presidential bid within the Republic party
but stating that “five, ten years from now [it would be] different party. You’re going to have a worker’s
party. A party of people that haven’t had a real wage increase in eighteen years, that are angry.”108
By framing all structural change as a consequence of globalization, protectionism trumped (and
quieted) historical disputes over the size of the welfare state that have played a key role in defining the
electoral space. Precisely because anti‐globalization parties promised to curb the putative source of
economic disruption, economic openness, they could cast aside the debate on public spending as a form
of compensation to those hurt by trade and the world business cycle. Their ambiguity toward the
welfare state could help them draw voters from the left and the right simultaneously. They could lure
left‐wing voters with their promise to restore wages and wage growth. They could attract right‐wing
voters with lower taxes. In short, “populist” parties could build a new coalition that encompassed a
fraction of the middle class voters as well as the old working class.
had to be challenged and reversed (because public compensation programs could not soften or remedy it properly).
107 Both quotes are taken from Judis (2916), pages 103 and 145.
108 “Trump: GOP’s will become ‘workers’ party’ under me.” Politico, May 26, 2016. http://www.politico.com/story/2016/05/trump‐gop‐workers‐party‐223598

173
Using the European Social Survey of 2014, Figure 36 (Panels A through F) reports the percentage
of voters supporting “populist” parties in six European countries: two Nordic countries, Denmark and
Finland; two continental cases with high support for non‐mainstream parties, France and the
Netherlands; Germany; and the United Kingdom. Each graph displays the “populist” share by income
quintile – aligned left to right from poorest to richest. For each quintile it also shows the share of
“populist” parties among voters that are most vulnerable from an economic point of view, defining
vulnerability in two ways: individuals that had been unemployed and seeking work for a period of more
than three months; and voters working (of having worked) in mining and manufacturing sectors exposed
to the competition of emerging economies.109
Aggregate support for non‐mainstream parties varies by country. It is low in Germany and the
United Kingdom and high otherwise.110 Cross‐national differences in electoral performance respond to
two factors: the structure of the economy and the nature of electoral rules. Globalization 2.0 has mainly
hurt workers in industries, such as textiles, toys and furniture, directly undercut by new emerging
economies and the formation of a global value chain. Many of those low‐value sectors are (or were)
located in the European periphery but much less so in Mitteleuropa. Hence, non‐mainstream parties’
poor performance in Germany seems to be a direct outcome of that country’s reliance on high‐value‐
added industries that are still highly competitive in the world economy. As for the United Kingdom,
demand for non‐standard policies is strong in its Northern, more deprived regions – as attested by the
109 Inclusion in the income quintile is based on household's total net income (question F41 in ESS 2014). Past experience of unemployment is taken from question F36. Working on a tradable sector is derived from recoding question F31. Italy was not included in the European Social Survey of 2014. Belgium is not reported here because the regional divide makes classifying parties complex. The classification between left and right parties is based, following Simon Hix’s work, on their membership in the European Parliament. Left parties are those included in the European United Left‐Nordic Green Left (GUE‐NGL) Parliamentary Group. Right parties are part of two European Parliamentary Groups: Europe of Nations and Freedom and Europe of Freedom and Direct Democracy. The True Finns and the Danish People’s Party, which were founding members the Europe of Freedom and Democracy, are also counted as right‐wing parties.
110 In Sweden, which is not shown here, support is moderate to high.

174
outcome of the Brexit referendum. However, UKIP’s lackluster electoral performance is the result of
Britain’s first‐past‐the‐post electoral system, which kills third parties quite effectively and which gives
existing parties time to readjust their programs to preempt the entry of new forces.
Regardless of the average level of support, “populist” parties are consistently stronger among
low‐income voters – in line with the theoretical expectations developed with the help of the spatial
model of elections graphed in Figure 36.B. Whereas one out of four Danish voters in the bottom quintile
supported the People’s Party, only one out of eight voters in the top quintile cast a ballot for any
populist party. That electoral ratio (or a factor of 2 poor voters to one rich voter) is similar in Finland (25
to 13 percent), Germany (18 to 8 percent) and Britain (9 to 4 percent). It rises to a factor of three to one
in France (20 to 7 percent) and the Netherlands (30 to 9 percent). The share of “populist” voters
becomes larger among low‐income individuals in tradable sectors in Denmark, Finland, France and
Finland. Having been unemployed has a positive but smaller effect on the probability of voting for anti‐
globalization parties.

175
The internal composition of the “populist” electoral space varied across countries: a single,
strictly anti‐globalization party, like in the United Kingdom; a hegemonic left‐wing anti‐system party, like

176
Germany’s Linke; or several populist parties located along the left‐right electoral dimension, as in
France. The particular constellation of populist parties has depended on the electoral system and on the
cultural and symbolic repertoire available to them in each country. Majoritarian systems, which impose
high entry barriers to new parties, has forced them to coordinate around one platform and to stress the
anti‐globalization card while downplaying the compensation dimension. Proportional systems, which
make entering parliament much easier than majoritarian systems, have instead facilitated the
emergence of separate left‐wing and right‐wing anti‐globalization political forces. Historical memory and
the set of programmatic appeals that are acceptable within the existing national discourse have also
mattered. In countries that were not tainted by fascism during World War Two, that is, that did not elect
right‐wing totalitarian governments or collaborated with Nazi rule massively, anti‐globalization parties
have been able to appeal to national sovereignty as a (or “the”) necessary precondition for democracy –
the United Kingdom or the United States. In countries like Germany and Italy, haunted by the memory
of Fascism, anti‐system parties have avoided any connection to the idea of nation to be successful: they
have stressed technocratic qualities or have run on left‐wing appeals. Finally, those countries with a
fractured historical experience, such as France, which was painfully split between the Vichy regime and
the resistance movement in the 1940s, have developed both nationalist parties on the right and a
postcommunist extreme left.
The success of new far right and far left parties running on anti‐globalist programs has relied on
their capacity to develop a political narrative linking the structural change of Silicon Valley with
globalization.111 As discussed in the chapter on “Silicon Valley”, skilled‐biased technological change (as
opposed to offshoring and migration) has probably been the main (albeit not the sole) driver of
111 Once again, it also relies on an “unresponsive” political establishment: populist parties used the latter’s “bank‐friendly” response to the financial meltdown of 2007‐08 could be used to “demonstrate” its detachment vis‐à‐vis the true concerns of voters.

177
employment change and wage inequality. Yet, in the electoral arena it has played a much more subdued
role ‐‐ perhaps because blaming particular social groups or countries may be easier than attacking an
impersonal force such as technological innovation to win votes. Nevertheless, that means that an anti‐
globalization program is not the only, automatic response to the disruptions brought about by Silicon
Valley. An alternative political response would consist of explaining them as a result of technological
innovation rather than globalization and then promising to follow a more radical compensation strategy
– in the form of higher taxes on high‐skilled individuals, a universal basic income, etc.112 In the political
space depicted in Figure 36, that would be tantamount to locating oneself in a more radical position L’ –
advocating high levels of taxes and public spending and a pinch of protectionism. In that case, instead of
politics being defined by a clash between globalists and nationalists, electoral competition still takes
place along the old but now much more polarized left‐right dimension. Today, this corresponds to
Bernie Sanders’ critique of the American top one percent as an “oligarchy” that should be taxed and
domesticated and British Labour under Jeremy Corbyn, with its proposal to renationalize railways and
some utilities, reestablish rent control, raise taxes on the wealthy, and beef up the minimum wage
across the board.
To sum up, the rise of populist‐protectionist parties in Europe and the resurgence of radical left
politics constitute different manifestations of the same problem: the wage and employment changes
brought about by Silicon Valley capitalism threaten to bury the centripetal politics of the past, replacing
them with a level of political polarization and conflict unheard of under the Detroit model. That leads
quite naturally to one (or perhaps the) key question in our exploration of the possibilities of democratic
capitalism: How politically disruptive can all the ongoing technological and economic transformations
112 An even more radical (Luddite) policy program would offer to block technical change altogether. However, that seems implausible given a generalized faith in technological progress in western societies and the fact that, after being banned or heavily taxed, technological innovation would continue to happen in a different political jurisdiction.

178
be? To what extent can they threaten the combination of democracy and free markets? Are there any
measures that could be taken to minimize any clash between the two principles?
I turn to sketch a response to these questions in the concluding chapter. I first engage in some
conceptual brush clearing: I make explicit the set of assumptions that are behind the great variety of
conflicting predictions that are being offered about the nature of automation and its potential economic
effects. I then consider the potential long‐run political consequences of Silicon Valley capitalism. I finally
suggest a set of policy interventions to channel its economic and social effects to the advantage of the
majority.