demographic characteristics and trends in texas and workforce … · 2019-03-11 · texas added...
TRANSCRIPT

@TexasDemography
Demographic Characteristics and Trends in Texas and Workforce
Development
Texas Workforce Development Council
Austin, Texas
February 13, 2019

Growing States, 2010-2018
Rank State 2010 2017 2018Numeric growth
2017-2018
Percent Growth 2017-2018
Percent Growth 2010-2018
1 Texas 25,146,114 28,322,717 28,701,845 379,128 1.3% 14.1%
2 Florida 18,804,580 20,976,812 21,299,325 322,513 1.5% 13.3%
3 California 37,254,523 39,399,349 39,557,045 157,696 0.4% 6.2%
4 Arizona 6,392,288 7,048,876 7,171,646 122,770 1.7% 12.2%
5 North Carolina 9,535,736 10,270,800 10,383,620 112,820 1.1% 8.9%
Source: U.S. Census Bureau. 2000 and 2010 Census Count, 2018 Population Estimates.
2

Texas added 379,128 people between July
1, 2017 and July 1, 2018.
• About 1,039 people per day added to
our population.
• About 524 persons per day from
natural increase (more births than
deaths)
• About 515 per day from net
migration (288 international and
227 domestic migrants per day).
Natural Increase
50%
Domestic Migration
22%
International Migration
28%
Source: U.S. Census Bureau, 2018 Population Estimates.3

Dallas
Howard
Foard
Floyd
Brewster
Franklin
Hunt
Newton
Starr
Kinney
Collingsworth
TomGreen
Coleman
Brazoria
Leon
Duval
Lamb
Morris
Smith
Jackson
Medina
Wheeler
Dallam
Callahan
Lamar
Coryell
Gaines
Kendall
Nacogdoches
Milam
Hays
Willacy
Johnson
Reagan
Webb
Shackelford
Bowie
Scurry
Kenedy
Somervell
Oldham
Taylor
King
Borden
Walker
Stephens
Deaf Smith
Roberts
Tyler
Val Verde
Brown
Parker
Harris
Zapata
RedRiver
Karnes
PaloPinto
GlasscockShelby
Wood
Crosby
Refugio
Burnet
Sterling
Montgomery
San Augustine
Rains
Nueces
Jack
Swisher
Camp
Brazos
Orange
Colorado
Pecos
Cochran
Parmer
Freestone
Winkler
Wichita
Gray
Schleicher
Hardeman
TravisGillespie
Yoakum
Fayette
Uvalde
Grimes
VanZandt
Throckmorton
Falls
Grayson
Ellis
Hall
Dickens
TrinityReeves
Marion
Terrell
Lynn
La Salle
Jasper
Jones
Castro
Victoria
Kleberg
Briscoe
Clay
Matagorda
Brooks
Runnels
Carson
Liberty
Lee
Hale
Bexar
Garza
Montague
Upton
Hamilton
FisherDawson
Dimmit
Hutchinson
Llano
Presidio
Eastland
Sabine
Wharton
Rusk
Tarrant
Lavaca
Childress
Hidalgo
Kaufman
Moore
Menard
Edwards
SanPatricio
Terry
Crockett
Houston
Waller
Coke
Ward
Titus
Lampasas
Haskell
Martin
Atascosa
Hemphill
Hartley
Young
BurlesonHardin
Gonzales
McMullen
Erath
Galveston
Hopkins
McLennan
MadisonMcCulloch
Donley
Kent
Real
Sutton
Midland
Hudspeth
Zavala
Harrison
Comanche
Mitchell
Navarro
Crane
Lubbock
Wise
Washington
Jeff Davis
El Paso
Gregg
Williamson
Lipscomb
Mason
Henderson
Hansford
Chambers
Hill
Potter
Jim Wells
DeltaStonewall
Ector
Cameron
Maverick
Collin
Baylor
Panola
Guadalupe
Bastrop
Austin
Andrews
Anderson
Blanco
DeWitt
Bandera
Bell
Aransas
Archer
Armstrong
Bee
Angelina
Bailey
Jefferson
Frio
Fannin
Goliad
Loving
Cass
Fort
Bend
Bosque
Hockley
SanSaba
Kerr
Mills
Cooke
Wilbarger
Irion
Caldwell
JimHogg
Culberson
Upshur
Cherokee
Denton
Concho
Randall
Kimble
Knox
Polk
Hood
San Jacinto
Robertson
Wilson
Nolan
Cottle
Calhoun
Rockwall
Live
Oak
Motley
Sherman Ochiltree
Comal
Total Estimated Population by County, Texas, 2017
Source: U.S. Census Bureau, 2017 Vintage Population Estimates
Legend
tl_2010_48_county10
POPESTIMATE2017
134 - 10,000
10,001 - 100,000
100,001 - 500,000
500,001 - 2,000,000
2,000,001 - 4,652,980
87%
4

Estimated Population Change, Texas Counties, 2010 to 2017
Source: U.S. Census Bureau, 2017 Vintage Population Estimates
Dallas
Howard
Foard
Floyd
Brewster
FranklinHunt
Newton
Starr
Kinney
Collingsworth
TomGreen
Coleman
Brazoria
Leon
Duval
Lamb
Morris
Smith
Jackson
Medina
Wheeler
Dallam
Callahan
Lamar
Coryell
Gaines
Kendall
Nacogdoches
Milam
Hays
Willacy
Johnson
Reagan
Webb
Shackelford
Bowie
Scurry
Kenedy
Somervell
Oldham
Taylor
King
Borden
Walker
Stephens
Deaf Smith
Roberts
Tyler
Val Verde
Brown
Parker
Harris
Zapata
RedRiver
Karnes
PaloPinto
GlasscockShelby
Wood
Crosby
Refugio
Burnet
Sterling
Montgomery
San Augustine
Rains
Nueces
Jack
Swisher
Camp
Brazos
Orange
Colorado
Pecos
Cochran
Parmer
Freestone
Winkler
Wichita
Gray
Schleicher
Hardeman
TravisGillespie
Yoakum
Fayette
Uvalde
Grimes
Van
Zandt
Throckmorton
Falls
Grayson
Ellis
Hall
Dickens
TrinityReeves
Marion
Terrell
Lynn
La Salle
Jasper
Jones
Castro
Victoria
Kleberg
Briscoe
Clay
Matagorda
Brooks
Runnels
Carson
Liberty
Lee
Hale
Bexar
Garza
Montague
Upton
Hamilton
FisherDawson
Dimmit
Limestone
Hutchinson
Llano
Presidio
Eastland
Sabine
Wharton
Rusk
Tarrant
Lavaca
Childress
Hidalgo
Kaufman
Moore
Menard
Edwards
SanPatricio
Terry
Crockett
Houston
Waller
Coke
Ward
Titus
Lampasas
Haskell
Martin
Atascosa
Hemphill
Hartley
Young
BurlesonHardin
Gonzales
McMullen
Erath
Galveston
Hopkins
McLennan
Madison
McCulloch
Donley
Kent
Real
Sutton
Midland
Hudspeth
Zavala
Harrison
Comanche
Mitchell
Navarro
Crane
Lubbock
Wise
Washington
Jeff Davis
El Paso
Gregg
Williamson
Lipscomb
Mason
Henderson
Hansford
Chambers
Hill
Potter
Jim Wells
Delta
Stonewall
Ector
Cameron
Maverick
Collin
Baylor
Panola
Guadalupe
BastropAustin
Andrews
Anderson
Blanco
DeWitt
Bandera
Bell
Aransas
Archer
Armstrong
Bee
Angelina
Bailey
Jefferson
Frio
Fannin
Goliad
Loving
Cass
FortBend
Bosque
Hockley
SanSaba
Kerr
Mills
Cooke
Wilbarger
Irion
Caldwell
Jim
Hogg
Culberson
Upshur
Cherokee
Denton
Concho
Randall
Kimble
Knox
Polk
Hood
San Jacinto
Robertson
Wilson
Nolan
Cottle
Calhoun
Rockwall
LiveOak
Motley
ShermanOchiltree
Comal
Legend
tl_2010_48_county10
popch1017Base
-2,218 - 0
1 - 5,000
5,001 - 25,000
25,001 - 100,000
100,001 - 545,553
Legend
tl_2010_48_county10
popch1017Base
-2,218 - 0
1 - 5,000
5,001 - 25,000
25,001 - 100,000
100,001 - 545,553
5

Estimated Percent Population Change by County, Texas, 2010 to 2017
Source: U.S. Census Bureau, 2017 Vintage Population Estimates 6
Pecos
Brewster
Webb
Hudspeth
Presidio
Terrell
CulbersonReeves
Crockett
Val Verde
Hill
Duval
Harris
Bell
Frio
Kerr
Clay
Polk
Kenedy
Hall
Starr
Irion
Edwards
Ellis
Jeff Davis
Dallam
Hale
Sutton
Uvalde
Hartley
Leon
Gaines
Bee
Bexar
King
Upton
Erath
Jack
GrayOldham
Kent
Hidalgo
Kinney
Cass
Tyler
Lynn HuntWise
Zavala
Brazoria
Lamb Floyd
Dimmit
Rusk
Terry
Kimble
Coke
Medina
Llano
Andrews
Ector
Knox
Milam
Smith
Falls
Potter
Collin
Jones
Ward
Cottle
Nolan Taylor
Bowie
Motley
Young
Moore
Lamar
Garza
Real
Martin
Dallas
Nueces
Fisher
Baylor Archer
Scurry
Cooke
Castro
Deaf Smith
Parker
Donley
Mason
Kleberg
Hardin
Schleicher
Foard
Gillespie
Wood
Panola
Menard
Harrison
La Salle
LibertyTravis Lee
Mills
Burnet
Coryell
Brown
Reagan Houston
Matagorda
Zapata
Coleman
Jasper
Maverick
Bailey
Tom Green
Navarro
Denton
Fannin
Carson
Bosque
DeWitt
El Paso
Cameron
Lavaca
Hays
Tarrant
Crosby
Brooks
Atascosa
Runnels
Goliad
CraneConcho
Borden
Wharton
Fayette
Randall
Haskell
BriscoeParmer
Roberts
Newton
ShelbySterling
Mitchell
Calhoun
Jefferson
Grayson
Live Oak
Trinity
Howard
Wilson
McMullen
Swisher
Hockley
Victoria
Dickens
Walker
Midland
San Saba
Jim Hogg
Wheeler
Bastrop
Winkler
Dawson
Anderson
Gonzales
Hemphill
Grimes
Cherokee
Lubbock
Red River
Ochiltree
Eastland
ShermanHansford
Willacy
Colorado
Wilbarger
Williamson
Austin
Karnes
Loving
Blanco
Callahan
Lipscomb
Refugio
McCulloch
Jackson
Yoakum
McLennan
Hopkins
Angelina
StephensPalo Pinto
Stonewall
Montague
Hamilton
Cochran
Bandera
Armstrong
Kaufman
Titus
Limestone
Freestone
Wichita
Fort Bend
Comanche
Jim Wells
Glasscock
Johnson
KendallComal
Henderson
Van Zandt
Montgomery
Galveston
Brazos
Hutchinson
Robertson
Upshur
Chambers
Sabine
Hood
Waller
Childress
Shackelford
Burleson
Nacogdoches
Collingsworth
Lampasas
Hardeman
Throckmorton
Guadalupe
Caldwell
Marion
AransasSan Patricio
Madison
Delta
San Jacinto
Washington Orange
RainsMorris
San Augustine
Franklin
Rockwall
Legend
tl_2010_48_county10
Pctch1017
-33.5% - 0%
0.1% - 2.5%
2.6% - 10%
10.1% - 20%
20.1% - 63.4%

County
U.S. Rank
Population
Change
Population
Change
Percent of Change
from Natural
Increase
Percent of Change
from Domestic
Migration
Percent of Change
from International
Migration
Harris* 4 35,939 128.8% -126.0% 97.2%
Tarrant 5 32,729 47.9% 29.0% 23.1%
Bexar 7 30,831 47.8% 33.4% 18.8%
Dallas 8 30,686 78.0% -25.5% 47.6%
Denton 9 27,911 23.3% 67.0% 9.7%
Collin 10 27,150 24.4% 56.5% 19.0%
Fort Bend 14 22,870 29.4% 48.1% 22.6%
Travis 15 22,116 47.9% 22.1% 30.0%
Williamson 19 19,776 20.1% 73.5% 6.3%
Montgomery 28 16,412 22.7% 68.5% 8.8%
Hidalgo* 49 10,474 105.9% -34.5% 28.5%
* Hidalgo and Harris Counties had negative net migration (Harris -10,322 and Hidalgo -621).
Source: U.S. Census Bureau, 2017 Vintage Population Estimates
Top Counties for Numeric
Growth in Texas, 2016-2017
7

Top Counties for Percent
Growth* in Texas, 2016-2017
County
U.S. Rank
2015-2016 Percent
Population Change
Percent of Change
from Domestic
Migration
Percent Change from
International
Migration
Comal 2 5.1% 90.7% 1.9%
Hays 4 5.0% 81.6% 2.8%
Kendall 5 4.9% 96.3% 3.3%
Kaufman 11 4.1% 83.0% 2.2%
Rains 13 4.0% 103.1% 2.9%
Williamson 16 3.7% 73.5% 6.3%
Rockwall 22 3.6% 81.8% 2.4%
Parker 26 3.6% 89.7% 1.3%
Denton 32 3.5% 67.0% 9.7%
Guadalupe 36 3.3% 81.4% 2.7%
Ellis 44 3.1% 78.2% 3.0%
Llano 45 3.1% 119.8% 0.5%
Fort Bend 48 3.1% 48.1% 22.6%
*Among Counties with 10,000 or more population in 2017
Source: U.S. Census Bureau, 2017 Vintage Population Estimates 8

-18.6%
-5.1% -4.6% -4.3%-2.7%
4.9% 5.0%7.3% 8.1%
11.4%13.9%
17.1%
31.2%
-20.0%
-10.0%
0.0%
10.0%
20.0%
30.0%
Estimated Percent of Total Net-Migrant Flow for Texas and Other States, 2016
Source: Internal Revenue Service, 2018. Migration Tables, 2015-16 9

Annual Shares of Recent Non-Citizen Immigrants to Texas by World Area of Birth, 2005-2015
44.1%
50.6%
69.4%
35.8%
33.0%
17.3%
7.1%
7.3%
7.8%
13.1%
9.1%
5.5%
2015
2010
2005
Latin America Asia Europe Africa and Other
Sources: U.S. Census Bureau, American Community Survey, 1-Year PUMS. Population estimates 2017 vintage and 2000-2010 intercensual estimates
Estimated number
of international
migrants to Texas
101,588
77,702
98,194
10

Population Density for Census Tracts, Texas, 2016
Source: U.S. Census Bureau, American Community Survey, 2012-2016 5-Year Sample 11

Estimated number of civilian veterans, Texas counties, 2013-2017
12Source: U.S. Census Bureau, American Community Survey, 2013-2017 5-Year Sample

Percent of the population who are civilian veterans, Texas Counties, 2013-2017
13Source: U.S. Census Bureau, American Community Survey, 2013-2017 5-Year Sample

Projected population by race and ethnicity, Texas, 2020-2050
0
5,000,000
10,000,000
15,000,000
20,000,000
25,000,000
30,000,000
35,000,000
40,000,000
45,000,000
50,000,000
20
20
20
21
20
22
20
23
20
24
20
25
20
26
20
27
20
28
20
29
20
30
20
31
20
32
20
33
20
34
20
35
20
36
20
37
20
38
20
39
20
40
20
41
20
42
20
43
20
44
20
45
20
46
20
47
20
48
20
49
20
50
Total Pop
NH White Total
Hispanic Total
NH Black Total
NH Asian Total
NH Other Total
14Source: Texas Demographic Center 2018 Population Projections

300000 200000 100000 0 100000 200000 300000
Under 1 year
5 years
10 years
15 years
20 years
25 years
30 years
35 years
40 years
45 years
50 years
55 years
60 years
65 years
70 years
75 years
80 years
85 years
90 years
95 + years
NH White Male Hispanic Male NH Black Male NH Asian Male NH Other Male
NH White Female Hispanic Female NH Black Female NH Asian Female NH Other Female
Texas Projected Population Pyramid by Race/Ethnicity, 2020
Source: Texas Demographic Center 2018 Population Projections 15
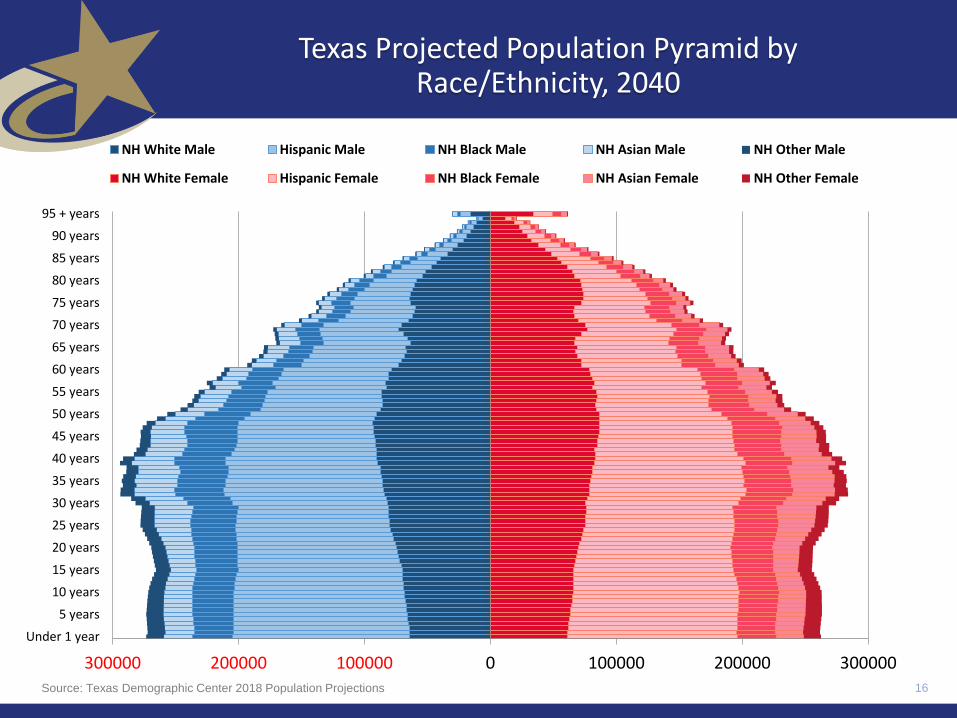
300000 200000 100000 0 100000 200000 300000
Under 1 year
5 years
10 years
15 years
20 years
25 years
30 years
35 years
40 years
45 years
50 years
55 years
60 years
65 years
70 years
75 years
80 years
85 years
90 years
95 + years
NH White Male Hispanic Male NH Black Male NH Asian Male NH Other Male
NH White Female Hispanic Female NH Black Female NH Asian Female NH Other Female
Source: Texas Demographic Center 2018 Population Projections
Texas Projected Population Pyramid by Race/Ethnicity, 2040
16

Percent of the population aged 25 years and older with a bachelor’s degree or higher, Texas counties,
2012-2016
Source: U.S. Census Bureau, American Community Survey, 2012-2016 5-Year Sample 17

Percent of persons aged 25 years and older with less than an high school diploma, Texas counties, 2017
18
Legend
tl_2010_48_county10
PctLTHS
5.5% - 10%
10.1% - 20%
20.1% - 30%
30.1% - 40%
40.1% - 58.6%
Source: U.S. Census Bureau, American Community Survey, 2013-2017 5-Year Sample

Percent of the population aged 5 years and older who do not speak English at home and speak English less than very
well, Texas Counties, 2017
19Source: U.S. Census Bureau, American Community Survey, 2013-2017 5-Year Sample
Pecos
Brewster
Webb
Hudspeth
Presidio
Terrell
CulbersonReeves
Crockett
Val Verde
Hill
Duval
Harris
Bell
Frio
Kerr
Clay
Polk
Kenedy
Hall
Starr
Irion
Edwards
Ellis
Jeff Davis
Dallam
Hale
Sutton
Uvalde
Hartley
Leon
Gaines
Bee
Bexar
King
Upton
Erath
Jack
GrayOldham
Kent
Hidalgo
Kinney
Cass
Tyler
Lynn HuntWise
Zavala
Brazoria
Lamb Floyd
Dimmit
Rusk
Terry
Kimble
Coke
Medina
Llano
Andrews
Ector
Knox
Milam
Smith
Falls
Potter
Collin
Jones
Ward
Cottle
Nolan Taylor
Bowie
Motley
Young
Moore
Lamar
Garza
Real
Martin
Dallas
Nueces
Fisher
Baylor Archer
Scurry
Cooke
Castro
Deaf Smith
Parker
Donley
Mason
Kleberg
Hardin
Schleicher
Foard
Gillespie
Wood
Panola
Menard
Harrison
La Salle
LibertyTravis Lee
Mills
Burnet
Coryell
Brown
Reagan Houston
Matagorda
Zapata
Coleman
Jasper
Maverick
Bailey
Tom Green
Navarro
Denton
Fannin
Carson
Bosque
DeWitt
El Paso
Cameron
Lavaca
Hays
Tarrant
Crosby
Brooks
Atascosa
Runnels
Goliad
CraneConcho
Borden
Wharton
Fayette
Randall
Haskell
BriscoeParmer
Roberts
Newton
ShelbySterling
Mitchell
Calhoun
Jefferson
Grayson
Live Oak
Trinity
Howard
Wilson
McMullen
Swisher
Hockley
Victoria
Dickens
Walker
Midland
San Saba
Jim Hogg
Wheeler
Bastrop
Winkler
Dawson
Anderson
Gonzales
Hemphill
Grimes
Cherokee
Lubbock
Red River
Ochiltree
Eastland
ShermanHansford
Willacy
Colorado
Wilbarger
Williamson
Austin
Karnes
Loving
Blanco
Callahan
Lipscomb
Refugio
McCulloch
Jackson
Yoakum
McLennan
Hopkins
Angelina
StephensPalo Pinto
Stonewall
Montague
Hamilton
Cochran
Bandera
Armstrong
Kaufman
Titus
Limestone
Freestone
Wichita
Fort Bend
Comanche
Jim Wells
Glasscock
Johnson
KendallComal
Henderson
Van Zandt
Montgomery
Galveston
Brazos
Hutchinson
Robertson
Upshur
Chambers
Sabine
Hood
Waller
Childress
Shackelford
Burleson
Nacogdoches
Collingsworth
Lampasas
Hardeman
Throckmorton
Guadalupe
Caldwell
Marion
AransasSan Patricio
Madison
Delta
San Jacinto
Washington Orange
RainsMorris
San Augustine
Franklin
Rockwall
Legend
tl_2010_48_county10
PctLangHNotEngLTVW
0% - 5%
5.1% - 10%
10.1% - 15%
15.1% - 30%
30.1% - 57.3%

Percent distribution of educational attainment of native born and foreign born persons aged 25 years and older,
Texas, 2016
9.5%
16.2%
24.3%
21.4%
3.9%
15.9%
8.8%
14.9%
29.7%
21.8%
19.3%
2.1%
7.6%
4.6%
0.0%
5.0%
10.0%
15.0%
20.0%
25.0%
30.0%
35.0%
0 to 4th Grade 5th to 8th Grade 9th to 12thGrade (nodiploma)
High SchoolGraduate
GED Some College to2-yr Degree
Bacelors Degeeand Higher
Not English Fluent, Native Born Not English Fluent, Foreign Born
20
About 1,387,310 person are foreign born and are not English fluent
About 118,868 persons are native born and are not English fluent
Source: U.S. Census Bureau, American Community Survey, 5-Year Sample 2012-2016

Percent of persons aged 25 years and older who are English fluent, native-born, and did not obtain a high
school diploma, Texas, 2016
0 to 4th Grade, 8.9%
5th to 8th Grade, 16.5%
9th to 12th Grade (no
diploma), 74.6% About 2,348,170 Texans are English fluent but did not complete high school
21Source: U.S. Census Bureau, American Community Survey, 5-Year Sample 2012-2016

Percent Distribution of Educational Attainment of Persons Aged 25 Years and Older, Texas, 2008, 2011, and 2015
20.4% 18.9% 17.6%
25.4% 25.5% 25.3%
28.8% 29.1% 28.7%
17.1% 17.7% 18.7%
8.3% 8.7% 9.7%
0%
10%
20%
30%
40%
50%
60%
70%
80%
90%
100%
2008 2011 2015
Perc
ent
Year
Graduate or ProfessionalDegree
Bachelor Degree
Some College or AssociateDegree
High School or Equivelent
Less than High School42.9%
57.1%
45.8%
54.2%
Source: U.S. Census Bureau, American Community Survey, 1-Year Samples, 2008-2015 22

Trends in percent distribution of educational attainment among the population aged 25 years and older, Texas,
2010-2017 and linear forecast
0.0%
5.0%
10.0%
15.0%
20.0%
25.0%
30.0%
High School or Equiv
Some College
LT High School
Bachelors
Graduate andProfessionalAssociates
23Source: U.S. Census Bureau, American Community Survey, 2010-2017 1-Year Samples

20
25
30
35
40
45
50
55
60
Mill
ion
s
Zero Net Migration
Half 2000 -2010
2000 -2010
2010 -2015
Estimates
Projected Population Growth in Texas, 2010-2050
24Source: Texas Demographic Center 2018 Population Projections

Contact
State Demographer
Texas Demographic Center
Office: (210) 458-6530
Email: [email protected]
Internet: Demographics.Texas.gov
Lloyd Potter, Ph.D.
@TexasDemography
25

11.8% 12.2%6.7%
36.5% 33.6%
29.6%
14.2% 23.9%
27.6%27.5%
36.3%
15.9%
32.2%
22.7%24.0%
22.4%
57.7%
37.2%
13.2% 15.0%
0%
10%
20%
30%
40%
50%
60%
70%
80%
90%
100%
Bachelor, Graduate,Professional Degree
Some College orAssociate Degree
High School orEquivelant
Less than High School
26
Educational Attainment of Persons Age 25 Years and Older by Race/Ethnicity, Texas, 2015
Source: U.S. Census Bureau, American Community Survey, 1-Year Sample, 2015
35.9%
69.4 %

Trends in percent distribution of educational attainment among Hispanics aged 25 years and older, Texas, 2010-
2017 and linear forecast
0.0%
5.0%
10.0%
15.0%
20.0%
25.0%
30.0%
35.0%
40.0%
45.0%
LT High School
High School or Equiv
Some College
Bachelors
Associates
Graduate Professional
27Source: U.S. Census Bureau, American Community Survey, 2010-2017 1-Year Samples

Trends in percent distribution of educational attainment among non-Hispanic Whites aged 25 years and older,
Texas, 2010-2017 and linear forecast
0.0%
5.0%
10.0%
15.0%
20.0%
25.0%
30.0%
35.0%
40.0%
45.0%
Some College
High School or Equiv
Bachelors
Graduate Professional
Associates
LT High School
28Source: U.S. Census Bureau, American Community Survey, 2010-2017 1-Year Samples

Trends in percent distribution of educational attainment among African-Americans aged 25 years and older, Texas,
2010-2017 and linear forecast
0.0%
5.0%
10.0%
15.0%
20.0%
25.0%
30.0%
35.0%
40.0%
45.0%
High School or Equiv
Some College
LT High School
Bachelors
Associates
Graduate andProfessional
29Source: U.S. Census Bureau, American Community Survey, 2010-2017 1-Year Samples

Trends in percent distribution of educational attainment among Asians aged 25 years and older, Texas, 2010-2017
and linear forecast
0.0%
5.0%
10.0%
15.0%
20.0%
25.0%
30.0%
35.0%
40.0%
45.0%
Bachelors
Graduate andProfessional
LT High School
High School or Equiv
Some College
Associates
30Source: U.S. Census Bureau, American Community Survey, 2010-2017 1-Year Samples