demography and population growth. some basic questions n 1what are the characteristics of...
TRANSCRIPT

Demography and Population Growth
Some Basic Questions
1 What are the characteristics of populations? What parameters can we measure? How do populations differ in density, age distribution, and so on.
2 how do populations grow? Are there consistent patterns of changes in abundance among species? How can we describe these changes?
Some Questions
3 How are the number of individuals in a population controlled? What limits population size? What determines stability?
4 How should individuals budget their energy so as to maximize their inclusive fitness?
5 How is variation between individuals generated and maintained?
Some Questions
6 How do individuals in a population interact? How do ecological factors affect those interactions in an evolutionary sense?
Demography
Let’s begin by addressing question 1. How do we describe populations?
First, what is a population?– It is a group of conspecifics inhabiting a
specific place at a specific time. Thus, we must define both the spatial
and temporal boundaries.
Defining Populations
Spatial boundaries are difficult for many species. For example, is there just a single population of humans, or can we consider many. With modern transportation, most humans are fairly well connected, although many are not.
How about flying squirrels on mountain-tops in Mexico. They represent a distinct population relative to all others.
Defining Populations
How about the temporal scale? This depends on the life expectancy of
the organism being studied. If you are working on fruit flies with life spans of at most a few days, then a timescale of several weeks might be appropriate. How about if you are studying Galapagos Tortoises?

Defining Populations We must be careful.
– If our spatial and temporal limits are too narrow, we will miss potentially important phenomena.
– If our limits are defined too broadly, we quickly run out of resources and can not complete our study.
This is important because we are interested in changes in allele frequencies within a ‘population’ over time.
Defining Populations
There are additional difficulties. Consider plants that reproduce
asexually. Here, a large number of ‘individuals’ may be genetically identical. Where is the boundary of the population? Does the population contain but a single individual?
Defining Populations
Consider house mice (Mus musculus) in barns.
– The population is organized into smaller groups called Demes.
– Demes may be organized into smaller family units.

Defining Populations
All of this is important because we are concerned with evolution.
The history of the population may play a role in its genetic structure, as in the Cheetah.
If we want to understand why a population is the way it is, we must be capable of dealing with these issues.
Population Density Perhaps the most fundamental population
parameter is population density. This is not population size, it is the
number of individuals per unit area. Again, we have a complicating factor: is
the area homogenous, or does it vary from area to area - think of tolerance limits. Also, think about whether the units represent unique individuals.
Population Density
Under ideal circumstances, we would simply count all the individuals in the prescribed area. You can do this with many trees, but not with grasses.
How about animals? What if the animals are mobile? What if the animals are cryptic?
Population Density
For mobile animals, we must devise some technique for sampling the population.
• Examples:• Toe-clipping & ear tagging small mammals.• Banding bats and birds.• Tagging fish.• Radio Collars on large mammals.
Population Density
How can we estimate the number of individuals in a population?
Use mark-recapture. The simplest technique is the use a
‘Lincoln-Peterson’ index.
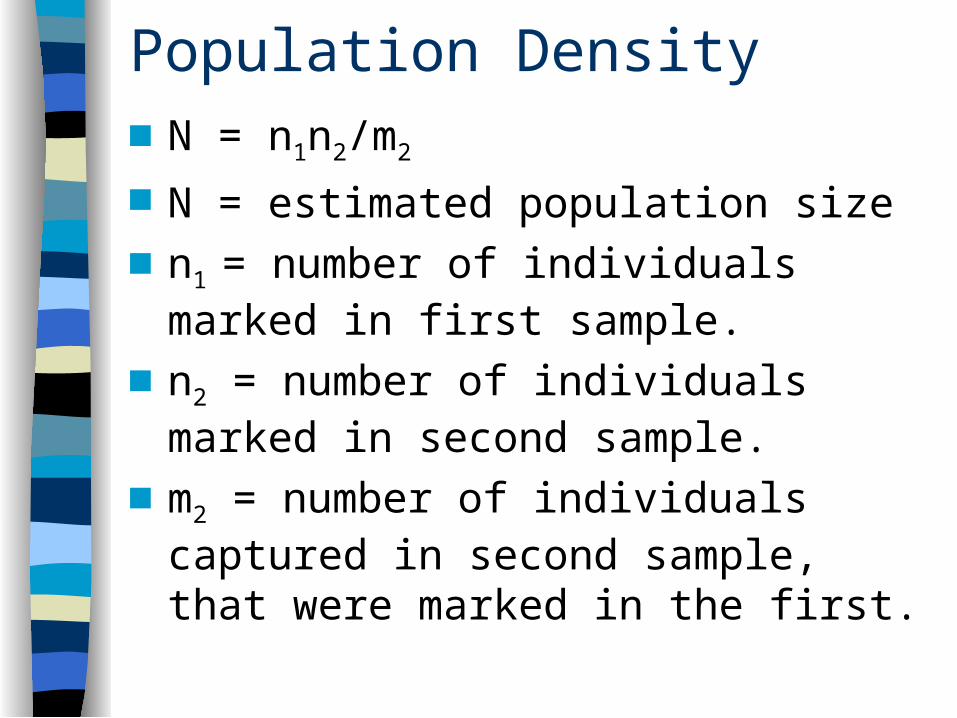
Population Density N = n1n2/m2
N = estimated population size n1 = number of individuals marked in
first sample. n2 = number of individuals marked in
second sample. m2 = number of individuals captured in
second sample, that were marked in the first.
Population Density
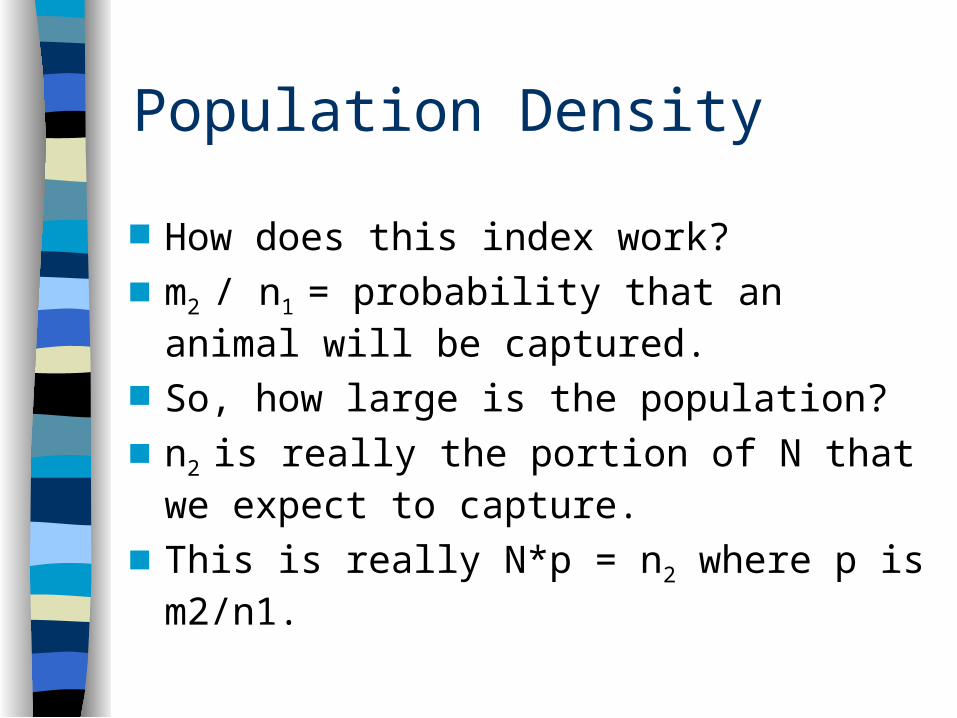
How does this index work? m2 / n1 = probability that an animal will
be captured. So, how large is the population? n2 is really the portion of N that we
expect to capture. This is really N*p = n2 where p is m2/n1.
Population Density
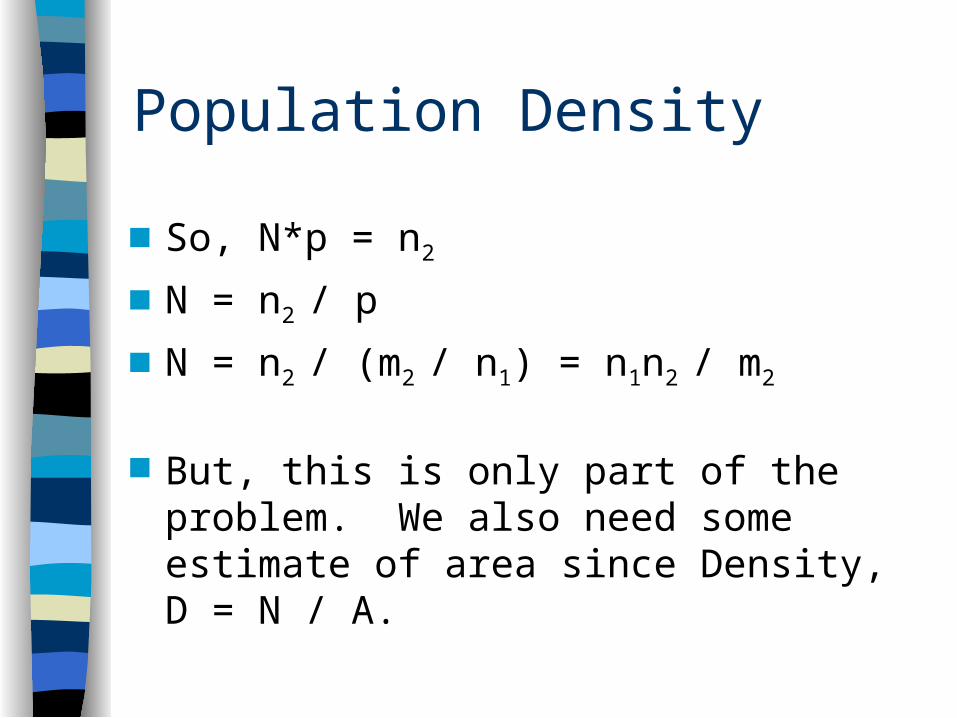
So, N*p = n2
N = n2 / p
N = n2 / (m2 / n1) = n1n2 / m2
But, this is only part of the problem. We also need some estimate of area since Density, D = N / A.
Population Density
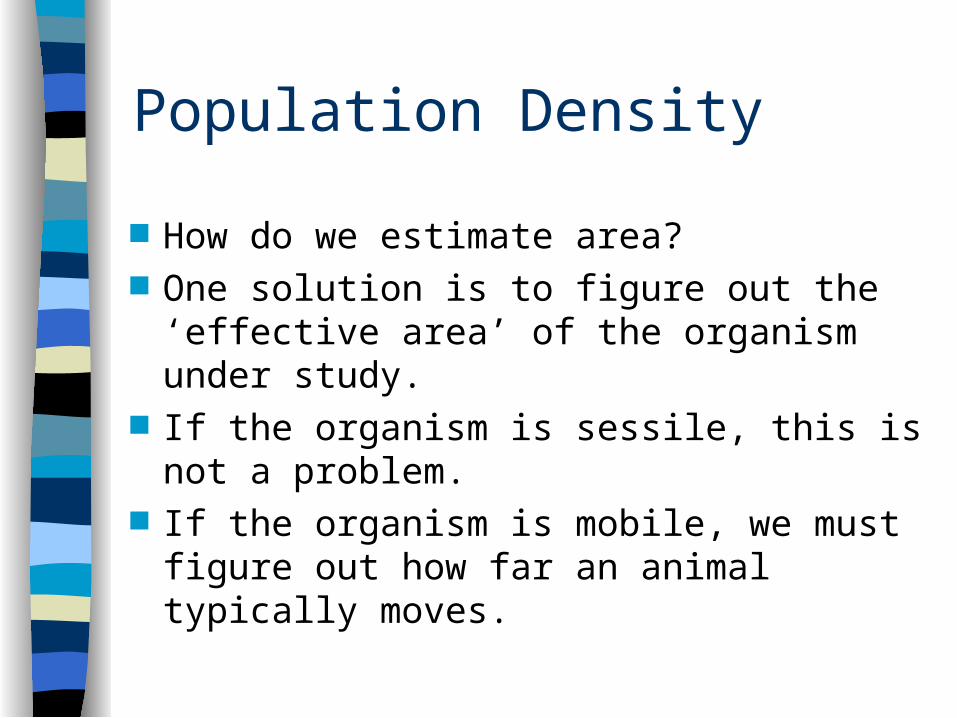
How do we estimate area? One solution is to figure out the ‘effective
area’ of the organism under study. If the organism is sessile, this is not a
problem. If the organism is mobile, we must figure
out how far an animal typically moves.
Population Density
Imagine we study rodents using a trapping grid w/ 15m trap spacing.
We trap the animals over a series of nights, always noting the identity and location of each animal.
Then, we can estimate how far each individual moved between captures.

Population Density
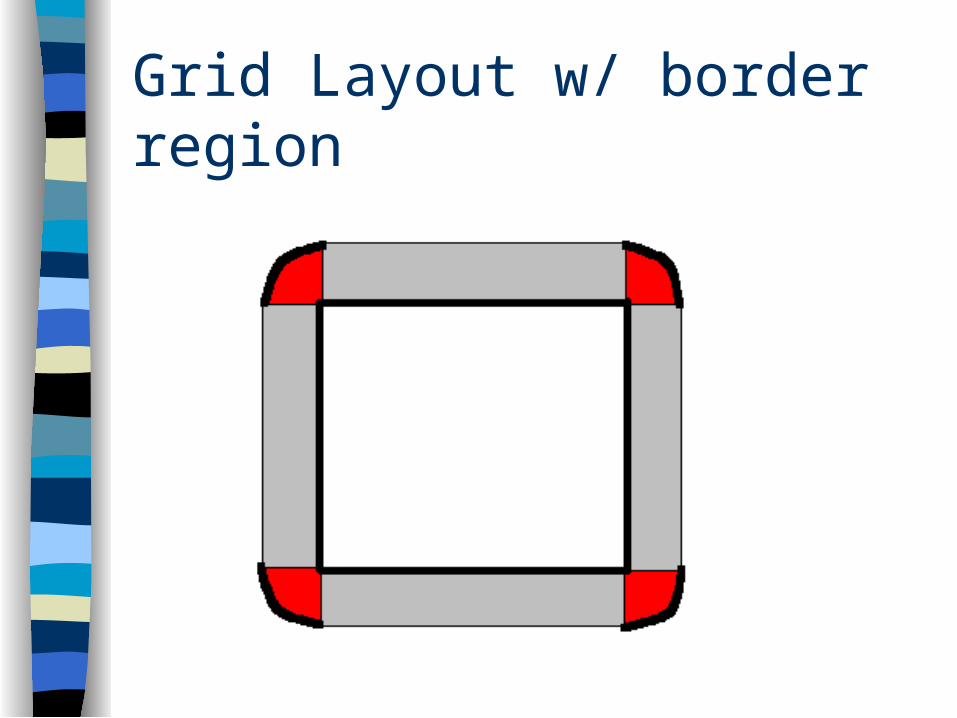
Now, if an organism can travel from one station to the next, we can assume that it could travel half the distance to the next station as well.
Thus, the ‘effective area’ of our sample is the area of our grid, plus a border region around the grid, with a width of half the distance between stations.
Grid Layout w/ border region
Population Density
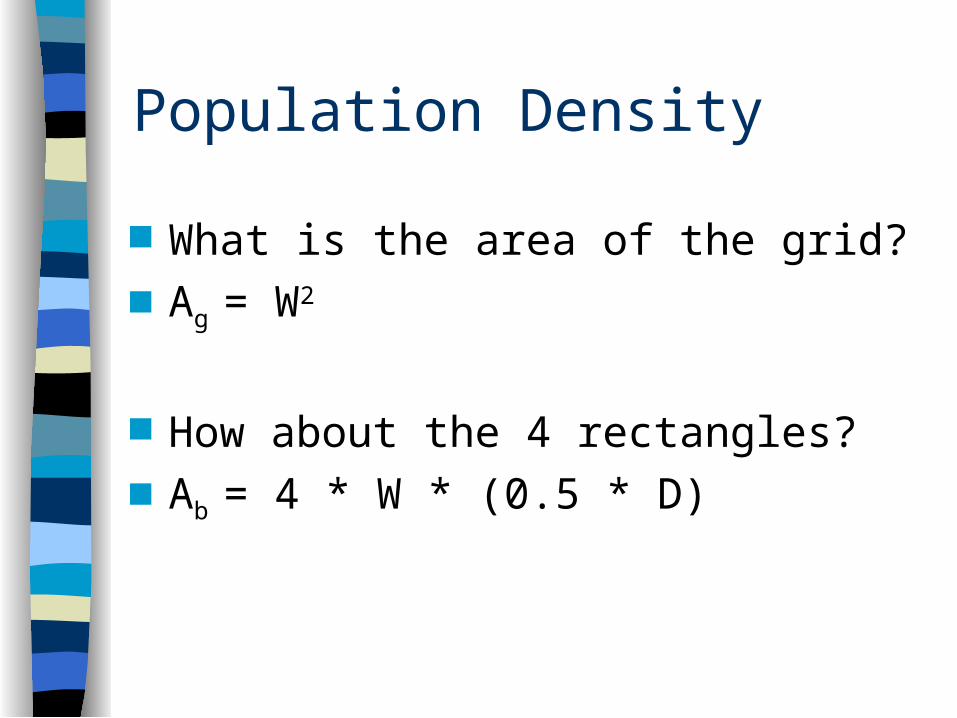
What is the area of the grid? Ag = W2
How about the 4 rectangles? Ab = 4 * W * (0.5 * D)
Population Density
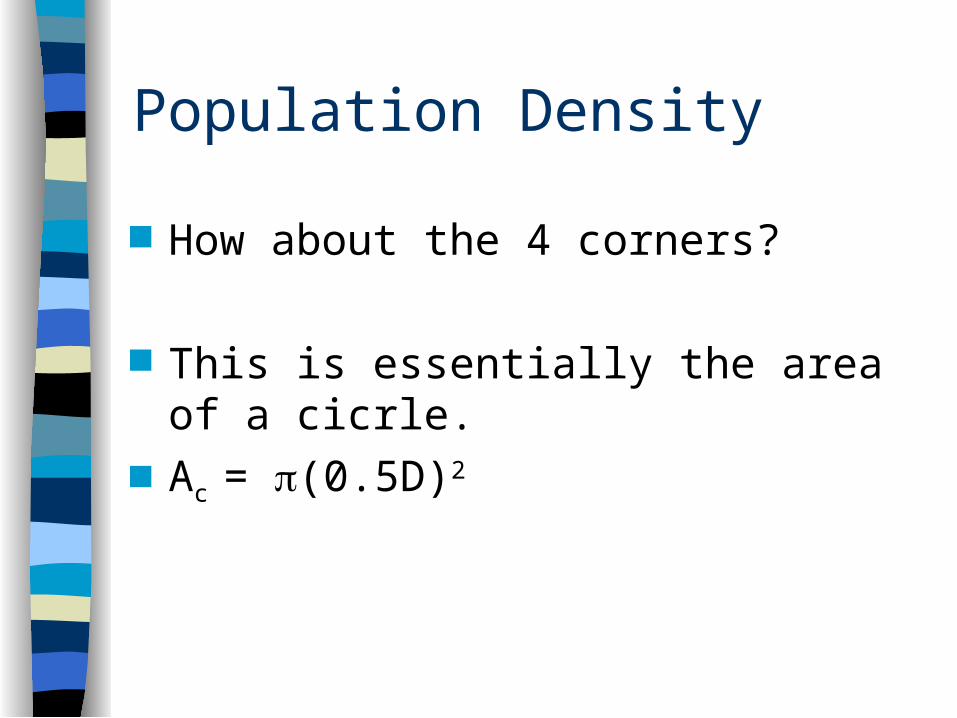
How about the 4 corners?
This is essentially the area of a cicrle. Ac = (0.5D)2

Population Density
Finally, density can be estimated as
D
n nm
W WD D
1 2
22 22 05 ( . )