demography bimal
TRANSCRIPT

8/8/2019 Demography Bimal
http://slidepdf.com/reader/full/demography-bimal 1/93
EEnnddaannggeerreedd DDeemmooggrraapphhyy
NNAATTUURREE AANNDD IIMMPPAACCTT OOFF DDEEMMOOGGRRAAPPHHIICC CCHHAANNGGEESS IINN WWEESSTT BBEENNGGAALL
11995511--22000011
Bimal Pramanik

8/8/2019 Demography Bimal
http://slidepdf.com/reader/full/demography-bimal 2/93
October 2005
Preface
A change in the demographic pattern in a country is an obvious resultant effect of migrationwhich is as old as human civilization, but if the change is significantly high in a short span of time it is bound to cause a serious social concern for the country experiencing this phenomenon.No people of a country accept migratory people with open arms and when this migration of people belonging to a separate religion takes the shape of a design the question of acceptancealmost vanishes giving rise to social unrest and tension. Significantly, however, there has beenmarked departure from this hypothesis so far as migration/infiltration from EastPakistan/Bangladesh to West Bengal is concerned. The Hindus who were uprooted from theirhearth and home in East Pakistan due to religious persecution and measures or lack of them,taken by the successive Governments in Bangladesh after partition in 1947 were accepted asrefugees by the Government of India and her people, not of course without grudge, and were
given shelter, citizenship and were gradually absorbed in the mainstream of Indian people,particularly that of West Bengal. This was quite understandable. But what happened after thebirth of Bangladesh w3hen it was the declared policy of the Government of India not to grantcitizenship to any people (even if they were Hindus and were forced to leave Bangladesh asrefugees after 1971? In what way the migratory trend post 1971 was different from the earliertrends? How were hordes of Muslims able to settle in the border districts of West Bengal withoutmuch notice and commotion? How was this silent demographic invasion possible? Was there anyhistorical perspective behind this large scale infiltration or a well thought out design of ourneighboring country? What change this invasion has brought up in the demographic pattern of border districts as well as interior districts of West Bengal? These are the queries I have tried toaddress in this book.
I would like to make it clear that no extraneous facts except that are borne out of the data
available from the Census reports have been considered for determining the change in thedemographic pattern and the author has been swayed by reason to spell out some of its falloutsand possible danger to the polity of West Bengal socio politically as well as economically. Onedoes not have to be communal or for that matter secular in one’s attempt to pin point a socialchange which is part of history and history does not have any conscience of what is good or whatis evil but its grand design provides some clues in finding out ways and means to mend ourmistakes committed in the past in order to sustain a decent life for the present and the future,socio-politically and economically.
I leave it to the judgment of the readers of this book about its validity of perception, though Istrongly believe that those who disagree cannot wish it away as a non-event.
I would be failing in my duty if I do not express my heartfelt gratuitude to Professor JayantaKumar Ray who had kindly consented to edit this book. In this connection I also express my
sincere thanks to my colleagues Shri P.N. Mukherjee, Smt. Munmum Ganguly and Shri SusantaMondal for their active cooperation and help in my venture to write this book. Bimal Pramanik

8/8/2019 Demography Bimal
http://slidepdf.com/reader/full/demography-bimal 3/93
Endangered Demography
NATURE AND IMPACT OF DEMOGRAPHIC CNANGES
IN WEST BENGAL 1951-2001
Introduction
It is fair to affirm that the vast demographic changes in the eastern and north-eastern States of India are deniable. Yet there is ample scope for an analysis of facts and factors behind suchdemographic changes. Moreover, the nature, the pattern and even the motives are to be broughtinto proper focus, if one is to understand the totality of phenomenal demographic changes thathave occurred.
Migration from one country to another has been a persistent and significant socio-economicand socio-political phenomenon over the whole world. The concept of migration is not alien tothe Indian people also. In fact, as an inevitable consequence of Partition of India in 1947, massmigration to West Bengal became ceaseless and large-scale. There was a continuous flow of theHindu minority population from erstwhile East Bengal/East Pakistan, which was attributedmainly to the communal enmity of the Muslim majority population. The rate of this continuousmigration from East Bengal to West Bengal, however, fluctuated, till 1971, depending on amultitude of socio-political and socio-religious factors.
A novel outcome of demographic pressures became more and more prominent over the yearsamong the Bangladeshi migrants setting in India’s border region. Amazingly, this has gonelargely unnoticed, even though it reflects significant changes in the daily life style and affects thevery root of the civil society. We have gone into some details in this study of such unanticipatedfallout of the demographic changes.
I have tried to analyze the negative impact of gigantic immigration fro Bangladesh uponIndia’s attempts to preserve secular harmony as well as national security. We do not intend tooverrate the military potential of Bangladesh while assessing the impact of Bangladeshiimmigrants upon India’s national security in north eastern and eastern States, but we can hardlyunderrate the significance of their disturbing and distorting impact on the ethos of secularharmony that India stands for, and has been practicing unabatedly since independence, despitePartition on religious grounds.
The sordid impact of Bangladeshi immigration upon India is but a logical consequence of thestark failure of Bangladesh to evolve as a secular multicultural polity. The ruling circle of presentday Bangladesh is determined not only to broaden and deepen the Islamisation of Bangladesh, butalso to use Islam to incite separatist or secessionist forces in eastern/north-eastern India—byextensive support to a protracted arms struggle, if necessary. It is an open secret that inBangladesh many international terrorist outfits with aggressive fundamentalist agendas aremaking all efforts to envelop Bangladesh’s socio-cultural fabrics with new Islamic prints anddesigns—though at the cost of the liberal tenets of Islam.
The religio-cultural aspects of social harmony and the political-economic aspects of nationalsecurity have been taken up in an integrated fashion in this study. This will enable us to assesstruly the potential menace casting its shadow on the relations between India and Bangladesh.
Following the independence of Bangladesh in 1971, the eastern and north eastern region of India faced a novel political and social challenge. At one time, critics and analysts complacentlycharacterized it to be a migration flow. But later on, a series of political events proved that thiswas nothing but a kind of infiltration flow. As a corollary, it is equally imperative to understand

8/8/2019 Demography Bimal
http://slidepdf.com/reader/full/demography-bimal 4/93
the changing responses of the political parties and their leaders in this great drama of incessantdemographic change, creating a menace to social harmony and national security.
This threat to our national security and social harmony will not be clearly understood unlesswe analyze the role of Bangladesh in this regard. Since the days of Partition, the Muslim psychein both the parts of Pakistan has been suffering from a sense of injury about losing half of Bengaland Assam. They have been ruthlessly pursuing the policy of ‘lebensraum’ since the days of
partition. Acting, perhaps, on the philosophy of the great Italian, Machiavelli, who observed inthe 16th century that “Sending immigrants is the most effective way to colonize countries becauseit is less offensive than to send military expeditions and much less expensive.” Bangladesh with asingle minded devotion has been following this policy, and, t say the least, it has been quitesuccessful in this endeavor.
There was, however, not much concern about Muslim infiltration from erstwhile East Pakistanto India in the pre-1971 period. For, an extensive migration of Hindu population into India wasregarded as a natural fall-out of Partition.
If we look back to the history of political development of East Pakistan, especially in thephase of 1966 to 1971, we can easily identify the new features and directions of the strongBengali nationalist sentiment to encourage and enthuse Bengali masses, irrespective of religion,against the political leadership of the military junta of Pakistan. Sheikh Mujibur Rahman was able
to articulate step by step the aggrieved Bengali psyche by mooting an alternative scheme of sharing power at the center of Pakistan’s power structure. The central political power structure inPakistan failed to comprehend anything beyond their selfish design of perpetuating the status of eastern Pakistan as a subservient region of the West Pakistani heartland. Obviously, on the otherside of the barricade, Mujib’s Bengal started resenting a colonial treatment.
When Mujib and his Bengal were fast assuming a posture of defiance against Pakistanpolitical leadership, the Muslim population in North-East and Eastern India regionally, and inIndia as a whole, were suffering from a kind of nervousness at any prospect of politicalweakening of Pakistan, in case Mujib could triumph, and thereby justify his complaint aboutPakistani colonial domination over eastern Pakistan. Obviously, Hindus, by and large, whether ineast Pakistan or outside, were increasingly amused and gradually enthused about a potentialpolitical metamorphosis of the Pakistani state.
Mujib was not squarely ready at the strategic level for a resolution of his demand by even asort of war, even if that was thrust upon him. On their part, the leadership of Pakistan startedsuffering from uncertainly about he fallout of a conflagration between Mujib’s Bengal andwestern Pakistan. This was what exactly occurred in December 1971, almost inevitably.
The destiny of Pakistan from its historic origin was thus already blown off. The entiresubcontinent was now on the verge of a new set of relations which were not intelligible, far lessrecognizable. Only one thing was discernible, and that was the fate of hapless and hopelessHindus, whose sacrifice in the 1971 freedom struggle appeared to be negated by the assassinationof Mujibur Rahman, and who started moving as an endless flock of people from Bangladesh tomultiple directions into the land of India.
A new politics, a new economics and a new culture, taken together, started unraveling itself inIndia as a result of secularism, which aggravated the confusion of the exuberant and extravagant
politics of secularism of the erstwhile radical nationalist and the radical left in India. Gradually,for the first time, the Hindu refugees were being treated at par with the Muslim infiltrators. Thistwin flow at the same time had introduced a new opportunity to show perversely that Bangladeshwas as much secular as India. Politicians, who placed immediate electoral gain above nationalinterest, could successfully equate Muslim infiltration with the Hindu refugee flow under thegrand title of infinite and indefinite migration of Bangladeshis with nondescript faces through allconceivable manholes in the border region. A gunman, a smuggler and a family man have startedworking together only to mislead the border security forces, because the infiltrator is not easilydistinguishable from a refugee. A new era has started, Leading Bangladeshi strategic analysts and

8/8/2019 Demography Bimal
http://slidepdf.com/reader/full/demography-bimal 5/93
intelligentsia introduced the theory of lebensraum in the 1980s. They claim that their right tosettle in India’s eastern and north eastern States is to be considered as the natural course of overriding what is to them, an unacceptable political demarcation of the border.
Growing population pressure and crippling poverty and pauperization of the marginal ruralmasses in Bangladesh encouraged, if not forced, them to put this agenda of migration as a life anddeath question, which no lock can resist. In the mean time, the consolidation of Islamic forces
was already advanced. They adopted the agenda of a greater Islamic region as a grand politicalstrategy. Although it was an emotional issue for Sheikh Mujib, later it became a political andstrategic issue with the support of Pakistan.
8/8/2019 Demography Bimal
http://slidepdf.com/reader/full/demography-bimal 6/93
Chapter One
DEMOGRAPHIC CHANGE IN WEST BENGALAND ITS IMPLICATIONS
Population Movement or migration, internal or external, is a universal phenomenon of humansociety. Its nature, degree, direction and dimension, however, may vary from case to case.Numerous studies have been conducted to identify the attributes associated with migratorymovements of people. Along with ‘push’ and ‘pull’ factors, a variety of explanations are alsoavailable as the cause and effect of migration and consequent societal change.
A change in the demographic pattern in any country is an obvious resultant effect of migration, which is as old as human civilization, but if the change is significantly high in a shortspan of time, it is bound to arouse a serious social concern in the country experiencing thephenomenon. No people of a country accept migratory people with open arms, and when thismigration of people belonging to a separate ethnic group and religion appears to reveal an unholypolitical design, the question of acceptance almost vanishes, giving rise to social unrest andtension. The north eastern region of India, particularly Assam and West Bengal, are cases inpoint.
The change in the demographic pattern of the Eastern and North-Eastern States, particularlyWest Bengal during the last five decades, has been exhaustively dealt with in this book, and wecan sum up the phenomenon in a few words.
A new dimension in the political and social arena has emerged in this eastern and north-eastern region of India after independence of Bangladesh in 1971. A novel phenomenon of demographic pressure—emanating from Bangladesh—started looming larger and larger in theborder region. During the last three decades, illegal migration from Bangladesh to India is goingon unabated. All the refugees who had been coming to West Bengal during Pakistan days wereHindus. In the Bangladesh era, Hindus are coming as usual like in the days of Pakistan due toreligious persecution and political pressure, but a new feature also started emerging as peoplefrom the majority segment (Muslims), for different reasons and purposes, started coming to WestBengal. Both the Central and West Bengal governments were generally aware of thisdevelopment, yet no great concern was visible before November 2002. In recent years, theDeputy Prime Minister and the Prime Minister of the NDA Government, the Chief Minister of West Bengal and even the President of India have expressed their grave concern and agony on theissue of illegal Bangladeshi migration, and its implications for internal security issues.
There is no state religion in secular India, which is obliged to protect all religious equally, butthe Bangladesh Republic has to preserve religious peace and harmony under the shadow of itsstate religion, viz. Islam. The adoption of Islam as the state religion has utterly demoralizedHindus, and has reinforced their already powerful compulsions about migration to India.Significantly, a state religion cannot extend the minimum of socio-economic protection even to
Muslims, who, instead of being satisfied with living in Islamic Bangladesh, have long beenvoting with their feet, and continuously leaving for secular India, especially Assam and WestBengal. Whereas this is a constant tribute to India’s secularism, this is also a threat to India’ssocio-economic-political security. Unfortunately, authorities in India have displayed littlealertness in preempting or coping with this threat.
In this book an attempt has been made to explain the emerging picture consequent upon theinternal demographic changes in the State as well as various districts of West Bengal. During the1951-2001 period, the contrast between a decline in Hindu population and an extra-ordinary

8/8/2019 Demography Bimal
http://slidepdf.com/reader/full/demography-bimal 7/93
upswing in Muslim population is indeed remarkable in every district of the State. In a number of districts, the rate of growth of the Muslim population is double or more than double that of theHindu population. Growth rates of Hindus and Muslims are 198.54% and 310.93% respectivelyduring 1951-2001. Population share of Hindus and Muslims in 1951 was 78.45% and 19.85%respectively, but during the last fifth years, the share of Hindus in West Bengal has come down to72.47%—a decrease by 6%—whereas the share of Muslims has increased to 25.25%—an
increase of 5.40%.Another important aspect of growth of population as per 2001 Population Census is in the
group of 0-6 years population. The growth rate of Hindus and Muslims in this group stood at12.69% and 18.7% respectively and the share of this group (0-6) of Muslims among all religionsin West Bengal is 33.17%, though population share of Muslims in the State is only 25.25%. Onthe other hand, the share of Hindus in the same population group (0-6) is only 64.61% in spite of their population share of 72.47%. This excessive increase of 0-6 group of population in theMuslim society in West Bengal tends towards a serious consequences. 0-6 population profile of the State /districts are shown in the Annexure I.
On account of the Partition of the Indian subcontinent in 1947, Hindu refugees moved fromEast Pakistan, without much interruption, to various parts of India, especially to West Bengal, till1971, when political boundaries in South Asia were redrawn. Even after the emergence of
Bangladesh as an independent country in 1971, however, the march of refugees to West Bengalappeared to be ceaseless. In the days of Pakistan, most of the refugees coming to West Bengalwere members of the minority communities in East Bengal (East Pakistan), viz. Hindus, Buddhistand Christians. But after the Nehru—Liaquat Agreement on 8 th April, 1950, drawn up in thecontest of a massive exodus of displaced migrants from East Bengal to West Bengal, Assam andTripura, most of the Muslim migrants who had in the early days of Partition crossed over to EastBengal came back and settled in their ancestral places in the above mentioned Indian St6atesduring 4the entire period of undivided Pakistan i.e. 1950-1971. According to the 1950Agreement, the “Indian government ensured to the minorities throughout its territory, completeequality of the citizenship, irrespective of religion, a full sense of security in respect of life,culture, property and personal honour, freedom of movement within each country and freedom of occupation, speech and worship, subject to law and morality.” India also assured minorities
“equal opportunity with members of the majority community t6o [participate in the public life of their country, to hold political or other offices and to serve in their country’s civil and armedforces.” ( Annexure II)
On the other hand, the Pakistan government neglected to implement the agreement or failed toenforce the fundamental rights of minorities in their country, as mentioned in the agreement. As aresult, no Hindu migrant returned back to East Pakistan/East Bengal after the Nehru—LiaquatAgreement. Therefore, during 1951-1961, the share of Hindu population in East Pakistandeclined by 3.5%, i.e. from 22.0% in 1951 to 18.5% in 1961 with a growth rate of only 1.53%.Even during the 1961-1974 period, the share of the Hindu population further declined by 5%, andcame down to 13.5% in 1074. A large number of Hindu families, who crossed over to Indiaduring the liberation war of Bangladesh in 1971, did not return.
The minority community in Bangladesh participated in the War of Liberation with the
expectation that in the newly liberated country they would enjoy status and rights along with themajority community. But in practice, the persecution of the minorities continued even afterindependence. The forms of oppression of the religious minorities in Bangladesh are manifold.Constitutionally, they have been downgraded; economically, they have been crippled throughdifferent discriminatory laws and practices; politically, they have been segregated and alienatedfrom the mainstream; they have been made a non-entity in different government and non-government services; culturally and socially, they are insecure. They are totally deprived of theprivileges of participation in the top positions of government, and nationally they are used assubjects tortured through communal riots organized by the government of counteracting political

8/8/2019 Demography Bimal
http://slidepdf.com/reader/full/demography-bimal 8/93
unrest against the ruling party. As a consequence of the discriminatory polities, combined withland grabbling, looting, arson, rape, murder and attack on religious institutions of the religiousminorities with the collusion, if not instigation, of the government or semi-government agencies,there has been a continuous exodus of the minorities from Bangladesh.
After the emergence of a sovereign Bangladesh in 1971, the Muslims in West Bengal did notfeel any urge to migrate to Bangladesh because of the initially diminished Islamic fervor there in
comparison to Pakistan. On the contrary, many Muslim families, who had migrated to the thenEast Pakistan came back and started living in several districts of West Bengal with a variety of help from a section of influential local Muslims, and ultimately settled in these areas, since theycould not fit in with the Bengali Nationalism that emerged from the liberation struggle of Bangladesh without too much of Islamic fervor. Side by side, hordes of infiltrators found a newhaven in this region. Consequently, the Muslim population in the border districts as well as inother interior districts of West Bengal increased in geometric progression. In the nineteeneighties, Muslims in the border areas were further encouraged for community consolidation bythe ruling parties of West Bengal. Demolition of the Babri Mosque in 1992 came as a greatexcuse for the perpetration of organized crimes/dacoities by local Muslims, and there were casesof assaults on the Hindu families in connivance with Bangladeshi Muslims, particularly in thedistricts bordering Bangladesh. Other criminal activities increased quite rapidly, and this, coupled
with non-cooperation of the local administration (the police, the Panchayats, etc.) and the party inpower determined to keep intact the Muslim vote-bank, forced many Hindu families to move toother interior Hindu dominated areas, leaving the border areas as densely populated by Muslims.
In the nineteen eighties, planned migration from Bangladesh conformed to the lebensraum
theory, which was encouraged by the Indian Muslims in the border States under the protectionand patronization of some political and social forces of India’s Eastern and North Eastern region.This continuous infiltration from across the border is slowly and steadily changing thedemographic pattern in the border areas, especially in the States of West Bengal and Assam. Thischanged demographic scenario easily lends itself to disrupting social harmony. Already it hastaken a shape of demographic invasion in the region, which is threatening our secular polity andnational security. This is a religio-cultural process taking place in a geographical spaceconsidered to be strategically important. Thus, the emergence of Bangladesh has created in the
North-Eastern States of India certain conditions conductive to Islamisation. At least there factors,facilitating the process of Islamisation, are obvious. First, strangely enough, whateverIslamisation has occurred in these parts of North-Eastern and Eastern India has happened within asecular political environment. Secondly, the appeasement of aliens for the purpose of garneringvotes and the continuous anti-Centre stance have been conducive to the expansion of a psyche of Islamisation. Thirdly, a weak, undefined and unorganized secular frame has failed to combat theprocess of Islamisation.
Frequent failure of living with a multi-cultural ethos has jeopardized communal harmony, anddefaced the secular fabric of the Indian society. Islamisation has always been, historically, a‘power concept’. When secular forces come forward to protect social harmony on the basis of adominant culture with a highly powerful assimilating force, forces of Islamisation might claimtheir due and finally crave for a division of the same, assertive secular society.
From the very beginning since the liberation of 1971, Hindus who had earlier gone to India asrefugees and returned to independent Bangladesh, again started migrating from the newlyindependent country to India, because they failed to retrieve their property and enjoy socialsecurity. Bengali nationalism was eroding fast, and anti-India sentiment was growing rapidly.After the assassination of Sheikh Mujib in 1975, the relevance of the very Bangladesh concept of 1971 was lost, and Bangladesh became a state tilting towards Islamisation. All this shows that theemergent idea of a secular Bangladesh, partially apparent in 1971, was not only missing but wasprobably mistaken. Mujib’s case of fighting against Pakistan had finally given way to aBangladesh which never denied its Islamic character. On the surface, while Hindus imagined a

8/8/2019 Demography Bimal
http://slidepdf.com/reader/full/demography-bimal 9/93
new secular-democratic prospect, Muslims suffered from a bankruptcy of leadership, which threwthem eventually into the clutches of Mushtaq Ahmed, Ziaur Rahman and others after Mujib’sdeath. It was a pity that Bangladesh came out as a country and a state with an overt Islamicidentity.
An observed from the Bangladesh Population Census 2001, the share of Hindu population hascome down to 9.2% only. During the last 50 years since 1951, the comparatively lower growth
rate of Hindus indicates a steady migration of Hindu population from Bangladesh to India,particularly to the State of West Bengal. On the other hand, a steady growth of Muslimpopulation since 1951 has enhanced their population share from 76.9% in 1951 to 89.7% in 2001.During the last five decades (1951-2001), the growth rate of Muslim population is 244.68% asagainst 23.16% of Hindu population. Side by side, the growth rate of Muslim population in WestBengal during the same period is 310.93%, i.e. much higher than in Bangladesh. How can it bepossible when the growth rate of Hindus in West Bengal in the same period is 198.54%? It clearlyindicates a massive Muslim infiltration fro Bangladesh to West Bengal. Consequently, the shareof Muslim population has increased by about 6% in West Bengal during the last fifty years (1951-2001) after the Partition of India i.e. from 19.85% in 1951 to 22.25% in 2001 (see Chart Nos. 1,2, 3 & 4 and Annexures Iii & IV).
To facilitate a clear comprehension of this phenomenon, we have analyzed district level trends
of population share and growth ragtes of Hindus and Muslims in West Bengal during 1951-2001.We have gone into some details in this study of salient aspects of the demographic changes
and their implications in the selected districts of West Bengal so as to gauge the local situation,particularly during the 1981-1991 decade, when a massive jump in the growth rate of Muslimswas observed in almost all the districts of West Bengal. Our micro-level analysis on 24 Parganas(North), Nadia, Murshidabad and Uttar/Dakshin Dinajpur has revealed in interesting picture. If we go through the Block level religious composition data of the above districts during 1981-1991,it will be seen from various tables that the share of Muslim population in some Blocks within adecade has risen abruptly to a staggering figure [See Habra, Hasnabad, Basirhat, Mograhat,Chapra, Tapan etc.]. Moreover, in most of the Blocks, the share of Muslim population has risensignificantly. Other than demographic realties of the districts, we have discussed the infiltrationsituation, as also crimes including trans-border crimes, the changing scenario of religio-cultural
activities, and relations among the different communities. Etc. (See Chapter Three)Our Block level analysis of data for the districts of West Bengal have revealed a dismal
picture of inept border management and grave security lapses, to the benefit of the vestedinterests of all the political parties of the State of West Bengal. This has posed an immeasurablyserious threat to India’s national security. Apart from the criminal activities associated with thesmuggling of livestock and many essential commodities of daily consumption to Bangladesh, along term plan for forcing out Hindus from the border areas of West Bengal is evidently inoperation. The growth of Islamic fundamentalist forces under the umbrella of different politicalorganizations, the easy access of terrorist outfits to sensitive locations assured by India’s secular-democratic culture, and the perennial influx of Bangladeshi Muslims into West Bengal’s borderbelt, have obviously facilitated the systematic eviction of Hindus from this belt.
Even a very casual enquiry shall reveal that the local administrators in West Bengal are
indifferent to the rapid demographic transformation of the State. It is also important to note thatsuch indifference to anti-national activities by the Bangladeshi people can spell a clear danger tointernal security and social harmony. For the same reasons, the one time Hindu majority bordervillages have now turned into Muslim majority villages. In most of the Hindu majority villagesthe entire cattle population are left to the care of the Border Security Forces (BSF) or uder theprotection of local police stations before it is dusk, and taken away by the owners at dawn. Itneeds mentioning that the incidents of dacoity, cattle lifting, rape, kidnap and murder are more orless non-existent in the Muslim inhabited border villages of West Bengal.

8/8/2019 Demography Bimal
http://slidepdf.com/reader/full/demography-bimal 10/93
Since most of the adjoining areas in Bangladesh are predominated by the Muslims, a huge andcontinuous influx of illegal Muslim migrants from Bangladesh has turned the socio-economicscenario from Bangladesh has turned the socio-economic scenario against the Hindus. Weak andinefficient border management and non-cooperation of local populace with the BSF and the mostimportant reasons behind this legal trans-border movement of population as also smuggling of cows and many contraband goods. Due to the poor border management and political patronage,
Muslims with vested interests have been successful in influencing the administrative decisions inthe entire border region.
For more than three decades (1971-2005) there ahs been a ceaseless and significantdemographic change in the districts of West Bengal, particularly districts adjoining Bangladesh.Now both sides of the Indo-Bangladesh border region are inhabited by a population which isethnically, culturally, linguistically and religiously identical. Already, thus, it has taken the shapeof a demographic invasion.
To sum up, callous local administration, limited scope for earning income in theincompetently managed economy of Bangladesh and religious vested interests may not always bemeticulously working out anti-Indian designs, but from ground level data the impression isinescapable that they are so working. The most important fact to note is that the residual Hindupopulation in some border villages, still not insignificant, remains under a constant pressure to
migrate from their traditional and ancestral places of habitation. Opinion makers and decisionmakers have not paid even the minimum of attention to available data on this significant subject.Such data, recorded and analyzed in the present study, deserve immediate attention from all thosewho are genuinely interested in national integration, internal security and social harmony in India.

8/8/2019 Demography Bimal
http://slidepdf.com/reader/full/demography-bimal 11/93

8/8/2019 Demography Bimal
http://slidepdf.com/reader/full/demography-bimal 12/93

8/8/2019 Demography Bimal
http://slidepdf.com/reader/full/demography-bimal 13/93

8/8/2019 Demography Bimal
http://slidepdf.com/reader/full/demography-bimal 14/93
8/8/2019 Demography Bimal
http://slidepdf.com/reader/full/demography-bimal 15/93
Chapter Two
DEMOGRAPHIC CHANGES : DISTRICTWISEPROFILE OF WEST
District: Koch Bihar
Koch Bihar is situated on the north and north-eastern corner of West Bengal. Paddy and Juteare the main agricultural products. Timber, cane and handicrafts are among the major industries.The demographic profile of Koch Bihar, particularly the religious component of demographictrends during 1951-2001, is interesting. After the Partition of India in 1947, a massive number of Bengali Hindus from East Pakistan migrated to this district till 1971, and a good number of Hindurefugees, who had crossed over to this district during the nine months of Bangladesh LiberationWar in 1971, die no return to newly independent Bangladesh. As a result, from 1951 to 1981, a
continuously high rate of growth of Hindu population is observed. But no notable out-migrationof Muslim population is observed. But no notable out-migration of Muslim population from thisdistrict to East Pakistan or Bangladesh in the above period was observed. On the other hand, amassive Muslim infiltration from Bangladesh to this district during the last two (1981-2001)decades was notable, particularly in the 1981-1991 period, which witnessed an exceedingly highgrowth of Muslim population (37.63%), enhancing their population share in one decade by 2.56%(i.e. 23.34% in 1991 as against 20.78% in 1981). But, no mentionable Hindu immigration fromBangladesh in the above period is observed. During the last five decades (1951-2001), growthrates of Hindu and Muslim population were 293.39% and 209.4% respectively.
Decade-wise population shares and growth rates for Hindus and Muslim during 1951-2001 areshown in the chart nos. 5 & 6.
District: JalpaiguriThis district is situated at the foothills of the Himalayas. Most of the areas of Jalpaiguri district
were earlier known as the Doors Region. In the post-independence period, Jalpaiguri remains thesole gateway to North-East India. Apart from tea, the other agricultural products are paddy, jute,betel leaves and fruits. Timber and cane are the two major industries in Jalpaiguri. After thePartition of India, particularly during the 1951-1961 period, a massive number of Hindu refugeeshad immigrated to this district from East Pakistan. On the other hand, a large number of Muslims,who had crossed over to East Pakistan after Partition, came back after Nehru-Liaquat Agreementof 1950. Gradually, but significantly, Hindu immigration came down during the last four decades(1961-2001). But, Muslim immigration to this district during 1981-2001 was found to have risensignificantly. Growth rates of Muslims in the above two decades are 45.13% and 31.36%respectively and their population share shot up from 8.75% to 10.85% in 2001.
Decade-wise population shares of religious communities and their growth rates are shown inthe chart nos. 7 & 8.
District: Malda
Malda is situated on the eastern bank of river Ganga bordering the Rajshahi district of Bangladesh. It is basically an agricultural district with paddy and jute being the main products. Itis also famous for fruit production, particularly mangoes. Demographic transformation of thisdistrict during 1951-2001 is very interesting. Population shares of Hindus and Muslims in 1951

8/8/2019 Demography Bimal
http://slidepdf.com/reader/full/demography-bimal 16/93
were 62.92% and 36.97% respectively. The growth rate of Muslims during the 1951-1961 periodwas remarkably high (62.8%), and Muslim population share shot up from 36.97% to 46.18%.After the Nehru-Liaquat Agreement in 1950, most of the Muslims, who had migrated to EastPakistan after Partition, came back and settled in the district during this decade. On the otherhand, the growth rate of Hindus, i.e. 11.11%, indicates that no Hindu immigration took place inthe above period. But the 1961-1971 decade witnessed a significant Hindu immigration in the
district. During the last three decades (1971-2001), however, the share of Muslim population inthe district has surpassed that of Hindu population because of unabated Muslim immigration fromBangladesh. Within the last fifty years (1951-2001), Malda has become a Muslim-majoritydistrict by increasing its population share from 36.97 to 49.72%. Growth rates of Hindus andMuslims during this period were 174.87% and 372.0% respectively.
Decade-wise populations shares of religious communities and their growth rates are shown inthe chart nos. 9 & 10.
District: Birbhum
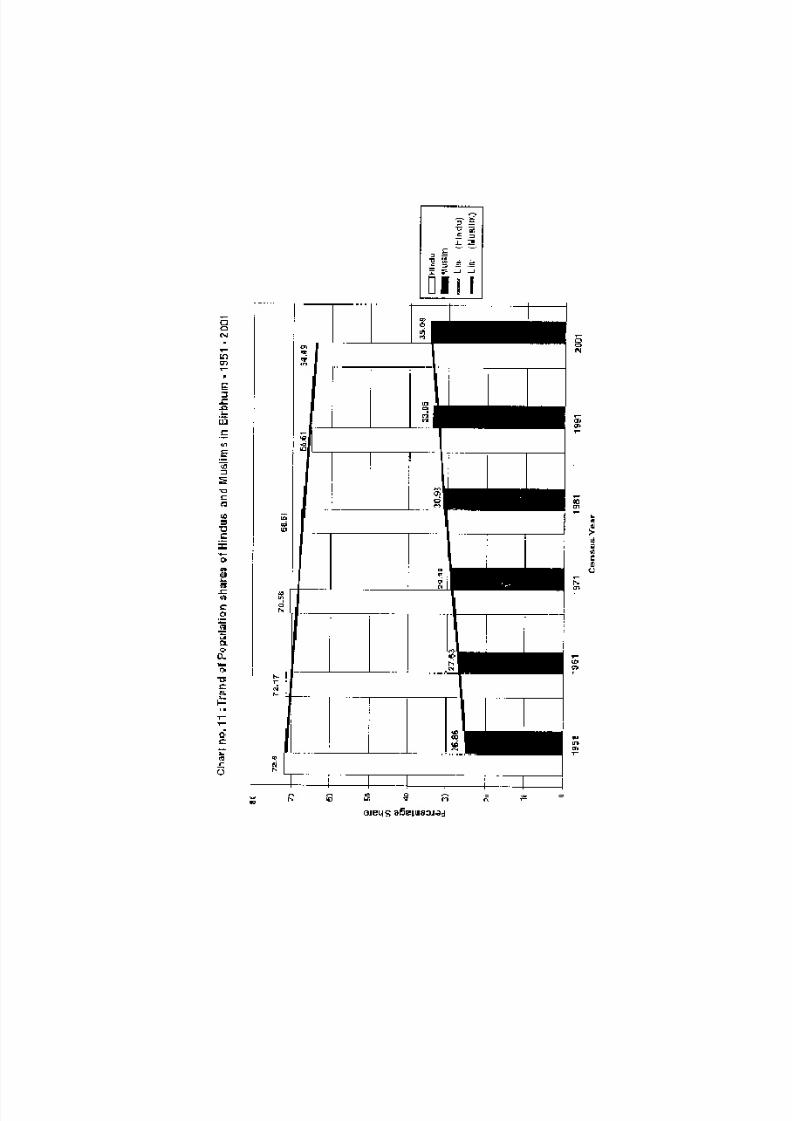
Birbhum is situated in the Rarh region of Bengal bordering Murshidabad and Bardhaman. Inmodern times, this district is famous for Santiniketan of Rabindranath Tagore and also for folk artand culture. After the Partition of India, a good number of Hindu refugees migrated from EastPakistan to this district. Also, most of the Muslim refugees, who had migrated to East Pakistanafter Partition, came back after the Nehru-Liaquat Agreement of 1950. During the 1951-1971period, the share of Muslim population in this district increased significantly [i.e. from 26.86% to29.19%]. The post 1971 scenario is also very interesting. During the last three decades (1971-2001), the growth of Muslim population is much higher (nearly double) than that of Hindus[25.24%, 30.16% and 25.19% respectively, as against 14.75%, 18.8% and 14.24%]. Massiveinfiltration of Muslims from Bangladesh is the main reason for their higher grown rates. Duringthe last five decades (1951-2001), Muslim population growth rate has become 269.21% as against151.07% for Hindus. Currently, the share of Hindu population has come down from 72.60% in1951 to 64.49%, and the share of Muslim population has risen from 26.86% in 1951 to 35.08%(2001). With the present rate of growth, the Muslim population will surpass the Hindu populationwithin a few decades.
Decade-wise population shares and the growth rates on the basis of religion are shown in thechart nos. 11 & 12.
District: Bardhaman
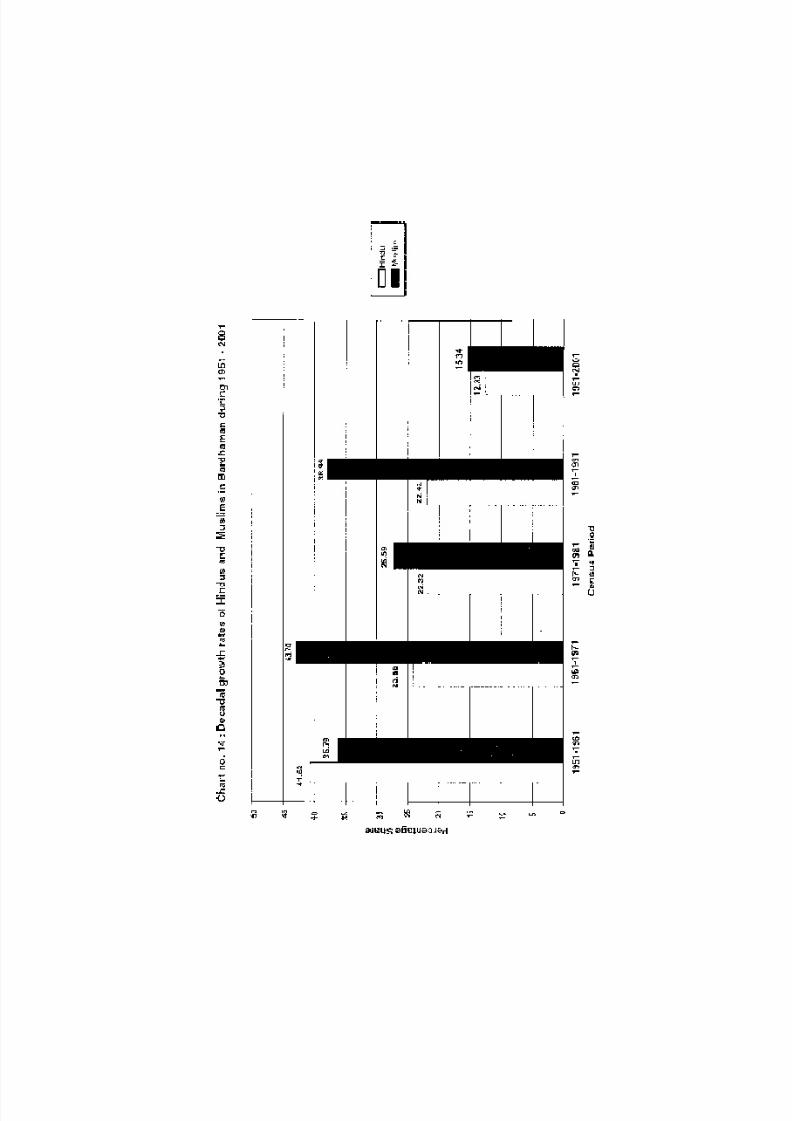
Bardhaman district is a potentially major industrial base in the country, and it has now becomethe granary of West Bengal. After Partition, a good number of Hindu refugees from East Bengalsettled in this district. On the other hand, most of the Muslims, who had migrated to East Pakistanafter Partition, returned back to this district during 1951-1971 because of the Nehru-LiquatAgreement of 1950. Growth rates of Muslim population during 1951-1961 and 1961-1971 wererespectively 36.79% and 43.74%, which corroborate this phenomenon of in-migration. The post-1971 phenomenon is also very interesting. The share of Muslim population has risen significantly(by 2%) during 1981-1991 due to Bangladeshi infiltration to this district. The growth rate of Muslims in this decade was 38.99% as against 22.42% for Hindus. During the last five decades(1951-2001), the share of Muslim population has risen from 15.60% in 1951 to 19.78%. Side byside, the share of Hindu population has declined from 83.73% in 1951 to 78.89% in 2001. Thus,the trend of growth of the Muslim population since 1951 is consistently higher than that of theHindu population.
Decade-wise population shares and the growth rates on the basis of religion during 1951-2001are shown in the chart nos. 13 & 14.

8/8/2019 Demography Bimal
http://slidepdf.com/reader/full/demography-bimal 17/93
District: Hooghly
After independence the Hooghly district has become a very important industrial district. Also,Hooghly has a large hinterland, which is notable for agricultural products. It is situated on the
western bank of the Hooghly river opposite to 24-Parganas on the other side. After partition, agood number of Hindu refugees settled in this district, but no notable post-1971 settlement isobserved. On the other hand, a continuous growth of Muslim population in this district is easilydiscernible. After the Nehru-Liaquat Agreement in 1950, most of the Muslims who had migratedto East Pakistan after Partition came back to this district. Growth rates of Muslims during 1951-1961 and 1961-1971 were respectively 36.94% and 31.14%, which corroborates this phenomenonof in-migration. Growth rates of Muslims during the last three decades (1971-2001) were ratherhigh—being respectively 32.17%, 29.15% and 20.77%—as against the growth rates of 22.47%,20.96% and 14.06% for Hindus, thus confirming large scale Bangladeshi infiltration in thisdistrict. During the last five decades, the population growth rate of Hindus in Hooghly is213.56%, as against 270.20% for Muslims. It is clear from the above data, that Musliminfiltration from East Pakistan/Bangladesh cannot be ignored in any way.
Trends of shares of Hindu and Muslim population and their growth rates during 1951-2001 areshown in the chart nos. 15 & 16.
District: South Twenty Four Parganas
After bifurcation of the district of 24 Parganas, the religious composition of the population of South 24-Parganas was as follows—Hindu 72.96%, Muslim 26.05% and others 1% in 1971. Onlyafter three decades, the share of Hindu population came down to 65.86%, and the share of theMuslim population shot up to 33.24%. Particularly, during the last two decades (1981-2001), thegrowth rate of Muslim population is remarkably high, i.e. respectively 45.38% and 34.17%, asagainst 24.68% and 15.14% for Hindus. The rate of growth of Muslim population is thus doublethat of the Hindu population. A massive illegal immigration of Muslims from Bangladesh to thisdistrict is evident during the 1981-2001 period, and a good number of them, noticeably, are Bihari
Muslim immigrants. One can go through micro-level (Block-level) data to get a clear idea of thismassive infiltration and a remarkable decline in the growth rate of Hindus in he selected Blocksof the district (e.g. Mograhat I & II, Diamond Harbor I & II, Bhangore I & II, etc.).
Decade-wise Hindu-Muslim population shares and their growth rates during 1951-2001 areshown in the chart nos. 17 & 18.
District: Dargeeling
It is situated at the north and north-west corner of West Bengal bordering Nepal, Sikkim,Bhutan and Bangladesh. Darjeeling is the main producer of word famous ‘Darjeeling Tea’. It isinteresting for its complex demographic composition and varieties of culture. Out of foursubdivisions, one is in the plain, namely, Siliguri. In 1959, a part of the territory which lay northof the river Mahananda was transferred from the West Dinajpur district to the Darjeeling district,so that the Mahananda river formed the boundary between Darjeeling and West Dinajpur. In1951, the religious composition of the district was as follows : Hindus 81.71%, Muslims 1.14%,Christians 2.76% and Buddhists 13.96%. During the last five decades, a continuously highgrowth of the Muslim and the Christian population is observed. These two communities havebeen able to increase their population share significantly by 2001 i.e. by 5.31% and 6.17%respectively. On the other hand, Hindu and Buddhist population declined to 76.92% and 11.02%respectively in 2001. A very high growth of Muslim population during the 1951-61 period couldbe accounted for by the newly included territory from West Dinajpur. But, during the last three

8/8/2019 Demography Bimal
http://slidepdf.com/reader/full/demography-bimal 18/93
decades (1971-2001), a remarkably high growth of Muslims was undoubtedly due to infiltrationof Bangladeshi Muslims. Most of the infiltration have taken place in the plain region of thedistrict. Growth rates of different religious communities during the last fifty years (1951-2001)were: Hindus 240%, Muslim 1235%, Christian 706% and Buddhists 185%.
Trend of religion-wise population shares and their growth rates during 1951-2001 are shownin the chart nos. 19 & 20.
District: Bankura
Bankura is basically an agricultural district situated on the western periphery of the Statebordering mainly Bardhaman, Medinipur and Purulia. The district is long known for itshandicrafts, art and culture traditions. A good number of Hindu refugee colonies were establishedafter Partition of Bengal in 1947 in this district. But from 1961 onwards, no notable Hinduimmigration from East Pakistan/Bangladesh is observed, and the growth rate of population (GRP)of Hindus during the last four decades have always been lower than the State average. On theother hand, the GRP of Muslims in the above periods has been double or more than double that of Hindus. Particularly, the post-1971 growth of the Muslim population is remarkably high in thisdistrict. Growth rates of Muslims during 1971-1981, 1981-1991 and 1991-2001 were 36.14%,38.73% and 28.87% respectively, as against 15.66%, 14.54% and 10.16% for Hindus during thesame period. During the last five decades (1951-2001), Muslim population growth rate shot up to312.58% as against Hindus at 123.92% only. As a result, the share of Muslim population hasrisen from 4.40% in 1951 to 7.51% in 2001. Bangladeshi infiltration is the major reason for thisextra-ordinary growth of number of Muslims in this district.
Trend of religion-wise population shares and their growth rates during 1951-2001 are shownin the chart nos. 21 & 22.
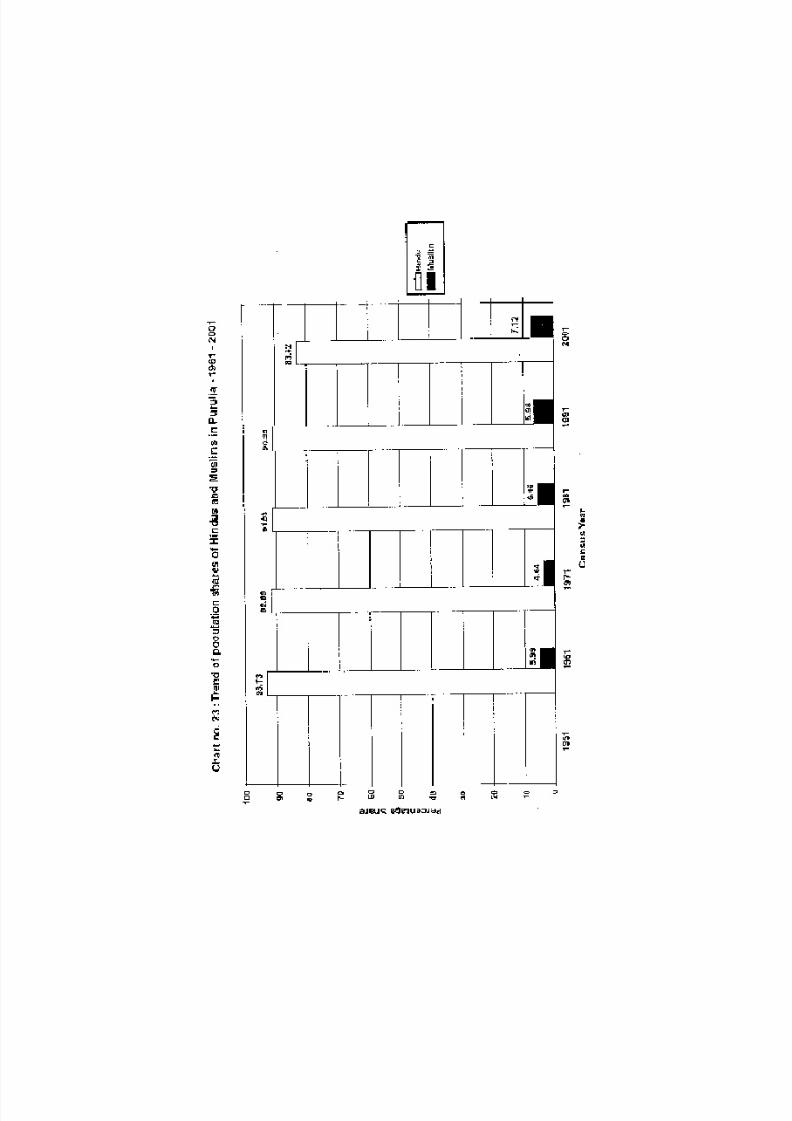
District: Purulia
Purulia is basically an agricultural district with rice being the main product. This district was asub-division under the Manbhum district of Bihar at the time of Partition in 1947. In 1956,Purulia was included in West Bengal under Bihar and West Bengal (Transfer of Territories) Act.
Now it is bordering the newly formed Jharkhand State. After 1947, no Hindu refugee migrationhad taken place in this district. The growth rate of Hindus was always lower than the Stateaverage in Purulia during the last four decades. On the other hand, a very high rate of growth of Muslims has taken place during the last three decades (1971-2001), i.e. respectively 35.79%,31.74% and 35.74%, as against 14.08%, 19.11% and 4.59% for Hindus. This disparity can onlybe attributed to Bangladeshi infiltration. During 1961-2001, Muslim population growth rate is121.65%, as against Hindus at 67.07% only.
Trend of religion-wise population shares and the growth rates for Hindus and Muslims during1961-2001 are shown in the form of chart nos. 23 & 24.
District: Howrah
Howrah was developed as an industrial base with many industries coming up on the bank of
the Hooghly river during the nineteenth and early twentieth centuries. Howrah is still one of themost important transit points for passengers and goods movement in the country through raillinks. Howrah remains a pride of place in the industrial map of West Bengal. After Partition in1947, a good number of refugee colonies were established in the district, but during 1951-2001,the growth rate of Hindu population was always remarkably lower than that of the State average.On the other hand, a continuously high growth rate of Muslim population in this district hasraised their population share from 16.22% in 1951 to 24.44% in 2001. A large number of Muslimfamilies have come back from East Pakistan after the Nehru-Liaquat Agreement in 1950,although they had migrated to East Pakistan after Partition. The post-1971 Muslim infiltration in

8/8/2019 Demography Bimal
http://slidepdf.com/reader/full/demography-bimal 19/93
this district is also remarkably high. Growth rates of Muslims in the last three decades (1971-2001) are 37.51%, 38.48% and 26.02% respectively, as against 19.28%, 22.48% and 10.91% forHindus. This can only underline the phenomenon of Bangladeshi infiltration in this district. Itmay be mentioned here that a large number of Bihari Muslims from Bangladesh have settled inthis district after 1971. During 1951-2001, the GRP of Muslims stands at 300%, as against 138%for Hindus. Thus, the growth rate of Muslims is more than double that of the Hindus.
Trend of religion-wise population shares and their growth rates during 1951-2001 are shownin the chart nos. 25 & 26.
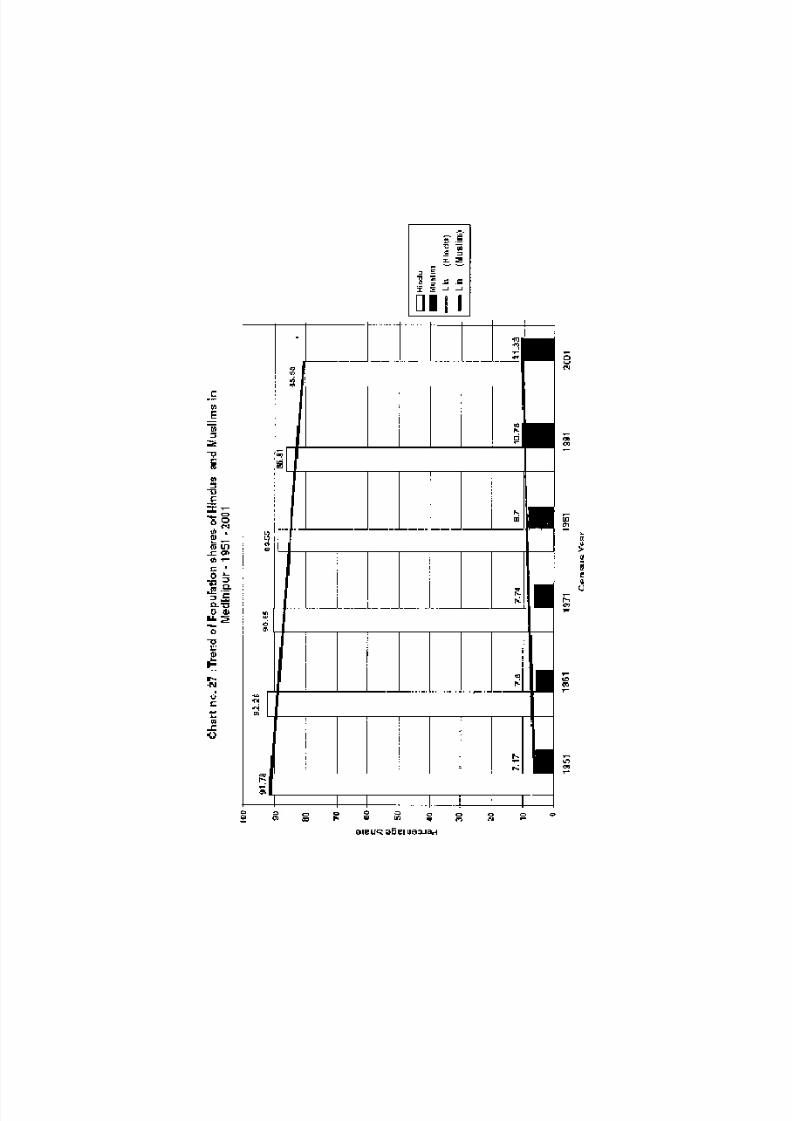
District: Medinipur
Medinipur is basically an agricultural district. Kharagpur in the district is known for itsimportant Railway Terminal and Workshop. Haldia is also becoming one of the major industrialcomplexes in the State with a fast developing port as an alternative to Kolkata. After Partition, afew colonies of Hindu refugees from East Bengal were established in this district. But, from 1961onwards, no notable Hindu was always lower than that of the State observed. GRP of Hindus wasalways lower than that of the State average. On the other hand, Muslim immigration in thisdistrict is remarkably high. Most of the Muslims who had migrated to East Pakistan afterPartition, came back during the 1951-1971 period. A massive number of Muslims have illegallyimmigrated to this district from Bangladesh during the last three decades (1971-2001),particularly during the 1981-1991 decade, which may be termed as the ‘decade of infiltration.’GRP of Muslims stood at 53.17% in this decade only. The share of Muslim population has risenfrom 7.17% in 1951 to 11.33% in 2001. During the last fifth years (1951-2001), the growth rateof Muslim population has reached 352%, as against 166.78% for Hindus.
Trend of religion-wise population shares and their growth rates during 1051-2001 are shownin the form of chart nos. 27 & 28.
District: Kolkata
Kolkata witnessed a continuously high growth of Muslim population during the last fivedecades (1951-2001). After Partition in 1947, a large number of Hindu evacuees from East
Pakistan had rushed to Kolkata and its outskirts. A large number of colonies were established bythese new entrants in the vicinity of Kolkata. Most of the areas are now under KolkataCorporation as well as the Kolkata district. In 1951, Dr. Ashoke Mitra, Superintendent of CensusOperations, West Bengal, had given the figure for the displaced persons who came to Kolkataafter 1947 as 433228. In spite of massive Hindu immigration in Kolkata up to 1971, the growthrate of Muslims during 1951-1961 and 1961-1971 was unbelievably high, i.e. 22.29% and46.96% respectively, as against 15.58% and 25.75% for Hindus during these two decades. Thisenhanced the population share of Muslims by 2.75% within two decades. One of the main reasonsbehind this growth is that most of the refugees who crossed over to East Pakistan after Partitioncame back after the Nehru-Liaquat Agreement in 1950. After the liberation of Bangladesh in1971, a large number of Bangladeshi Biharis have settled in the selected areas of Kolkata. Post-1971 growth rate of Muslims in Calcutta clearly testifies to this fact. On the other hand, a cleartrend of declining rates of Hindu and Christian population in Kolkata is evident since 1951.During the last five decades, the share of Muslim population has remarkably increased from12.0% in 1951 to 20.27% in 2001. On the other hand, the share of Hindu and Christian populationdeclined from 83.41% and 2.987% respectively in 1951 to 77.68% and 0.88% in 2001. During1951-2001, the growth rate of Hindus, Muslims and Christians in Kolkata were 67.09%, 202.93%and –46.97% respectively.
Trend of religion-wise population shares and their growth rates during 1951-2001 are shownin the form of chart nos. 29 & 30.

8/8/2019 Demography Bimal
http://slidepdf.com/reader/full/demography-bimal 20/93
N.B. Analysis of Uttar Dinajpur, Murshidabad, Nadia and North-24-Parganas districts havebeen included in the Chapter Three as detailed case studies.

8/8/2019 Demography Bimal
http://slidepdf.com/reader/full/demography-bimal 21/93

8/8/2019 Demography Bimal
http://slidepdf.com/reader/full/demography-bimal 22/93

8/8/2019 Demography Bimal
http://slidepdf.com/reader/full/demography-bimal 23/93

8/8/2019 Demography Bimal
http://slidepdf.com/reader/full/demography-bimal 24/93

8/8/2019 Demography Bimal
http://slidepdf.com/reader/full/demography-bimal 25/93
8/8/2019 Demography Bimal
http://slidepdf.com/reader/full/demography-bimal 26/93

8/8/2019 Demography Bimal
http://slidepdf.com/reader/full/demography-bimal 27/93

8/8/2019 Demography Bimal
http://slidepdf.com/reader/full/demography-bimal 28/93
8/8/2019 Demography Bimal
http://slidepdf.com/reader/full/demography-bimal 29/93

8/8/2019 Demography Bimal
http://slidepdf.com/reader/full/demography-bimal 30/93

8/8/2019 Demography Bimal
http://slidepdf.com/reader/full/demography-bimal 31/93

8/8/2019 Demography Bimal
http://slidepdf.com/reader/full/demography-bimal 32/93

8/8/2019 Demography Bimal
http://slidepdf.com/reader/full/demography-bimal 33/93

8/8/2019 Demography Bimal
http://slidepdf.com/reader/full/demography-bimal 34/93

8/8/2019 Demography Bimal
http://slidepdf.com/reader/full/demography-bimal 35/93

8/8/2019 Demography Bimal
http://slidepdf.com/reader/full/demography-bimal 36/93

8/8/2019 Demography Bimal
http://slidepdf.com/reader/full/demography-bimal 37/93
8/8/2019 Demography Bimal
http://slidepdf.com/reader/full/demography-bimal 38/93

8/8/2019 Demography Bimal
http://slidepdf.com/reader/full/demography-bimal 39/93

8/8/2019 Demography Bimal
http://slidepdf.com/reader/full/demography-bimal 40/93

8/8/2019 Demography Bimal
http://slidepdf.com/reader/full/demography-bimal 41/93
8/8/2019 Demography Bimal
http://slidepdf.com/reader/full/demography-bimal 42/93

8/8/2019 Demography Bimal
http://slidepdf.com/reader/full/demography-bimal 43/93

8/8/2019 Demography Bimal
http://slidepdf.com/reader/full/demography-bimal 44/93

8/8/2019 Demography Bimal
http://slidepdf.com/reader/full/demography-bimal 45/93

8/8/2019 Demography Bimal
http://slidepdf.com/reader/full/demography-bimal 46/93
Chapter Three
DEMOGRAPHIC CHANGES : SPECIAL CASE STUDIES OFFOUR DISTRICTS BORDERINGS
District : West Dinajpur / Uttar Dinajpur / Dakshin Dinajpur
Uttar Dinajpur was created in 1991, after bifurcation of the erstwhile district of West Dinajpurinto Uttar and Dakshin Dinajpur. A major portion of the district passes through a long and narrowstretch of land from Darjeeling in the north, Bangladesh in the east, Dakshin Dinajpur in thenorth, Bangladesh in the east, Dakshin Dinajpur in the south and south-east and Bihar on thewest. When the erstwhile Dinajpur was bifurcated between West Bengal and then East Pakistanby the Radcliffe Award, the newly created district of West Dinajpur which came to West Bengalhad no direct connection with the other three north Bengal districts of Darjeeling, Jalpaiguri andCoochbehar, as a large tract of the then East Pakistan and Bihar intervened between them, andthere was no direct link of these three north Bengal districts with the rest of the State of WestBengal. A link was provided by the Bihar and West Bengal (Transfer of Territories) Act of 1956,whereby a strip of land was transferred to West Bengal from the Purnea district of Bihar.Subsequently, in 1959, a part of the transferred territories lying in the north of river Mahanandawas transferred to the Darjeeling district so that the Mahananda river formed the northernboundary of West Dinajpur and now Uttar Dinajpur. A new subdivision, namely Islampur, wascreated in the same year. Religious composition of the district after partition was as follows :Hindus 69.3%, Muslims 29.94% and other less than 1% in 1951. But, after the inclusion of astretch of territory from Bihar in 1956, religious composition was totally changed. The share of Muslim population jumped to 39.41% and consequently the share of Hindus come down to59.87% in the 1961 census. Continuous Hindu immigration from East Pakistan and Bangladeshduring 1951-1991 has increased the share of Hindu population significantly. On the other hand,high growth of Muslim population during the last three decades (1971-2001) also indicatesBangladeshi Muslim infiltration in the district. After bifurcation of West Dinajpur, the share of Muslim population of Uttar Dinajpur jumped from 35.79% in 1981 to 45.35% in 1991. Only inthe last decade (1991-2001), it had risen to 47.36%, and the share of Hindu population had comedown to 51.72% (2.5% lower than in 1991). On the other hand, the share of Hindu and Muslimpopulation in Dakshin Dinajpur as 74.01% and 24.02% respectively in 2001.
Decade-wise population shares and the growth rates on the basis of religion during 1951-2001are shown in the chart nos. 31, 32, 33 & 34.
8/8/2019 Demography Bimal
http://slidepdf.com/reader/full/demography-bimal 47/93
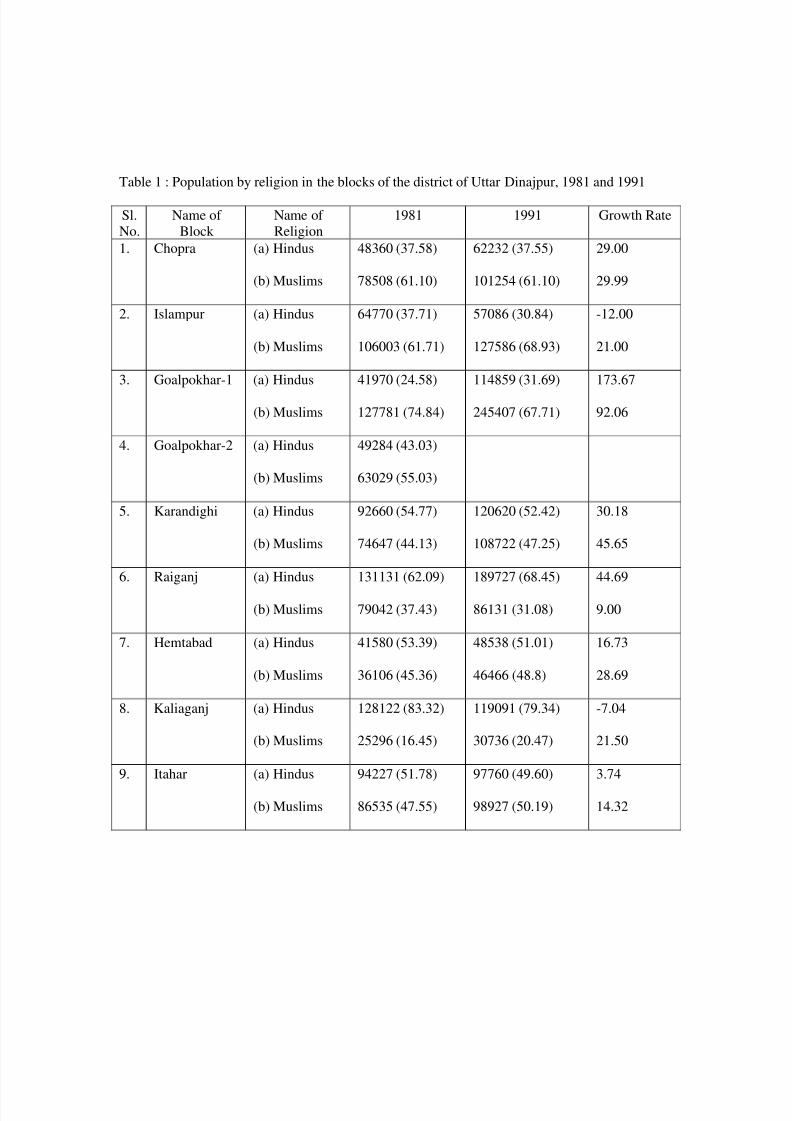
Table 1 : Population by religion in the blocks of the district of Uttar Dinajpur, 1981 and 1991
Sl.No.
Name of Block
Name of Religion
1981 1991 Growth Rate
1. Chopra (a) Hindus
(b) Muslims
48360 (37.58)
78508 (61.10)
62232 (37.55)
101254 (61.10)
29.00
29.99
2. Islampur (a) Hindus
(b) Muslims
64770 (37.71)
106003 (61.71)
57086 (30.84)
127586 (68.93)
-12.00
21.00
3. Goalpokhar-1 (a) Hindus
(b) Muslims
41970 (24.58)
127781 (74.84)
114859 (31.69)
245407 (67.71)
173.67
92.06
4. Goalpokhar-2 (a) Hindus
(b) Muslims
49284 (43.03)
63029 (55.03)
5. Karandighi (a) Hindus
(b) Muslims
92660 (54.77)
74647 (44.13)
120620 (52.42)
108722 (47.25)
30.18
45.65
6. Raiganj (a) Hindus
(b) Muslims
131131 (62.09)
79042 (37.43)
189727 (68.45)
86131 (31.08)
44.69
9.00
7. Hemtabad (a) Hindus
(b) Muslims
41580 (53.39)
36106 (45.36)
48538 (51.01)
46466 (48.8)
16.73
28.69
8. Kaliaganj (a) Hindus
(b) Muslims
128122 (83.32)
25296 (16.45)
119091 (79.34)
30736 (20.47)
-7.04
21.50
9. Itahar (a) Hindus
(b) Muslims
94227 (51.78)
86535 (47.55)
97760 (49.60)
98927 (50.19)
3.74
14.32

8/8/2019 Demography Bimal
http://slidepdf.com/reader/full/demography-bimal 48/93
Table 2 : Population by religion in the blocks of the district of Dakshin Dinajpur, 1981 and 1991
Sl.No.
Name of Block
Name of Religion
1981 1991 Growth Rate
1. Kushmandi (a) Hindus
(b) Muslims
76024 (63.20)
43553 (36.20)
103034 (59.16)
66319 (38.08)
35.53
52.27
2. Harirampur (a) Hindus
(b) Muslims
3. Banshihari (a) Hindus
(b) Muslims
91994 (70.24)
36602 (27.95)
113403 (67.30)
53464 (31.73)
23.27
46.07
4. Gangarampur (a) Hindus
(b) Muslims
114931 (74.92)
35576 (23.19)
143568 (70.20)
57513 (28.12)
29.92
61.66
5. Kumarganj (a) Hindus
(b) Muslims
72813 (69.59)
31434 (30.04)
87294 (67.32)
40854 (31.50)
19.89
29.97
6. Tapan (a) Hindus
(b) Muslims
123473 (83.63)
23042 (15.61)
133512 (71.41)
50943 (27.25)
8.13
121.09
7. Balurghat (a) Hindus
(b) Muslims
142734 (93.43)
7683 (5.03)
172560 (93.17)
9636 (5.20)
20.9
25.42
8. Hili (a) Hindus
(b) Muslims
44289 (87.67)
5008 (9.91)
54283 (87.83)
6160 (9.97)
22.57
23.0
(Percentage to total population of the Block shown within parentheses)Source : District Statistical Handbook, 2002, Uttar and Dakshin Dinajpur, Bureau of Applied Economics andStatistics, Government of West Bengal
Block-level population growth, religion-wise, gives us a revealing picture regarding Musliminfiltration from Bangladesh into the district. All the Blocks except the headquarters, Raigonj andBalurghat, of both Uttar and Dakshin Dinajpur districts, witnessed a massive growth of Muslimpopulation. Special mention is necessary for the Blocks Islampur and Kaliagonj of UttarDinajpur, where a massively negative growth of Hindu population is distinctly visible. Again,

8/8/2019 Demography Bimal
http://slidepdf.com/reader/full/demography-bimal 49/93
Tapan of Dakshin Dinajpur witnessed an unbelievable 121% growth rate of Muslims and 8.13%only for Hindus. Consequently, the share of Muslim population shot up from 15.61% to 27.25%,and that of Hindu population declined from 83.63% to 71.41% in only a decade. This appears tobe mainly due to desertion of the Hindus from the area, particularly Islampur, for want of securityof both their families and properties as a result of religions re-orientation.
Infiltration unabated :
The district under consideration has a long international border with Bangladesh. It has also acheck post at Radhikapur (railway). Katihar-Barsoi-Radhikapur-Dinajpjur railway link is nowworking to carry goods from India and Nepal to Bangladesh. There are some other road linkswith the border, e.g. Bindol, Samaspur, Malancha, Kaliganga, etc. Barbed wire fencing along theborder is yet to be completed in this district.
Problems of cross-order migration, both permanent and temporary in nature, persist in the areaunder local political patronization and support. Apparently, this cross-border immigration of Muslims from Bangladesh has become a perennial process. The reason in many cases may beprimarily economic, but other possible complicated causes relating to infiltration by Islamicmilitants can in no way be underestimated. However, the net effect is that this huge influx of alienpopulation is creating a fast growing poverty-ridden Muslim enclave in the district.
In Uttar Dinajpur, a Muslim dominated area (specially Islampur sub-division), BangladeshiMuslims including Biharis always feel comfortable to settle down. But Bangladeshi Hinduimmigrants are coming mainly due to religious persecution and Intolerance as well insecuritybecause of their religious identity. So, in most of the cases, Hindus immigration is permanent innature and they prefer to settle in the Hindu dominated areas. A common perception of theimmigrant people is that, it is easy to establish oneself as a citizen by enrolment in the voters’ list,by acquiring a ration card and some other documents from the Panchayat office or MLA or otherpublic representatives. Apart from this, one can get job/employment and social security for one’sfamilies with the help of the locals.
In fact, as a result of the high growth rate of the immigrant Bangladeshi population in thedistrict, these immigrants have even been occupying the major share of job and tradeopportunities that have been created in the district due to developmental activities. It is
noteworthy that Bangladeshi immigrant labor forces engage themselves at a lower rate of wagethan the local laborers.
Crimes and its consequences :
Organized crimes, particularly, trans-border crimes are common phenomena in the district.Murder, dacoity, cattle lifting, smuggling, kidnapping, etc. are the major criminal activitiesavailable in the police record. To understand the ground realties, we can take the guage of criminal offences recorded in the police stations, number of cases tried, number of personsconvicted and number of persons acquitted during 1997-2001.
Table 3 (a) : No. of offences reported during the last five years (1997-2001)
Class of offence Year
1997 1998 1999 2000 2001
Murder 22 34 22 26 37
Dacoity 4 2 2 4 19
Robbery 5 - 4 5 8
Burglary 2 - 9 8 10Rioting 49 36 25 36 45

8/8/2019 Demography Bimal
http://slidepdf.com/reader/full/demography-bimal 50/93
Theft 168 177 186 165 273
Minor offences 2562 1621 96 104 —
Offences against woman - 122 78 101 136
Others 737 553 509 518 1302Total 3549 2545 931 967 180
Table 3 (b) : No. of cases tried during the last five years (1997-2001)
Class of offence Year
1997 1998 1999 2000 2001
Murder - - - - 17Dacoity - - 3 - 1
Robbery - - - - 4Burglary - - - - 1
Rioting - - - - 64
Theft - - 4 - 21
Minor offences - - - 15 —
Offences against woman - - - - 59Others 687 415 - 41 273
Total 687 415 7 56 440
Table 3 (c) : No. of persons convicted during the last five years (1997-2001)
Class of offence Year
1997 1998 1999 2000 2001
Murder 4 - - - —Dacoity - - - - —
Robbery - - - - —
Burglary - - - - —
Rioting - - - - —Theft 1 - - - 1
Minor offences - 1476 78 23 —
Offences against woman - - - - 3
Others 90 37 8 30 95
Total 95 1513 86 53 99
Table 3 (d) : No. of persons acquitted during the last five years (1997-2001)
Class of offence Year
1997 1998 1999 2000 2001
Murder 10 - - - 44
Dacoity 1 - - - 10Robbery - - - - 12
Burglary - - - - 1Rioting - - - - 538
Theft 11 - - - 1
Minor offences - 1 86 28 —Offences against woman - 1 - - 157
Others 323 1 20 39 709
8/8/2019 Demography Bimal
http://slidepdf.com/reader/full/demography-bimal 51/93
Total 345 3 106 67 1472
Source : District Statistical Handbook, 2002, Uttar Dinajpur, Bureau of Applied Economics and Statistics,Government of West Bengal
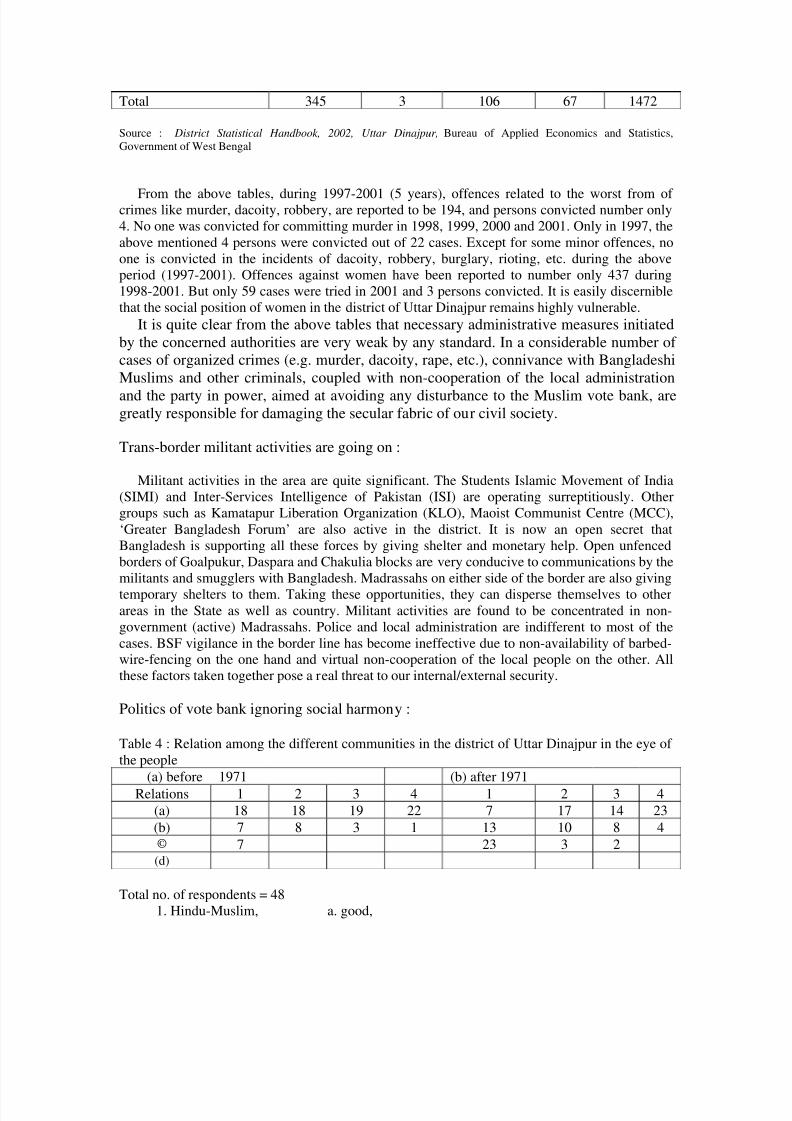
From the above tables, during 1997-2001 (5 years), offences related to the worst from of crimes like murder, dacoity, robbery, are reported to be 194, and persons convicted number only4. No one was convicted for committing murder in 1998, 1999, 2000 and 2001. Only in 1997, theabove mentioned 4 persons were convicted out of 22 cases. Except for some minor offences, noone is convicted in the incidents of dacoity, robbery, burglary, rioting, etc. during the aboveperiod (1997-2001). Offences against women have been reported to number only 437 during1998-2001. But only 59 cases were tried in 2001 and 3 persons convicted. It is easily discerniblethat the social position of women in the district of Uttar Dinajpur remains highly vulnerable.
It is quite clear from the above tables that necessary administrative measures initiatedby the concerned authorities are very weak by any standard. In a considerable number of cases of organized crimes (e.g. murder, dacoity, rape, etc.), connivance with BangladeshiMuslims and other criminals, coupled with non-cooperation of the local administration
and the party in power, aimed at avoiding any disturbance to the Muslim vote bank, aregreatly responsible for damaging the secular fabric of our civil society.
Trans-border militant activities are going on :
Militant activities in the area are quite significant. The Students Islamic Movement of India(SIMI) and Inter-Services Intelligence of Pakistan (ISI) are operating surreptitiously. Othergroups such as Kamatapur Liberation Organization (KLO), Maoist Communist Centre (MCC),‘Greater Bangladesh Forum’ are also active in the district. It is now an open secret thatBangladesh is supporting all these forces by giving shelter and monetary help. Open unfencedborders of Goalpukur, Daspara and Chakulia blocks are very conducive to communications by themilitants and smugglers with Bangladesh. Madrassahs on either side of the border are also giving
temporary shelters to them. Taking these opportunities, they can disperse themselves to otherareas in the State as well as country. Militant activities are found to be concentrated in non-government (active) Madrassahs. Police and local administration are indifferent to most of thecases. BSF vigilance in the border line has become ineffective due to non-availability of barbed-wire-fencing on the one hand and virtual non-cooperation of the local people on the other. Allthese factors taken together pose a real threat to our internal/external security.
Politics of vote bank ignoring social harmony :
Table 4 : Relation among the different communities in the district of Uttar Dinajpur in the eye of the people
(a) before 1971 (b) after 1971
Relations 1 2 3 4 1 2 3 4(a) 18 18 19 22 7 17 14 23
(b) 7 8 3 1 13 10 8 4© 7 23 3 2(d)
Total no. of respondents = 481. Hindu-Muslim, a. good,

8/8/2019 Demography Bimal
http://slidepdf.com/reader/full/demography-bimal 52/93
2. Local-outsider b. normal,3. Bengali-Rajbanshi, c. bad,4. Tribal-Non-tribal d. worse
The above mentioned respondents were selected from different socio-economic strata acrossthe district (e.g. professionals, government employees, political personalities, teachers,
businessmen etc.). It is seen from primary data that 48 respondents have expressed their viewsregarding relation among the different communities in the district before and after 1971. In caseof Hindu-Muslim relation before 1971, 18 have opined that it was good, 7 in favour of normal,i.e. workable and 7 for bad. But after 1971, only 7 respondents feel it is good, 13 feel it to beworkable, and 23 bad. From the above table, it is clearly spelt out that post-1971 Hindu-Muslimrelation in the district has worsened in comparison to the pre-1971 period. To be precise,historically the Hindu-Muslim relation has become bitter in the area after the independence of Bangladesh. On the other hand, ‘local outsider’ and ‘tribal-non-tribal’ relations in the district arestill as good as before 1971. It is mentionable that, infiltrated Muslim population fromBangladesh are always welcome by the local Muslims of West Bengal in most of the cases. As aresult, local-outsider of West Bengal in most of the cases. As a result, local-outsider relations inthe Muslim dominated Uttar Dinajpur district is good. In the case of Bengali-Rajbonshi relation,
however, though it is not as good as in the pre-1971 period, it is still good and workable.Political outfits of the region are active in furthering their own party interest, but not national
interest. Slogans of peace and amity among the communities get priority only at the level of propaganda by political parties, but not in practice. Social organizations are too weak to platytheir role in maintaining peace and harmony among the different communities. On the other hand,organized smugglers and criminals in the district are an important factor in politics and society.Most of the political leaders depend on them for money. Uttar Dinajpur district is soon going tobe a Muslim majority district. Because of a massive Muslim presence in the district, the idea of aMuslim vote bank is gradually gaining ground among the political leaders. Some important factshave emerged from the answer of the respondents regarding ground realities of Hindu-Muslimrelations.
(a) It is seen that Muslim dominated areas are not safe for other religious communities.
(b) Islamic faith always preaches intolerance to other religious faiths. Madrassah teaching isone of the oldest institutional mechanisms to preach intolerance to other religions amongMuslims.
(c) Muslims are always trying to consolidate their position in the border areas as well asMuslim dominated areas in the district, ousting other religious communities. They areexpanding their settlements in the non-Muslim areas also.
(d) It is significant to note that a good number of mosques and madrassahs (private) havecome up within the last decade in the district.
(e) Moulvis/Maolanas are urging upon Muslims to increase their population by infiltrationfrom Bangladesh and Bihar, by abstention from birth control, by conversion, and byhaving more than one wife, as permitted in the Shariat.
(f) Most of the enlightened Muslims are of the opinion that independent India is not apermanent arrangement, and that the present state structure too is not adequate for thewelfare of the people. The United Liberation Front of Assam (ULFA), Kamtapur People’sParty (KPP), Gorkhaland and organization of the like are struggling for a new system of States that will bring peace and harmony in India. A good number of leaders from the

8/8/2019 Demography Bimal
http://slidepdf.com/reader/full/demography-bimal 53/93
Muslim community are also not unhappy about the emergence of such divisive forces.They feel that, at the appropriate opportunity, they can also fulfill their long-cherisheddesire of having a unique world of their own.
District: Murshidabad
Murshidabad was the capital of the Nawabs of Bengal during the seventeenth and eighteenthcenturies, till the takeover by the East India Company. Murshidabad also presents a veryinteresting demographic profile. It is basically an agricultural district with 87.15% of thepopulation living in rural areas. It was a Muslim majority district before Partition with apopulation share of 56.55% (1941). After partition in 1947, no massive migration of Muslimsfrom this district to Pakistan is observed. On the other hand, most of them who had migrated toPakistan came back again after the Nehru-Liaquat Agreement of 1950. A good number of Hindurefugee also immigrated in this district from East Pakistan during the 1951-1961 decade. But thepost-1971 scenario of infiltration is quite different growth rates of Muslims during the last threedecades (1971-2001) were 30.95%, 34.17% and 28.35% respectively, as against 19.06%, 19.60%
and 15.82% only for Hindus in the respective decades. It had been possible due to a massiveMuslim infiltration in this district from Bangladesh since 1971. Now the share of Hindupopulation in Murshidabad has drastically come down from 44.60% (1951) to 35.92% (2001), i.e.within span of fifty years. A continuously high growth of Muslim population in this district raisedtheir share of population from 55.24% (1951) to 63.67% (2001). The growth rate of Muslimpopulation during 1951-2001 was 294.10%, as against 175.41% for Hindus.
Decade-wise population shares and the growth rates on the basis of religion during 1951-2001are shown in the chart nos. 35 & 36.
Table 5: Population by religion in the blocks of the district of Murshidabad, 1981 and 1991
Sl.
No.
Name of Block Name of
Religion
1981 1991 Growth Rate
1. Farakka (a) Hindus(b) Muslims
55299 (41.13)78948 (58.72)
71451 (40.36)105069 (59.34)
29.2133.09
2. Smerganj (a) Hindus(b) Muslims
29821 (22.45)102999 (77.52)
34966 (19.39)145349 (80.61)
17.2641.12
3.4.
Suti-1Suti-2
(a) Hindus(b) Muslims
85913 (41.96)118643 (57.95)
105062 (39.02)164079 (60.93)
22.2938.30
5.6.
Raghunathganj-1Raghunathganj-2
(a) Hindus(b) Muslims
72683 (35.39)132504 (64.51)
90867 (33.20)182631 (66.72)
25.02
7. Sagardighi (a) Hindus(b) Muslims
65494 (41.69)90261 (57.46)
78008 (39.18)118963 (59.75)
19.1131.80
8. Lalgola (a) Hindus
(b) Muslims
41550 (26.68)
113931 (73.16)
49897 (24.13)
156607 (75.74)
37.46
9.10.
Bhagwangola-1Bhagwangola-2
(a) Hindus(b) Muslims
41630 (21.82)149134 (78.18)
43531 (17.98)198618 (82.02)
4.5733.18
11.12.
Raninagar-1Raninagar-2
(a) Hindus(b) Muslims
47889 (23.86)152771 (76.12)
54979 (21.22)204135 (78.77)
14.8133.61
13. Msd. Jiaganj (a) Hindus(b) Muslims
56159 (48.56)59074 (51.03)
74258 (46.91)82743 (52.28)
32.2340.21
14. Nabagram (a) Hindus 64945 (52.45) 80303 (50.15) 23.65

8/8/2019 Demography Bimal
http://slidepdf.com/reader/full/demography-bimal 54/93
(b) Muslims 58091 (46.91) 77721 (48.53) 33.80
15. Khargram (a) Hindus(b) Muslims
92552 (55.03)75449 (44.87)
106464 (52.63)95694 (47.31)
15.0426.84
16. Burwan (a) Hindus(b) Muslims
105890 (64.16)58982 (35.74)
121106 (61.50)75722 (38.45)
14.3728.39
Sl.No.
Name of Block Name of Religion
1981 1991 Growth Rate
17. Kandi (a) Hindus(b) Muslims
62179 (47.97)67332 (51.94)
71440 (44.71)88117 (55.14)
14.9030.87
18.19.
Bharatpur-1Bharatpur-2
(a) Hindus(b) Muslims
110290 (51.72)102902 (48.26)
123497 (48.06)133420 (51.93)
11.9829.66
20.21.
Beldanga-1Beldanga-2
(a) Hindus(b) Muslims
119900 (38.90)188340 (61.10)
136568 (35.44)249818 (64.66)
13.9132.65
22. Nowda (a) Hindus(b) Muslims
48311 (36.96)82414 (63.04)
55189 (33.54)109342 (66.46)
14.2432.68
23. Hariharpara (a) Hindus(b) Muslims
38685 (25.85)110994 (74.15)
43318 (23.35)142220 (76.65)
11.9828.14
24. Berhampore (a) Hindus(b) Muslims
105321 (47.79)114809 (52.11)
141742 (47.44)156705 (52.45)
34.5836.50
25. Domkal (a) Hindus(b) Muslims
26072 (13.57)166029 (86.42)
32231 (12.72)221021 (87.24)
23.6333.13
26. Jalangi (a) Hindus(b) Muslims
49264 (36.61)85275 (63.37)
55095 (31.84)117947 (68.15)
11.8438.32
(Percentage of population share shown in parentheses)
Source : District Statistical Handbook, 2002, Murshidabad, Bureau of Applied Economics and Statistics, Governmentof West Bengal
Block-level population growth rates, religion-wise, give us a revealing picture of the entiredistrict. All the Blocks except Berhampore witnessed a tremendous rage of growth of Muslimpopulation. At least 10 Blocks out of 25 witnessed the growth rate of Muslims to be more thandouble that of Hindus. This appears to be due to a huge massive Bangladeshi influx into thedistrict, avoiding of birth control by the Muslims, and departure of the Hindus from the area forwant of security of both their families and properties. It is noteworthy that a sizeable number of Hindus, deserting rural areas, have been settling in the Berhampore town and its outskirt underthe Berhampore Block. In spite of that, the Hindu population growth rate (34.58%) did nevercross the Muslim growth rate (36.50%) in the Berhampore Block, headquarters of the district of Murshidabad.
Changing Cultural Scenario:
The mainstream traditional Bengali as well as Indian culture is gradually fading out from thepopulation in the region, specially among them who had settled in this region by migrating fromEast Bengal/East Pakistan. As a result, the elite Bengali Hindu culture, specially comprisingRabindra Sangeet, Kirtan, etc. are losing their influence in this region. In this context it is worthyof mention that the cultural alienation between the Bengali Hindus and Bengali Muslims is notonly becoming more and more wide, but is also creating a hiatus between the urban elite and therural masses within the Bengali Hindu society itself. In this situation, we can examine the culturalethos practiced by the rural masses, especially Muslims and Hindus belonging to the lower

8/8/2019 Demography Bimal
http://slidepdf.com/reader/full/demography-bimal 55/93
echelon of the society in this region. Religio-cultural activities, organized by the establishment of temples, mosques, dargas, churches, etc., is a common phenomenon in this sub-continent as wellas in the world. During the last three decades, remarkably, on account of a massive infiltration of Muslims from Bangladesh, there has been a spurt in the construction of mosques and madrassasin the district, and a rapid growth of attendant religio-cultural activities in the region. Growth of the radical Islamic fundamentalists (pro-Taliban) in this region has to be examined in this context.
Embargo (Fatowa) on activities of the Sufi/Baul sect, a religiously liberal section of the Muslimsociety, has been imposed by neo-radical Islamists. Even several types of punishment have beeninflicted on them, including physical torture, fine etc. These liberal Muslims who have also beenforcibly restrained from working as daily laborers, opening shops, getting irrigation water,appointing private tutors, holding congregations on the open field, and even using thoroughfares.The saddest part of this episode is that they have been debarred from using the common burialground. Leftist leaders and activities in this district are also in favour of vigorous attempts tospread radical Islam among the members of the Sufi/Baul sect. Interestingly, the same thing hashappened in Bangladesh after 1971 under the leadership of Jammaat-e-Islami. It is an obviouscorollary that the Muslim community is gradually consolidating themselves through their religio-socio-cultural activities with a view to making themselves the major socio-political power in theState of West Bengal. They are already a recognizable socio-political force in the district of
Murshidabad.
Infiltration Unabated:
Murshidabad has a long international border with Bangladesh. Domkal, Lalbag and Jangipursub-divisions of the district are naturally separated from Bangladesh by the river Padma. Cross-border infiltration and unofficial trade, including cattle smuggling, are the major activities in thisarea vis-à-vis Bangladesh. Most of the international border with Bangladesh is riverine, and charsof the river Padma are conductive to smuggling activities.
Lists of some illegal trade and communication routes with Bangladesh are given below tocomprehend the ground realities.
(a) Jalangi to Bajumara Char, Rajshahi, Bangladesh.
(b) Narasinghapur to Mirgonj, Bangladesh.(c) Sagarpara to Rajshahi Town, Bangladesh.(d) Singhpara to Iswardighat, Bangladesh.(e) Kaharpara Char to Lalpur, Bangladesh.(f) Dhanirampur to Alam’s Char, Bangladesh.(g) Madhubona to Charuikuri Char, Bangladesh.(h) Lalgola to Rajshahi(i) Tetulia to Hosnabad, Bangladesh.(j) Deghipara to Kagmari Char, Bangladesh.It is very difficult for the BSF alone to control cross-border movements and smuggling, since
most of the people (90% approx) are associated with this trade, and local administration, i.e.Panchayet, Police, etc. as well as local political forces are party to it. On the other hand, the BDR
encourages cross-border movements and cattle smuggling with the connivance of Indian locals.As a result, the relation between the BSF and the locals has become inimical. A lot of Bangladeshi people are living in charland within Indian territories with the connivance of IndianMuslims. If the BSF identify any of them as infiltrators and try to push them back to Bangladesh,the BDR refuses to accept them. Incidents of firing or cross-border clashes between the BDR andthe BSF on the push-back—push-in issue are a regular feature in this area. Apart from this, thelocal people always try to justify infiltration, and even protect infiltrators by offering shelter andidentifying tem as their relatives of Indian origin. They also help them to get residential papersfrom the local authority.
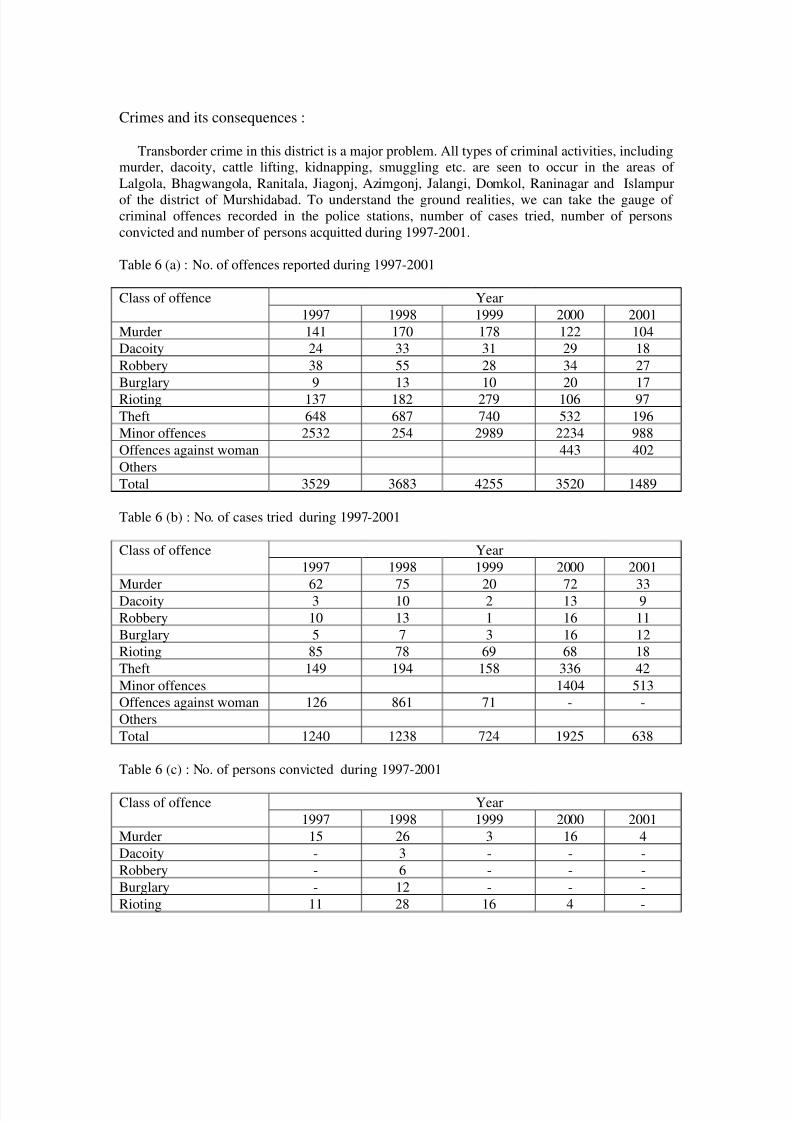
8/8/2019 Demography Bimal
http://slidepdf.com/reader/full/demography-bimal 56/93
Crimes and its consequences :
Transborder crime in this district is a major problem. All types of criminal activities, includingmurder, dacoity, cattle lifting, kidnapping, smuggling etc. are seen to occur in the areas of Lalgola, Bhagwangola, Ranitala, Jiagonj, Azimgonj, Jalangi, Domkol, Raninagar and Islampur
of the district of Murshidabad. To understand the ground realities, we can take the gauge of criminal offences recorded in the police stations, number of cases tried, number of personsconvicted and number of persons acquitted during 1997-2001.
Table 6 (a) : No. of offences reported during 1997-2001
Class of offence Year
1997 1998 1999 2000 2001
Murder 141 170 178 122 104Dacoity 24 33 31 29 18
Robbery 38 55 28 34 27
Burglary 9 13 10 20 17Rioting 137 182 279 106 97
Theft 648 687 740 532 196Minor offences 2532 254 2989 2234 988
Offences against woman 443 402
Others
Total 3529 3683 4255 3520 1489
Table 6 (b) : No. of cases tried during 1997-2001
Class of offence Year
1997 1998 1999 2000 2001
Murder 62 75 20 72 33Dacoity 3 10 2 13 9
Robbery 10 13 1 16 11
Burglary 5 7 3 16 12Rioting 85 78 69 68 18
Theft 149 194 158 336 42
Minor offences 1404 513Offences against woman 126 861 71 - -
Others
Total 1240 1238 724 1925 638
Table 6 (c) : No. of persons convicted during 1997-2001
Class of offence Year
1997 1998 1999 2000 2001
Murder 15 26 3 16 4
Dacoity - 3 - - -
Robbery - 6 - - -
Burglary - 12 - - -
Rioting 11 28 16 4 -
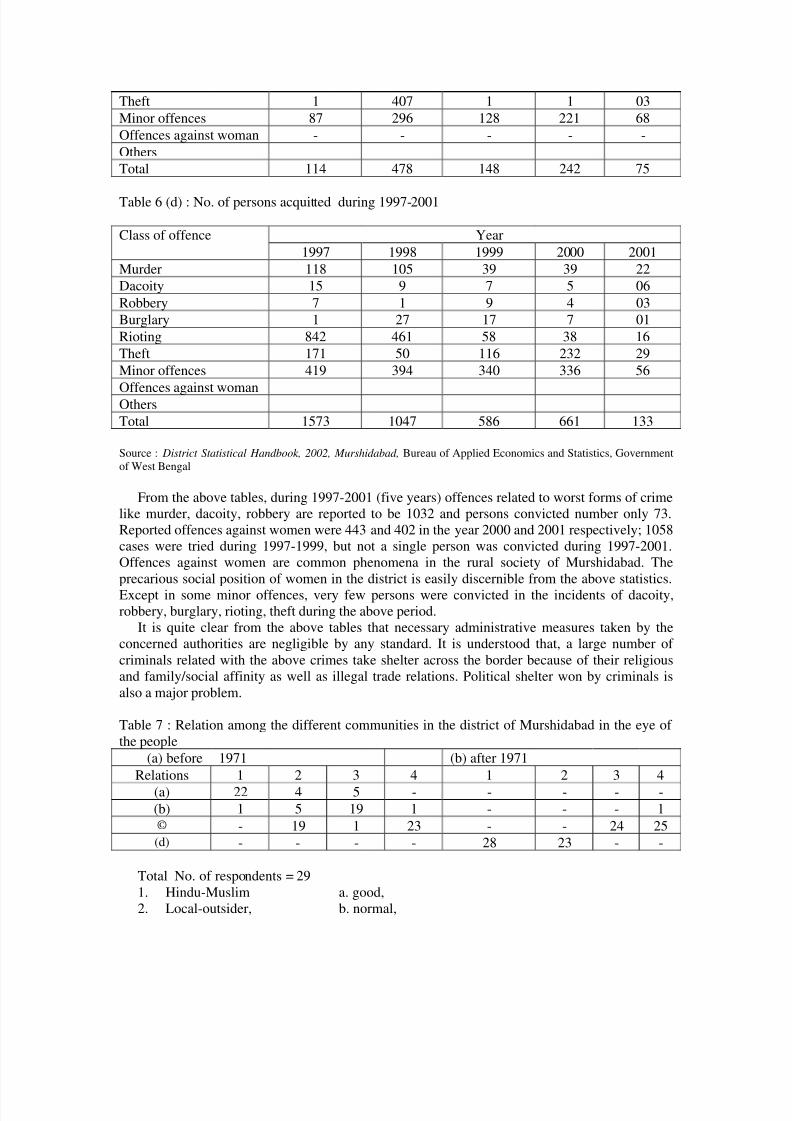
8/8/2019 Demography Bimal
http://slidepdf.com/reader/full/demography-bimal 57/93
Theft 1 407 1 1 03
Minor offences 87 296 128 221 68
Offences against woman - - - - -
OthersTotal 114 478 148 242 75
Table 6 (d) : No. of persons acquitted during 1997-2001
Class of offence Year
1997 1998 1999 2000 2001
Murder 118 105 39 39 22Dacoity 15 9 7 5 06
Robbery 7 1 9 4 03Burglary 1 27 17 7 01
Rioting 842 461 58 38 16
Theft 171 50 116 232 29
Minor offences 419 394 340 336 56
Offences against womanOthers
Total 1573 1047 586 661 133
Source : District Statistical Handbook, 2002, Murshidabad, Bureau of Applied Economics and Statistics, Governmentof West Bengal
From the above tables, during 1997-2001 (five years) offences related to worst forms of crimelike murder, dacoity, robbery are reported to be 1032 and persons convicted number only 73.Reported offences against women were 443 and 402 in the year 2000 and 2001 respectively; 1058cases were tried during 1997-1999, but not a single person was convicted during 1997-2001.Offences against women are common phenomena in the rural society of Murshidabad. Theprecarious social position of women in the district is easily discernible from the above statistics.Except in some minor offences, very few persons were convicted in the incidents of dacoity,robbery, burglary, rioting, theft during the above period.
It is quite clear from the above tables that necessary administrative measures taken by theconcerned authorities are negligible by any standard. It is understood that, a large number of criminals related with the above crimes take shelter across the border because of their religiousand family/social affinity as well as illegal trade relations. Political shelter won by criminals isalso a major problem.
Table 7 : Relation among the different communities in the district of Murshidabad in the eye of the people
(a) before 1971 (b) after 1971
Relations 1 2 3 4 1 2 3 4(a) 22 4 5 - - - - -
(b) 1 5 19 1 - - - 1© - 19 1 23 - - 24 25(d) - - - - 28 23 - -
Total No. of respondents = 291. Hindu-Muslim a. good,2. Local-outsider, b. normal,

8/8/2019 Demography Bimal
http://slidepdf.com/reader/full/demography-bimal 58/93
3. Bengali-Rajbanshi, c. bad,4. Tribal-Non-tribal d. worse
The above mentioned respondents were selected from different socio-economic strata acrossthe district (e.g. professionals, government employees, political personalities, teachers,businessmen etc.)
It is seen from the above table that 29 respondents have expressed their opinion regardingrelation among the different communities in the district before and after 1971. Hindu-Muslimrelation in West Bengal always gets importance because of their comparative population strengthand historical legacy. 22 respondents out of 29 have opined that it was good before 1971. Butafter 1971, the situation has completely changed. 28 respondents feel it is worse. It is clearly speltout that the post-1971 Hindu-Muslim relation in the district has worsened, in contrast to the pre-1971 relation. To be precise, historically, the Hindu-Muslim relation has become bitter orworsened in this area after the independence of Bangladesh. Post-1971 Hindu migration fromBangladesh into India is one of the main causes of deteriorating Hindu-Muslim relation. On theother hand, ‘local-outsider’ and ‘tribal-non-tribal’ relations in the district are as bad as it wasbefore 1971. In the case of Bengali-Rajbanshi relation, it has deteriorated after 1971. BarringBangladeshi infiltration, local-outsider relation is more or less dependent on economic conditions.
Special characteristics of border subdivisions :(1) Smugglers and militants including radical Islamists are unitedly playing a vital role in
cattle smuggling from India to Bangladesh.(2) Militants, disguised as a smugglers, enter into India from across the border. (3) Major political parties openly appease Muslim to keep their vote-bank intact, and to
get due share from smuggling. (4) Rivalry between political parties to control smuggling often create social tension and
enmity resulting in incidents of murder and other forms of serious crime. (5) New dimensions of women trafficking have been unearthed. Girls and young widows
are coming from Bangladesh to be sent to the brothers of Maharashtra and Gujarat. (6) Hindus are gradually being wiped out from the border villages. Smugglers as well as
locally influential persons are purchasing their properties.
(7) Local administration is controlled by smugglers in most of the class. The BSF isfacing difficulties to tackle the problem of infiltration and smuggling because of (a)the language problem, (b) protection of infiltrators and smugglers by Panchayets.
(8) Unusually large Muslim infiltration from Bangladesh actually started from 1980onwards. Most of them have come into India counting upon the help of their relativesin the district, or expecting other local support. They have acquired ration cards,enlisted their names in voters’ list, and even managed to get citizenship orinternational passport through local patrons.
(9) A large number of local youths in the district have established family ties with theBangladeshi people by marrying Bangladeshi girls, specially in the border region.These marital of family relations are often used to serve many purposes. A permanentsupport base and shelter has been created in either side of the border for cross-border
movements. (10) Criminals of either side of the border are unitedly working of push out the Hindus
from the border region. (11) Big landholders and brick-field owners always engage cheap Bangladeshi labourers,
depriving locals. It is a common phenomenon in the border region of this district. Noorganized movement has yet been launched against this practice because majorpolitical parties are its beneficiaries. If any individual or group raise the voice againstit, he or they are punished by the musclemen. The dissenters may even be killed. As aresult, a large number of local labourers migrate to other districts or States every year

8/8/2019 Demography Bimal
http://slidepdf.com/reader/full/demography-bimal 59/93
for their livelihood, and relation between the locals and outsiders has been becomingsour day by day.
(12) Smuggling has been taken up as a major employment source by a large number of people in the border region. Police, BSF and others get due shares on a regular basis.
(13) Islamic fundamentalists are preaching in the mosques and madrassahs that the land of India owned by Akbar, Shajahan, Serajuddoula, etc. belongs to Muslims, Hindus
occupied it through British help. Now the task of Muslims is to dethrone and demolishHindu power.
(14) A clear trend of Hindu migration from the Domkal subdivision is observed. (15) Criminals and smugglers have been elected in the last Panchayat election in this
subdivision (Domkal). The common people had to support them because, otherwise,their security and livelihood would be threatened.
(16) Police overlooks criminal activities supported by the ruling parties. (17) Private Madrassahs and Mokatabs are mushrooming in the border areas of Domkal
subdivision. Some of them are directly involved in the radical Islamic movement andmilitant activities.
(18) Cows and buffaloes are slaughtered in the open market as ‘hat’ sites all over theDomkal sub-division. Hindus are shaken by the aggressiveness of Muslim
communalism. (19) Fake Indian currencies are disturbed in the border markets by Bangladeshi and local
operators. International Hoondi (Hawala gang) operators are also active in this area. (20) Kidnapping of Hindu girls by Muslim youths, and smuggling them out to Bangladesh
is a common phenomenon in this area.
District : Nadia
Nadia is situated on both the eastern and western side of the Hooghly river as its southward journey to the Bay of Bengal. In 1947, Nadia was partitioned and one of its sub-divisions,Kushtia, was included in East Pakistan. The entire eastern side of the district is now borderingBangladesh. Nadia is also known all over the country and abroad for the birth place of Sri
Chaitanya, one of the foremost religious reformers of the country in the fifteenth century. Now,Mayapur, the birth place of Sri Chaitanya, is famous for the IKSKON Headquarters.
Nadia is basically an agricultural district. A continuously high growth of population hasoccurred during the last five decades due to huge immigration from across the border. AfterPartition, a large number of Hindu refugees from East Pakistan immigrated to this district, andthis is still continuing in spite of Bangladesh becoming independent in 1971. At the same time,continuous Muslim infiltration has been going on during the last five decades (1951-2001). Evenmost of those Muslims who had migrated to Pakistan after 1947 came back and settled in thedistrict. During 1951-1961, in spite of a massive Hindu refugee settlement, Muslim populationgrowth rate (63.16%) surpassed the GRP of Hindus (45.61%). The post-1971 growth rates of population are also interesting. The growth rate of Muslim population has been continuouslyhigher than that of Hindu population in this district, viz., 37.11%, 34.50% and 21.90% of
Muslims as against 31.67%, 28.47% and 18.58% of Hindus respectively during the last threedecades (1971-2001). GRP of Muslims was 357% during the last fifty years (1951-2001), asagainst 285% for Hindus and their share rose from 22.36% in 1951 to 25.41% in 2001.
Decade-wise population shares and the growth rates on the basis of religion during 1951-2001are shown in the chart nos. 37 & 38.

8/8/2019 Demography Bimal
http://slidepdf.com/reader/full/demography-bimal 60/93
Table 8. Population by religion in the Blocks of the district of Nadia, 1981 and 1991
Sl.No.
Name of Block Name of Religion
1981 1991 Growth Rate
1 & 2 Karimpur-1Karimpur-2
(a) Hindus(b) Muslims
142783 (58.59)100621 (41.29)
173914 (56.65)132729 (43.24)
21.8131.91
3 & 4 Tehatta-1Tehatta-2
(a) Hindus(b) Muslims
155683 (65.32)79842 (33.50)
184404 (61.30)112758 (37.48)
18.4541.23
5 Kaliganj (a) Hindus(b) Muslims
96263 (50.18)95550 (49.81)
114507 (47.96)124226 (52.03)
18.9630.02
6 Nakashipara (a) Hindus(b) Muslims
108086 (52.23)98680 (47.68)
138963 (50.93)133768 (49.02)
28.5735.56
7 Chapra (a) Hindus(b) Muslims(c) Christians
77805 (43.29)94942 (52.83)6975 (3.88)
68347 (29.82)152072 (66.34)8633 (3.77)
12.1660.18
8 Krishnaganj (a) Hindus(b) Muslims
86688 (95.20)4308 (4.73)
106929 (94.73)5903 (5.23)
23.3537.03
9 & 10 Krishnanagar-1Krishnanagar-2
(a) Hindus(b) Muslims
189958 (77.06)55773 (22.63)
255189 (77.32)73365 (22.23)
34.3431.55
11 Nabadwip (a) Hindus(b) Muslims
55343 (67.50)26652 (32.50)
69549 (66.53)34961 (33.45)
25.6731.18
12 Santipur (a) Hindus(b) Muslims
101712 (87.29)14467 (12.41)
148766 (88.61)18608 (11.08)
46.2728.63
13 Hanskhali (a) Hindus(b) Muslims
139653 (88.48)18138 (11.49)
191523 (88.55)24705 (11.42)
37.1536.21
14 &15
Ranaghat-1Ranaghat-2
(a) Hindus(b) Muslims(c) Christians
311850 (89.70)31017 (8.92)4672 (1.35)
438924 (93.50)24349 (5.19)5804 (1.24)
40.7521.50
16 Chakdaha (a) Hindus(b) Muslims
160040 (83.39)31559 (16.44)
257794 (84.94)44514 (14.67)
61.0041.05
17 Haringhata (a) Hindus(b) Muslims
99597 (73.48)35817 (26.42)
130125 (73.19)47284 (26.60)
30.6632.02
(Percentage of population share shown in parentheses)
Source : District Statistical Handbook, 2002, Nadia, Bureau of Applied Economics and Statistics, Government of WestBengal
Micro-level population growth, religion-wise, gives us a revealing picture of influx of bothMuslims and Hindus from Bangladesh. All the 17 CD-Blocks of the district have an inordinatelyhigh growth rate of Muslim population during the 1981-91 census period. On the other hand,Krishnanagar 1 & II, Santipur, Hanskhali, Ranaghat I & II and Chakdaha witnessed anenormously high rate of growth of Hindu population during the same period. Special mentionmay be made of Chapra and Chakdaha because of the very high growth rates (more than 60%) of Muslim and Hindu population respectively. It is interesting to note that growth rate of Muslims isremarkably high even in some Hindu majority Blocks (e.g., Chakdaha, Hanskhali, Tehatta, etc.)

8/8/2019 Demography Bimal
http://slidepdf.com/reader/full/demography-bimal 61/93
But in case of Chapra, the share of Muslim population jumped from 52.83% to 66.34% within adecade (1981-91). On the other hand, Hindu population came down from 43.29% to 29.82%during the same period. Actually, Hindu population decreased from 77805 to 68347, which was aclear indication of Hindu migration. It may be mentioned that the Chapra Block is borderingBangladesh. It is observed that a sizeable number of Hindu families have deserted their ancestralplaces in the border Blocks of the districts, particularly from zones of Muslim concentration,
during the last three decades.
Infiltration unabated
Nadia has also a long international border with Bangladesh. Tehatta, Sadar (Krishnagar) andRanaghat are the border subdivisions of the district. Cross-border movement / infiltration andillegal trade (including cattle smuggling) are the major activities in this district vis-à-visBangladesh. Most of the border areas are plain agricultural lands and a small part is riverine. Thisis ideal for smuggling activities and illegal immigration/infiltration. Majdia—Darshana rail link isthe only legal Indo-Bangladesh communication route in the district. It is also an old and famoussmuggling route. A list of some illegal trade and communication routes with Bangladesh is givenbelow to underline the ground realities.
India BangladeshShikarpur PragpurKacharipara, Madhugari, Nasirerpara Mahiskundi
Gopalpur, Madhubona Bangmari
Mathurapur Gangnabazar
Fulbari Godigaelsa Roypur
Kacharipara, Meghna Jamalpur
Madhugari (Waterways) Mohammadpur/Charpara
Sarkerpara (Waterways) CharparaBausmari Bagmari
A long stretch of border is still open. Barbed-wire fencing completed so far has covered moreor less 50% of the area. It is very difficult for the BSF alone to control cross-border movementand smuggling. For, a large number of people are associated with smuggling, and the localadministration (police), Pachayets as well as political activists are party to it. The role of administration in maintaining law and order is awful. Cross-border immigration to this district isprimarily permanent in nature. Hindu immigrants are mostly settled in the area of Chakdaha,Ranaghat I & II and Santipur blocks away from the Bangladesh border. But Muslim immigrantsmostly have preferred to settle in the border Blocks like Karimpur I & II, Tehatta I & II, Chapta,Krishnogonj, etc. It is also observed, fro the pattern of population growth rate during 1981-1991,that Muslims tried to settle all over the district.
Crime and Punishment :
Table 9(a) : No. of offences reported during the last five years (1997-2001)Class of offence Year
1997 1998 1999 2000 2001
Murder 70 75 72 102 124Dacoity 11 11 6 19 28
Robbery 22 6 10 24 23
Burglary 32 19 20 14 10Rioting 304 303 272 209 227

8/8/2019 Demography Bimal
http://slidepdf.com/reader/full/demography-bimal 62/93
Theft 723 688 542 535 678
Minor offences 63 788 376 616 353
Offences against woman 620 562 596 579 609
Others 1272 2367 2100 2149 2425Total 3117 4819 3994 4247 4477
Table 9(b) : No. of cases tried during the last five years (1997-2001)
Class of offence Year
1997 1998 1999 2000 2001
Murder 22 72 97 10 43Dacoity 2 12 18 10 1
Robbery — 7 2 — 3Burglary — 1 9 — 1
Rioting 55 306 21 39 7
Theft 13 154 21 7 19
Minor offences 4 1115 102 764 60
Offences against woman 152 87 112 14 162Others 123 1048 507 126 305
Total 371 2802 889 970 601
Table 9(c) : No. of persons convicted during the last five years (1997-2001)
Class of offence Year
1997 1998 1999 2000 2001
Murder 5 12 4 10 4Dacoity — — — 10 4
Robbery — — 1 — —
Burglary — — — — —
Rioting 1 15 2 39 —Theft — 1 2 7 —
Minor offences — 154 100 764 —
Offences against woman 8 27 37 14 10
Others — 21 49 126 6
Total 14 230 195 970 24
Table 9(d): No. of persons acquitted during the last five years (1997-2001)
Class of offence Year
1997 1998 1999 2000 2001
Murder 17 89 93 26 185
Dacoity 2 4 18 3 —Robbery — — 1 17 —
Burglary — — 9 — 2Rioting 54 312 19 30 8
Theft 13 19 19 37 13
Minor offences 4 989 2 — 67Offences against woman 189 153 229 29 83
Others 123 896 458 507 151

8/8/2019 Demography Bimal
http://slidepdf.com/reader/full/demography-bimal 63/93
Total 402 2462 848 649 509
Source : District Statistical Handbook, 2002, Nadia, Bureau of Applied Economics and Statistics, Government of WestBengal
It appears from the above tables that, during 1997-2001, the number of offences related to
serious crimes like murder, dacoity, robbery reported to Police Stations is 603, and the number of persons convicted is 50. If we consider the overall crime picture of the district, we shall see thatthe total number of offences reported to various Police Stations is 20654, the number of casestried is 5633, the number of persons convicted is 1433. It is a gloomy picture of law and justice inthe district. The record of securing justice in crimes on women in the district is very bad. Thetotal number of reported offences against women is 2966, but persons convicted during the periodare only 96.
It is quite clear from the above tables that the necessary administrative measures adopted bythe concerned authorities are rather negligible by any standard.
Table 10 : Relation among the different communities in the district of Nadia in the eye of thepeople
(a) before 1971 (b) after 1971Relations 1 2 3 4 1 2 3 4
(a) 20 5 4 2 5
(b) 6 2 26 10 20 3© 4 23 1 18 3 4 19(d) 1 1 27 26
Total No. of respondents = 311. Hindu-Muslim a. good,2. Local-outsider, b. normal,3. Bengali-Rajbanshi, c. bad,4. Tribal-Non-tribal d. worse
The Above mentioned respondents were selected from different socio-economic strata acrossthe district (e.g. professionals, government employees, political personalities, teachers,businessmen etc.)
It is seen from the above table that the Hindu-Muslim relation in India was good before 1971,according to 20 respondents. But after 1971, the relation has deteriorated. Atrocities on minoritiesin Bangladesh during the liberation war in 1971 as well as the post-Mujib period, i.e. from 1975onwards, has compelled the Hindu minorities to migrate from Bangladesh to India. BangladeshiMuslim infiltration in the district has irritated the local Hindus of whom a good number areformer refugees from East Pakistan. When Bangladesh declared Islam as their state religion, thesituation was further aggravated. It is now very difficult for Hindu refugees to tolerate alienMuslims in their newly built hearth and home. This is the main reason for deterioration in the
relation between Hindus and Muslims after 1971. It is important to mention that a large numberof refugee population has settled in the different regions of this district since 1947. Secondly, therelation between local Muslims and Hindus refugee has turned from bad to worse in the transitionfrom the pre-1971 to the post-1971 period. Local-outsider relation deteriorated further. All thiscan be explained in the context of Partition. I think, the Partition hangover is still working in themind of the Hindus and Muslims, immigrants or not. Tribal-non-tribal relation may also beexplained in this context.
An important micro-level observation, based on a number of incidents is that the Islamicfundamentalist forces operating in Bangladesh as well as in India are encouraging Muslim
8/8/2019 Demography Bimal
http://slidepdf.com/reader/full/demography-bimal 64/93
infiltration to reduce pressure of population on Bangladesh, and to expand Islamic influence inthe border region so that the Hindu population living in this area is forced to leave the region outof fear, particularly in the case of Tehatta Sub-division. They are selling their hearth and home atthrow away prices to the Muslims. It becomes easy, since the district is contiguous toMurshidabad as well as Bangladesh.
Over and above, the anti-social elements of this border region, hand-in-glove with
Bangladeshi Muslims, are creating a fear psychosis among the Hindu community. Theft, dacoity,rape and murder of the Hindus are routinely performed. The administrative machinery remains asilent spectator. Consequently, internal security and social harmony are in peril.
The mosques, madrassas, maktabs have become the centers of militants and anti-Indianactivities. The police administration has become a stooge to the ruling party, and seldom acts. TheHindus are feeling that they have become aliens in their own country. They are afraid that theymay become refugees again. The entire area seems to be under the control of a foreign agencylike the ISI. The BSF and the customs officials have become puppets to the smugglers. Thecriminals are roaming freely in this area with fake currency and illegal arms. These criminals alsoplayed a great role in helping local leaders to capture the Panchayet in the last election. The directfallout of this situation is that the party in power does not dare to disturb them for fear of losingpower.
To make our border safe and secure, barbed wire fencing is absolutely necessary. Thewaterways should be closely guarded, and the BSF should be properly trained and motivated inthis respect by infusing a sense of nationalism among them. Otherwise, the situation in this regionwill be worse than in Kashmir.
District : 24-Parganas
North 24-Parganas is the second largest district of India and West Bengal in terms of population. It is situated on the northern flank of Kolkata, and on the eastern bank of the Hooghlyriver. It is a very important district in terms of industry, trade and commerce. North 24-Parganasis also bordering Bangladesh. Before 1981, North 24-Pargnanas was part of undivided 24-Parganas. The vast post-Partition Hindu refugee inflow from East Pakistan to 24-Parganas had
increased its population remarkably. During the last five decades (1951-2001), a continuouslyhigh growth rate of Hindu population in this district is clearly observed. (Growth rates of population in 1951-1961 and 1961-1971 are based on undivided 23-Parganas data). On the otherhand, a high growth rate of Muslim population during the last five decades has also been evident.The 1981-1991 decade witnessed a massive growth rate of Muslim population, viz. 41.47%. Thisobviously is due to Muslims infiltration from Bangladesh. Consequently, the share of Muslimpopulation rose from 22.43% (1971) to 24.22% (2001) within three decades, in spite of a massiveHindu immigration from Bangladesh during the same period. It will be more revealing if we gothrough the Block-level demographic changes. It needs a special mention that a large number of Muslims who had migrated to East Pakistan after Partition came back to this district not onlyduring 1951-1971 but also after 1971, and this remains a persistent trend till today. Anotherimportant feature that needs mention in this connection is the continuous in-flow of Urdu-
speaking Muslims from Bangladesh after 1971.Decade-wise population shares and the growth rates on the basis of religion during 1951-2001
are shown in the chart nos. 39 & 40.

8/8/2019 Demography Bimal
http://slidepdf.com/reader/full/demography-bimal 65/93
Table 11. Population by religion in the Blocks of the district of North 24-Parganas, 1981 and1991
Sl.No.
Name of Block Name of Religion
1981 1991 Growth Rate
1 Bagdah (a) Hindus(b) Muslims
116584 (82.1)25011 (17.61)
159309 (83.51)30969 (16.24)
36.6523.83
2 Bongaon (a) Hindus(b) Muslims
182693 (79.7)45845 (20.09)
235538 (80.0)58119 (19.74)
28.9326.78
3 Gaighata (a) Hindus(b) Muslims
179251 (93.31)12247 (6.38)
246463 (93.43)16160 (6.28)
37.5031.95
4 & 5 Habra-1Habra-2
(a) Hindus(b) Muslims
139318 (74.0)48089 (25.55)
180690 (63.80)101571 (35.84)
29.70111.22
6 & 7 Barasat-1Barasat-2
(a) Hindus(b) Muslims
188149 (49.61)191025 (50.37)
289932 (59.25)198458 (40.56)
54.103.90
8 Amdanga (a) Hindus(b) Muslims
62898 (36.4)109691 (63.53)
63545 (45.72)75360 (54.21)
1.03-31.30
9 Deganga (a) Hindus(b) Muslims
62898 (36.4)109691 (63.53)
74819 (31.96)159109 (67.65)
18.9645.06
10 Rajarhat (a) Hindus(b) Muslims
104432 (63.99)58298 (35.82)
214970 (75.15)69588 (24.33)
105.8519.37
11 &12
Barackpore-1Barackpore-2
(a) Hindus(b) Muslims
247402 (77.52)67447 (21.14)
398880 (86.10)61462 (13.27)
61.238.88
13 Baduria (a) Hindus(b) Muslims
63263 (39.90)95202 (60.08)
80693 (38.18)130634 (61.81)
27.5637.22
14 Haroa (a) Hindus(b) Muslims
72291 (53.87)61852 (46.13)
78072 (51.67)73029 (48.33)
8.0018.07
15 Minakhan (a) Hindus(b) Muslims
35099 (45.80)41422 (54.10)
60332 (43.62)76169 (55.45)
71.8983.89
16 Swarupnagar (a) Hindus(b) Muslims
89374 (57.64)65668 (42.35)
112851 (56.30)87597 (43.70)
26.2733.40
17 Hasnabad (a) Hindus(b) Muslims
83096 (61.79)51496 (38.24)
67787 (44.80)83328 (55.14)
-19.0061.82
18 Hingalgonj (a) Hindus(b) Muslims
90128 (86.00)14671 (14.00)
120180 (84.46)22111 (15.54)
33.3550.72
19 &20
Sandeskhali-1Sandeskhali-2
(a) Hindus(b) Muslims
154989 (81.02)35573 (18.60)
187572 (78.34)51862 (21.66)
21.0345.79
21 &
22
Basirhat-1
Basirhat-2
(a) Hindus
(b) Muslims
96084 (45.06)
117172 (54.95)
98619 (34.46)
187528 (65.54)
2.64
60.05
(Percentage of population share shown in parentheses)
Source : District Statistical Handbook, 2002, North 24-Parganas, Bureau of Applied Economics and Statistics,Government of West Bengal
Block-level population growth, religion-wise, gives us a revealing picture regarding thegrowth of Muslim population in different Blocks of the district. In all the rural Blocks, exceptfour, Muslim population growth rate is significantly higher than that of Hindus, particularly in the

8/8/2019 Demography Bimal
http://slidepdf.com/reader/full/demography-bimal 66/93
region or Blocks bordering Bangladesh, viz. Basirhat I & II, Hasnabad, Hingalgonj, SandeshkhaliI & II, Swarupnagar, Minakhan, Baduria, Habra I & II and Deganga,, which have witnessed amassive growth of Muslim population. On the other hand, there is a decline of Muslimpopulation. On the other hand, there is a decline of Muslim population in the newly developedurban zones like Barasat I & II (district headquarter), Rajarhat and Barrackpore I & II Blockswhere a massive growth of Hindu population has taken place. Fast growing middleclass (both
upper and lower) Hindus are rushing to these areas, including a good number of BangladeshiHindu immigrants. It is noteworthy that massive infiltration from Bangladesh (of both Hindus andMuslims) has increased the population of this district significantly since 1971.
Infiltration Unabated
North 24 Parganas has a long international border. Basirhat and Bongaon subdivisions arebordering Bangladesh. Cross-border infiltration and smuggling, including cattle smuggling, trans-border crimes, etc. are the major illegal activities in this area vis-à-vis Bangladesh. Two bordercheck-posts (one international) for trade and passengers are also situated in this district atPetrapole (Bongaon) and Ghojadanga. Most of the border region is plain land. Cross-bordermovement is very easy for smugglers and infiltrators. It is very difficult for the BSF to control
cross-border movement and smuggling. A large segment of border population is associated withthis illegal trade and other unlawful activities. Local administration (Panchayet, police), as well aslocal political forces are entangled in these activities.
A List of some major illegal trade and communications routes with Bangladesh is given belowto portray the ground situation.
India Bangladesh(a) Hingolgonj Kaligonj District :
(b) Hasnabad Debhata Satkhira(c) Taki Debhata
(d) Basirhat Satkhira
(e) Ghojadanga Bhomra
(f) Srarupnagar Kalarowa(g) Hakimpur Do
(h) Maslandapur Do
(i) Bongaon Benapole Jessore(j) Boira Sarsa
(k) Bagdah Chougacha(l) Dattaphulia Chougachha
Transborder crime : a long term nefarious design :
Transborder crime in the district is a major problem. All types of criminal activities, including
murder, dacoity, cattle lifting, kidnapping, offences against women, smuggling, etc. are seen tooccur in the entire border region of Basirhat, Bangaon and Barasat Subdivisions. The life in aborder village is chaotic, to say the least. It is extremely unhealthy in terms of law and order. Theentire border area is the abode of transborder crimes. The border areas are the perennial targets of,for example, illegal transborder movements of people, theft and smuggling of cows, othercontraband articles (supplied to and from Bangladesh), robbery by Bangladeshi intruders, womentrafficking, etc.
In any Muslim dominated village, Hindus live in a state of virtual subjugation. Many of suchHindus, called Sarbahara, had previously been driven out of their own homes from Bangladesh.

8/8/2019 Demography Bimal
http://slidepdf.com/reader/full/demography-bimal 67/93
These ill-fated Hindus settled in the border villages of West Bengal and accepted India as theirown country. How they are on the verge of being driven out, for the second time, from their newsettlement, and compelled to move elsewhere, away from the border. Many have alreadyabandoned their new homes. The Hindu families in the border areas are subjected to frequentharassment by the Bangladeshi Muslim intruders who work hand in glove with a section of localMuslims and others. Theft of cows, robbery, assault on women in the Hindu families by the
Muslim miscreants, are regular features in the border villages. On the other hand, the forcefulimposition of the Muslim culture—the Muslim way of life in these border villages—has forcedthe Hindu families to feel alienated in the society. To understand the ground realities and role of the administration (police, etc.), we can take the gauge of criminal offences recorded in the policestations of the district being 1997-2001. Though a large number of cases were not recorded in thepolice stations because of political interference, the available record is alarming enough.
Table 12(a) : No. of offences reported during the last five years (1997-2001)
Class of offence Year
1997 1998 1999 2000 2001
Murder 184 230 219 245 202
Dacoity 34 37 40 26 14
Robbery 74 65 83 79 56Burglary 108 58 49 51 46Rioting 628 674 505 357 785
Theft 2314 2222 2197 2115 1679
Minor offences 4325 1452 1237 1757 864
Offences against woman — — 905 842 667
Others — 4861 3064 3616 2718
Total 7667 9599 8299 9088 7031
Table 12(b) : No. of cases tried during the last five years (1997-2001)
Class of offence Year
1997 1998 1999 2000 2001
Murder — 31 51 125 200
Dacoity — 5 2 16 14Robbery — 13 3 40 26
Burglary — 13 11 12 12
Rioting — 393 31 264 284Theft — 164 125 183 160
Minor offences — 1447 511 1408 754Offences against woman — — 732 807 608
Others — 1959 516 3233 2540
Total — 4025 1982 6088 4598

8/8/2019 Demography Bimal
http://slidepdf.com/reader/full/demography-bimal 68/93
Table 12(c) : No. of persons convicted during the last five years (1997-2001)
Class of offence Year
1997 1998 1999 2000 2001Murder — — — — 10
Dacoity — — — — —
Robbery — — — — 3
Burglary — — 2 — 4
Rioting — 6 — — 4Theft — 1 4 2 36
Minor offences — 356 261 15 296
Offences against woman — — — 10 90
Others — 23 152 22 151
Total — 386 419 49 594
Table 12(d): No. of persons acquitted during the last five years (1997-2001)
Class of offence Year
1997 1998 1999 2000 2001
Murder — 2 3 — 5
Dacoity — — 2 — —
Robbery — 3 3 — 10Burglary — 4 9 — 10
Rioting — 146 31 — 67
Theft — 49 121 15 128Minor offences — 44 481 62 336
Offences against woman — — 201 65 109Others — 158 364 73 332
Total — 406 1215 215 997
Source : District Statistical Handbook, 2002, North 24-Parganas, Bureau of Applied Economics and Statistics,Government of West Bengal, pp. 174-177.
From the above tables on 1997-2001, it is seen that the number of offences relating to seriouscrimes like murder, dacoity, robbery were reported to be respectively 1080, 151 and 347, and thenumber of persons convicted during this period were only 13. The number of reported offencesagainst women were 2414 during 1999-2001 (3 years), but persons convicted were only 100during the same period. During this five-year period, the total number of offences recorded in
various police stations was 41684, and persons convicted 1408 only.It is clear from the above statistics that necessary administrative and judicial measureslaunched by the concerned authorities are negligible by any standard.
Table 13 : Relation among the different communities in the district of North 24-Parganas in theeye of the people
(a) before 1971 (b) after 1971
Relations 1 2 3 4 1 2 3 4(a) 16 4 4 4 4 2 — 2

8/8/2019 Demography Bimal
http://slidepdf.com/reader/full/demography-bimal 69/93
(b) 17 10 5 4 20 5 3 2(c) 19 3 — 1 27 3 2 3(d) — — — — 2 2 — —
Total No. of respondents = 551. Hindu-Muslim a. good,
2. Local-outsider, b. normal,3. Bengali-Rajbanshi, c. bad,4. Tribal-Non-tribal d. worse
It is seen from the primary data that 55 respondents have expressed their opinions. These havebeen gathered from people belonging to different walks of life. They have spoken about relationamount the different communities in the district before and after 1971. Hindu-Muslim relation inWest Bengal always gets importance because of their relative population strength and historicallegacy. More than one third (19) of the total respondents (55) have opined that it was bad before1971, but 16 and 17 respondents have expressed their opinion in favor of good and moderatelygood relations respectively. Thus, Hindu-Muslim relation was not quite good before 1971. Butafter 1971, 27 respondents (i.e. half) have opined that it is bad, though 20 rate this relation to be
moderately good. But only 4 are in favor of ‘good’, compared to 16 before 1971. It can be saidfrom the above opinion survey that Hindu-Muslim relation deteriorated further after 1971. Post-1971 atrocities on minorities in Bangladesh and Hindu immigration from Bangladesh into Indiaare the major causes of deteriorating Hindu-Muslim relations in the district. Declaration of Islamas state religion in Bangladesh is also a major factor for worsening relation. On the other hand,local-outsider relations improved after 1971, i.e. the Hindu community was welcoming Hinduimmigrants, and the Muslim community was welcoming Muslim immigrants in their respectivelocalities.

8/8/2019 Demography Bimal
http://slidepdf.com/reader/full/demography-bimal 70/93
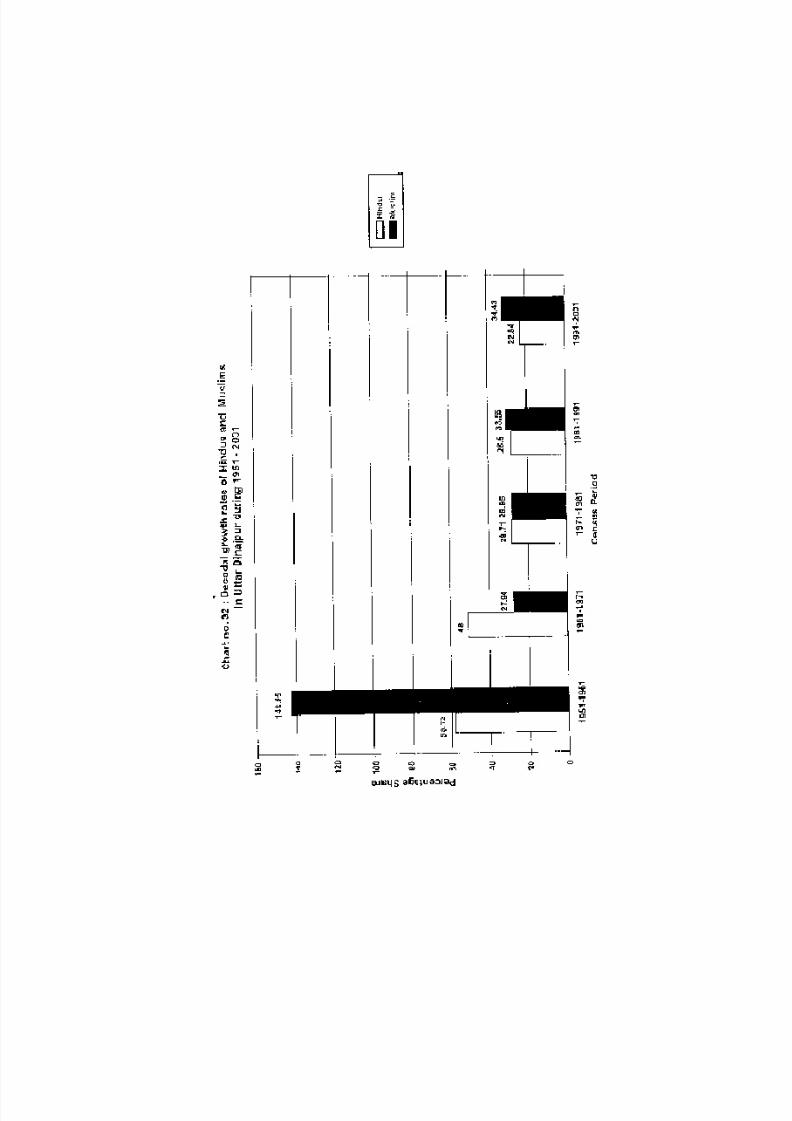
8/8/2019 Demography Bimal
http://slidepdf.com/reader/full/demography-bimal 71/93
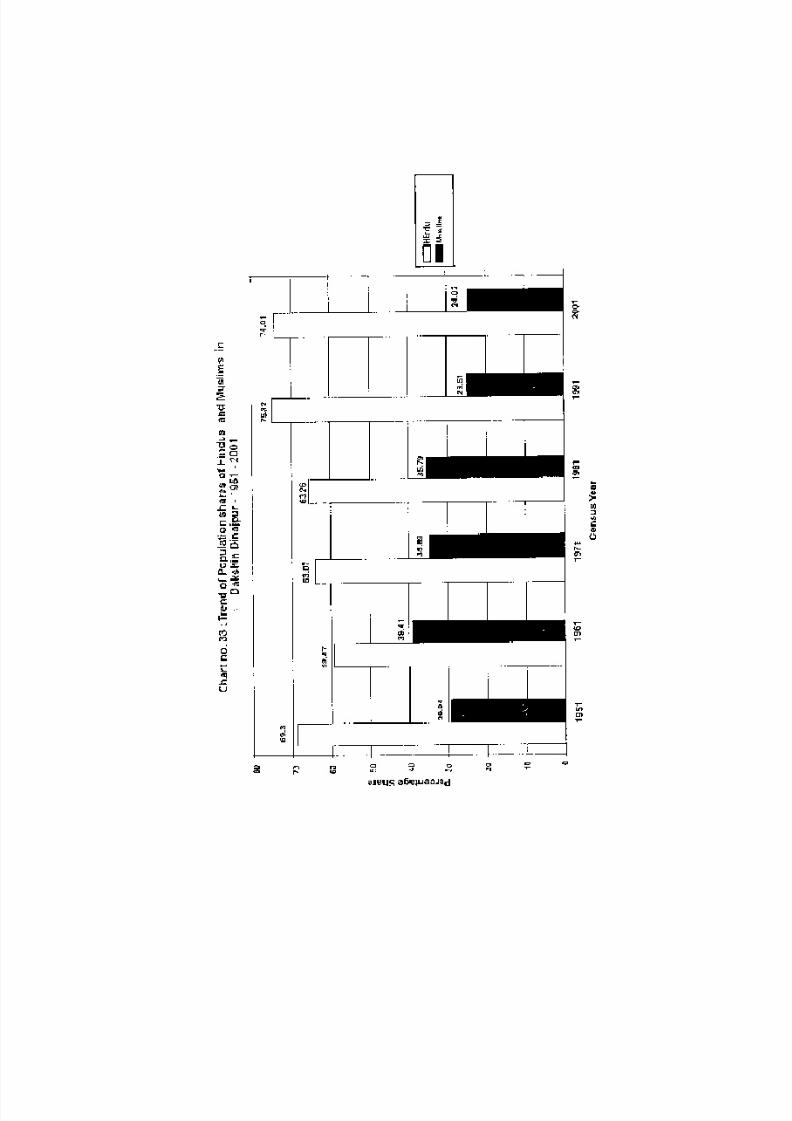
8/8/2019 Demography Bimal
http://slidepdf.com/reader/full/demography-bimal 72/93

8/8/2019 Demography Bimal
http://slidepdf.com/reader/full/demography-bimal 73/93

8/8/2019 Demography Bimal
http://slidepdf.com/reader/full/demography-bimal 74/93

8/8/2019 Demography Bimal
http://slidepdf.com/reader/full/demography-bimal 75/93

8/8/2019 Demography Bimal
http://slidepdf.com/reader/full/demography-bimal 76/93

8/8/2019 Demography Bimal
http://slidepdf.com/reader/full/demography-bimal 77/93

8/8/2019 Demography Bimal
http://slidepdf.com/reader/full/demography-bimal 78/93
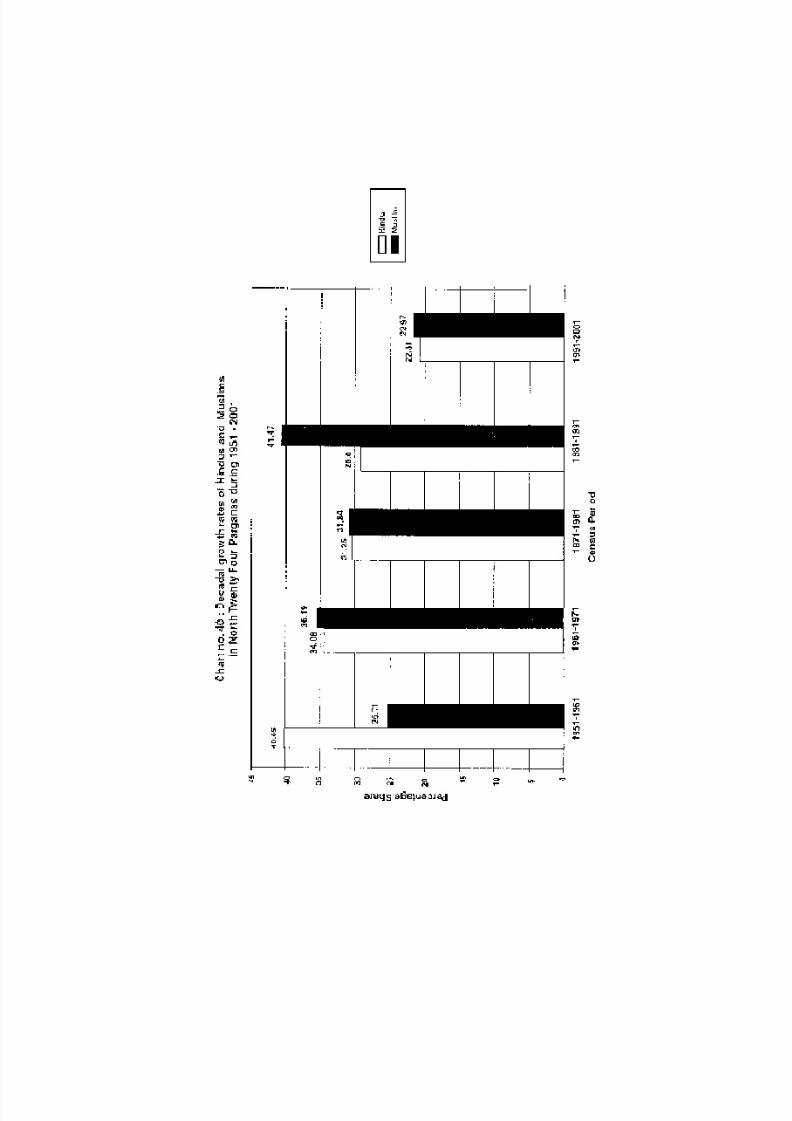
8/8/2019 Demography Bimal
http://slidepdf.com/reader/full/demography-bimal 79/93
8/8/2019 Demography Bimal
http://slidepdf.com/reader/full/demography-bimal 80/93
Conclusion
The above noted facts and the attendant analyses make it quite clear that, on account of ceaseless infiltration from Bangladesh and East Pakistan, and the tremendously high rate of growth of Muslim population, West Bengal, with 904 persons per square kilometer, has emergedas the State having the highest density of population in the whole of India. West Bengal occupies2.77% of India’s land area and accommodates more than eight percent of its population.Population control is universally recognized today as a key contributor to economic upliftment. Apertinent query is whether the excessively high rate of growth of Muslim population in all thedistricts of West Bengal is solely due to infiltration by Bangladeshis. Alternatively, one can ask whether it is permissible to affirm that Muslims in West Bengal are far less concerned about birthcontrol, and far more backward in family planning than Hindus in West Bengal. If we considerthe family planning scenario in the State, we can conclude that both the factors have been
responsible for this abnormally high growth rate of Muslims in West Bengal.There is another side of this story, which is no less disturbing and no less dangerous. This
ceaseless increase of population through infiltration and other means assumes a new dimensionwhen it slowly and steadily takes the shape of a sort of demographic invasion. The consequentsocio-political disturbances can possibly destabilize the entire Eastern and North-Eastern regionof India. Even if this is treated as ‘distress infiltration’ or ‘economic immigration’, it finally turnsout to be volcanic enough to bring about the disintegration of the country. Added to it, anincessant cross-border immigration from Bangladesh deep into the regions bordering the Indianside, along with large scale cross-border smuggling have created a political climate highlyfavorable to the growth of an anti-Indian psyche. This is inevitable, following a tremendoustransformation of the demographic composition of the society from Koch Bihar, to the southerntrip of South 24-Parganas. Consequently, the prevailing practice and conditions of living of the
people on the Indian side are becoming uncertain. The political and administrative securityarrangements of the border region are so hopelessly threatened as to become ineffectual.
Besides, both sides of the border are inhabited by a population which is ethnically,linguistically and religiously identical. It has thus become easy for the insurgent outfits to wage aproxy war at a low level. The costs and risks of this war are low, and yet it destabilizes thesecurity of eastern and north-eastern India.
Last but not the least, it is a matter of vital concern that the Union and the State Governmentsmay or may not share fully the perspective portrayed above and/or adopt necessary measures tosafeguard national security. As a result, alien socio-political forces can consolidate their positionat the social and popular level, and gather more and more courage to accelerate their activities.Gradually, and ominously, this can foster the evolution of a pattern of social living alien to theIndian ethos nurtured through centuries of foreign rule and also the decades following 1947.

8/8/2019 Demography Bimal
http://slidepdf.com/reader/full/demography-bimal 81/93
Annexure – 1
Religion-wise share of 0-6 Population in West Bengal and Districts
Sl.No.
State/Districts Religiouscommunities
0-6 Population % of 0-6Population by
religion
Share of 0-6Population
by Religiouscommunities
1. West Bengal All ReligiousHinduMuslimChristian
1141422273750233785900
69274
12.2412.6918.7013.45
10064.6133.170.61
2. Darjeeling All ReligiousHinduMuslim
ChristianBuddhist
20464315591016910
1281617819
12.7212.6019.81
12.9210.05
10076.198.26
6.268.71
3. Jalpaiguri All ReligiousHinduMuslimChristian
5212874193617200923011
15.3314.8019.5015.58
10080.4513.814.41
4. Koch Bihar All ReligiousHinduMuslim
387130270279116063
15.6214.4419.31
10069.8229.98
5. Uttar Dinajpur All ReligiousHinduMuslim
513266221654287071
21.0217.5524.82
10043.1955.93
6. Dakshin Dinajpur All ReligiousHinduMuslim
24603417074269756
16.3715.3519.32
10069.4028.35
7. Malda All ReligiousHinduMuslim
6399.4275197358876
19.4516.9721.93
10043.056.08
8. Murshidabad All ReligiousHinduMuslim
1044534306550733968
17.8014.5519.65
10029.3570.27
9. Birbhum All ReligiousHinduMuslim
488193285205200904
16.1914.6718.99
10058.4241.15
10. Bardhaman All ReligiousHinduMuslim
903438677889213405
13.1012.4615.64
10075.0323.62
11. Nadia All ReligiousHinduMuslim
606395404503197386
13.1711.9116.87
10066.7132.55
12. North 24 Pgs All ReligiousHinduMuslim
1054338690821358574
11.8010.2816.57
10065.5234.0

8/8/2019 Demography Bimal
http://slidepdf.com/reader/full/demography-bimal 82/93
13. Hugli All ReligiousHinduMuslim
603258476215117839
11.9611.2915.43
10078.9419.53
Sl.No.
State/Districts Religiouscommunities
0-6 Population % of 0-6Population by
religion
Share of 0-6Population
by Religiouscommunities
14. Bankura All ReligiousHinduMuslim
45888237535346322
14.3713.9419.32
10081.8010.09
15. Purulia All ReligiousHinduMuslim
40880333366037853
16.1215.7720.95
10081.629.26
16. Medinipur All ReligiousHinduMuslim
13804971123118211994
14.3613.6619.47
10081.3615.36
17. Howrah All Religious
HinduMuslim
513218
332610177965
12.01
10.3817.04
100
64.8134.68
18. Kolkata All ReligiousHinduMuslim
390282274129108534
8.537.7211.71
10070.2427.81
19. South 24-Pgs. All ReligiousHinduMuslim
1050120581827460471
15.2012.7920.06
10055.4143.85
Annexure – 2
Nehru-Liaquat Agreement
A. The Government of India and Pakistan solemnly agree that each shall ensure to theminorities throughout its territory, complete equality of citizenship, irrespective of religion,a full sense of security in respect of life, culture, property and personal honour, freedom of movement within each country and freedom of occupation, speech and worship, subject tolaw and morality. Members of the minorities shall have equal opportunity with members of the majority community to participate in the public life of their country to hold political orother office, and to serve in their country’s civil and armed forces. Both Governmentsdeclare these rights to be fundamental and undertake to enforce them effectively. The PrimeMinister of India has drawn attention to the fact that these rights are guaranteed to allminorities in India by its constitution. The Prime Minister of Pakistan has pointed out thatsimilar provision exists in the Objectives Resolution adopted by the Constituent Assembly
of Pakistan. It is the policy of both Governments that the enjoyment of these democraticrights shall be assured to all their nationals without distinction. Both Governments with to emphasize that the allegiance and loyalty of the state of Whichthey are citizens, and that it is to the Governments of their own state that they should look for the redress of their grievances.
B. In respect of migrants from East Bengal, West Bengal, Assam and Tripura, wherecommunal disturbances have recently occurred, it is agreed between the two Governments. (i) That three shall be freedom of movement and protection in transit;

8/8/2019 Demography Bimal
http://slidepdf.com/reader/full/demography-bimal 83/93
(ii) That there shall be freedom to remove as much of his movable personal effects andhousehold goods as a migrant may wish to take with him. Movable property shallinclude personal jewellery. The maximum cash allowed to each adult migrant will beRs. 150/ and to each migrant child Rs. 75/.
(iii) That a migrant may deposit such of his personal jewellery or cash as he does not withto take with him with a bank. A proper receipt shall be furnished to him by the bank
for cash or jewellery thus deposited and facilities shall be provided, as and whenrequired, for their transfer to him, subject as regards cash to the exchange regulationsof the Government concerned;
(iv) That there shall be no harassment by the Customs authorities. At each Customs postagreed upon by the Governments concerned, liaison officers of the other Governmentshall be posted to ensure this in practice;
(v) Rights of ownership in or occupancy of the immoveable property of a migrant shallnot be disturbed. If during his absence, such property is occupied by another person,it shall be returned to him provided that he comes back by the 31 st December, 1950.Where the migrant was a cultivating owner or tenant, the land shall be restored tohim provided that he returns not later than the 31st December, 1950. In exceptionalcases, if a Government considers that a migrant’s immoveable property cannot be
returned to him, the matter shall be referred to the appropriate Minority Commissionfor advice. Where restoration of immoveable property to the migrant who returns within thespecified period is found not possible the Government concerned shall take steps torehabilitate him.
(vi) That in the case of a migrant who decides not to return, ownership of all hisimmoveable property shall continue to vest in him and he shall have unrestrictedright to dispose it of by sale, by exchange with an evacuee in the other country, orotherwise. A Committee consisting of three representatives of the minority andpresided over by a representative of Government shall act trustees of the owner. Thecommittee shall be empowered to recover rent for such immoveable propertyaccording to law.
The Government of East Bengal, Assam and Tripura shall enact the necessary legislation toset up these Committees.
The Provincial or State Government as the case may be will instruct the District or otherappropriate authority to give all possible assistance for the discharge of the Committee’s function.
The provisions of this sub-paragraph shall also apply to migrants who may have left EastBengal for any part of India, or West Bengal, Assam or Tripura for any part of Pakistan, prior tothe recent disturbances but after the 15th August, 1947. The arrangement in this sub-paragraphwill apply also to migrants who have left Bihar for East Bengal owing to communal disturbancesor fear thereof.
C. As regards the province of East Bengal and Each of the States of West Bengal, Assamand Tripura respectively the two Governments further agree that they shall :
(1) Continue their efforts to restore normal conditions and shall take suitable measures
to prevent recurrence of disorder.(2) Punish all those who are found guilty of offences against persons and property and
of other criminal offences. In view of their deterrent effect, collective fines shall beimposed where necessary. Special Courts will where necessary be appointed toensure that wrong doers are promptly punished.
(3) Make every possible effort to recover looted property.(4) Set up immediately an agency with which representatives of minority shall be
associated to assist in the recovery of abducted women.

8/8/2019 Demography Bimal
http://slidepdf.com/reader/full/demography-bimal 84/93
(5) Nor recognize forced conversions. Any conversion effected during a period of Communal disturbance shall be deemed to be a forced conversion. Those foundguilty of converting people forcibly shall be punished.
(6) Set up a commission of Enquiry at once to enquire into and report on the causesand extent of the recent disturbances and to make recommendations with a view topreventing recrudescence of similar trouble in future. The personnel of the
commission, which shall be presided over by a judge of the High Court, shall besuch as to inspire confidence among the minority.
(7) Take prompt and effective steps to prevent the dissemination of news andmischievous opinion calculated to rouse communal passion by press or radio or byany individual or organization. Those guilty of such activity shall be vigorouslydealt with.
(8) Not permit propaganda in either country directed against the territorial integrity of the other or purporting to incite war between them and shall take prompt andeffective action against any individual or organization guilty of such propaganda.
D. Sub-Paragraphs (1), (2), (3), (4), (5), (7), and (8) of C of the Agreement are of generalscope and applicable according to exigency to any part of India or Pakistan.
E. In order to help restore confidence, so that refugees may return to their homes the two
Governments have decided (i) to depute two Ministers, one from each Government, to remain inthe affected areas for such period as may be necessary; (ii) to include in the cabinets of EastBengal, West Bengal and Assam a representative of the minority community. In Assam theminority community is already represented in the Cabinet. Appointments to the Cabinets of EastBengal and West Bengal shall be made immediately.
F. In order to assist in the implementation of this agreement, the two Government havedecided, apart from the deputation of their Ministers referred to in E, to setup MinorityCommissions, one for East Bengal and one for Assam. These Commissions will be constitutedand will have the functions described below.
(i) Each Commission will consist of one Minister of the Provincial or StateGovernments concerned, who will be chairman, and one representative each of themajority and minority communities from East Bengal, West Bengal and Assam
chosen by and from among their respective representative in the Provincial or StateLegislatures, as the case may be.
(ii) Two Ministers of the Governments of India and Pakistan may attend andparticipate in any meeting of any Commission. A Minority Commission or any twoMinority Commissions jointly shall meet when so required by either CentralMinister for the satisfactory implementation of this Agreement.
(iii) Each Commission shall appoint such staff as it deems necessary for the properdischarge of its functions and shall determine its own procedure.
(iv) Each Commission shall maintain contact with the minorities in Districts and Smalladministrative head quarters through Minority Boards formed in accordance withthe Inter-Dominion Agreement of December, 1947.
(v) The Minority Commission in East Bengal and West Bengal shall replace the
Provincial Minorities Board set up under the Inter-Dominion Agreement of December, 1948.
(vi) The two Ministers of the Central Governments will from time to time consult suchpersons or organizations as they may consider necessary.
(vii) The functions of the Minority Commission shall be :(a) To observe and to report on the implementation of this Agreement and for
this purpose, to take cognizance of breaches or neglect.(b) To advise on action to be taken on their recommendations.

8/8/2019 Demography Bimal
http://slidepdf.com/reader/full/demography-bimal 85/93
(viii) Each Commission shall submit reports, as and when necessary, to the Provincialand State Governments concerned. Copies of such reports will be submittedsimultaneously to the two Central Ministers during the period referred to in E.
(ix) The Governments of India and Pakistan and the State and Provincial Governmentswill normally give effect to recommendations that concern them when suchrecommendations are supported by both the Central Ministers. In the event of
disagreement between the two Central Ministers, the matter shall be referred to thePrime Ministers of India and Pakistan who shall either resolve it themselves ordetermine the agency and procedure by which it will be resolved.
(x) In respect of Tripura, the two Central Ministers shall constitute a Commission andshall discharge the functions that are assigned under the Agreement to the MinorityCommission for East Bengal, West Bengal and Assam. Before the expiration of theperiod referred to in E, the two Central Ministers shall make recommendations forthe establishment in Tripura of appropriate machinery to discharge the functions of the Minority Commissions envisaged in respect of East Bengal, West Bengal andAssam.
G. Except where modified by this Agreement, the Inter-Dominion Agreement of December,1948 shall remain in force.
Jawahar Lal Nehru Liaquat Ali KhanPrime Minister Prime Minister of PakistanNew Delhi8th April, 1950

8/8/2019 Demography Bimal
http://slidepdf.com/reader/full/demography-bimal 86/93
]
Source : Muhammad Ghulam Kabir, Minority Politics in Bangladesh, Vikas Publioshing House Pvt. Ltd., India,1980.

8/8/2019 Demography Bimal
http://slidepdf.com/reader/full/demography-bimal 87/93

8/8/2019 Demography Bimal
http://slidepdf.com/reader/full/demography-bimal 88/93
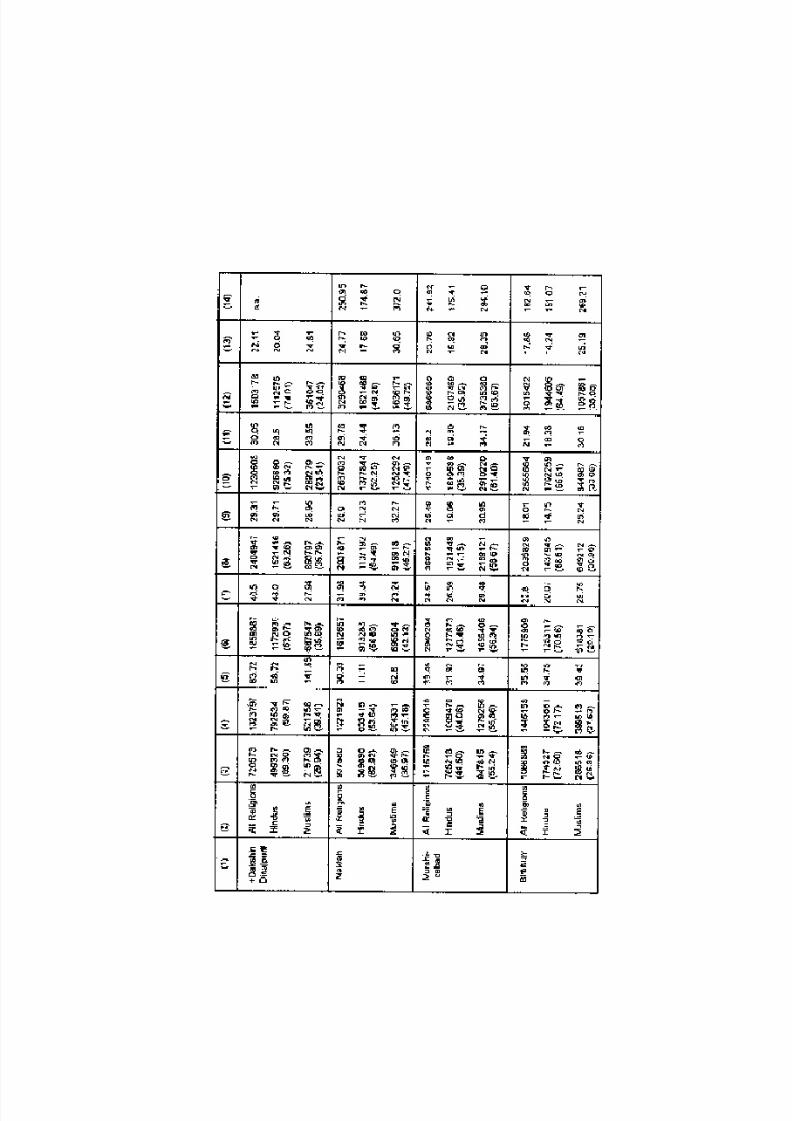
8/8/2019 Demography Bimal
http://slidepdf.com/reader/full/demography-bimal 89/93

8/8/2019 Demography Bimal
http://slidepdf.com/reader/full/demography-bimal 90/93

8/8/2019 Demography Bimal
http://slidepdf.com/reader/full/demography-bimal 91/93

8/8/2019 Demography Bimal
http://slidepdf.com/reader/full/demography-bimal 92/93

8/8/2019 Demography Bimal
http://slidepdf.com/reader/full/demography-bimal 93/93
Note: 1. * Until the religion data for North & South Twenty Four Parganas are the same asboth the districts were under undivided Twenty Four Parganas till 1981. The figuresfor 1971 and 1981 have been recast. Until 1961 the recast data can not be shown forKolkata District also. The recast figures have been shown for 1971 and 1981 forKolkata. Growth Rate of both North and south 24-Parganas during 1961-71 estimatedon the basis of undivided 24-Parganas population data.
2. # Until 1981 the Religion data for Uttar & Dakshin Dinajpur is common as both thedistricts were under the erstwhile West Dinajpur until 1991. The figures for 1991have been recast.
3. $ Purulia was included in West Bengal in 1956 under Bihar and West Bengal(Transfer of Territories) Act, 1956. Hence the data for Purulia is available since 1961
only.4. + Growth Rate of Uttar and Dakshin Dinajpur in 1981-91 estimated on the basis of
undivided West Dinajpur population data.
Source for Annexures I & IV : Final Population Totals, Distribution of Population by Religion, Director of Census
Operations, West Bengal