demography of slavery and the slave trade
TRANSCRIPT
1
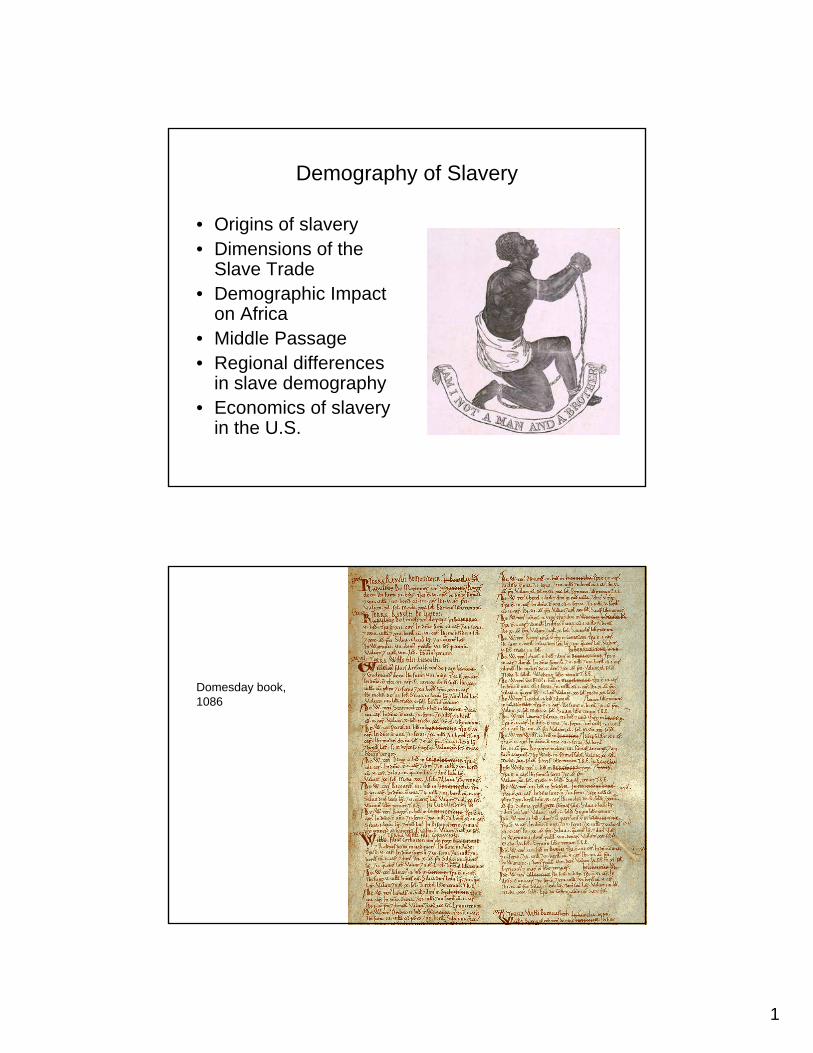
Demography of Slavery
• Origins of slavery• Dimensions of the
Slave Trade• Demographic Impact
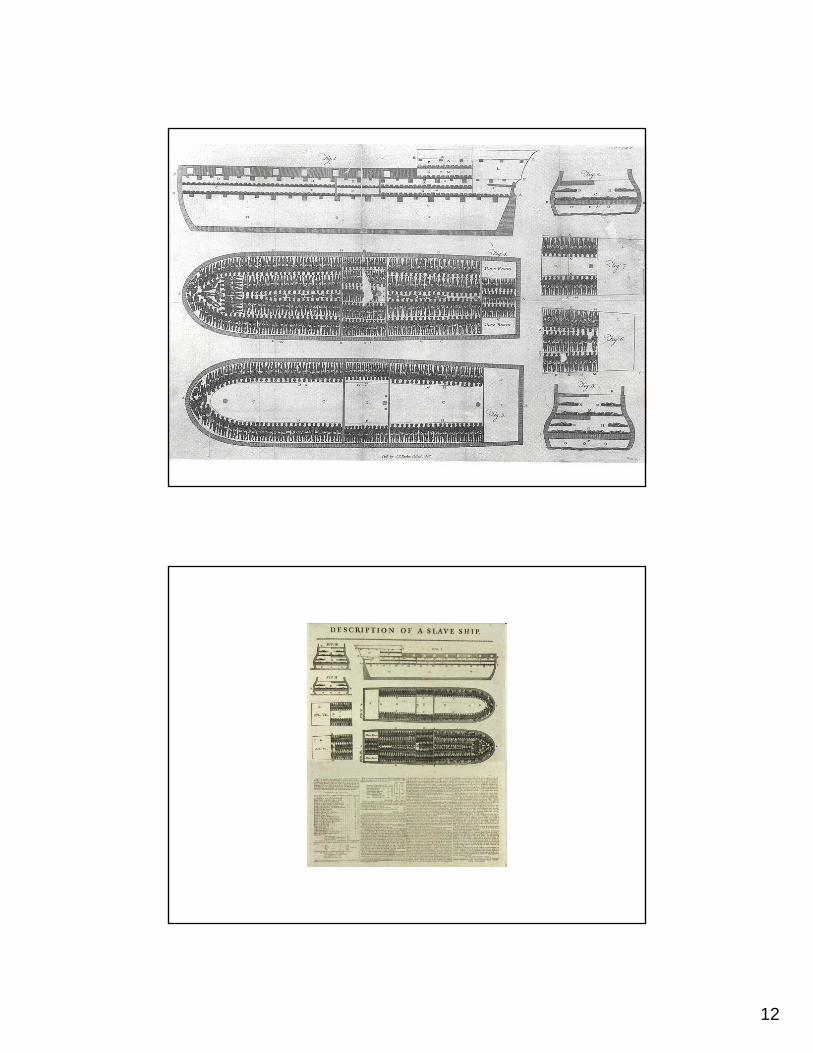
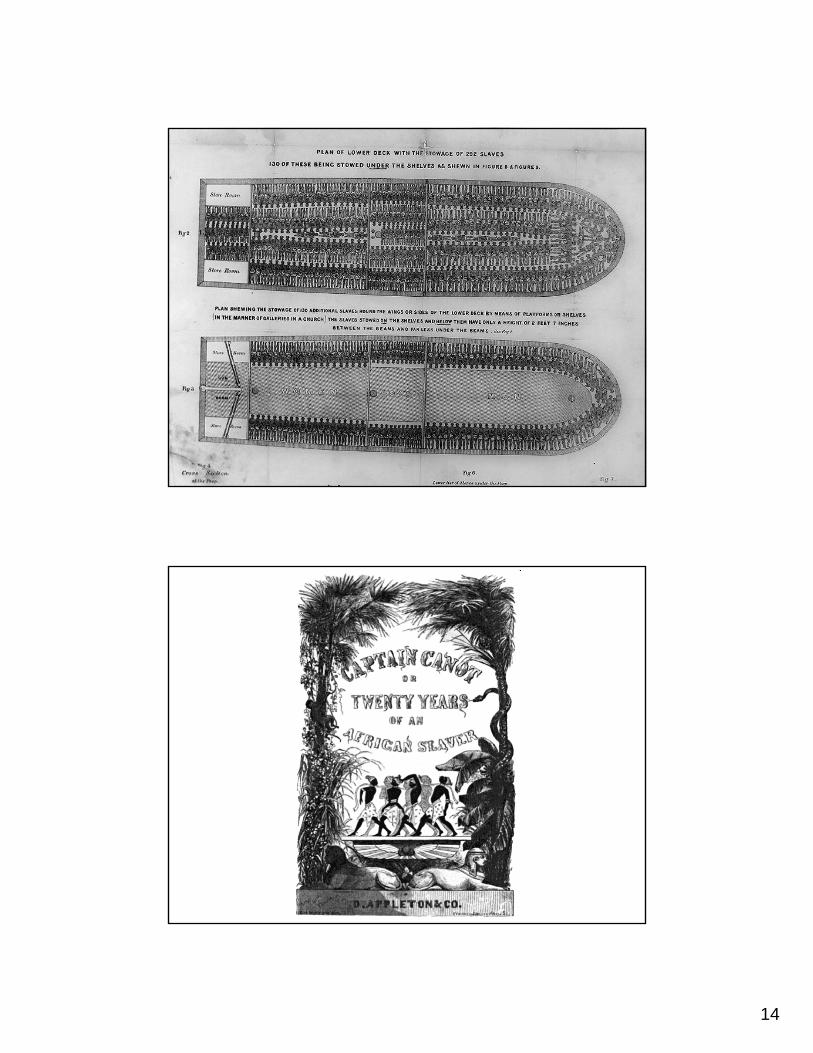
on Africa• Middle Passage• Regional differences
in slave demography• Economics of slavery
in the U.S.
Domesday book, 1086

2
13th Century Slave Market in present day Yemen
3
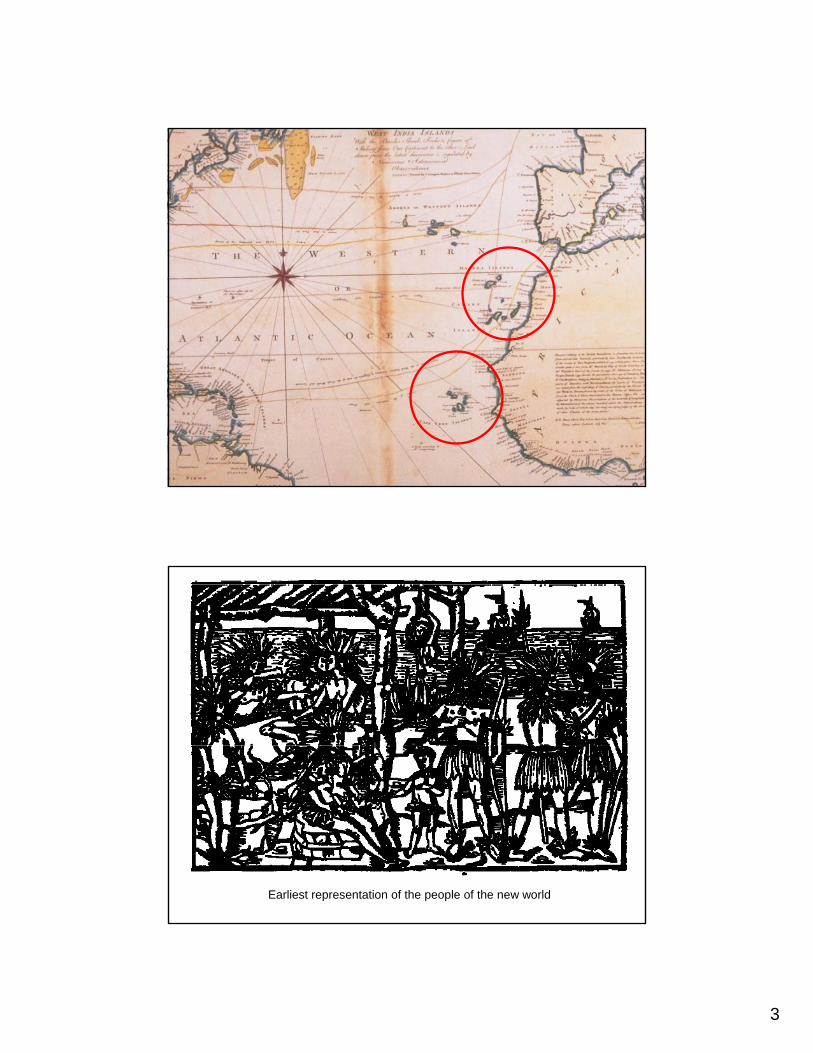
Earliest representation of the people of the new world
4
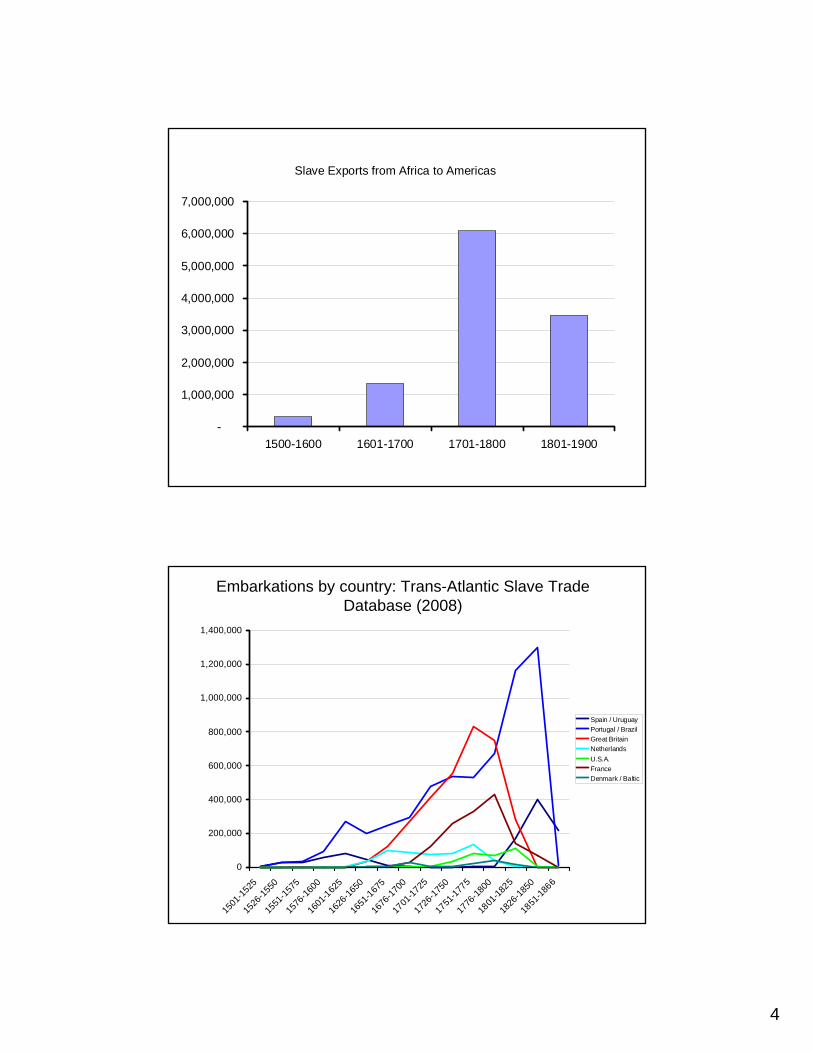
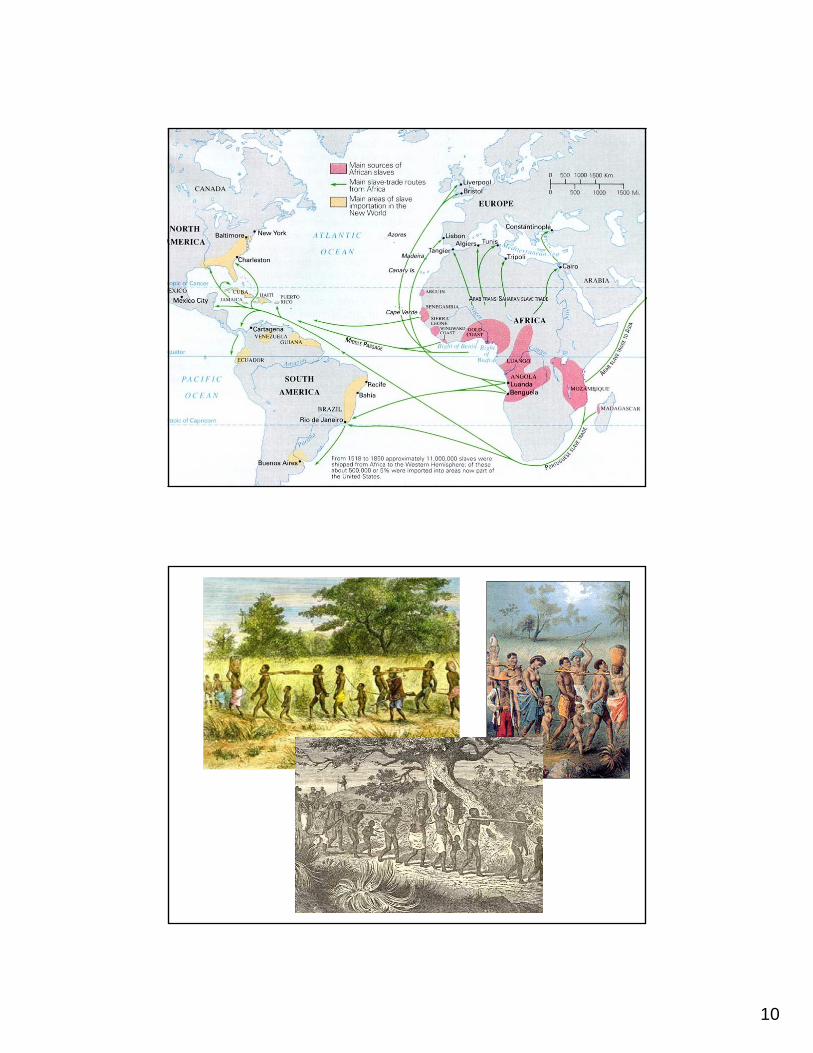
Slave Exports from Africa to Americas
-
1,000,000
2,000,000
3,000,000
4,000,000
5,000,000
6,000,000
7,000,000
1500-1600 1601-1700 1701-1800 1801-1900
0
200,000
400,000
600,000
800,000
1,000,000
1,200,000
1,400,000
1501
-1525
1526
-1550
1551
-1575
1576
-1600
1601
-1625
1626
-1650
1651
-1675
1676
-1700
1701
-1725
1726
-1750
1751
-1775
1776
-1800
1801
-1825
1826
-1850
1851
-1866
Spain / UruguayPortugal / BrazilGreat BritainNetherlandsU.S.A.FranceDenmark / Baltic
Embarkations by country: Trans-Atlantic Slave Trade Database (2008)
5
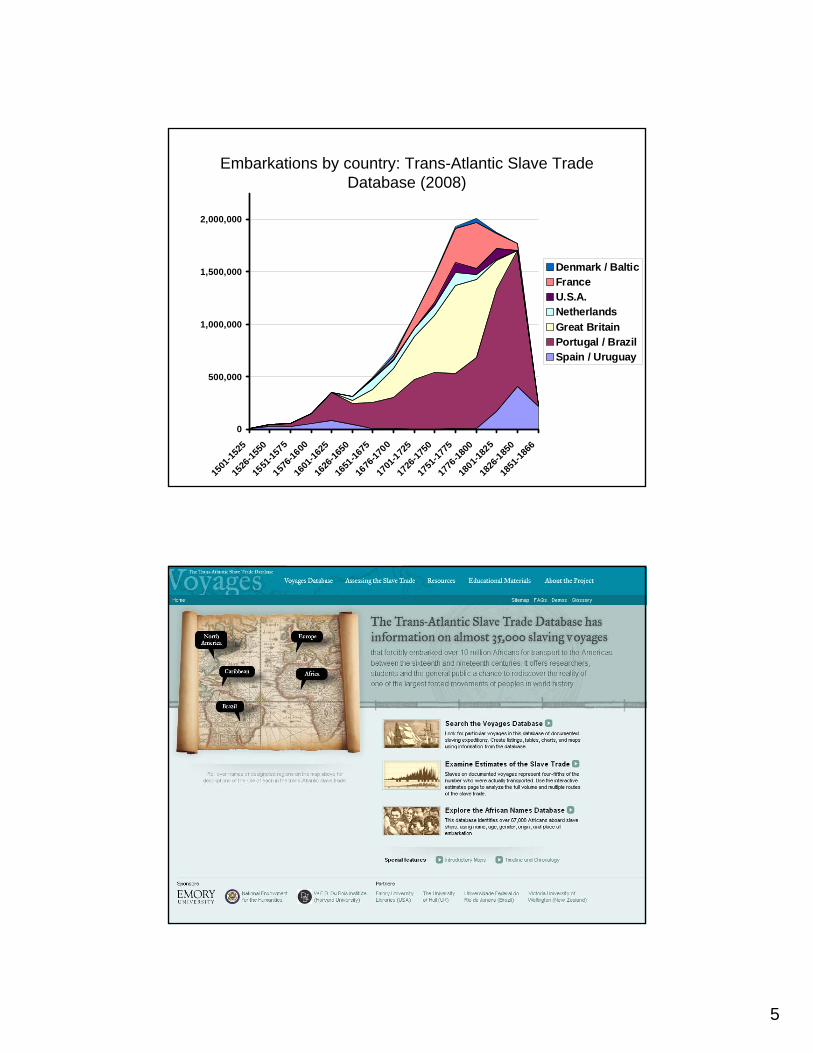
Embarkations by country: Trans-Atlantic Slave Trade Database (2008)
0
500,000
1,000,000
1,500,000
2,000,000
1501
-1525
1526
-1550
1551
-1575
1576-1
600
1601
-1625
1626
-1650
1651
-1675
1676
-1700
1701
-1725
1726
-1750
1751
-1775
1776
-1800
1801-1
825
1826
-1850
1851
-1866
Denmark / BalticFranceU.S.A.NetherlandsGreat BritainPortugal / BrazilSpain / Uruguay
6
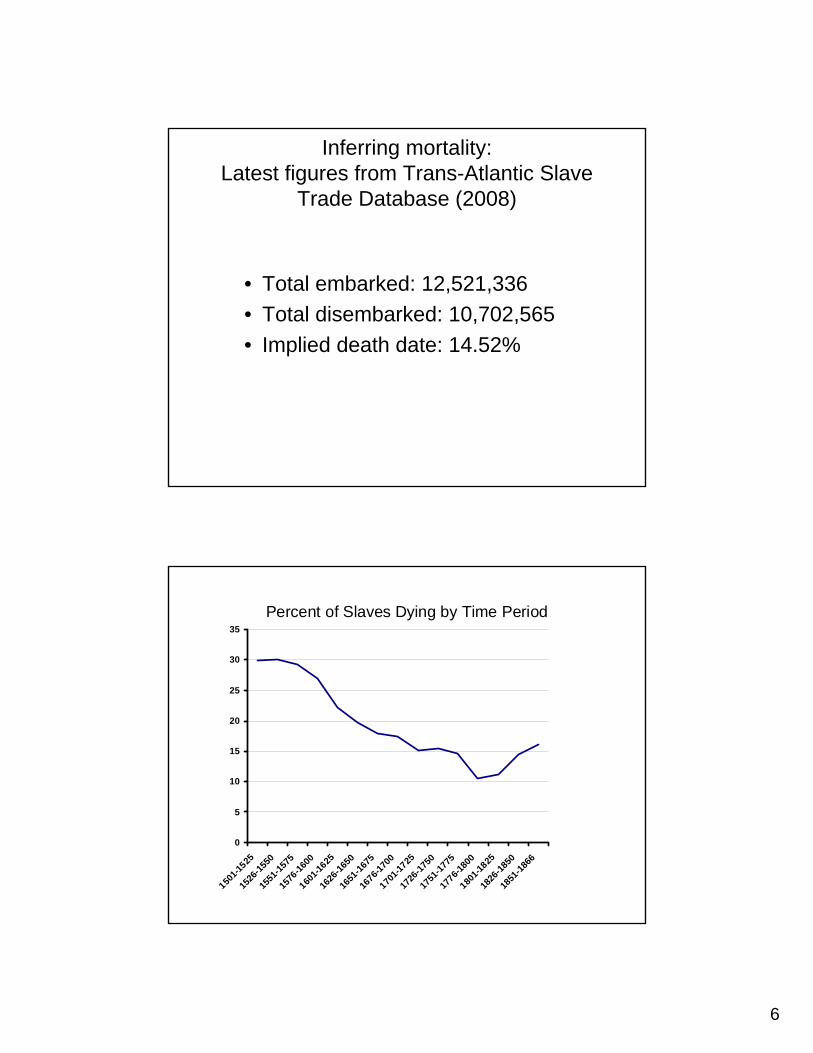
Inferring mortality:Latest figures from Trans-Atlantic Slave
Trade Database (2008)
• Total embarked: 12,521,336• Total disembarked: 10,702,565• Implied death date: 14.52%
Percent of Slaves Dying by Time Period
0
5
10
15
20
25
30
35
1501-1
525
1526
-1550
1551
-1575
1576
-1600
1601-1
625
1626
-1650
1651
-1675
1676-1
700
1701-1
725
1726
-1750
1751
-1775
1776-1
800
1801-1
825
1826
-1850
1851
-1866
7
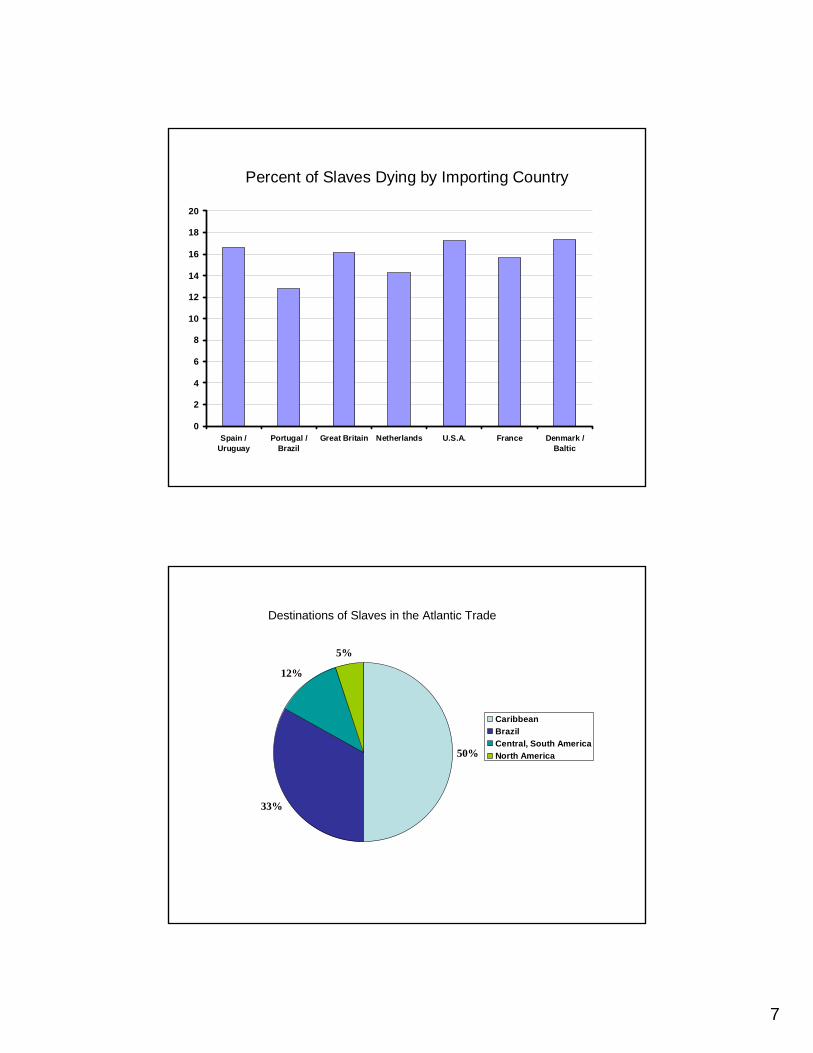
Percent of Slaves Dying by Importing Country
0
2
4
6
8
10
12
14
16
18
20
Spain /Uruguay
Portugal /Brazil
Great Britain Netherlands U.S.A. France Denmark /Baltic
50%
33%
12%
5%
CaribbeanBrazilCentral, South AmericaNorth America
Destinations of Slaves in the Atlantic Trade
8
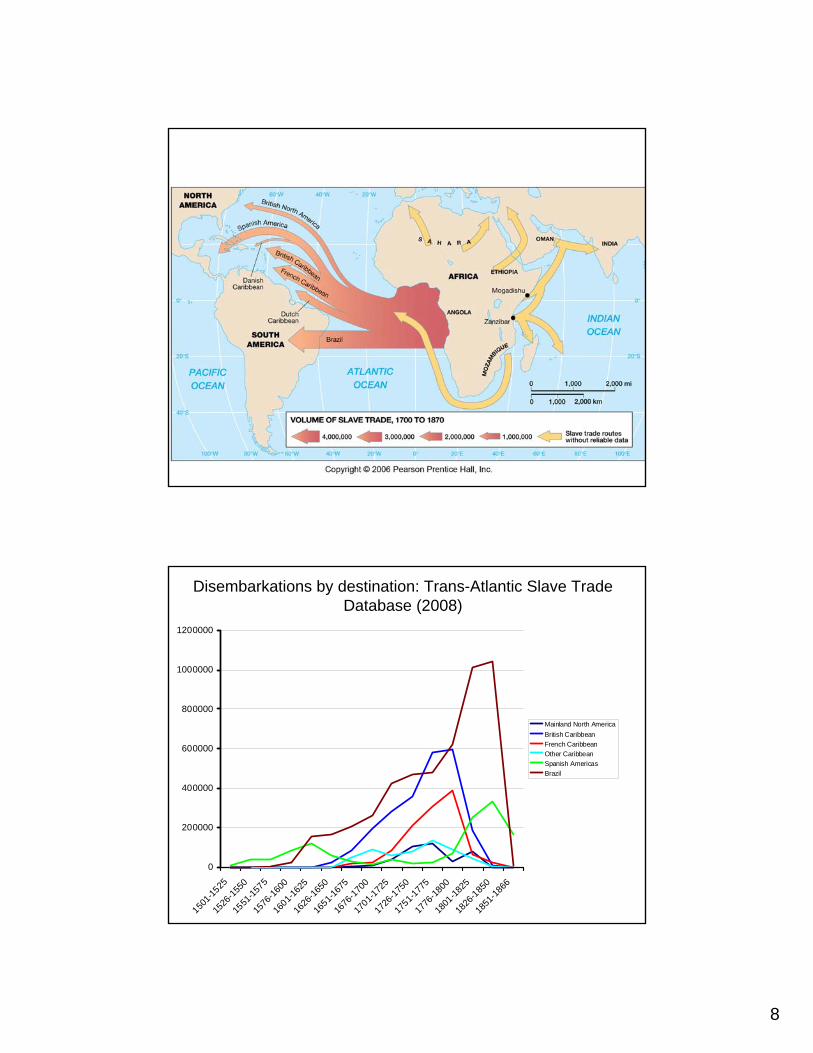
Disembarkations by destination: Trans-Atlantic Slave Trade Database (2008)
0
200000
400000
600000
800000
1000000
1200000
1501-1
525
1526
-1550
1551
-1575
1576
-1600
1601-1
625
1626
-1650
1651-1
675
1676
-1700
1701-1
725
1726
-1750
1751-1
775
1776
-1800
1801
-1825
1826
-1850
1851
-1866
Mainland North AmericaBritish CaribbeanFrench CaribbeanOther CaribbeanSpanish AmericasBrazil
9
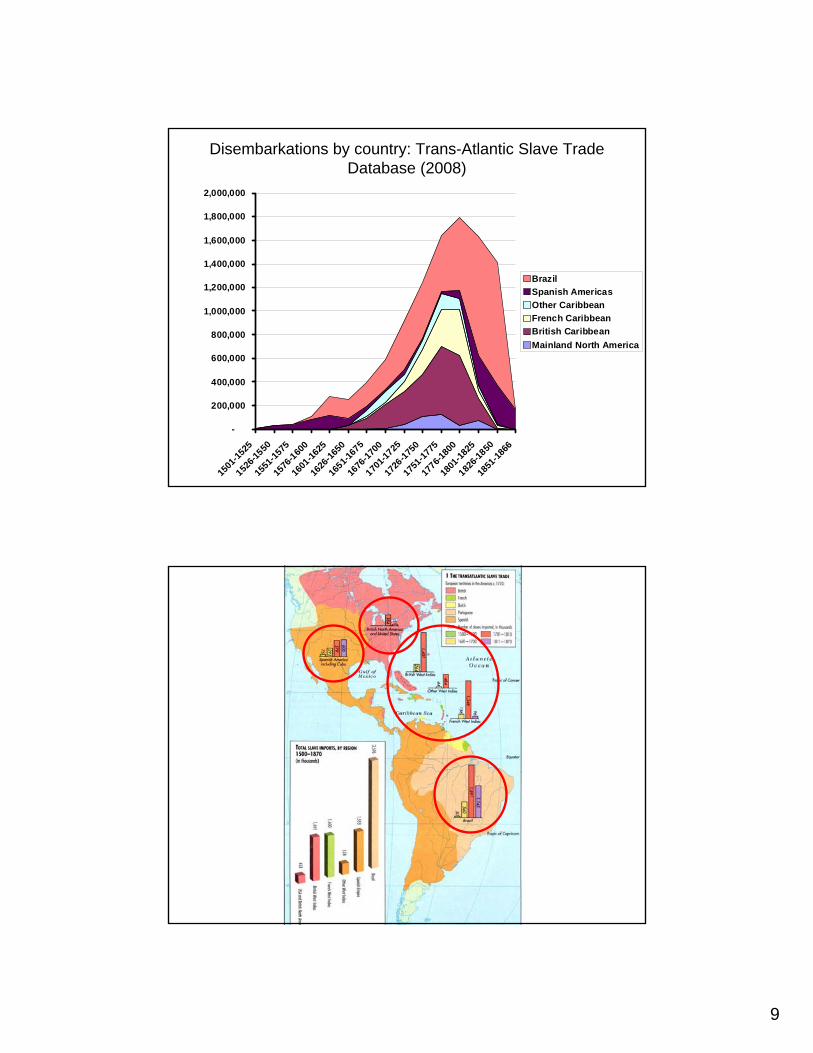
Disembarkations by country: Trans-Atlantic Slave Trade Database (2008)
-
200,000
400,000
600,000
800,000
1,000,000
1,200,000
1,400,000
1,600,000
1,800,000
2,000,000
1501
-1525
1526-1
550
1551
-1575
1576
-1600
1601
-1625
1626
-1650
1651-1
675
1676
-1700
1701-1
725
1726
-1750
1751
-1775
1776-1
800
1801
-1825
1826-1
850
1851
-1866
BrazilSpanish AmericasOther CaribbeanFrench CaribbeanBritish CaribbeanMainland North America
10

11
Slave Market on the African Coast, early 18th cent.
Sale of Enslaved Africans and Transport to Slave Ship, mid-18th cent.
12

13
14
15
16
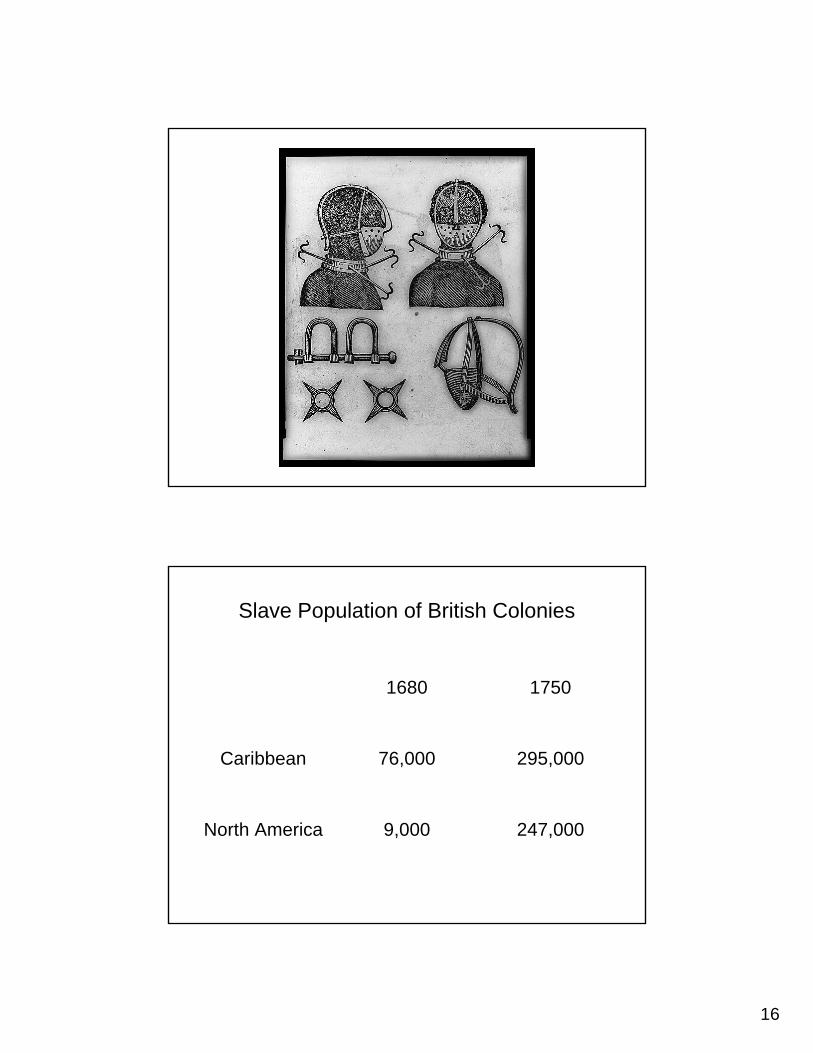
Slave Population of British Colonies
247,0009,000North America
295,00076,000Caribbean
17501680

17
Total Slave Disembarkations by 1680 and 1750
161,1214,070North America
948,097113,976Caribbean
17501680
Ratio of Slave Population to Disembarkations
1.532.21North America
0.310.66Caribbean
17501680
18
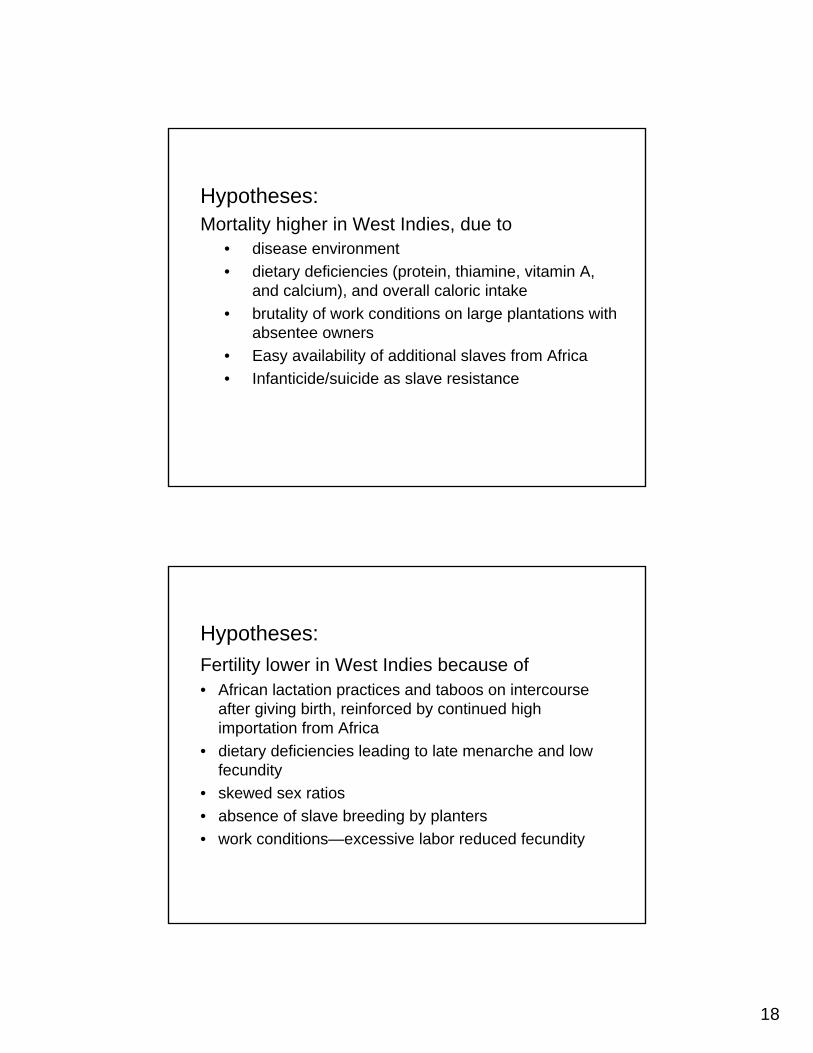
Hypotheses: Mortality higher in West Indies, due to
• disease environment• dietary deficiencies (protein, thiamine, vitamin A,
and calcium), and overall caloric intake• brutality of work conditions on large plantations with
absentee owners• Easy availability of additional slaves from Africa• Infanticide/suicide as slave resistance
Hypotheses: Fertility lower in West Indies because of• African lactation practices and taboos on intercourse
after giving birth, reinforced by continued high importation from Africa
• dietary deficiencies leading to late menarche and low fecundity
• skewed sex ratios• absence of slave breeding by planters• work conditions—excessive labor reduced fecundity
19
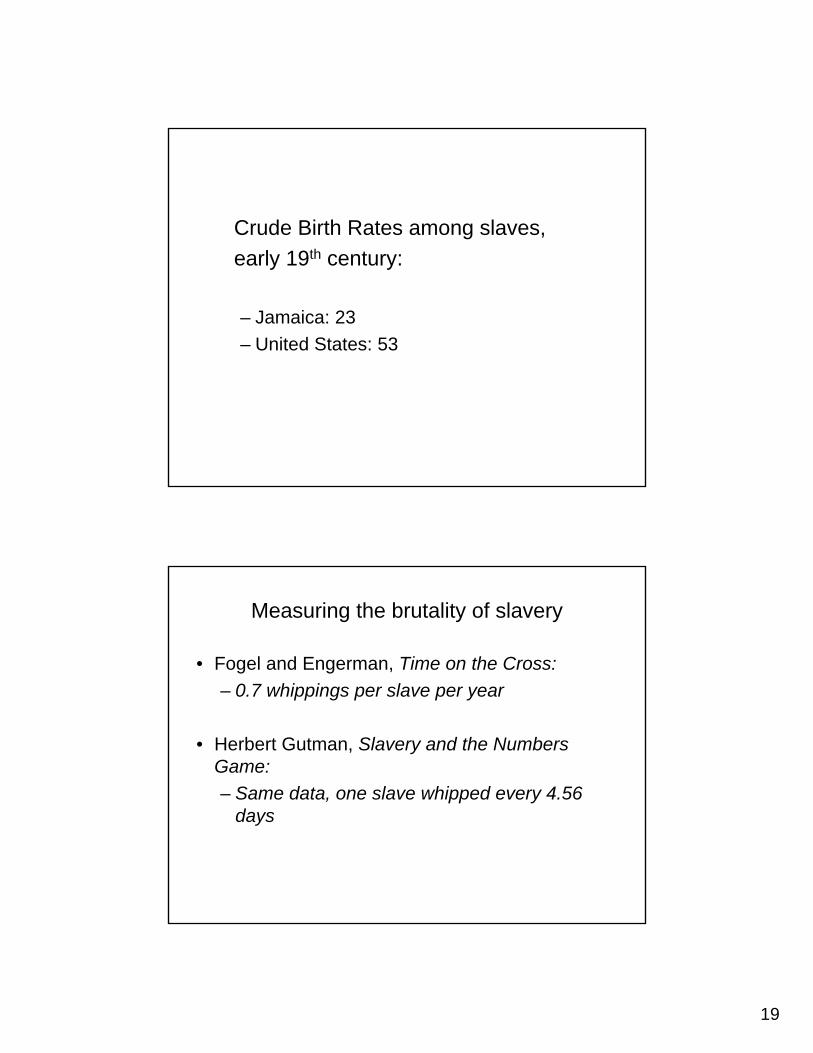
Crude Birth Rates among slaves, early 19th century:
– Jamaica: 23– United States: 53
Measuring the brutality of slavery
• Fogel and Engerman, Time on the Cross:– 0.7 whippings per slave per year
• Herbert Gutman, Slavery and the Numbers Game:– Same data, one slave whipped every 4.56
days

20
21
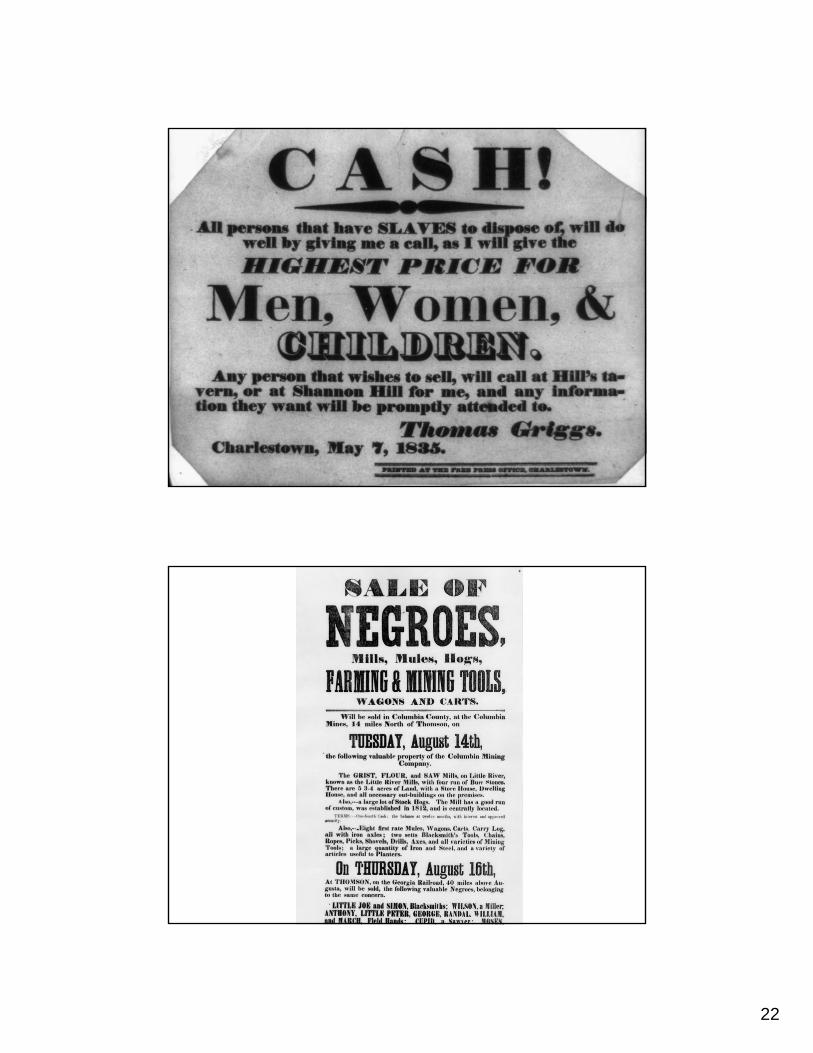
22
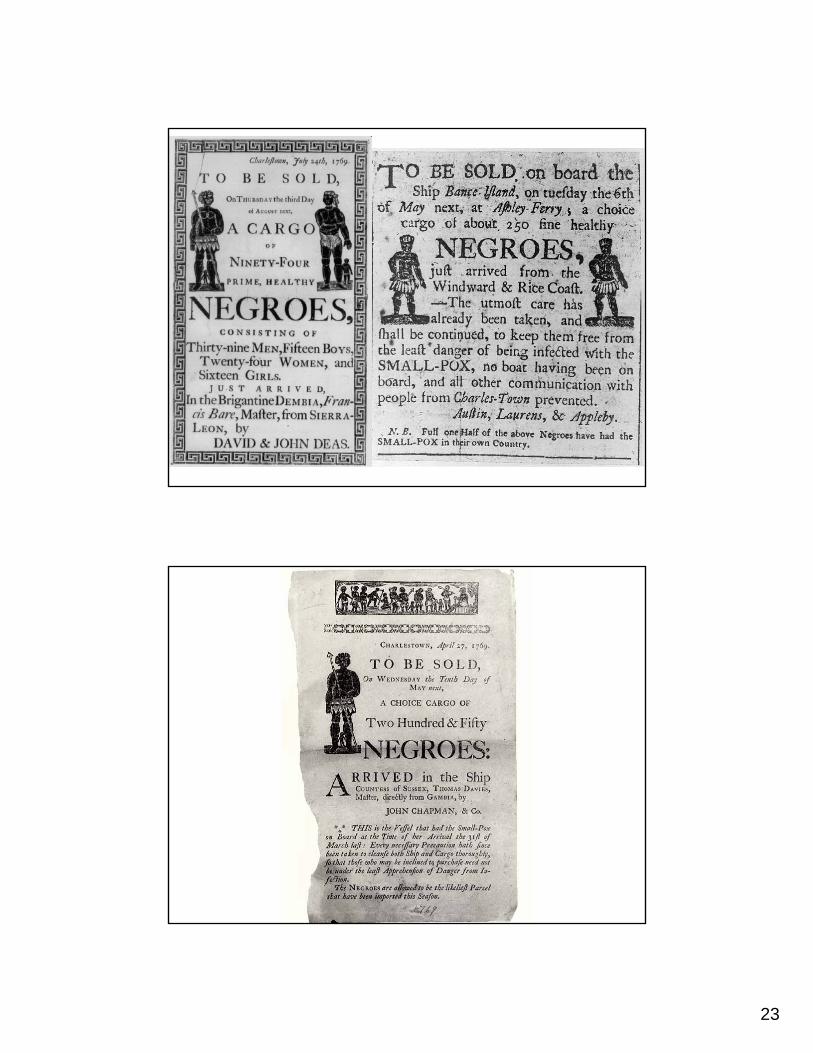
23
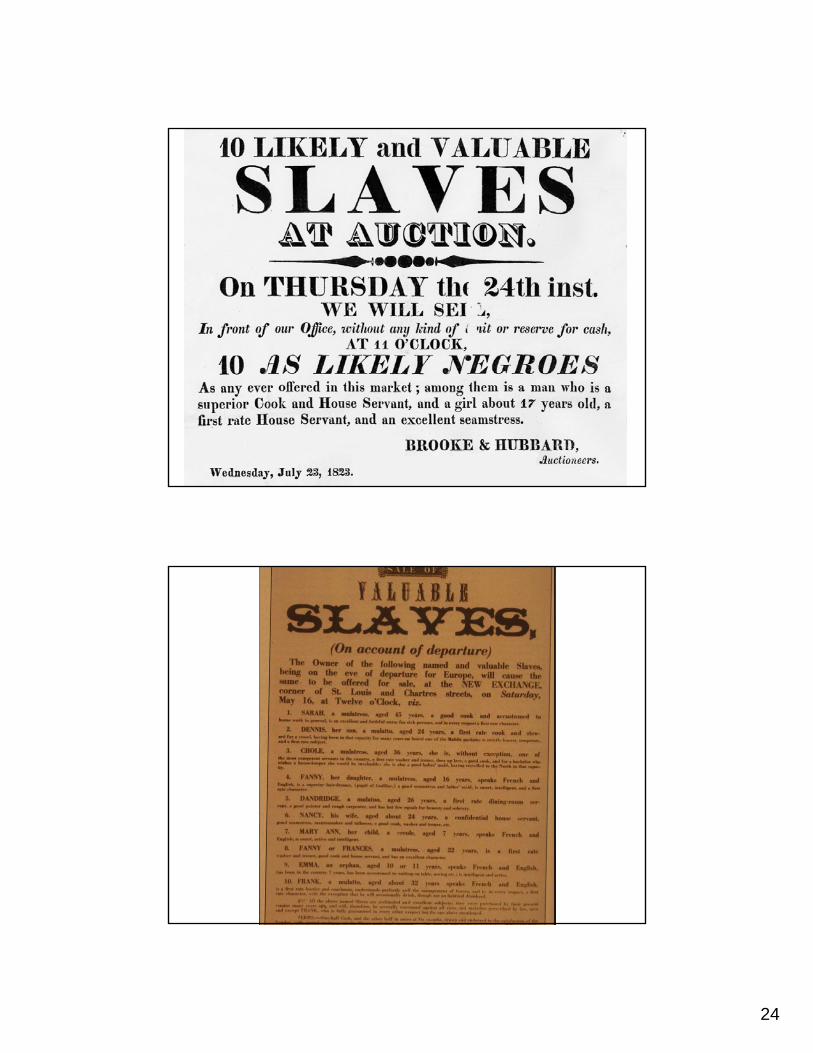
24

25
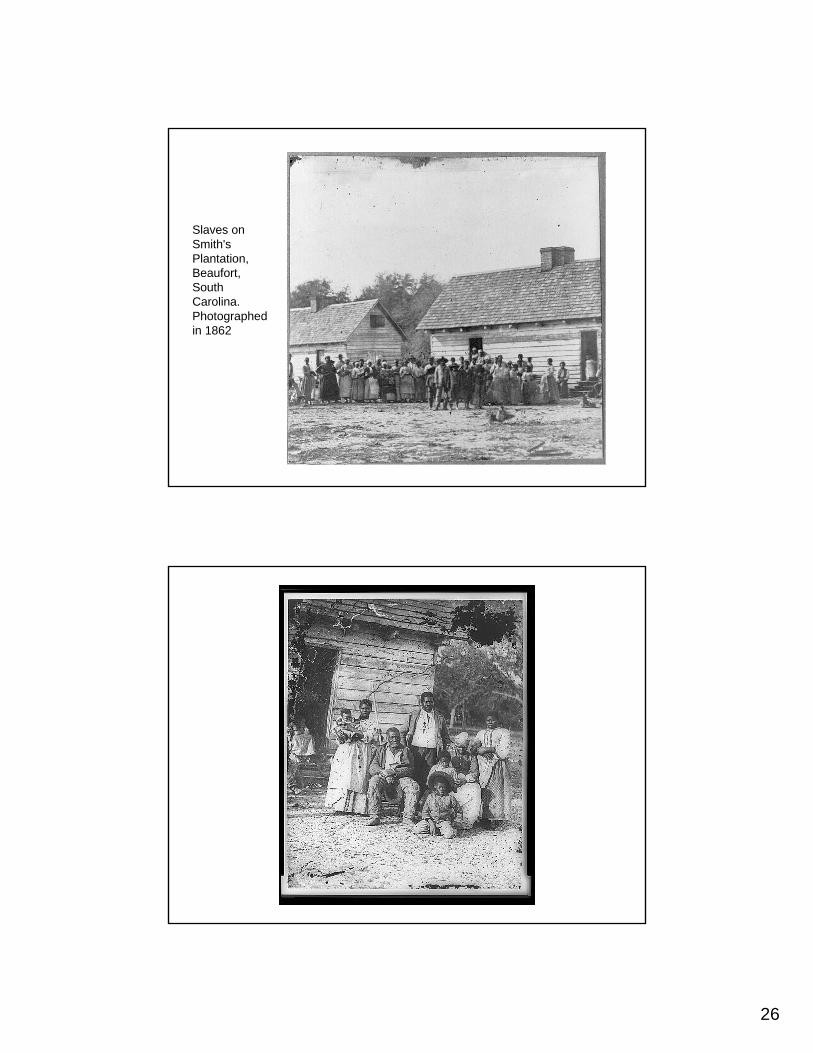
26
Slaves on Smith's Plantation, Beaufort, South Carolina. Photographed in 1862

27
Interior view of a slave pen, showing the doors of cells where the slaves were held before being sold. Slave pen, Alexandria, Va. Photographed between 1861 and 1865
28
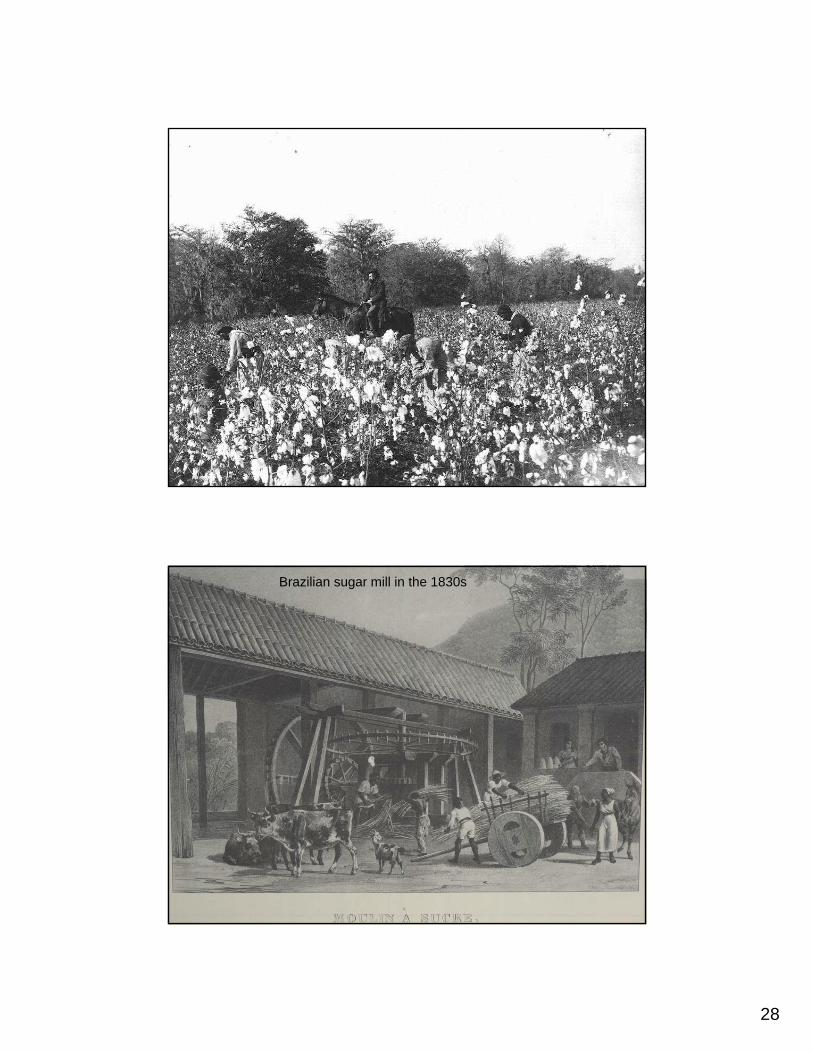
Brazilian sugar mill in the 1830s

29
Newly Enslaved Africans, Brazil, 1830s
Brazilian Plantation
30
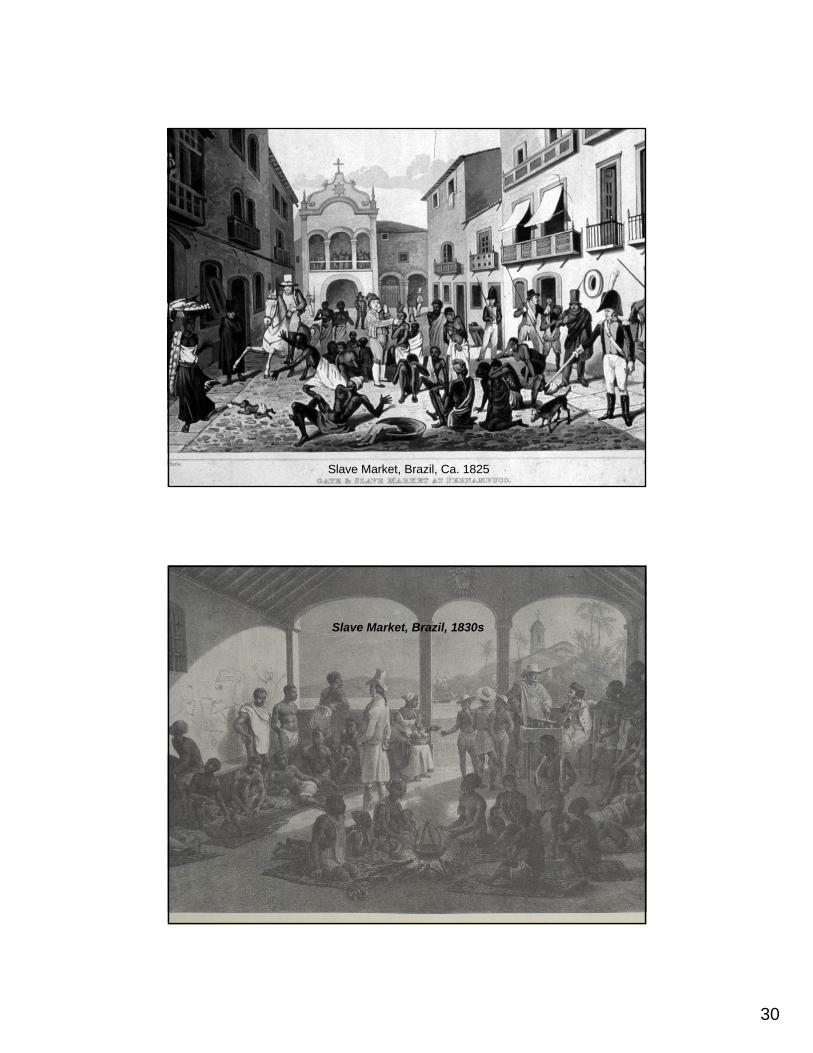
Slave Market, Brazil, Ca. 1825
Slave Market, Brazil, 1830s
31
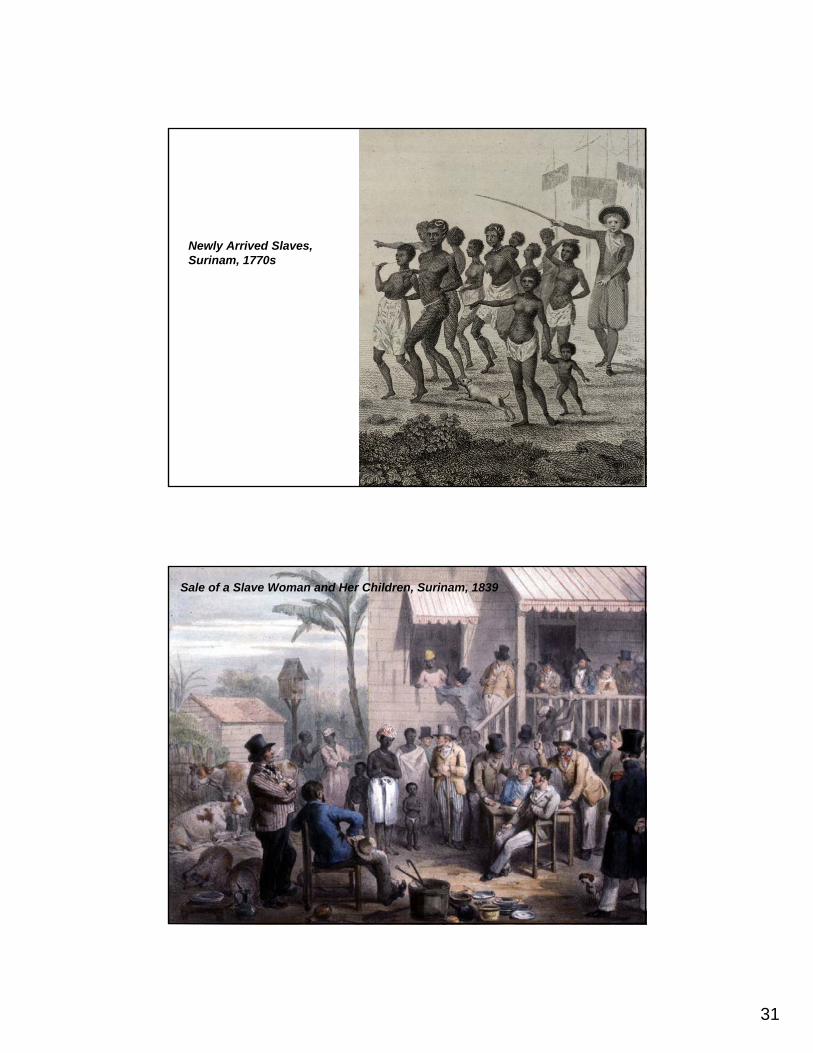
Newly Arrived Slaves, Surinam, 1770s
Sale of a Slave Woman and Her Children, Surinam, 1839

32
Slave Auction, Martinique, 1826
Slave Auction, New Orleans, 1839
33
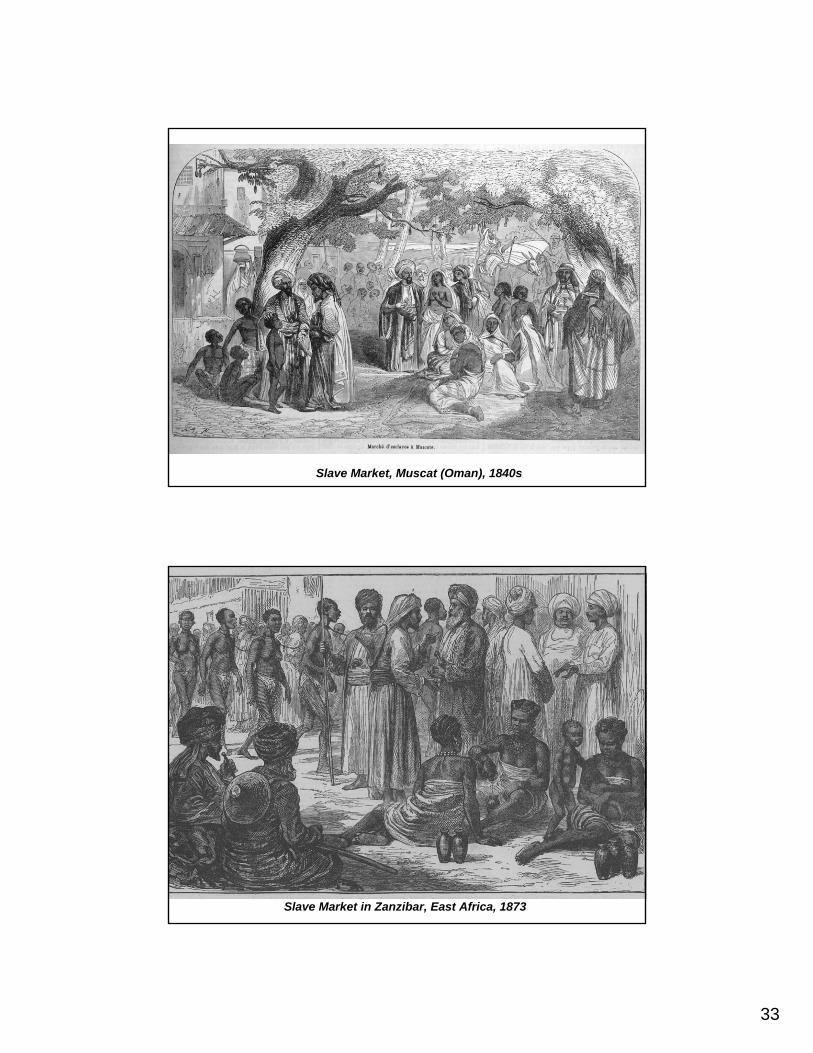
Slave Market, Muscat (Oman), 1840s
Slave Market in Zanzibar, East Africa, 1873
34
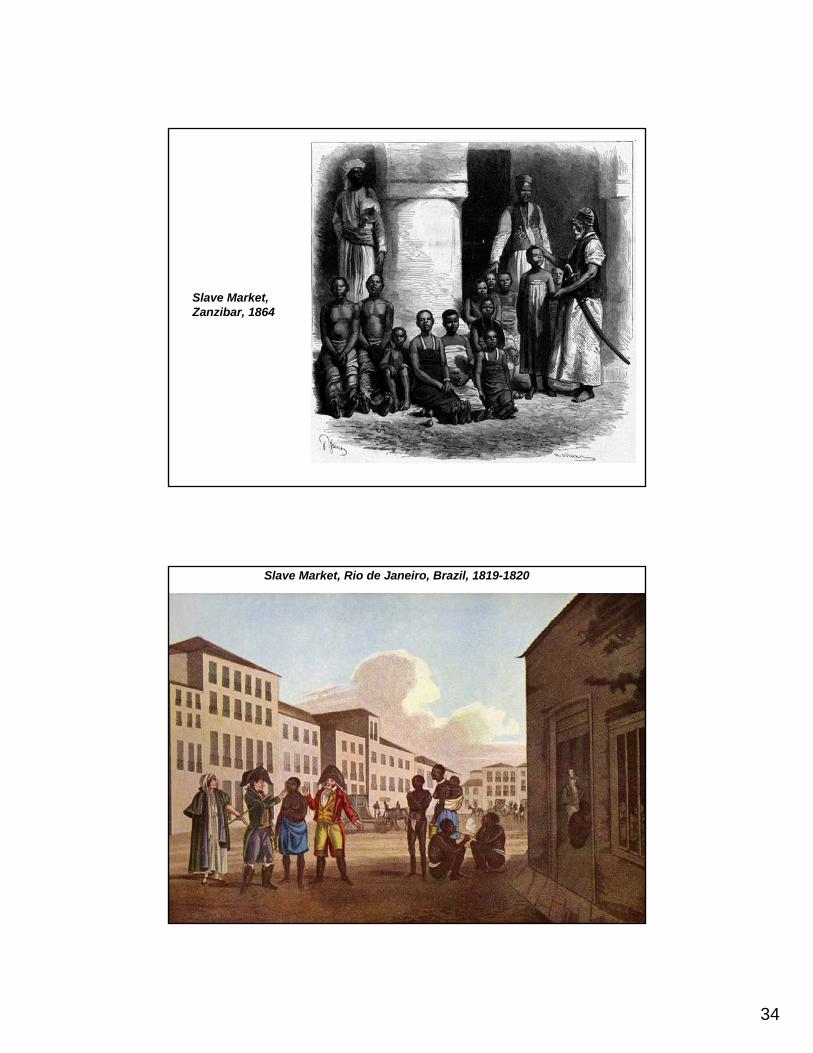
Slave Market, Zanzibar, 1864
Slave Market, Rio de Janeiro, Brazil, 1819-1820

35
Slave market, Charleston SC, 1850s
Slave Dealer, Alexandria, Virginia, 1863 or 1865