demonstration of best management practices to avoid
TRANSCRIPT
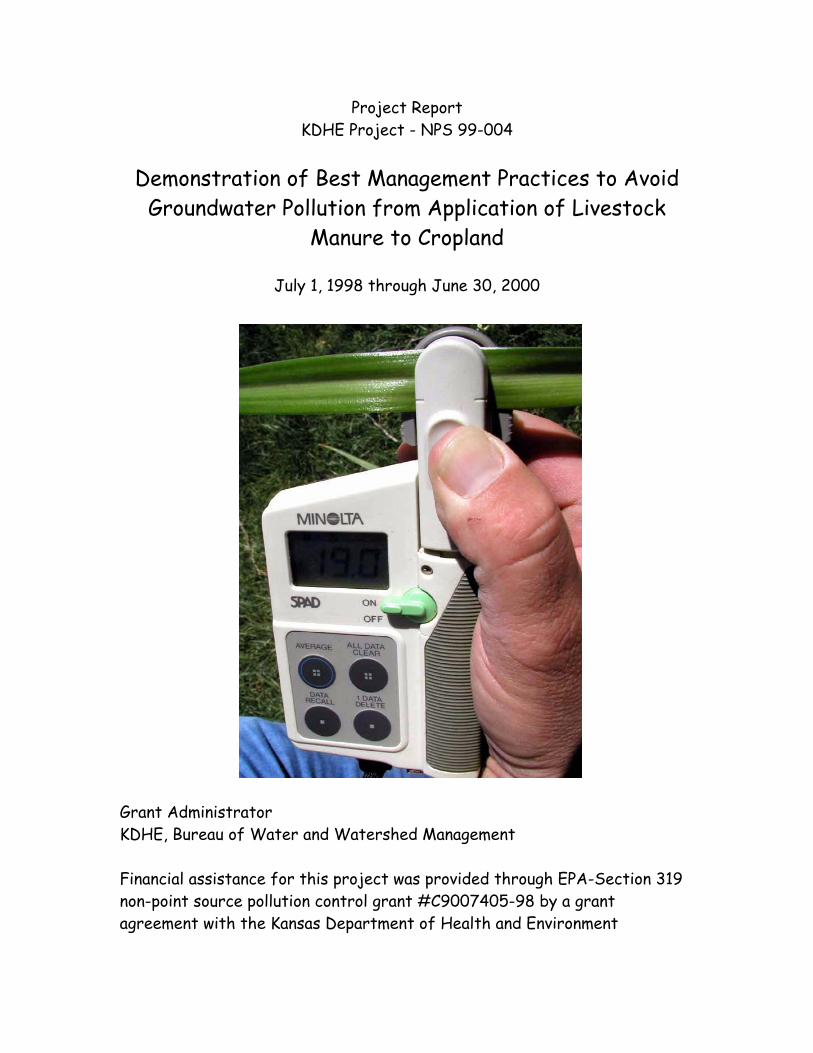
Project Report KDHE Project - NPS 99-004
Demonstration of Best Management Practices to Avoid
Groundwater Pollution from Application of Livestock Manure to Cropland
July 1, 1998 through June 30, 2000
Grant Administrator KDHE, Bureau of Water and Watershed Management Financial assistance for this project was provided through EPA-Section 319 non-point source pollution control grant #C9007405-98 by a grant agreement with the Kansas Department of Health and Environment

Demonstration of Best Management Practices to Avoid Groundwater Pollution from Application of Livestock Manure to
Cropland
Project Report
KDHE Project No. NPS 99-004
Principal Investigators: KDHE Project Officer: Scott Satterthwaite Mahbub Alam Curtis Thompson Todd Trooien Alan Schlegel
Report submitted by Kansas State University Research and Extension Southwest Research and Extension Center
4500 E. Mary, Garden City, KS
1

Table of Contents Subject Page
1. Project summary ………………………………………… 2 2. Introduction ………………………………………… 2 3. Objectives ………………………………………… 2 4. Project Description: Site selection …………………………… 3 5. Plot layout ………………………………………… 4 6. Tasks accomplished ………………………………………… 5 7. Results ………………………………………… 7 8. Discussion ………………………………………… 10 9. Lessons learned ………………………………………… 11 10. Recommendation ………………………………………… 11 11. Summary Expenses ………………………………………… 12 12. Reference ………………………………………… 13 13. Directory of project cooperators………………………………. 13 14. Appendix A: Advisory Committee members ………………… 15
Figures
1. Lucas swine farm and lagoon view with pump in foreground…… 3 2. Plot layout…………………………………………………… 4 3. Pictures showing field with retrofitted sprinkler nozzles and control 4 4. Project location in relation to watershed ……………………. 5 5. Sprinkler panel installed …………………………………………. 6 6. Base line data showing profile N distribution (Lucas Farm)……… 7 7. Profile N distribution from base line soil sample data (Garden City) 8 8. Yield response (Lucas Farm) ……………………………………… 8 9. Yield response (Garden City)……………………………………… 9 10. Profile N after harvest (Garden City)……………………………… 9 11. Profile N after irrigation treatment (Garden City)………………… 10 12. Appendix B: Greenness of leaves as an indicator of N-uptake. 16 13. Appendix C: Photo gallery………………………………………… 17
2

Project Summary: The Demonstration of Best Management Practices to Avoid Groundwater Pollution from Application of Livestock Manure to Cropland project was established in a producer field located in southwest corner of Grant County. Counties contiguous to the demonstration field are Stanton, Morton, and Stevens where exists a large number of swine concentrated animal feeding operations (CAFO). The demonstration site was selected with consent from the cooperators of the project – Seaboard Inc., Lucas Farm, and K-State research and extension. However, later on, the project suffered delays because one of the cooperating partners needed further clarification and the project-funding year had to be extended over a period of two fiscal years. The first year was devoted to developing the site by installing underground pipes to bring the swine effluent to the center pivot, retrofitting the sprinkler nozzles for variable application of effluent, and installing electronic panels to control center pivot operation. Deep soil sampling of the field for establishing base line nutrient status indicated that there existed a serious loading of nitrate-nitrogen just past the corn root zone depth at 5-6 feet depth below the soil surface. There was enough residual nitrogen in the active root zone and no yield response from the nutrient applied either from swine effluent or commercial fertilizer was observed. Introduction: Animal agriculture in western Kansas has undergone a rapid change in last few years. Large confined animal feeding operations for both swine and beef cattle have moved into western Kansas. Citizens of southwest Kansas have shown great concern regarding disposal of confined animal waste from these operations and its application in agricultural lands. Over application or improper use of manure in a limited land base may cause problem from extra nitrogen that may move as nitrate (a pollutant in drinking water) to groundwater. The potential for nitrate movement may be enhanced from excess irrigation application or due to rainfall right after irrigation when the root zone profile is full. In southwest Kansas crop production is dependent on irrigation water pumped out of groundwater source. Objectives:
A. Evaluate livestock and swine waste impact on crop production and water quality at different application rates.
B. Evaluate NO3-N leaching under irrigated conditions. C. Determine nitrogen release and salt build up. D. Develop BMPs for using livestock and swine waste as a fertilizer amendment. E. Estimate economic benefit of using animal waste as compared to chemical
fertilizers on water quality and crop production. F. Conduct educational and informational program on animal waste use.
Project Description: The purpose of the project was to develop and demonstrate Best Management Practices (BMPs) for using confined animal waste from swine and beef cattle operation. The first year target was to select sites and farmer cooperators, collect baseline data, identify source of animal waste, and form advisory committee.
3

Site selection Lucas Farm
The advisory committee (Appendix-A) identified one field site in Grant County, south of Big Bow bordering Stanton, Morton, and Stevens counties. The farm owner, Loren Lucas, showed interest in participating. The site was selected to apply swine effluent from a nursery hog operation of Seaboard Farm, which stands on the leased ground owned by Lucas Farm. The owner of the land had an agreement with Seaboard to allow pumping of the effluent to the adjacent quarter section of ground through the sprinkler system. The initial thought was to utilize the next to the hog barn quarter section field for the project, but the advisory committee felt that the results will be compounded since this ground has been receiving effluent for few years now. The landowner indicated that the quarter section lying further south never received manure before. The committee suggestion was that the quarter section lying south be used. The field, however, received commercial fertilizers and was irrigated by groundwater. The choice of this site required that the project fund provide for establishing an underground pipeline from the existing center pivot to the proposed field. This would also help spread out the effluent to four interconnected pivots expanding the land base for application of effluent and those reduce the risk of overloading. A pie slice of the field was provided to establish the demonstration. The owner farmed the remainder of the field according to his normal cropping operation. The landowner agreed to let the piece of ground be used for five years on continuous corn for the project. However, Mr. Lucas opted to change crop rotations disrupting the data collection in the middle of the project. The agreement was verbal and not much could be done, except seeking out alternative sites. Twenty-four nozzles of the outer span were changed to accomplish differential application of effluent to accomplish different level of nutrient application. The layout of
4
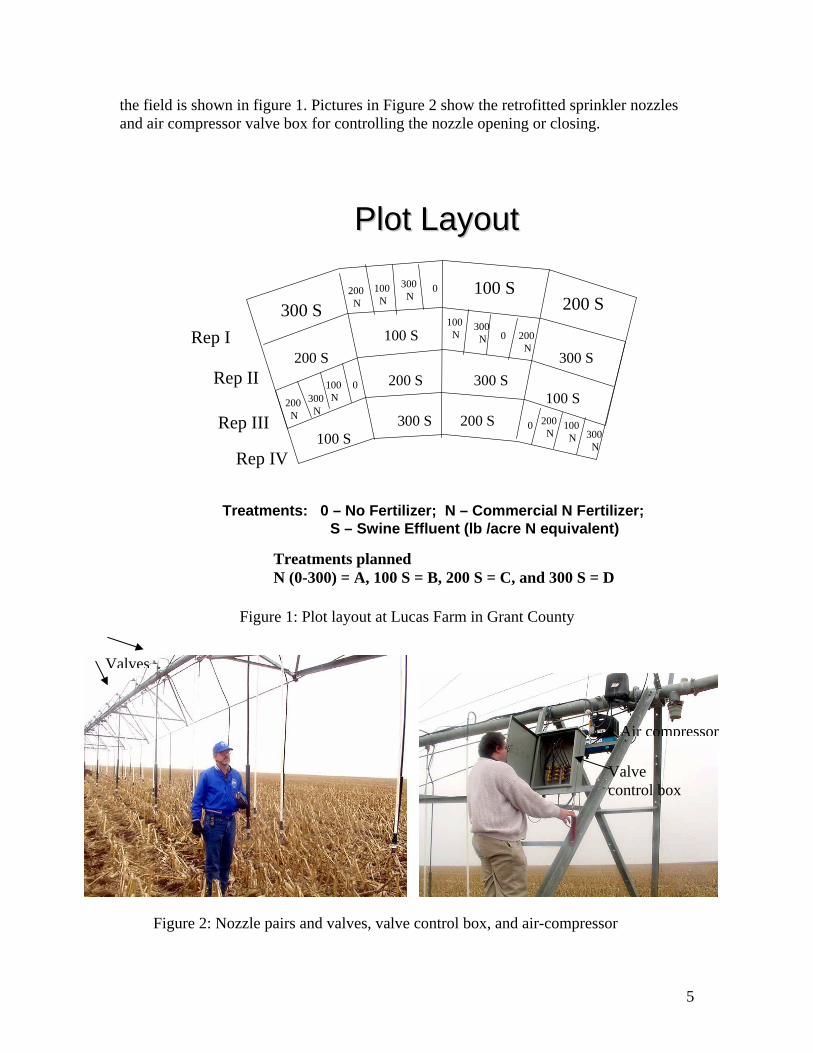
the field is shown in figure 1. Pictures in Figure 2 show the retrofitted sprinkler nozzles and air compressor valve box for controlling the nozzle opening or closing.
Plot LayoutPlot Layout
300 S100 S
200 S0300
N100N
200 N
Rep I
Rep II
Rep III
Rep IV
100 S
100 S
100 S
200 S200 S
200 S
300 S300 S
300 S 0
0
0100
N
100N
100N
200 N
200 N 200
N
300N
300N
300N
Treatments: 0 – No Fertilizer; N – Commercial N Fertilizer; S – Swine Effluent (lb /acre N equivalent)
Treatments planned N (0-300) = A, 100 S = B, 200 S = C, and 300 S = D
Figure 1: Plot layout at Lucas Farm in Grant County
Valves
Valve control box
Air compressor
Figure 2: Nozzle pairs and valves, valve control box, and air-compressor
5

Project Locations in relation to Watershed
Project location
Garden City Site Another site was sought to demonstrate best management practices in applying solid manure of feedlot operations. Most of the probable sites investigated had prolonged but unrecorded application of manure from the feedlots around them. Todd Trooien, one of the principal investigators of this project, started a project on manure use. The advisory committee decided to join to the study that was initiated by him with funding support from this project. The demonstration and field trial was established in Garden City experiment station. The advisory committee decided to add differential water application on different levels of manure application to evaluate the effect of different irrigation depth on the movement of nitrate in the soil profile. The amount of water applications were 1.5 times the ET (Evapotranspiration), same as ET, 0.5 times the ET, and 0 irrigation (dry land). The treatments represented over-irrigation, normal, under, and dry land. Tasks accomplished: Construction work
1. Establishing underground delivery pipeline: Eight inch PVC pipeline was buried underground to connect the target center pivot sprinkler irrigation
6

system to the existing delivery line to bring effluent for land application. Seaboard Farm shared a major part of the cost for the underground pipeline.
2. To enable differential application of effluent the outer most span of the center pivot was retrofitted to form a tandem of two sprinkler nozzles sizes. A combination of nozzle opening and closing enabled to apply zero to three-fold amount of effluent to achieve different dosage of nitrogen application. A series of valves were controlled by air pressure generated by a portable compressor mounted on the center pivot water delivery pipe. The compressor was run by electricity and uniform pressure was maintained. Manual switches inside a control box mounted on the pivot struts above the wheel were used to control valve opening or closing.
3. Retrofitting the center pivot control system with an improved AIMS control panel: The AIMS control panel enabled to shut the center pivot system automatically at a desired angle and avoid the pie slice land of the project from receiving any additional liquid fertilizer. This freed the landowner in applying commercial liquid fertilizer to the remainder of the field under his conventional operation.
Soil sampling for base line and first year crop production: Soil samples were taken to establish base line nitrate level from both sites. Corn was selected as test crop for the project to continue for five years. Corn is the predominant irrigated crop in southwest Kansas and has the highest demand of both nitrogen and phosphorus. SPAD meter was used to record difference in greenness of leaves due to variable nitrogen treatment. Plots with no fertilizer showed a slightly lower value for greenness, but there was no difference between 1x versus 3x application of nitrogen for yield. Greenness values are shown in Appendix: B.
7

Results The soil test of samples from 0 to 300 inches (0-25 ft) indicated that there has been a gradual loading of nitrate in the soil profile even from applications of commercial fertilizers. An average of 650 lbs. per acre nitrogen was already sitting within 36 inches of root zone. The average total within 6 ft. of root zone amounted to 1,454 lbs. of nitrogen per acre. A chart showing the distribution of nutrient in the profile is given below, Figure 3. The treatments A, B, C, and D mentioned have not received any application of effluent at this time and the letter indicating future differential application has no bearing to the base line data at this time. A similar trend was seen for the field at the experiment station in Garden City, Figure 4.
Base line data from soil samples taken from all treatment plots
0
5
10
15
20
25
0 10 20 30 40 50 60 70
Values in ppm NO3
Dep
th in
Fee
t
ABCD
Irrigated corn normal root depth 3-4 ft.
Figure 3: Base line data showing the profile nitrogen distribution in Lucas Farm
8

Base line data from Garden City field is shown below, Figure 4.
Base line data from plots according to treatment plan
0123456789
10
0 10 20 30 40 50 60 70
ppm NO3-ND
epth
(Fee
t)
No Fertilizer 1x Commercial 1x Manure 2x Manure
Irrigated corn normal root depth 3-4 ft.
Figure 4: Profile nitrogen distribution from base line soil sample data Crop Response: Lucas Farm. Corn yield ranged from 203 to 220 bushels averaging at 211 bu/ac. There was no significant difference in yield from the treatments, Figure 5. Corn yield as effected by variable application of nutrient from swine
effluent and commercial fertilizers.
100
120
140
160
180
200
220
240
0 100N 100 S 200 N 200 S 300 N 300 S Bulk
Treatments: 0 – no fertilizer; N – commercial N fertilizer; S – Swine Effluent; Bulk – Farmer’s practice
Yiel
d, b
u/ac
Not significantly different Figure 5: Yield response at Lucas Farm
9
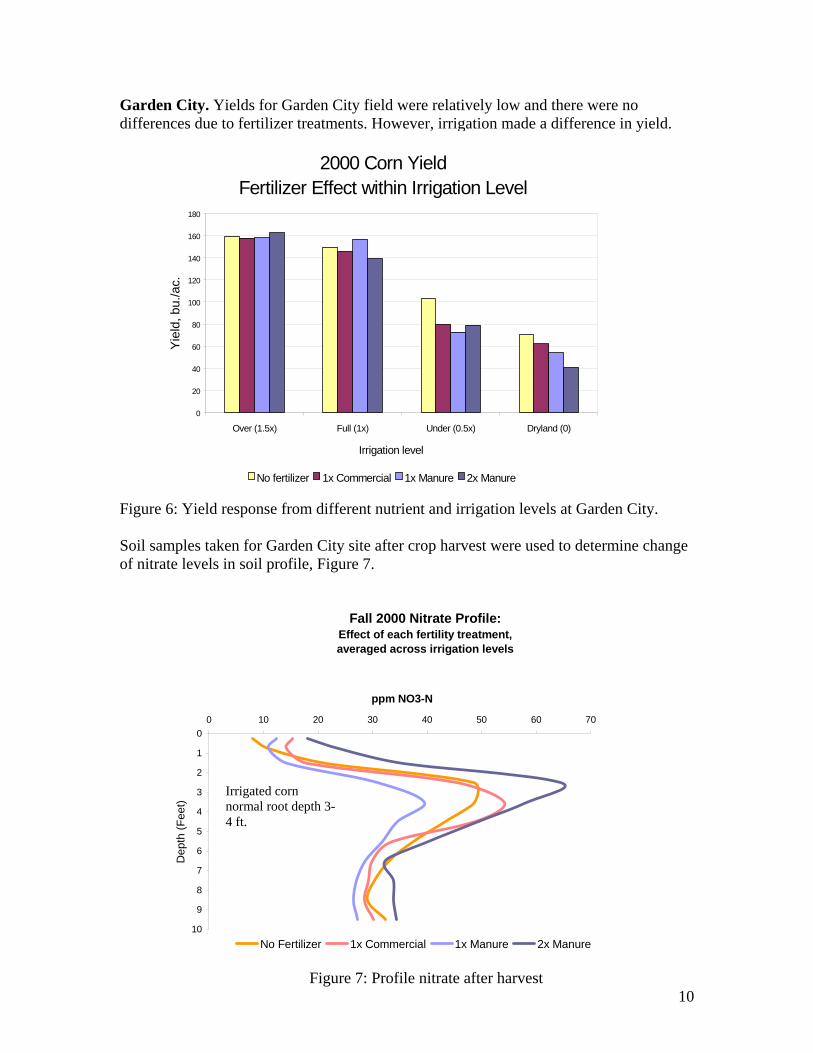
Garden City. Yields for Garden City field were relatively low and there were no differences due to fertilizer treatments. However, irrigation made a difference in yield. Figure 6: Yield response from different nutrient and irrigation levels at Garden City.
2000 Corn YieldFertilizer Effect within Irrigation Level
0
20
40
60
80
100
120
140
160
180
Over (1.5x) Full (1x) Under (0.5x) Dryland (0)
Irrigation level
Yie
ld, b
u./a
c.
No fertilizer 1x Commercial 1x Manure 2x Manure
Soil samples taken for Garden City site after crop harvest were used to determine change of nitrate levels in soil profile, Figure 7.
Fall 2000 Nitrate Profile:Effect of each fertility treatment, averaged across irrigation levels
0
1
2
3
4
5
6
7
8
9
10
0 10 20 30 40 50 60 70
ppm NO3-N
Dep
th (F
eet)
No Fertilizer 1x Commercial 1x Manure 2x Manure
Figure 7: Profile nitrate after harvest
Irrigated corn normal root depth 3-4 ft.
10

The residual soil nitrate increased with the higher rate of application except for lower rate of manure. The preseason high residual was also observed for no fertilizer treatment. Nutrient and irrigation treatment interaction are shown in Figure 8. Irrigating at the rate of 1.5 times the ET caused some downward movement of nitrate compared to other irrigation treatments. It is evident that there is a good amount of residual nitrate in the soil profile just below the corn crop root zone. Schlegel et al (2001) observed similar elevated level of nitrate in soil profile while evaluating soil chemical properties of western Kansas’s fields.
Simam
com
Fall 2000 Nitrate Profile: Effect of each irrigation level, raged across fertility treatments
0
1
2
3
4
0 10 20 30 40 50 60 70
ppm NO3-N
ave
5
6
7Dep
th (F
eet) Irrigated corn normal
root depth 3-4 ft.
8
9
10Dryland Under-Irrigated Normal Irrigation Over-Irrigated
Figure 8: Profile nitrate distribution according to irrigation treatment after first year harvest
Discussion:
The yield response from first year application of swine effluent at Lucas Farm showed no significant effect. This is due to high residual N in the soil profile.
ilarly, for Garden City field no difference in yield was observed from differential ount of manure or commercial fertilizer for the same irrigation treatment, Figure 6.
However, irrigation amount significantly affected yield. There was no significant advantage from increasing irrigation to 1.5 times the ET (Evapotranspiration), as
pared to maintaining normal crop water use at 1x of estimated ET. There is an indication that 1.5 times irrigation has moved the nitrate level downward, Figure 8.
11
Lessons learned
1. There exists already a high amount of nitrogen that has moved down the profand is concentrated at 4-6
ile ft depth at this time. There is a chance that with over
irrigation this plume will move down and may contaminate ground water. sence of high residual nitrogen there is no practical response in yield from
application of manure or commercial fertilizer.
al agreement into a written document, we had to discontinue our demonstration and field study in his
application and excessive irrigation have the potential for moving nitrate below
2. Revised the project plan and moved the demonstration to a new location to avoid
3. an that
2. In pre
3. The Lucas Farm owner refused to let us continue the field study in his field. Since we did not make him sign any document translating the verb
field. Recommendation for future water quality protection and actions taken
1. Nitrate movement occurs irrespective of source and producers must developnutrient management plan to avoid excessive application. One time over
root zone.
high nitrate level in soil profile. Revised the field demonstration to include trials to find out if the lost nitrogen cbe removed by deep rooting crop like alfalfa, especially using alfalfa hybriddo not fix atmospheric nitrogen. Also added establishment of percolation lysimeters to observe nutrient movement rate.
4. It is recommended that whenever establishing a demonstration in producers field, a document of mutual agreement must be developed showing expectations of all cooperating partners and signed to avoid misunderstanding.
12
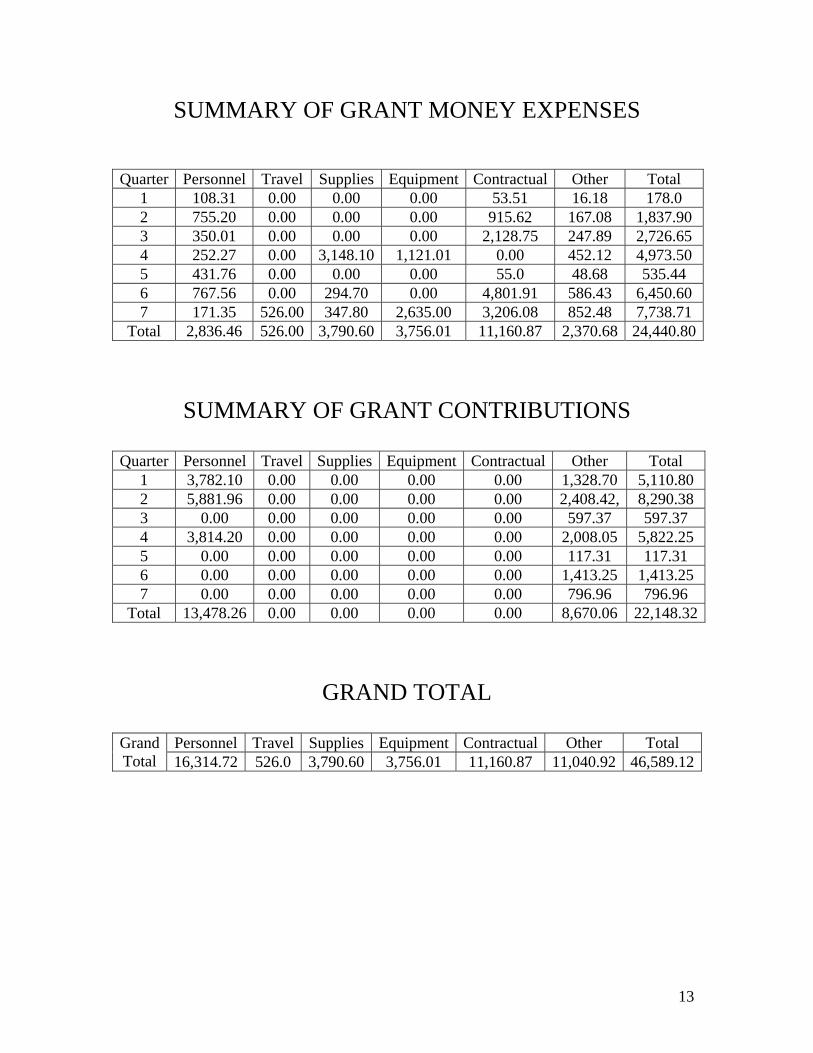
SUMMARY OF GRANT MONEY EXPENSES
Quarter Personnel Travel Supplies Equipment Contractual Other Total
1 108.31 0.00 0.00 .00 53.51 16.18 178.0 02 755.20 0.00 0.00 .00 915.62 167.08 1,837.90 03 350.01 0.00 0.00 .00 2,128.75 247.89 2,726.65 04 252.27 0.00 3,148.10 1,121.01 0.00 452.12 4,973.50 5 431.76 0.00 0.00 .00 55.0 48.68 535.44 06 767.56 0.00 294.70 .00 4,801.91 586.43 6,450.60 07 171.35 526.00 347.80 2,635.00 3,206.08 852.48 7,738.71
Total 2,836.46 526.00 3,790.60 3,756.01 11,160.87 2,370.68 24,440.80
SUMMARY OF GRANT CONTRIBUTIONS
Quarter Personnel Travel Supplies Equipment Contractual Other Total
1 3,782.10 0.00 0.00 .00 0.00 1,328.70 5,110.80 02 5,881.96 0.00 0.00 0.00 0.00 2 , 8,290.38 ,408.423 0.00 0.00 0.00 0.00 0.00 5 97.37 597.374 3 2,814.20 0.00 0.00 0.00 0.00 ,008.05 5,822.25 5 0.00 0.00 0.00 0.00 0.00 117.31 117.31 6 0.00 0.00 0.00 0.00 0.00 1,413.25 1,413.25 7 0.00 0.00 0.00 0.00 0.00 796.96 796.96
Total 13,478.26 80.00 0.00 0.00 0.00 ,670.06 22,148.32
GRAND TOTAL
P Total
ersonnel Travel Supplies Equipment Contractual Other Grand Total 16,314.72 526.0 3,790.60 3,756.01 11,160.87 11,040.92 46,589.12
13

Reference Schlegel, A. J., L. R. St m. 2001. Soil Chemical Properties in Western Kansas F al Waste Applications. In Animal Waste Management & Utilization, Final Report by K-State Research and
o . C A R th nmea
irectory of Project Cooperators/Subcontractors
-State Research and Extension
one, C. W. Rice, and M. Alaields with a H story of Animi
ExtensiKSU, M
n, 105-115 Kansas enter for gricultural esources and e Enviro nt, anhattan, K nsas.
D K
. Mahbub Alam A Phone: 620-275-9164 Extension Specialist Fax: 620-276-6028 4500 E. Mary St., Garden City, KS 67846 E-mail: [email protected]
Dr. Alam, project leader, will recruit other cooperators, oversee completion of work, onal program, and provide interim and final reports to KDHE. conduct educati
B. Curtis Thompson Phone: 620-275-9164 Area Agronomist Fax: 620-276-6028 4500 E. Mary, Garden City, KS 67846 E-mail: [email protected]
r. Thompson will help inteD rpret agronomic and soils related data, plan fieldwork, and pervision as necessary. Also help reviewing reports. su
C. Todd Trooien Phone: 620-276-8286
Fax: 620-276-6028 u
Research Agric. Engineer 4500 E. Mary, Garden City, KS 67846 E-mail: [email protected] Dr. Tro nd pivot
the study.
oien’s help will be sought to interpret irrigation and hydrologic matters acontrol with feedlot manure. Dr. Trooien moved out of K-State. Dr. Willson, was co-opted to take ver solid manure application study and help in environmental interpretation of
system. He will conduct the solid manure application part of the study
o D. Tom Willson Phone: 620-276-8286 Environmental Scientist Fax: 620-276-6028 4500 E. Mary, Garden City, KS 67846 E-mail: [email protected] E. Alan Schlegel Phone: 620-376-4761 Research Agronomist, Fax: 620-376-2278, Tribune, KS E-mail: [email protected]. Schlegel will help in interpreting soil nutrient dynamics.
14

F. Troy Dumler Phone: 620-275-9164 Agricultural Economist Fax: 620-276-6028 4500 E. Mary, Garden City, KS 67846 E-mail: [email protected]. Dumler will provide expertise in analyzing results from economical point of view. Local Coordinators G. Frank Swan Phone: 620-492-2240 Stanton County Agriculture Agent Fax: 620-492-1440
Johnson, KS 67855 E-mail: [email protected] H. Stacy Campbell Phone: 620-697-2558 Morton County Agriculture Agent Fax: 620-697-2790 Elkhart, KS 67950 E-mail: [email protected]. Campbell moved away and recently was replaced by Tim Jones. I. Clay Simons Phone: 620-227-4542 Ford County Agriculture Agent Fax: 620-227-4586 Dodge City, KS 67801 E-mail: [email protected]. Simons moved away and was replaced by Monte Hampton. J. Darl Henson Phone: 620-356-1721
Grant County Agriculture Agent Fax: 620-356-1076 du
Ulysses, KS 67880 E-mail: [email protected] K. Gary Gold Phone: 620-544-4359 Stevens County Agriculture Agent Fax: 620-544-4481 Hugoton, KS 67951 E-mail: [email protected] County Agents will help organize educational meetings and field tours. KDHE Scott L. Satterthwaite Phone: 785-296-5573 KDHE, Bureau of Water, Fax: 785-296-5509 W hed Management Section E-mail: aters [email protected], KS 66612-1367
Other Cooperators
ServiTech Crop Quest USDA-NRCS Groundwater Management District
County Conservation District Southwest Kansas Environmental Planning Group Southwest Kansas Irrigation Association Kansas Rural Water Association
15

Appendix A: Advisory Committee Members Stacy Campbell, Morton County Extension Agriculture Agent
ons, Ford County Extension Agricult
rant County Agriculture Agent
ary Gold, Stevens County Extension Agriculture Agent
rank Swan, Stanton County Agriculture Agent
as Irrigation Association.
lahoma
water Management District
onsultant).
Clay Simm ure Agent Darl Henson, G G F Larry Kepley or representative, Southwest Kans Jason Peters and Keith Siemsen, Seaboard Farms, Guymon, Ok Steven Frost, Executive Director, or representative, Ground Fred Vocasek, Servi-Tech, Dodge City, KS. John Zupancic, Agronomy Solutions (Independent Crop C
15

Appendix B: Greenness of leaves as an indicator of nitrogen uptake by corn plants
r different levels of nitrogen application. Greenness readings were taken using a PAD meter (Minolta SPAD 502)
um production.
foS Greenness values of leaves as an indicator of nitrogen status
Treatment with no fertilizer showed a lower average value (47), but the yield difference was not significant. The value is within the satisfactory range for an optim
0
10
20
50
60
0 100 N 100 S 200 N 200 S 300 N 300 S
30
40
SPA
D m
eter
read
ings
a a
bba a a a
Tre= Sgra
atments: = No fertilizer, N = Commercial fertilizer, S wine effluent (lb/acre N equivalent). Letters on bar ph indicate statistical significance
0
16
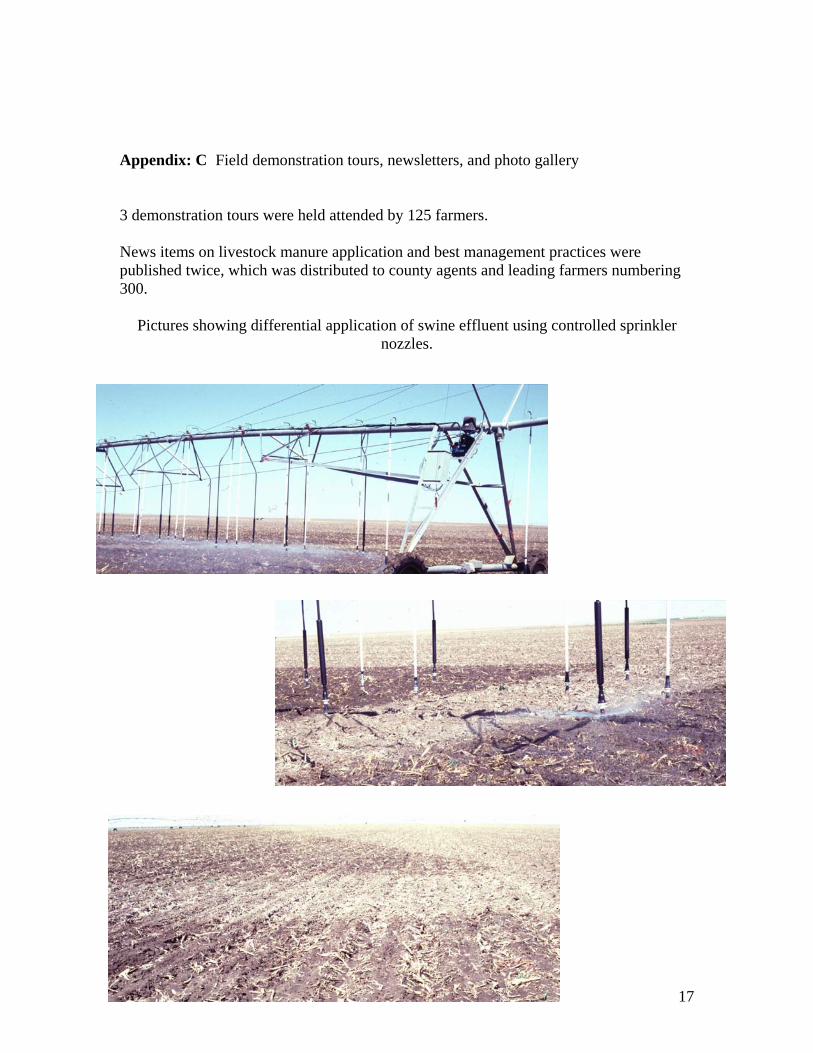
Appendix: C Field demonstration tours, newsletters, and photo gallery
demonstration tours were held attended by 125 farmers.
ews items on livestock manure application and best management practices were ublished twice, which was distributed to county agents and leading farmers numbering 00.
Pictures showing differential application of swine effluent using controlled sprinkler nozzles.
3 Np3
17