demonstration of confocal microscopy for visualization of
TRANSCRIPT
Demonstration of Confocal Microscopy for
Visualization of Mammalian Cells
Aim
Visualization of mammalian cells (stained and unstained) using phase contrast and confocal
microscope.
Introduction:
Confocal microscopy offers several advantages over conventional widefield optical
microscopy, including the ability to control depth of field, elimination or reduction of
background information away from the focal plane (that leads to image degradation), and the
capability to collect serial optical sections from thick specimens. The basic key to the confocal
approach is the use of spatial filtering techniques to eliminate out-of-focus light or glare in
specimens whose thickness exceeds the immediate plane of focus. There has been a tremendous
explosion in the popularity of confocal microscopy in recent years, due in part to the relative
ease with which extremely high-quality images can be obtained from specimens prepared for
conventional fluorescence microscopy, and the growing number of applications in cell biology
that rely on imaging both fixed and living cells and tissues. In fact, confocal technology is
proving to be one of the most important advances ever achieved in optical microscopy.
In a conventional widefield optical epi-fluorescence microscope, secondary fluorescence
emitted by the specimen often occurs through the excited volume and obscures resolution of
features that lie in the objective focal plane. The problem is compounded by thicker specimens
(greater than 2 micrometers), which usually exhibit such a high degree of fluorescence
emission that most of the fine detail is lost. Confocal microscopy provides only a marginal
improvement in both axial (z; along the optical axis) and lateral (x and y; in the specimen plane)
optical resolution, but is able to exclude secondary fluorescence in areas removed from the
focal plane from resulting images. Even though resolution is somewhat enhanced with confocal
microscopy over conventional widefield techniques, it is still considerably less than that of the
transmission electron microscope. In this regard, confocal microscopy can be considered a
bridge between these two classical methodologies.
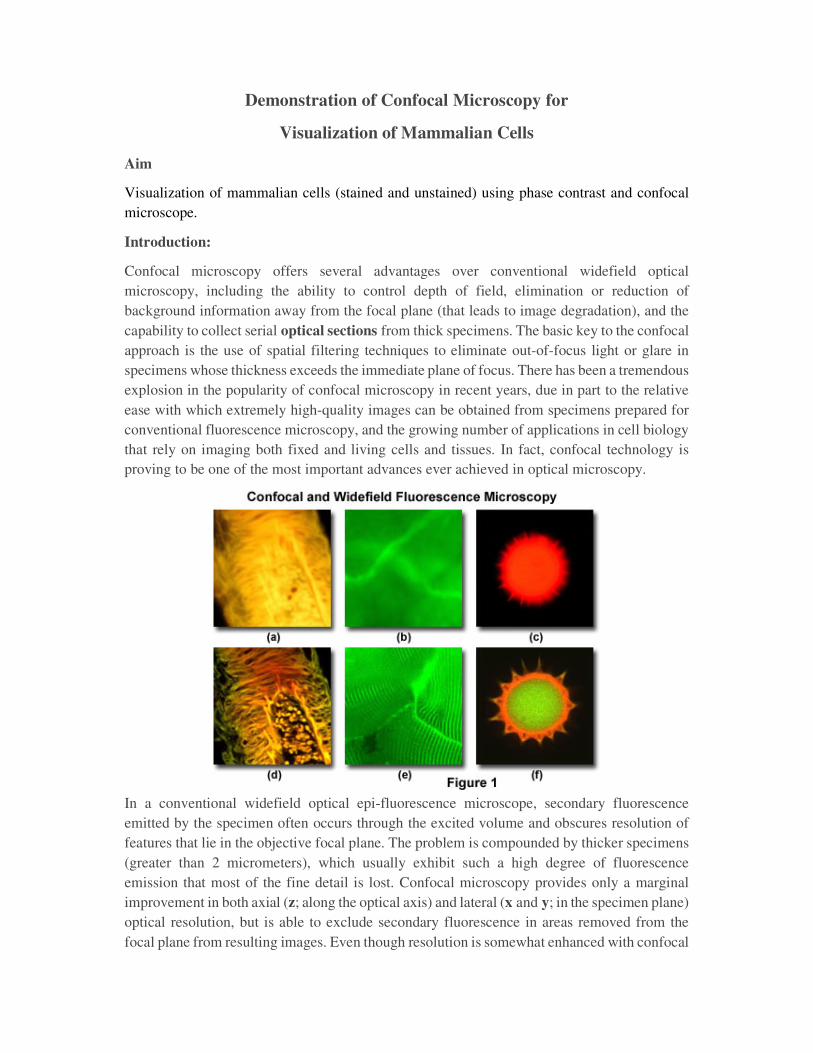
Presented in Figure 1 are a series of images that compare selected viewfields in traditional
widefield and laser scanning confocal fluorescence microscopy. A thick section of
fluorescently stained human medulla in widefield fluorescence exhibits a large amount of glare
from fluorescent structures above and below the focal plane (Figure 1(a)). When imaged with
a laser scanning confocal microscope (Figure 1(d)), the medulla thick section reveals a
significant degree of structural detail. Likewise, widefield fluorescence imaging of whole
rabbit muscle fibers stained with fluorescein produce blurred images (Figure 1(b)) lacking in
detail, while the same specimen field (Figure 1(e)) reveals a highly striated topography in
confocal microscopy. Autofluorescence in a sunflower pollen grain produces an indistinct
outline of the basic external morphology (Figure 1(c)), but yields no indication of the internal
structure. In contrast, a thin optical section of the same grain (Figure 1(f)) acquired with
confocal techniques displays a dramatic difference between the particle core and the
surrounding envelope.
Terms and Definitions
• Depth of Field- the distance along the optical axis throughout which the object can be
located and yet be imaged with satisfactory clarity. This is used in stereo microscopy.
• Field-Of-View- the visible area through the eyepiece when the microscope is in focus.
• Magnification- the enlargement of an object through the lens system. This is determined
by multiplying the magnifying power of the objective by the eyepiece.
• Magnifying Power- It is the number of times the image is seen through the microscope is
larger than the item appears to the unaided eye.
• Numerical Aperture- (N.A.) a term representative of the angle included by a cone of light
accepted by the objective of a microscope. The higher the N.A., the greater the resolving
power.
N.A. = n x sin �
n = refractive index of the medium
� is the maximal half-angle of the cone of light that can enter or exit the lens
• Resolution- a measure of the ability of a lens to image closely spaced objects so they are
recognized as separate objects.
• Resolving power- the capacity of any optical system to distinguish and separate details in
a specimen.
• Working Distance- the distance between the cover glass or object and the tip of the
objective.
Historical Perspective
The basic concept of confocal microscopy was originally developed by Marvin Minsky in the
mid-1950s (patented in 1957) when he was a postdoctoral student at Harvard University.
Minsky wanted to image neural networks in unstained preparations of brain tissue and was
driven by the desire to image biological events at they occur in living systems. Minsky's

invention remained largely unnoticed, due most probably to the lack of intense light sources
necessary for imaging and the computer horsepower required to handle large amounts of data.
Following Minsky's work, M. David Egger and Mojmir Petran fabricated a multiple-beam
confocal microscope in the late 1960s that utilized a spinning (Nipkow) disk for examining
unstained brain sections and ganglion cells. Continuing in this arena, Egger went on to develop
the first mechanically scanned confocal laser microscope, and published the first recognizable
images of cells in 1973. During the late 1970s and the 1980s, advances in computer and laser
technology, coupled to new algorithms for digital manipulation of images, led to a growing
interest in confocal microscopy.
Fortuitously, shortly after Minsky's patent had expired, practical laser scanning confocal
microscope designs were translated into working instruments by several investigators. Dutch
physicist G. Fred Brakenhoff developed a scanning confocal microscope in 1979, while almost
simultaneously, Colin Sheppard contributed to the technique with a theory of image formation.
Tony Wilson, Brad Amos, and John White nurtured the concept and later (during the late
1980s) demonstrated the utility of confocal imaging in the examination of fluorescent
biological specimens. The first commercial instruments appeared in 1987. During the 1990s,
advances in optics and electronics afforded more stable and powerful lasers, high-efficiency
scanning mirror units, high-throughput fiber optics, better thin film dielectric coatings, and
detectors having reduced noise characteristics. In addition, fluorochromes that were more
carefully matched to laser excitation lines were beginning to be synthesized. Coupled to the
rapidly advancing computer processing speeds, enhanced displays, and large-volume storage
technology emerging in the late 1990s, the stage was set for a virtual explosion in the number
of applications that could be targeted with laser scanning confocal microscopy.
Modern confocal microscopes can be considered as completely integrated electronic systems
where the optical microscope plays a central role in a configuration that consists of one or more
electronic detectors, a computer (for image display, processing, output, and storage), and
several laser systems combined with wavelength selection devices and a beam scanning
assembly. In most cases, integration between the various components is so thorough that the
entire confocal microscope is often collectively referred to as a digital or video imaging system
capable of producing electronic images. These microscopes are now being employed for
routine investigations on molecules, cells, and living tissues that were not possible just a few
years ago.
Principles of Confocal Microscopy
The confocal principle in epi-fluorescence laser scanning microscopy is diagrammatically
presented in Figure 2. Coherent light emitted by the laser system (excitation source) passes
through a pinhole aperture that is situated in a conjugate plane (confocal) with a scanning point
on the specimen and a second pinhole aperture positioned in front of the detector (a
photomultiplier tube). As the laser is reflected by a dichromatic mirror and scanned across the
specimen in a defined focal plane, secondary fluorescence emitted from points on the specimen
(in the same focal plane) pass back through the dichromatic mirror and are focused as a
confocal point at the detector pinhole aperture.

The significant amount of fluorescence emission that occurs at points above and below the
objective focal plane is not confocal with the pinhole (termed Out-of-Focus Light Rays in
Figure 2) and forms extended Airy disks in the aperture plane. Because only a small fraction
of the out-of-focus fluorescence emission is delivered through the pinhole aperture, most of
this extraneous light is not detected by the photomultiplier and does not contribute to the
resulting image. The dichromatic mirror, barrier filter, and excitation filter perform similar
functions to identical components in a widefield epi-fluorescence microscope. Refocusing the
objective in a confocal microscope shifts the excitation and emission points on a specimen to
a new plane that becomes confocal with the pinhole apertures of the light source and detector.
In traditional widefield epi-fluorescence microscopy, the entire specimen is subjected to
intense illumination from an incoherent mercury or xenon arc-discharge lamp, and the resulting
image of secondary fluorescence emission can be viewed directly in the eyepieces or projected
onto the surface of an electronic array detector or traditional film plane. In contrast to this
simple concept, the mechanism of image formation in a confocal microscope is fundamentally
different. As discussed above, the confocal fluorescence microscope consists of multiple laser
excitation sources, a scan head with optical and electronic components, electronic detectors
(usually photomultipliers), and a computer for acquisition, processing, analysis, and display of
images.
The scan head is at the heart of the confocal system and is responsible for rasterizing the
excitation scans, as well as collecting the photon signals from the specimen that are required
to assemble the final image. A typical scan head contains inputs from the external laser sources,
fluorescence filter sets and dichromatic mirrors, a galvanometer-based raster scanning mirror
system, variable pinhole apertures for generating the confocal image, and photomultiplier tube
detectors tuned for different fluorescence wavelengths. The general arrangement of scan head
components is presented in Figure 3 for a typical commercial unit.

In epi-illumination scanning confocal microscopy, the laser light source and photomultiplier
detectors are both separated from the specimen by the objective, which functions as a well-
corrected condenser and objective combination. Internal fluorescence filter components (such
as the excitation and barrier filters and the dichromatic mirrors) and neutral density filters are
contained within the scanning unit (see Figure 3). Interference and neutral density filters are
housed in rotating turrets or sliders that can be inserted into the light path by the operator. The
excitation laser beam is connected to the scan unit with a fiber optic coupler followed by a
beam expander that enables the thin laser beam wrist to completely fill the objective rear
aperture (a critical requirement in confocal microscopy). Expanded laser light that passes
through the microscope objective forms an intense diffraction-limited spot that is scanned by
the coupled galvanometer mirrors in a raster pattern across the specimen plane (point
scanning).
One of the most important components of the scanning unit is the pinhole aperture, which acts
as a spatial filter at the conjugate image plane positioned directly in front of the photomultiplier.
Several apertures of varying diameter are usually contained on a rotating turret that enables the
operator to adjust pinhole size (and optical section thickness). Secondary fluorescence
collected by the objective is descanned by the same galvanometer mirrors that form the raster
pattern, and then passes through a barrier filter before reaching the pinhole aperture. The
aperture serves to exclude fluorescence signals from out-of-focus features positioned above
and below the focal plane, which are instead projected onto the aperture as Airy disks having
a diameter much larger than those forming the image. These oversized disks are spread over a
comparatively large area so that only a small fraction of light originating in planes away from
the focal point passes through the aperture. The pinhole aperture also serves to eliminate much
of the stray light passing through the optical system. Coupling of aperture-limited point
scanning to a pinhole spatial filter at the conjugate image plane is an essential feature of the
confocal microscope.
When contrasting the similarities and differences between widefield and confocal microscopes,
it is often useful to compare the character and geometry of specimen illumination utilized for

each of the techniques. Traditional widefield epi-fluorescence microscope objectives focus a
wide cone of illumination over a large volume of the specimen, which is uniformly and
simultaneously illuminated (as illustrated in Figure 4(a)). A majority of the fluorescence
emission directed back towards the microscope is gathered by the objective (depending upon
the numerical aperture) and projected into the eyepieces or detector. The result is a significant
amount of signal due to emitted background light and autofluorescence originating from areas
above and below the focal plane, which seriously reduces resolution and image contrast.
The laser illumination source in confocal microscopy is first expanded to fill the objective rear
aperture, and then focused by the lens system to a very small spot at the focal plane (Figure
4(b)). The size of the illumination point ranges from approximately 0.25 to 0.8 micrometers in
diameter (depending upon the objective numerical aperture) and 0.5 to 1.5 micrometers deep
at the brightest intensity. Confocal spot size is determined by the microscope design,
wavelength of incident laser light, objective characteristics, scanning unit settings, and the
specimen. Presented in Figure 4 is a comparison between the typical illumination cones of a
widefield (Figure 4(a)) and point scanning confocal (Figure 4(b)) microscope at the same
numerical aperture. The entire depth of the specimen over a wide area is illuminated by the
widefield microscope, while the sample is scanned with a finely focused spot of illumination
that is centered in the focal plane in the confocal microscope.
In laser scanning confocal microscopy, the image of an extended specimen is generated by
scanning the focused beam across a defined area in a raster pattern controlled by two high-
speed oscillating mirrors driven by galvanometer motors. One of the mirrors moves the beam
from left to right along the x lateral axis, while the other translates the beam in the y direction.
After each single scan along the x axis, the beam is rapidly transported back to the starting
point and shifted along the y axis to begin a new scan in a process termed flyback. During the
flyback operation, image information is not collected. In this manner, the area of interest on
the specimen in a single focal plane is excited by laser illumination from the scanning unit.
As each scan line passes along the specimen in the lateral focal plane, fluorescence emission
is collected by the objective and passed back through the confocal optical system. The speed
of the scanning mirrors is very slow relative to the speed of light, so the secondary emission
follows a light path along the optical axis that is identical to the original excitation beam. Return
of fluorescence emission through the galvanometer mirror system is referred to as descanning.
After leaving the scanning mirrors, the fluorescence emission passes directly through the
dichromatic mirror and is focused at the detector pinhole aperture. Unlike the raster scanning
pattern of excitation light passing over the specimen, fluorescence emission remains in a steady
position at the pinhole aperture, but fluctuates with respect to intensity over time as the
illumination spot traverses the specimen producing variations in excitation.
Fluorescence emission that is passed through the pinhole aperture is converted into an analog
electrical signal having a continuously varying voltage (corresponding to intensity) by the
photomultiplier. The analog signal is periodically sampled and converted into pixels by an
analog-to-digital (A/D) converter housed in the scanning unit or the accompanying electronics
cabinet. The image information is temporarily stored in an image frame buffer card in the
computer and displayed on the monitor. It is important to note that the confocal image of a
specimen is reconstructed, point by point, from emission photon signals by the photomultiplier
and accompanying electronics, yet never exists as a real image that can be observed through
the microscope eyepieces.
Laser Scanning Confocal Microscope Configuration
Basic microscope optical system characteristics have remained fundamentally unchanged for
many decades due to engineering restrictions on objective design, the static properties of most
specimens, and the fact that resolution is governed by the wavelength of light. However,
fluorescent probes that are employed to add contrast to biological specimens and, and other
technologies associated with optical microscopy techniques, have improved significantly. The
explosive growth and development of the confocal approach is a direct result of a renaissance
in optical microscopy that has been largely fueled by advances in modern optical and
electronics technology. Among these are stable multi-wavelength laser systems that provide
better coverage of the ultraviolet, visible, and near-infrared spectral regions, improved
interference filters (including dichromatic mirrors, barrier, and excitation filters), sensitive
low-noise wide band detectors, and far more powerful computers. The latter are now available
with relatively low-cost memory arrays, image analysis software packages, high-resolution
video displays, and high quality digital image printers. The flow of information through a
modern confocal microscope is presented diagrammatically in Figure 5.
Although many of these technologies have been developed independently for a variety of
specifically-targeted applications, they have been gradually been incorporated into mainstream
commercial confocal microscopy systems. In current microscope systems, classification of
designs is based on the technology utilized to scan specimens. Scanning can be accomplished
either by translating the stage in the x, y, and z directions while the laser illumination spot is
held in a fixed position, or the beam itself can be raster-scanned across the specimen. Because
three-dimensional translation of the stage is cumbersome and prone to vibration, most modern
instruments employ some type of beam-scanning mechanism.

In modern confocal microscopes, two fundamentally different techniques for beam scanning
have been developed. Single-beam scanning, one of the more popular methods employed in a
majority of the commercial laser scanning microscopes, uses a pair of computer-controlled
galvanometer mirrors to scan the specimen in a raster pattern at a rate of approximately one
frame per second. Faster scanning rates (to near video speed) can be achieved using acousto-
optic devices or oscillating mirrors. In contrast, multiple-beam scanning confocal
microscopes are equipped with a spinning Nipkow disk containing an array of pinholes and
microlenses. These instruments often use arc-discharge lamps for illumination instead of lasers
to reduce specimen damage and enhance the detection of low fluorescence levels during real
time image collection. Another important feature of the multiple-beam microscopes is their
ability to readily capture images with an array detector, such as a charge-coupled device (CCD)
camera system.
All laser scanning confocal microscope designs are centered around a conventional upright or
inverted research-level optical microscope. However, instead of the standard tungsten-halogen
or mercury arc-discharge lamp, one or more laser systems are used as a light source to excite
fluorophores in the specimen. Image information is gathered point by point with a specialized
detector such as a photomultiplier tube or avalanche photodiode, and then digitized for
processing by the host computer, which also controls the scanning mirrors and/or other devices
to facilitate the collection and display of images. After a series of images (usually serial optical
sections) has been acquired and stored on digital media, analysis can be conducted utilizing
numerous image processing software packages available on the host or a secondary computer.
Advantages and Disadvantages of Confocal Microscopy
The primary advantage of laser scanning confocal microscopy is the ability to serially produce
thin (0.5 to 1.5 micrometer) optical sections through fluorescent specimens that have a
thickness ranging up to 50 micrometers or more. The image series is collected by coordinating
incremental changes in the microscope fine focus mechanism (using a stepper motor) with
sequential image acquisition at each step. Image information is restricted to a well-defined
plane, rather than being complicated by signals arising from remote locations in the specimen.
Contrast and definition are dramatically improved over widefield techniques due to the
reduction in background fluorescence and improved signal-to-noise. Furthermore, optical
sectioning eliminates artifacts that occur during physical sectioning and fluorescent staining of
tissue specimens for traditional forms of microscopy. The non-invasive confocal optical
sectioning technique enables the examination of both living and fixed specimens under a
variety of conditions with enhanced clarity.
With most confocal microscopy software packages, optical sections are not restricted to the
perpendicular lateral (x-y) plane, but can also be collected and displayed in transverse planes.
Vertical sections in the x-z and y-z planes (parallel to the microscope optical axis) can be
readily generated by most confocal software programs. Thus, the specimen appears as if it had
been sectioned in a plane that is perpendicular to the lateral axis. In practice, vertical sections
are obtained by combining a series of x-y scans taken along the z axis with the software, and
then projecting a view of fluorescence intensity as it would appear should the microscope
hardware have been capable of physically performing a vertical section.
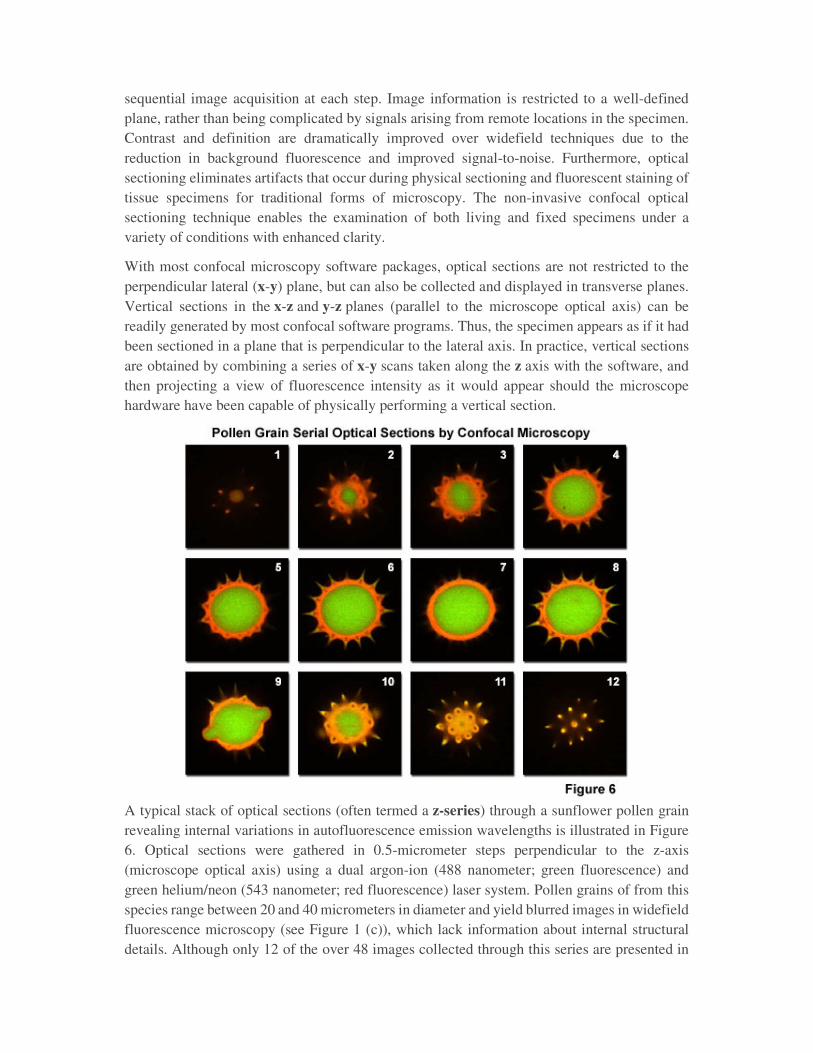
A typical stack of optical sections (often termed a z-series) through a sunflower pollen grain
revealing internal variations in autofluorescence emission wavelengths is illustrated in Figure
6. Optical sections were gathered in 0.5-micrometer steps perpendicular to the z-axis
(microscope optical axis) using a dual argon-ion (488 nanometer; green fluorescence) and
green helium/neon (543 nanometer; red fluorescence) laser system. Pollen grains of from this
species range between 20 and 40 micrometers in diameter and yield blurred images in widefield
fluorescence microscopy (see Figure 1 (c)), which lack information about internal structural
details. Although only 12 of the over 48 images collected through this series are presented in

the figure, they represent individual focal planes separated by a distance of approximately 3
micrometers and provide a good indication of the internal grain structure.
In specimens more complex than a pollen grain, complex interconnected structural elements
can be difficult to discern from a large series of optical sections sequentially acquired through
the volume of a specimen with a laser scanning confocal microscope. However, once an
adequate series of optical sections has been gathered, it can be further processed into a three-
dimensional representation of the specimen using volume-rendering computational techniques.
This approach is now in common use to help elucidate the numerous interrelationships between
structure and function of cells and tissues in biological investigations. In order to ensure that
adequate data is collected to produce a representative volume image, the optical sections should
be recorded at the appropriate axial (z-step) intervals so that the actual depth of the specimen
is reflected in the image.
Most of the software packages accompanying commercial confocal instruments are capable of
generating composite and multi-dimensional views of optical section data acquired from z-
series image stacks. The three-dimensional software packages can be employed to create either
a single three-dimensional representation of the specimen (Figure 7) or a video (movie)
sequence compiled from different views of the specimen volume. These sequences often mimic
the effect of rotation or similar spatial transformation that enhances the appreciation of the
specimen's three-dimensional character. In addition, many software packages enable
investigators to conduct measurements of length, volume, and depth, and specific parameters
of the images, such as opacity, can be interactively altered to reveal internal structures of
interest at differing levels within the specimen.
Typical three-dimensional representations of several specimens examined by serial optical
sectioning are presented in Figure 7. The pollen grain optical sections illustrated in Figures 1
and 6 were combined to produce a realistic view of the exterior surface (Figure 7(a)) as it might
appear if being examined by a scanning electron microscope. The algorithm utilized to
construct the three-dimensional model enables the user to rotate the pollen grain through 360
degrees for examination. The tissue culture cells in Figure 7(b) are derived from the Chinese
hamster ovary (CHO) line and were transfected with a chimeric plasmid vector containing the
green fluorescent protein and a human immunodeficiency virus (HIV) protein that is expressed
in the nucleus (thus, labeling the nuclear region). Thick tissue sections are also easily viewed
in three-dimensions constructed from optical sections. The mouse intestine section illustrated
in Figure 7(c) was labeled with several fluorophores and created from a stack of 45 optical
sections.

In many cases, a composite or projection view produced from a series of optical sections
provides important information about a three-dimensional specimen than a multi-dimensional
view. For example, a fluorescently labeled neuron having numerous thin, extended processes
in a tissue section is difficult (if not impossible) to image using widefield techniques due to
out-of-focus blur. Confocal thin sections of the same neuron each reveal portions of several
extensions, but these usually appear as fragmented streaks and dots and lack continuity.
Composite views created by flattening a series of optical sections from the neuron will reveal
all of the extended processes in sharp focus with well-defined continuity. Structural and
functional analysis of other cell and tissue sections also benefits from composite views as
opposed to, or coupled with, three-dimensional volume rendering techniques.
Advances in confocal microscopy have made possible multi-dimensional views of living cells
and tissues that include image information in the x, y, and z dimensions as a function of time
and presented in multiple colors (using two or more fluorophores). After volume processing of
individual image stacks, the resulting data can be displayed as three-dimensional multicolor
video sequences in real time. Note that unlike conventional widefield microscopy, all
fluorochromes in multiply labeled specimens appear in register using the confocal microscope.
Temporal data can be collected either from time-lapse experiments conducted over extended
periods or through real time image acquisition in smaller frames for short periods of time. The
potential for using multi-dimensional confocal microscopy as a powerful tool in cellular
biology is continuing to grow as new laser systems are developed to limit cell damage and
computer processing speeds and storage capacity improves.
Additional advantages of scanning confocal microscopy include the ability to adjust
magnification electronically by varying the area scanned by the laser without having to change
objectives. This feature is termed the zoom factor, and is usually employed to adjust the image
spatial resolution by altering the scanning laser sampling period. Increasing the zoom factor
reduces the specimen area scanned and simultaneously reduces the scanning rate. The result is
an increased number of samples along a comparable length, which increases both the image
spatial resolution and display magnification on the host computer monitor. Confocal zoom is
typically employed to match digital image resolution with the optical resolution of the
microscope when low numerical aperture and magnification objectives are being used to collect
data.
Digitization of the sequential analog image data collected by the confocal microscope
photomultiplier (or similar detector) facilitates computer image processing algorithms by

transforming the continuous voltage stream into discrete digital increments that correspond to
variations in light intensity. In addition to the benefits and speed that accrue from processing
digital data, images can be readily prepared for print output or publication. In carefully
controlled experiments, quantitative measurements of spatial fluorescence intensity (either
statically or as a function of time) can also be obtained from the digital data.
Disadvantages of confocal microscopy are limited primarily to the limited number of excitation
wavelengths available with common lasers (referred to as laser lines), which occur over very
narrow bands and are expensive to produce in the ultraviolet region. In contrast, conventional
widefield microscopes use mercury or xenon based arc-discharge lamps to provide a full range
of excitation wavelengths in the ultraviolet, visible, and near-infrared spectral regions. Another
downside is the harmful nature of high-intensity laser irradiation to living cells and tissues (an
issue that has recently been addressed by multiphoton and Nipkow disk confocal imaging).
Finally, the high cost of purchasing and operating multi-user confocal microscope systems,
which can range up to an order of magnitude higher than comparable widefield microscopes,
often limits their implementation in smaller laboratories. This problem can be easily overcome
by cost-shared microscope systems that service one or more departments in a core facility. The
recent introduction of personal confocal systems has competitively driven down the price of
low-end confocal microscopes and increased the number of individual users.
Immunolabeling
So, Immunolabeling is a biochemical process that enables the detection and localization of an
antigen to a particular site within a cell (immunocytochemistry), tissue, or organ
(immunohistochemistry). These antigens can be visualized using a combination of
antigenspecific antibody as well as a means of detection, called a tag, that is covalently linked
to the antibody. The antibodies with fluorescent dyes can react with their antigen within a cell
and allow visualization of the distribution of proteins, glycans, and small biological and
nonbiological molecules. There are two complex steps in the manufacture of antibody for
immunolabeling. The first (direct method) as you can see is by producing an antibody that
binds specifically to the antigen of interest. Now here the antibody is fused to a Fluorophore.
Second, an indirect method employs a primary antibody that is antigen-specific and a
secondary antibody fused to a fluorophore that specifically binds the primary antibody.
Sample Preparation
For Unstained cells
Seed the cells in tissue culture dishes/flasks. Keep the tissue culture dishes/flasks in incubator
(37 ̊C, 5% CO2) for 24 hours for proliferation. Observe the cells under microscope.
For Immuno-stained/immunolabelled cells
1. Coat coverslips with polyethylineimine or poly-L-lysine for 1 hr at room temperature or use
coated tissue culture dishes.
2. Rinse coverslips well with sterile H2O (three times 5 min each).
3. Allow coverslips to dry completely and sterilize them under UV light for at least 4 hr.

4. Grow cells on glass coverslips/ tissue culture dishes or prepare cytospin or smear
preparation.
5. Rinse briefly in phosphate-buffered saline (PBS).
• Fixation
1. Fix the samples either in ice-cold methanol, acetone (1-10 min) or in 3-4% paraformaldehyde
in PBS, pH 7.4 for 15 mins-60 mins at room temperature.
2. Wash the samples twice with ice cold/room temperature PBST (phosphate-buffered saline
with Tween 20).
• Permeabilization
If the target protein is localized intracellularly, it is very important to permeabilize the cells.
1. Incubate the samples for 10 mins-15 mins with PBS containing 0.25% Triton X-100 (or 100
μM Digitonin or 0.5% Saponin). Triton X-100 is the most popular detergent for improving the
penetration of the antibody. However, it is not appropriate for membrane-associated antigens
since it destroys membranes.
2. Wash cells in PBST three times for 5 min.
• Blocking and Immunostaining
1. Incubate cells with 1% BSA in PBST for 30 min to block unspecific binding of the antibodies
(alternative blocking solutions are 1% gelatin or 10% serum from the species from which the
secondary antibody was raised in).
2. Incubate cells in the diluted primary antibody in 1% BSA in PBST in a humidified chamber
for 1 hr at room temperature or overnight at 4°C.
3. Decant the solution and wash the cells three times in PBST, 5 min each wash.
4. Incubate cells with the secondary antibody in 1% BSA in PBST for 1 hr at room temperature
in the dark.
5. Decant the secondary antibody solution and wash three times with PBST for 5 min each in
the dark.