demonstration of cytochrome reductases in rat liver ... of cytochrome reductases in rat liver...
TRANSCRIPT

Demonstration of cytochrome reductases in rat liver peroxisomes: biochemical and immunochemical analyses
Cecilia Gutierrez, * Richard Okita,t and Skaidrite Krisans""
Department of Biology and Molecular Biology Institute,* San Diego State University, San Diego, CA 92182, and Department of Biochemistry,t Medical College of Wisconsin, Milwaukee, WI 53226
Abstract In this study we utilized the analytical cell fractiona- tion approach in combination with immunoblotting techniques and immunoelectron microscopy to test for the presence of NADPH cytochrome P-450 reductase and NADH cytochrome c (b5) reductase in rat liver peroxisomes. Highly purified peroxi- somes from clofibrate-treated rats exhibited both NADPH cyto- chrome P-450 reductase activity and NADH cytochrome c reductase activity (using cytochrome c as an electron acceptor). These activities were inhibited by the respective reductase anti- bodies made against the endoplasmic reticulum (ER) enzymes. Immunoblot data in combination with immunoelectron micros- copy indicated that the peroxisomal NADPH cytochrome P-450 reductase is localized in the matrix of the organelle and has a subunit of molecular weight similar to that of the ER enzyme, whereas the NADH cytochrome c (b5) reductase is localized in the membranes of the peroxisomes. Again, the subunit molecu- lar weight was similar to that of the ER enzyme. 8 The presence of these reductases in peroxisomes further supports the role of this organelle in bile acid synthesis and cholesterol metabolism. - Gutierrez, C., R. Okita, and S. Krisans. Demonstration of cytochrome reductases in rat liver peroxi- somes: biochemical and immunochemical analyses. J Lipid Res. 1988. 29: 613-628.
Supplementary key words immunoblotting - immunoelectron microscopy NADPH cytochrome P-450 reductase NADH cyto- chrome c reductase
Recent data from human peroxisomal disorders strong- ly suggest that peroxisomes may play an important role in bile acid synthesis (1). Furthermore, peroxisomal fractions obtained from rat liver have the ability to oxidize 3a,7a,l2a-trihydroxy-5~-cholestanoic acid (THCA), an intermediate product of cholesterol metabolism, to cholic acid (2, 3), and to convert cholesterol to propionic acid (the expected three-carbon side-chain cleavage product) (4). Highly purified rat liver peroxisomes (95-98%) are also able to oxidize 26-hydroxycholesterol, the product of C-26 hydroxylation of cholesterol, to a C-24 bile acid (5). We have recently obtained evidence for the presence of
hydroxylase activity in rat liver peroxisomes that catalyzes the conversion of 3a,7a,l2a-trihydroxy-5~-cholestane (THC) to a cholestanetetrol (6). The hydroxylation of the C-26(27) position of the side chain of cholesterol and the hydroxylation of THC is known to be catalyzed in micro- somes and/or mitochondria by a P-450 cytochrome system, involving either NADPH cytochrome P-450 reductase (microsomes) (7, 8) or a NADPH ferrodoxin reductase (mitochondria) (9-11). In the microsomal NADPH- supported system, cytochrome b5 may also donate the second electron to cytochrome P-450 (12).
Whether or not the peroxisomal hydroxylase is a P-450 cytochrome has yet to be determined. This study was designed to investigate whether rat liver peroxisomes con- tain cytochrome reductases. A number of investigators have reported the presence of cytochrome b5 and NADH cytochrome c (b5) reductase in peroxisomes (13-17). However, at the time of these earlier studies, techniques were not readily available to obtain 98% pure peroxi- somes, and optimal conditions for peroxisomal separation from lysosomes required treatment of the animals with Triton WR-1339, which is known to affect lipid metabo- lism and possibly the cytochrome system. In the present study we utilized the analytical cell fractionation approach for demonstrating the presence of NADPH cytochrome P-450 reductase and NADH cytochrome c (b5) reductase in highly purified rat liver peroxisomes in combination with immunoblotting techniques and immunoelectron microscopy. Since microsomes are the only contaminant found in the purified peroxisomal fractions, the endo- plasmic reticulum cytochrome reductases were analyzed in detail for comparison with those of the peroxisomes.
'To whom correspondence should be addressed.
Journal of Lipid Research Volume 29, 1988 613
by guest, on May 20, 2018
ww
w.jlr.org
Dow
nloaded from

MATERIALS AND METHODS
Animals
Male Sprague-Dawley rats (170-220 g) were used in this study. Standard lab chow or standard lab chow sup- plemented with 0.5% clofibrate w/w was provided ad libi- tum for at least 10 days. Animals were fasted overnight and killed by a guillotine.
Cell fractionation
Liver homogenates were fractionated into v , X, and $ fractions as described by Leighton et al. (18) except that preinjection of rats with Triton WR-1339 was omitted and the X fraction was washed only once. The v fraction con- tains the nuclei and most of the mitochondria, the X frac- tion is enriched in peroxisomes and lysosomes (similar to the L fraction of de Duve et al. (19)) and the $ fraction contains the majority of microsomes and soluble compo- nents. The X fraction was then further separated by cen- trifugation on a steep linear metrizamide (20-50% w/w) or Nycodenz (1040% w/v) gradient (20, 21). Routinely, 6 ml of the X fraction prepared from six rat livers was loaded on top of a 27-ml linear gradient. The gradient was centrifuged in a Sorvall OTD 75B centrifuge using a TV 850 ultra-vertical rotor at 40,000 rpm for 50 min at 8OC. A total of 20-25 fractions were collected from the bottom of the centrifuge tube with a two-way needle. Rat liver microsomes were prepared by separating the $ frac- tion into a microsomal and a soluble fraction by centrifu- gation at 100,000 g for 60 min. All cell fractions were assayed for protein content, cytochrome reductase activi- ties, and distribution of marker enzyme activities.
Assay of marker enzymes
Catalase and cytochrome oxidase activities were mea- sured according to Leighton et al. (18), and Lazarow and de Duve (22), except that a molar absorptivity of 19 mM-'cm-' for cytochrome c was used (23). Esterase was measured according to Beaufay et al. (24). Enzyme units are in ,umol/min except for catalase which is expressed in the units used by Leighton et al. (18). Protein was deter- mined by the method of Lowry et al. (25) using bovine serum albumin as a standard. Since metrizamide and Nycodenz interfere with the determination of protein, ali- quots of the gradient samples were first precipitated in 10% E A (trichloroacetic acid).
Assay of cytochrome reductases
NADPH cytochrome P-450 reductase and NADH cytochrome c reductase were measured according to Beaufay et al. (24). In both cases, the reduction of cytochrome c was monitored at 550 nm using the milli- molar extinction coefficient of 19.6. NADPH cytochrome
P-450 reductase was measured in the presence of 2.25 mM NADPH, while NADH cytochrome c reductase was measured with 2.25 mM NADH. NADH ferricyanide reductase (cytochrome b5 reductase) was also determined according to Katsuyoshi and Sat0 (26), by following the reduction of ferricyanide. Measurements were done at 420 nm using the millimolar extinction coefficient of 1.02. Neither metrizamide nor Nycodenz was found to be in- hibitory in the reductase assays using the microsomal fraction (prepared in 0.25 M sucrose) as a source of enzyme.
isolation of membranes
Purified peroxisomal fractions (95-98 % pure) prepared by equilibrium density gradient centrifugation and a purified microsomal fraction ( > 92 7% pure) were treated with sodium carbonate as described by Fujiki et al. (27). The membranes isolated by this technique retain integral membrane enzymes in active form and exhibit a normal trilaminar appearance.
Fixation of samples for immunoelectron microscopy
Small blocks of liver from clofibrate-fed animals were chopped in 3% formaldehyde, 0.5% glutaraldehyde in 0.1 M phosphate buffer (pH 7.4), and immersed in the same fixative for 1 hr. After washing in 0.1 M phosphate buffer (pH 7.2), the blocks were infused with 2.3 M sucrose and ultrathin sections were obtained as described below.
Cryoultramicrotomy
Ultrathin frozen sections were cut with a glass knife at -88OC, according to the method of Tokuyasu (28) in a Dupont-Sorval ultramicrotome MT-2 equipped with the LE-:! cryoattachment. Ultrathin sections were transferred onto Formvar-coated copper grids and immunolabeled.
immunolabeling
For immunolabeling experiments, the primary reagent was the antibody to rat liver ER NADPH cytochrome P-450 reductase or NADH cytochrome c (b5) reductase. The secondary reagent was colloidal gold adducts of affinity-purified guinea pig antibodies to rabbit IgG. Col- loidal gold particles of 6-8 nm diameter and the adduct were prepared as previously described (29). After im- munolabeling, the grids were either treated with 2% osmium tetroxide, poststained in uranyl acetate and in- fused with LR white acrylic resin (London Resin Co. Ltd.) (29), or the grids were floated on 2 % neutral uranyl acetate for 10 min, briefly washed in distilled water, and embedded in a solution containing 2% carbowax (mol wt 1540), 0.2% methyl cellulose (400 centiposes), and 0.02% aqueous uranyl acetate. After polymerization or drying, the grids were examined without poststaining in a Philips
614 Journal of Lipid Research Volume 29, 1988
by guest, on May 20, 2018
ww
w.jlr.org
Dow
nloaded from

model 300 transmission electron microscope at 80 kV equipped with an 11-pm diameter aperture.
Immunoblotting Microsomal and peroxisomal proteins were separated
on 12.5% polyacrylamide, 0.1% SDS slab gels (1.5 mm) according to Laemmeli (30). Electrophoresis was performed at 35 mA/gel constant current. Protein samples were pre- pared in solubilizing buffer (0.5 M Tris-HC1, pH 6.8, 2 % SDS, 5% P-mercaptoethanol, 5% glycerol, and 0.005% bromophenol blue) and incubated for 2-3 min in a boiling waterbath prior to loading. A mixture of molecular weight standards was routinely applied to the gel. This included: phosphorylase b, 92,500; bovine serum albumin, 66,200; ovalbumin, 45,000; carbonic anhydrase, 31,000; soybean trypsin inhibitor, 21,500; and lysozyme, 14,000.
These separated proteins were electrophoretically trans- ferred to nitrocellulose paper in 20 mM Tris, 150 mM gly- cine, and 20% methanol. The nitrocellulose was incubated for 60 min at 37°C with 5% BSA Tris-saline, pH 7.4, in a gently shaking waterbath followed by overnight incuba- tion with the specific antibody at 4OC. This was followed by 90 min incubation with 1251-labeled protein A. The proteins of interest were visualized by exposing the nitro- cellulose to Kodak XRP X-ray film at -70°C for 2 to 3 days.
Immunoprecipitation
Increasing concentrations of cytochrome P-450 reduc- tase antibody were bound to 20 mg of Sepharose-A beads by incubating for 1 hr at room temperature in 0.2 ml of PBS (0.1 M Na3P04, 0.15 M NaCl, pH 7.5). The anti- body-Sepharose-A beads complex was washed and pelleted three times with 0.5 ml of PBS. The washes were dis- carded. Peroxisomal protein (1.6 mg) solubilized by freeze- thaw and microsomal protein (1.6 mg) were added to the beads and incubated in PBS for 2 hr at room temperature. All incubations were carried out with gentle continuous agitation. The beads were pelleted by a 5-sec centrifuga- tion in a microcentrifuge, and the supernatants were re- moved and immediately assayed for NADPH cytochrome P-450 reductase activity. Under these conditions, only the beads with reacted antigen are pelleted. The beads were washed twice with 0.1% Triton X-100 in PBS, twice with 0.1% ovalbumin in PBS, and twice with PBS. SDS solu- bilizing buffer was added to the beads followed by 2 min boiling and immediate freezing. The Sepharose beads were then subjected to regular SDS-PAGE, immunoblotted, and the antigen-antibody complex was detected by the 1251-labeled protein A method. Control samples consisted of Sepharose-A beads incubated with peroxisomal or microsomal protein in the absence of antibody.
Computer calculations
The distribution of cytochrome reductase activities in the various organelle fractions was evaluated quantitatively by means of a computer program that calculates optimal linear combinations of marker enzymes using a least squares criterion (31). This linear regression program was augmented to include the T-values and probabilities for the least-squares regression coefficients. With these addi- tions we can state at the 95% confidence level which dis- tributions of test enzymes are significant.
Materials
1251-Labeled protein A was purchased from New England Nuclear. Autoradiography film and reagents were obtained from Merry X-Ray (San Diego, CA). Other chemicals were from Sigma. Polyclonal antibodies to rat NADPH cytochrome P-450 reductase and NADH cytochrome c (b5) reductase were a generous gift from Dr. B. S. Masters (Medical College of Wisconsin, Milwaukee, WI).
RESULTS
Equilibrium density centrifugation
The peroxisome-enriched fraction prepared by differen- tial centrifugation of liver homogenates from control animals was subjected to isopycnic centrifugation in order to separate the organelles on the basis of their different densities. All the fractions were assayed for protein, cyto- chrome oxidase activity (a mitochondrial marker), esterase activity (a microsomal marker), catalase activity (a perox- isomal marker), and for the three cytochrome reductase activities. NADPH cytochrome P-450 reductase was assayed using cytochrome c as an electron acceptor, and NADH cytochrome c reductase was assayed by use of cytochrome c and potassium ferricyanide as electron ac- ceptors. The designation of NADH ferricyanide reductase was employed when potassium ferricyanide (K,Fe(CN),) was the electron acceptor. Fig. 1 illustrates the charac- teristics of one of three gradients. The mitochondria and microsomes were responsible for the major peak of pro- tein, and the peroxisomes were coincident with the minor peak of protein (A). The intact peroxisomes (B) were located at the dense end of the gradient (to the right in Fig. 1) and were well separated from the microsomes (C) and the mitochondria (data not shown). The mitochon- drial distribution in these gradients was similar to that reported previously (32). The minor peak of catalase ac- tivity (B) sedimenting at the light end of the gradient (to the left in Fig. 1) represents solubilized catalase activity due to breakage of peroxisomes. Lysosomes sediment at the far left of the gradient in this system (data not shown). The only minor contamination of the peak peroxisomal
Gutiewez, Okita, and Krisanr Cytochrome reductases in rat liver peroxisomes 615
by guest, on May 20, 2018
ww
w.jlr.org
Dow
nloaded from

0 50 100 0 50 100
CATALASE (PEROXISOMES) CYTOCHROME C REDUCTASE
4 0 7 ' 5 0 1 E
z - z
a U 0 - 0 -
z U E
W 0 - ' 0 - 8 2 0 - 8 2 5 - W W 2 - E - 4 - 4 U U
o n 00 0 50 100 0 50 100
ESTERASE (MICROSOMES)
CYTOCHROME FERRICYANIDE REDUCTASE S o l F
0 50 100
VOLUME (% of totall
0 50 100
VOLUME (% of Iotal)
Fig. 1. Separation of peroxisomes from other cell organelles from normal rat liver. The ordinate, relative concentration, is derived by dividing the actual concentration of the enzyme in a particular fraction by the concentration of the enzyme that would be observed if the enzyme were homoge- neously distributed throughout the gradient. The abscissa is normalized cumulative volume (total volume was 32 ml). The density of the gradient increases from left to right. Cytochrome P-450 reductase was measured in the presence of cytochrome c and NADPH. Cytochrome c reductase was measured in the presence of cytochrome c and NADH. Cytochrome ferricyanide reductase was measured in the presence of ferricyanide and NADH. The recoveries of all enzyme activities ranged from 70 to 97%.
fractions was due to a 4-6% microsomal contribution as determined by marker enzyme analysis (27). The distri- bution patterns of the three cytochrome reductase activi- ties (D, E, F) showed very little activity coincident with the purified peroxisomal fraction area. All of this activity could be accounted for by the slight microsomal contami- nation present at this end of the gradient. The data indi- cate that normal rat liver peroxisomes do not contain any of the above three cytochrome reductase activities.
We next looked for the presence of cytochrome reductase activities in peroxisomes from liver obtained after clofibrate
treatment of animals. Clofibrate is a known peroxisomal proliferator (33, 34). The results of a typical gradient are illustrated in Fig. 2. The protein distribution (A) showed a major peak coincident with the microsomes (C) and the mitochondria (data not shown), and a minor peak coinci- dent with the peroxisomes (B). The peroxisomes were well separated from other cell organelles and sediment at the dense end of the gradient (to the right in Fig. 2), and showed very little damage as measured by solubilized catalase (the left end of the gradient). Purity calculations of the peroxisomes indicated 98% purity in the peak frac-
616 Journal of Lipid Research Volume 29, 1988
by guest, on May 20, 2018
ww
w.jlr.org
Dow
nloaded from

PROTEIN 3 0 , D CYTOCHROME P-450 REDUCTASE
z 0 t U +- z W
0 z s W 2 a 2 W
(I
z 0 < + z W
0 z 0 0 W
2 t
W U I!
z
+ U t
z W 0 z
0
s W
c
Lu
2 4 a
0 50 100
CATALASE (PEROXISOMES1
ESTERASE
(MICROSOMES)
0 50 100
CYTOCHROME C REDUCTASE
z
Q c z W
0 z 2 5 -
. o
0, W
t
W U
2 5
0 0 0 5 0 100
CYTOCHROME FERRICYANIDE REDUCTASE
501
0 50 100
VOLUME ( % of total)
0 50 100
VOLUME ( % of totall
Fig. 2. Separation of peroxisomes from other cell organelles from liver of clofibrate-treated rats. The distribution of marker enzymes is plotted as relative concentration versus normalized cumulative volume (total volume was 32 ml). The density of the gradient increases from left to right. ?'he recoveries of all enzyme activities ranged from 80 to 95%.
tions. The distribution patterns of NADPH cytochrome P-450 reductase and NADH cytochrome c reductase ac-
Peroxisomal contribution to total liver cytochrome reductase activities
tivities showed two peaks, a large peak cosedimenting with microsomes and a smaller peak cosedimenting with peroxisomes. The distribution pattern of NADH ferri- cyanide reductase showed only one peak of enzyme ac- tivity, coincident with microsomes. These results indicate that peroxisomes from clofibrate-treated rats contain NADPH cytochrome P-450 reductase activity and NADH cytochrome c reductase activity, but not NADH ferri- cyanide reductase activity.
The percent of cytochrome reductase activities localized in the peroxisomes was determined from the differential centrifugation and density gradient data by applying the principle of calculating the linear combinations of marker enzyme distributions that would best fit the measured cytochrome reductase distributions. This method has been described in detail (31). This program makes use of all data from the fractionation procedure instead of merely
Gutierrez, Okita, and Krisans Cytochrome reductases in rat liver peroxisomes 617
by guest, on May 20, 2018
ww
w.jlr.org
Dow
nloaded from

the few purest fractions. The method also requires good recoveries in the cell fractionations and assumes biochem- ical homogeneity. This linear regression program was aug- mented to include the T-values and probabilities for the least-squares regression coefficients. With these additions we can state at the 95% confidence level which distribu- tions of cytochrome reductase enzymes are significant. Table 1 shows the percent of peroxisomal contribution to total liver cytochrome reductase activities from clofibrate- treated rats. We calculated a 10% peroxisomal contribu- tion of NADPH cytochrome P-450 reductase activity and a 5.5% peroxisomal contribution of NADH cytochrome c reductase activity. When NADH ferricyanide reductase was measured by K,Fe(CN), reduction, an average of less than 1% contribution was calculated. However, this level of activity is not significant at the 95% confidence level.
Specific activities of cytochrome reductases in peroxisomal and microsomal fractions
The specific activities of the cytochrome reductases were calculated for the most highly purified fractions ob- tained for each organelle. The purity of peroxisomes from clofibrate-treated animals was calculated to be between 96 and 99% based on the measurement of marker enzymes (27). The activities of marker enzymes for mitochondria and lysosomes in these fractions were below the level of detection. The only minor contaminant was the ER. The microsome fraction was calculated to be 92 to 94% pure. Table 2 shows the specific activities of the cytochrome reductases in peroxisomal and microsomal fractions from liver of clofibrate-treated rats. Esterase activity (the marker enzyme for the ER) is also listed. As can be seen from the ratio of specific activities, the presence of NADPH cytochrome P-450 reductase activity and NADH cytochrome c reductase activity in peroxisomes cannot be attributed to the minor microsomal contamination (ratio of specific activities are greater than 0.03). However, the presence of NADH ferricyanide reductase activity in per- oxisomes could be attributed to the microsomal contami- nation of peroxisomes. These data were in agreement with the linear combination calculations.
TABLE 1 . Peroxisomal contribution to total liver cytochrome reductase activities from clofibrate-treated rats
Percent Activity"
Enzyme Mean Range
NADPH cytochrome P-450 reductase 10.0 5.8- 14.2 NADH cytochrome c reductase 5.5 5.5-5.6 NADH ferricyanide reductase 0.9b 0.1-1.6
'Mean of three density gradient centrifugations 'Not significant at the 95% confidence level.
NADPH cytochrome P-450 reductase
Immunoprecipitation of cell fractions. Solubilized proteins (freeze-thaw) from a highly purified peroxisomal fraction (98%) obtained after density gradient centrifugation and a microsomal fraction obtained after differential centrifu- gation from clofibrate-treated animals were immunopre- cipitated with increasing concentrations of NADPH cyto- chrome P-450 reductase antibody and the supernatant was assayed as described in Materials and Methods. Fig. 3 illustrates that in both the peroxisomal and microsomal preparations the enzymatic activity decreases with the addition of antibody (IgG fraction). Approximately 90% of the peroxisomal activity is immunoprecipitated by 1.9 pg of antibody. About 70% of the microsomal activity is immunoprecipitated at this concentration. No inhibition of activity was observed with either peroxisomal or microsomal samples incubated with Sepharose-A beads in the absence of antibody.
Several of the immunoprecipitated fractions (pellets) were subjected to SDS-PAGE, electrophoretically trans- ferred to nitrocellulose paper, and the antigen-antibody complex was detected by '251-labeled protein A. Fig. 4 shows the results for the peroxisomal samples. Lane 1 was the control sample wiih Sepharose-A beads in the absence of antibody. Lanes 2 and 3 exhibited one protein band with an apparent Mr of 78 kDa. The microsomal samples also displayed one protein band with a similar M, of 78
TABLE 2. Specific activities of enzymes in peroxisomal and microsomal fractions from liver of clofibrate-treated rats' ~~~
NADPH-C ytochrome P-450 Reductase
NADH-Cytochrome c Reductase
NADH-Ferricyanide Reductase Esterase
pmoUmin pm mg
Peroxisomes (4)b 0.06 f 0.04 (4) 0.10 f 0.05 (4) 0.49 f 0.22 (4) 0.15 f 0.03 Microsomes (3) 0.13 f 0.03 (3) 0.50 0.25 Ratio of SD act' 0.46 0.20 0.08 0.03
(3) 5.9 f 2.6 (3) 5.2 i 0.6
"All values given as mean and SD. Specific activity is defined as pmol of substrate utilized per minute per mg of organelle protein 'The numbers in parentheses refer to number of samples analyzed. 'Specific activity in peroxisomes
Specific activity in microsomes
618 Journal of Lipid Research Volume 29, 1988
by guest, on May 20, 2018
ww
w.jlr.org
Dow
nloaded from

100 PEROXISOMES 100 a
YCROSOMES
6 8 0 -
E g z 8 I-
8 6 0 -
0
z
0
hi 40 - A z w
8 60 - 8 U
A 8 I- 40 - W 0
A n
8
8
g 2 0 - A f j 2 0 -
0
ANTIBODY (ug) B ANTIBODY (ug) 0 1 2 0 1 2
I I 1 I 0
A
Fig. 3. Immunoprecipitation of (A) peroxisomal and (B) microsomal NADPH cytochrome P-450 reductase activity by antibody to the microsomal reductase. Ninety-eight percent pure peroxisomal fractions solubilized by freeze-thaw and 93% pure microsomal fractions from clofibrate-treated animals were immunoprecipitated with increasing concentrations of antiserum ( I g G fraction) and the supernatant was assayed for enzyme activity as described in Materials and Methods.
kDa, consistent with previous reports (data not shown). Immunoblot analysis of normal rat liver peroxisomes
also demonstrated the presence of a 78 kDa protein, but in much lower quantity. This finding is in agreement with the inability to measure any NADPH cytochrome P-450 reductase activity in normal rat liver peroxisomes (Fig. 1).
Immunoblotting of peroxisomal and microsomal membranes. The native microsomal NADPH cytochrome P-450 reductase is known to be an integral membrane protein localized on the cytoplasmic side of the membrane (35- 37). In order to determine the subcellular location of the peroxisomal protein, we prepared membranes from highly purified peroxisomes (98%) from clofibrate-treated animals. The membranes were prepared by the carbonate method (27). The membranes isolated by this technique retained integral membrane enzymes in active form and exhibited a normal trilaminar appearance (27). Since approxi- mately 10% of total peroxisomal protein was membrane protein, membrane protein equivalent to this was used. Fig. 5 clearly shows that the peroxisomal protein reacting with the NADPH cytochrome P-450 reductase antibody was located in the peroxisomal matrix (soluble fraction) (lane 2) and not in the membrane fraction (lane 1). Identi- cal results are obtained when higher concentrations of peroxisomal membrane proteins are used. The same pro- cedure was performed to prepare pure microsomal mem- branes from microsomes isolated from clofibrate-treated animals. Again, since approximately 30 to 50% of micro- somal protein was membrane protein, membrane protein equivalent to this was used. Fig. 6 confirmed the mem- brane localization of microsomal NADPH cytochrome P-450 reductase. Lane 2 (microsomal membrane protein) and lane 3 (microsomes) were the only lanes exhibiting the 1251-labeled protein A antibody-antigen complex. These results demonstrate the presence of a protein in the
M.W. 1 2 3
9 2.5-
66.2-
4 5.0-
31.0-
21.5 -
14.4 -
Fig. 4. Immunoblot of peroxisomal samples immunoprecipitated with NADPH cytochrome P-450 reductase antibody. Autoradiograph shows '251-labeled protein A antibody-antigen complex. Lane 1, control, Sepharose-A beads only; lane 2, immunoprecipitated with 0.24 pg of antibody; lane 3, immunoprecipitated with 0.72 pg of antibody.
Cutimez, Okitu, and Knians Cytochrome reductases in rat liver peroxisomes 619
by guest, on May 20, 2018
ww
w.jlr.org
Dow
nloaded from

M.W.
925-
66.2-
41 .O-
31 -0-
21.5-
1 2
Fig. 5. Immunoblot of NADPH cytochrome P-450 reductase in peroxisomal fractions from clofibrate-treated animals. Lane 1, 20 pg of peroxisomal membranes, lane 2, 180 pg of soluble peroxisomal protein. The M, of the protein is 78 kDa. Membranes were isolated by treat- ment with sodium carbonate.
matrix of rat liver peroxisomes that reacts with an anti- body made against rat liver microsomal NADPH cyto- chrome P-450 reductase.
This peroxisomal protein also has a subunit M , similar to the microsomal membrane protein.
Immunoelectron microsco/y. To further confirm the presence of the protein in peroxisomes, indirect gold immunolabeling for NADPH cytochrome P-450 reductase was performed. Hepatic tissue from clofibrate-treated animals was pre- pared for immunoelectron microscopy as described in the Methods section. The results are represented in Fig. 7 and Fig. 8. Gold particles are clearly visible in the peroxi- somes (P), restricted mostly to their matrices. A large number of clustered gold particles are also detected in the lamellae of the ER. However, the matrices of the mito- chondria (M) are almost totally devoid of gold particles. Since frozen sections were used, the ER appears diffuse and should not be mistaken for cytosol. These results confirm that the peroxisomal protein is primarily localized in the matrix of the organelle. Control sections prepared in the absence of antibody were completely devoid of gold particles.
NADH cytochrome c (b5) reductase
Immunoblotting of peroxisomal and microsomal membranes, Immunoblotting of peroxisomal and microsomal fractions
from clofibrate-treated animals was also performed with an antibody against rat microsomal NADH cytochrome c (b5) reductase. The native microsomal NADH cyto- chrome c (b5) reductase is also known to be an integral membrane protein localized on the cytoplasmic side of the membrane (35, 38). Fig. 9 shows an immunoblot of highly purified peroxisomal membrane proteins (lane 1) and microsomal membrane proteins (lane 2) obtained from clofibrate-treated rats. The results clearly demonstrate the occurrence of a 35 kDa protein in peroxisomal mem- branes and confirm the presence of the microsomal mem- brane protein. No bands were observed in the soluble peroxisomal and microsomal fractions (data not shown).
Immunoblot analysis of normal rat liver peroxisomes also demonstrated the presence of a 35 kDa protein. The quantity of the microsomal protein from normal rat liver was considerably greater as compared to that from the clofibrate-treated liver (data not shown). This observation was also in agreement with the higher specific activity measurements of NADH cytochrome c reductase in nor- mal microsomes.
M.W. 1 2 3
925-
66.2-
4 5.0-
31.0-
21.0-
Fig. 6. Immunoblot of NADPH cytochrome P-450 reductase in microsomal fractions from clofibrate-treated animals. Lane 1, 140 pg of soluble microsomal protein; lane 2, 60 pg of microsomal membranes; lane 3, 200 pg of microsomal protein; 93% pure microsomes were used for the preparation of membranes. The M, of the protein is 78 kDa. Membranes were isolated by treatment with sodium carbonate.
620 Journal of Lipid Research Volume 29, 1988
by guest, on May 20, 2018
ww
w.jlr.org
Dow
nloaded from

Fig. 7. Representative micrograph of liver cells from a clofibrate-treated rat that were immunolabeled with antibody against NADPH cytochrome P-450 reductase followed by a colloidal gold adduct of guinea pig antibodies to rabbit IgG. A high level of gold labeling is observed in the matrices of the peroxisomes (P). Numerous clusters of particles are also detected over the membranes of the ER. The low level of nonspecific labeling can be appreciated by viewing the matrices of the mitochondria (M) that are almost completely lacking of gold particles; mag. 45,500~; bar = 0.1 pm.
Zmmunoelectron mimscoh. To further establish the locali- also performed. Hepatic tissue from clofibrate-treated zation of the protein in peroxisomes, indirect gold im- animals was used as described previously. These results munolabeling for NADH cytochrome c (b5) reductase was support the conclusion that the peroxisomal protein is
Cutimez, Okih, and Krisam Cytochrome reductases in rat liver peroxisomes 621
by guest, on May 20, 2018
ww
w.jlr.org
Dow
nloaded from
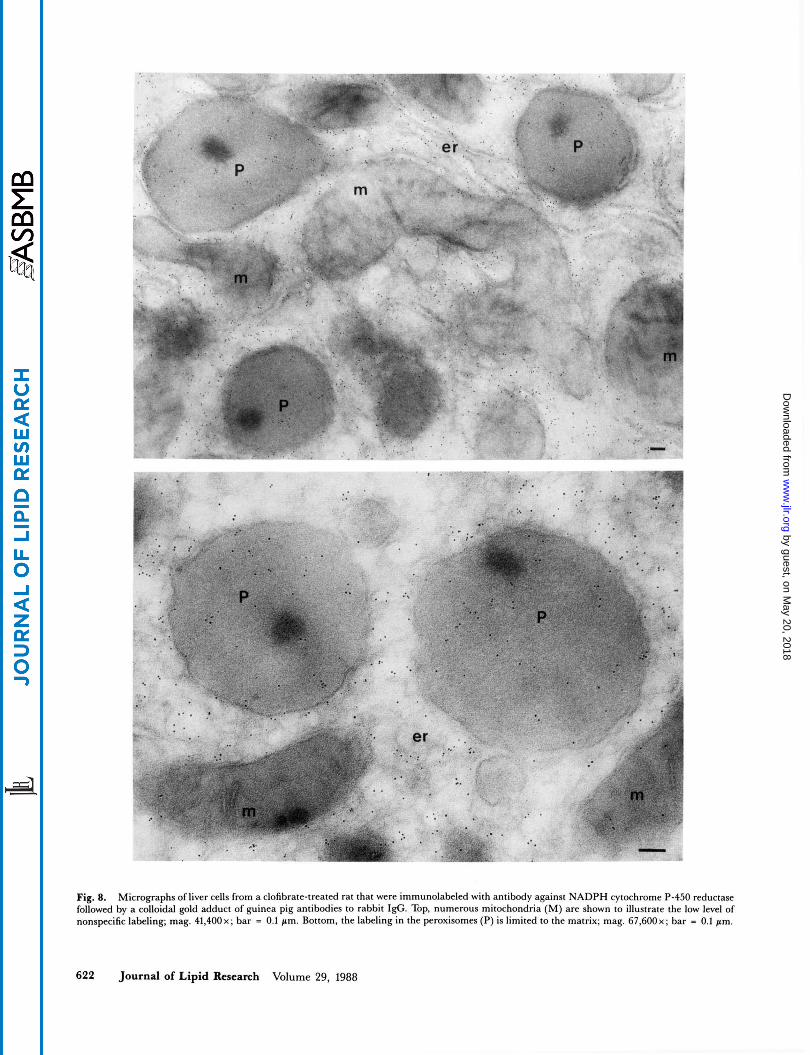
Fig. 8. Micrographs of liver cells from a clofibrate-treated rat that were immunolabeled with antibody against NADPH cytochrome P-450 reductase followed by a colloidal gold adduct of guinea pig antibodies to rabbit I@. Top, numerous mitochondria (M) are shown to illustrate the low level of nonspecific labeling; mag. 41,400~; bar = 0.1 pm. Bottom, the labeling in the peroxisomes (P) is limited to the matrix; mag. 67,600~; bar - 0.1 pm.
622 Journal of Lipid Research Volume 29, 1988
by guest, on May 20, 2018
ww
w.jlr.org
Dow
nloaded from

M.W.
92.5-
66.2-
45.0 -
31.0-
21.5 -
14.4-
1 2
Fig. 9. Immunoblot of NADH cytochrome c (b5) reductase in peroxi- somal and microsomal membranes from clofibrate-treated animals. Lane 1, 50 pg of peroxisomal membranes; lane 2, 50 pg of microsomal membranes. The M, of the protein is 35 kDa. Membranes were isolated by treatment with sodium carbonate.
localized in the membranes of the peroxisome and also associated with the membranes of the ER as well as the outer membranes of mitochondria, confirming earlier reports (15, 17, 39) (Fig. 10).
Inhibition o fmymat i c activig by antibodies. Highly purified rat liver peroxisomal membranes and microsomal protein obtained from clofibrate-treated rats were titrated with in- creasing concentrations of antiserum to rat microsomal NADH cytochrome c (b5) reductase. The antibody-cell fraction mixtures were preincubated for 10 min at room temperature before assaying for NADH cytochrome c reductase. The assays of the activities of both enzyme preparations were performed on approximately the same number of NADH cytochrome c reductase enzyme units in the cuvette. Fig. 11 shows the results of these experi-
ments. As can be seen, both the peroxisomal and micro- somal preparations were inhibited by the addition of anti- serum. Furthermore, the rate and absolute level of inhibition appeared to be very similar in both instances. The addition of Triton X-100 (0.25%) to the microsomal fractions had no effect on the enzyme activity. However, the addition of Triton X-100 to the peroxisomal mem- branes produced complete inhibition of activity. When control unrelated antiserum was used, no inhibition of activity was observed in either sample.
DISCUSSION
This study presents, for the first time, evidence of NADPH cytochrome P-450 reductase in rat liver peroxi- somes. Data from the analytical cell fractionation studies of clofibrate-treated animals in combination with computer- assisted linear combination calculations demonstrate that peroxisomes contain about 10% of the total liver NADPH cytochrome P-450 reductase activity (using cytochrome c as an electron acceptor). Purity calculations of our frac- tions confirm that this reductase activity is truly per- oxisomal and not due to microsomal contamination. More- over, this activity is immunoprecipitated by NADPH cytochrome P-450 reductase antibody in a manner simi- lar to the microsomal enzyme. However, immunoblot data from both normal and clofibrate-treated animals in- dicate that the peroxisomal enzyme has a location within the organelles different from the ER enzyme, but has a similar subunit molecular weight. In microsomes we find this protein is located in the membranes and has an ap- parent molecular weight of 78 kDa, which is in close agreement with previous reports (36, 37). Immunoblots of the peroxisomal fractions also show a protein band at 78 kDa, but it is present in the soluble fraction of the organelle. The localization of the soluble protein in per- oxisomes is corroborated by immunoelectron microscopy, which revealed gold-labeled particles only in the matrix of the organelle.
The microsomal NADPH cytochrome P-450 reductase consists of a major hydrophilic portion, in which the cata- lytically active part resides, and a minor hydrophobic portion which is essential for attachment of the molecule to the membrane (35, 36). The hydrophilic portion of the enzyme molecule can be selectively split from its hydro- phobic portion by digestion with a suitable protease, resulting in solubilization of the active fragment of the enzyme from the microsomes. The molecular weight of the native form is 78 kDa and the molecular weight of the hydrophilic, catalytically active part, is 68 kDa.
It is unlikely that the 78 kDa protein detected in the peroxisomes is a proteolytic cleavage product of the ER enzyme. However, it is possible that the peroxisomal pro-
Gutimz, Okita, and Krisanr Cytochrome reductases in rat liver peroxisomes 623
by guest, on May 20, 2018
ww
w.jlr.org
Dow
nloaded from

Fig. 10. Representative micrograph of liver cells from a clofibrate-treated rat that were immunolabeled with antibody against NADH cytochrome c (b,) reductase followed by a colloidal gold adduct of guinea pig antibodies to rabbit I&. Gold labeling is observed in the peroxisome (P), restricted mainly to the membrane. Numerous gold particles are also associated with the membranes of the ER and the outer membranes of the mitochondria. Mag. 68,000~; bar = 0.1 pm.
tein that reacts with the antibody is a proteolytic cleavage is the third enzyme that is an integral membrane protein product or subunit of a larger native peroxisomal protein. in the ER, and that is also found in the soluble corn- This needs to be further investigated. partment of the peroxisomes. 3-Hydroxy-3-methylglutaryl Table 3 presents a summary of some of the characteris- coenzyme A reductase (HMG-CoA reductase) is an
tics of the microsomal and peroxisomal NADPH cyto- integral membrane protein of the ER that was recently chrome P-450 reductases. The main difference is, again, shown to be also localized in the matrix of the peroxi- subcellular location. It is interesting to note that this somes (32, 40). Carnitine acetyltransferase is also soluble
624 Journal of Lipid Research Volume 29, 1988
by guest, on May 20, 2018
ww
w.jlr.org
Dow
nloaded from

PEROXISOMES 100
80 -
60 -
A
A
2 I . MCROSOYES
40 2
40 1 0 2 0
B ANTIB~DY (mg) ANTIBO~Y (mg)
Fig. 11. Inhibition of (A) peroxisomal and (B) microsomal NADH cytochrome c (b5) reductase activity by anti- body to the microsomal reductase. Highly purified peroxisomal membrane fractions (8 pg) and 93% pure microsomal fractions (11 pg) from clofibrate-treated animals were preincubated with increasing concentrations of antiserum and assayed as described.
in peroxisomes and membrane-bound in microsomes. Due to the similarities in the properties of the carnitine acetyl transferase, it has been postulated that the same enzyme exists in both these organelles (41).
Several earlier studies have reported the presence of NADH cytochrome c reductase activity and NADH cyto- chrome b5 reductase activity in peroxisomes (13-17). However, due to the significant contamination of some of these peroxisomal preparations, the pretreatment of ani- mals with Triton WR-1339, and the variation in the reported absolute activities of the enzymes, the questions of their presence and level in peroxisomes needed to be clarified. In this study we utilized the analytical cell frac- tionation approach in combination with immunoblotting techniques and immunoelectron microscopy to better address this question. Our data show that peroxisomes from clofibrate-treated animals contain about 5-6% of the total liver NADH cytochrome c reductase activity, but
little or no activity when assayed with K,Fe(CN)G @e., cytochrome ferricyanide reductase). This cytochrome c reductase activity is also inhibited by NADH cytochrome c (b5) reductase antibody in a manner similar to the microsomal enzyme. It is not clear whether the NADH cytochrome c reductase and NADH ferricyanide reductase in peroxisomes are the same enzyme. Immunoblot data from both normal and clofibrate-treated animals indicate that the peroxisomal enzyme has an Mr similar to that of the ER enzyme and is also associated with the peroxisomal membrane fraction. The membrane location of the pro- tein in peroxisomes is further demonstrated by immuno- electron microscopy, which revealed gold-labeled particles mainly in the membrane of the organelle.
It is believed that NADH cytochrome c reductase and NADH cytochrome (b5) reductase are the same enzyme in the ER that catalyzes the transfer of electrons from NADH to cytochrome b5. This reductase is very similar
TABLE 3. Characteristics of hepatic microsomal and peroxisomal NADPH cytochrome P-450 reductases
Peroxisomes Microsomes
Apparent molecular weight 78,000 78,000 Subcellular location membrane-bound soluble Effect of clofibrate treatment on enzyme activity Specific activity ( p m o l h i n per mg) 0.13 0.06 Effect of Triton X-100 solubilization on enzyme activity
Effect of NADPH cytochrome P-450 antibody on
increases measurable only in drugtreated animals
no effect no effect
enzyme activity inhibited inhibited b Cytochrome P-450 content (nmollmg) 1 .O" -
"Rat microsomal cytochrome P-450 content (from ref. 57). 'Unknown.
Gutierrez, Okita, and Kriians Cytochrome reductases in rat liver peroxisomes 625
by guest, on May 20, 2018
ww
w.jlr.org
Dow
nloaded from

TABLE 4. Characteristics of hepatic microsomal and peroxisomal NADH cytochrome c (b5) reductases
Microsomes Peroxisomes
Apparent molecular weight
Subcellular location
Effect of clofibrate treatment on enzyme activity
Specific activity reduction of cytochrome c
Specific activity reduction of K,Fe(CN),
Effect of Triton X-100 solubilization on enzyme activity
Effect of NADH cytochrome c (b,) antibody on
Cytochrome b, content (nmolhg)
(pmolhin per mg)
(pmol/min per mg)
enzyme activity
35,000 membrane-bound
decreases
0.50
5 .9
no effect
inhibited
0.4"
35,000 membrane-bound
measurable only in drugtreated animals
0.10
not significant
inhibited
inhibited
0.04"
"An average value of rat microsomal and peroxisomal b5 content was calculated from data in references 13, 17, and 42
to the microsomal NADPH cytochrome P-450 reductase in that it also consists of a major hydrophilic portion, in which the catalytically active part resides, and a minor hydrophobic portion which is essential for attachment to the membrane (35). In this study, the apparent molecular weight of the peroxisomal and microsomal NADH cyto- chrome c (b5) reductases was 35 kDa as estimated by SDS-PAGE. Since the peroxisomal reductase remained with the membrane fraction after carbonate treatment, it may also be an integral membrane protein. Whether it has the same molecular characteristics as the ER enzyme needs to be determined. Table 4 summarizes the charac- teristics of the peroxisomal and microsomal NADH cyto- chrome c (b5) reductases. The major differences are seen in substrate specificity and the effect of Triton X-100. As previously mentioned, several investigators have reported the presence of this reductase in peroxisomes (13, 14, 16). The reported values of specific activities for the cyto- chrome c reductase range from 0.07 to 0.41 pmol per min per mg of peroxisomal protein. Our data are in good agreement with the values reported by Appelkvist et al. (13) (0.07 pmol per min per mg). The estimated ER con- tamination in this study was also very low, 1.5%. There is also evidence for the presence of cytochrome b5 in peroxisomes which comes from immunocytochemistry studies (15, 17) in combination with the functional assays showing b5 reduction (17), and palmitoyl-CoA-dependent b5 reduction in peroxisomes but not microsomes (42). An average value of peroxisomal b5 content is listed in Table 4.
It is well known that the microsomal electron transport system mediates a large variety of reactions which include hydroxylation reactions in the synthesis of bile acids (7, 8, 43), lipid peroxidation (44), desaturation of fatty acids (45, 46), synthesis of plasmalogens (47), and cholesterol biosynthesis (48-51). The glyoxysomal membranes also contain an electron transport system quite similar to that of the ER. The glyoxysomal membrane is rich in flavin
and contains cytochrome b5, cytochrome P-420, NADH cytochrome b5 reductase (as measured by K,Fe(CN), reduction), NADH cytochrome c reductase (as measured by cytochrome c reduction), and NADPH cytochrome P-450 reductase (14, 52, 53). The function of the gly- oxysomal membrane electron transport system is not known. Since reducing equivalents in the form of NADH are produced during 0-oxidation, it has been suggested that this electron transport system may participate in the reoxidation of intraglyoxysomal NADH (53).
It is clear from this study that peroxisomes from both normal and clofibrate-treated animals contain cytochrome reductases as demonstrated by immunoblotting. Whether the reductases in normal liver peroxisomes are inactive or are simply present in too low concentrations for biochemi- cal measurements is not clear.
The presence of these enzymes in peroxisomes provides strong support to the growing number of studies demon- strating the role of this organelle in bile acid synthesis (2, 4-6). Specifically, it would be very significant if the hydroxylase activity reported in peroxisomes (6) is also a cytochrome P-450, as is the case for the ER and mito- chondria (7, 9). More recently, the discovery of HMG- CoA reductase (the rate-limiting enzyme in cholesterol synthesis) in the peroxisomes (32, 40) raises the question of the possibility of cholesterol synthesis by peroxisomes. In fact, we have obtained evidence of cholesterol synthesis by peroxisomes in the presence of rat liver cytosol (54). The presence of the cytochrome reductases may be re- quired for this synthesis, as is the case in microsomes (51). Finally, as in the glyoxysome, the presence of @-oxidation in peroxisomes is well established (55), but the mechanism of reoxidation of NADH in the peroxisome is not under- stood. The NADH cytochrome c reductase and cyto- chrome b5 might participate in disposing of these reducing equivalents generated during @-oxidation as has been proposed (56).
626 Journal of Lipid Research Volume 29, 1988
by guest, on May 20, 2018
ww
w.jlr.org
Dow
nloaded from

The peroxisomal cytochrome reductase system appears to be unique. Moreover, since the physiological acceptors of the cytochrome reductases in peroxisomes are not known and the biochemical measurements were not optimized for peroxisomes, the actual capabilities of this electron trans- port system cannot yet be evaluated. Thus, the current rates obtained with artificial acceptors may, in fact, be minimal values. Only purifying the enzymes to homogeneity from the peroxisomes and comparing their properties will clearly establish whether or not the same enzyme is present in peroxisomes and microsomes. lllD
We are very grateful to B. S. Masters for her generous gift of antibodies, to Dr. D. R. Short, to J. Varnell for assistance in statistical analysis of data, and to M. McCaffery for performing immunoelectron microscopy. This work was supported by grant DK 32852 from the National Institutes of Health. Manuscript receiued 9 September 1987 and in nuisedform 3 December 1987.
REFERENCES
1.
2.
3.
4.
5.
6.
7.
8.
9.
10.
11.
Kase, B. E, I. Bjorkhem, P. Haga, and J. I. Pedersen. 1985. Defective peroxisomal cleavage of the Cz7 steroid side chain in the cerebro-hepato-renal syndrome of Zellweger. J. Clin. Invest. 75: 427-435. Kase, E, I. Bjorkhem, and J.I. Pedersen. 1983. Formation of cholic acid from 3a ,7u,l2a-trihydroxy-5~-chofestanoic acid by rat liver peroxisomes. J. Lipid Res. 24: 1560-1567. Pedersen, J. I., and J. Gustafsson. 1980. Conversion of 3a,7a,l2a-trihydroxy-5@-cholestanoic acid into cholic acid by rat liver peroxisomes. FEBS Lett. 121: 345-348. Hagey, L. R., and S. Krisans. 1982. Degradation of cho- lesterol to propionic acid by rat liver peroxisomes. Biochem. Biophys. Res. Commun. 10f: 834-841. Krisans, S. K., S. L. Thompson, L. A. Pena, E. Kok, and N. B. Javitt. 1985. Bile acid synthesis by rat liver peroxi- somes: metabolism of 26-hydroxycholestero1 to 30-hydroxy- 5-cholenoic acid. J. Lipid Res. 26: 1324-1332. Thompson, S. L., and S. K. Krisans. 1985. Evidence for peroxisomal hydroxylase activity in rat liver. Biochem. Bio- phys. Res. Commun. 130: 708-716. Bjorkhem, I., H. Danielsson, and K. Wikvall. 1976. Side chain hydroxylation in biosynthesis of cholic acid. J. Biol.
Bjorkhem, I., R. Hansson, I. Holmberg, and K. Wikvall. 1979. 25-Hydroxylation of vitamin D3 by a reconstituted system from rat liver microsomes. Biochem. Biophys. Res. Commun. 90: 615-622. Oftebro, H., K. Saarem, I. Bjorkhem, and J. Pedersen. 1981. Side chain hydroxylation of C27-steroids and vitamin D3 by a cytochrome P-450 enzyme system isolated from human liver mitochrondria. J. Lipid Rex. 22: 1254-1264. Pedersen, J. I. 1978. Rat liver mitochondrial cytochrome P-450 active in a reconstituted steroid hydroxylation reac- tion. FEBS Lett. 85: 35-39. Pedersen, J. I., I. Bjorkhem, and J. Gustafsson. 1979. 26-Hydroxylation of C27-steroids by soluble liver mito- chondrial cytochrome P-450. J. Bid. Chem. 254: 6464- 6469.
Chm. 251: 3495-3499.
12. Hildebrandt, A., and R. W. Estabrook. 1971. Evidence for the participation of cytochrome b5 in hepatic microsomal mixed-function oxidation reactions. Arch. Biochem. Biophys.
13. Appelkvist, E. L., U. Brunk, and G. Dallner. 1981. Isolation of peroxisomes from rat liver using sucrose and percoll gradients. J. Biochem. Bioptys. Methodr. 5: 203-217.
14. Donaldson, R. P., N. E. Tolbert, and C. Schnarrenberger. 1972. A comparison of microbody membranes with micro- somes and mitochondria from plant and animal tissues. Axh. B i o c h . Biophys. 152: 199-215.
15. Fowler, S., J. Remacle, A. Trouet, H. Beaufay, J. Berthet, M. Wibo, and P. Hauser. 1976. Analytical study of micro- somes and isolated subcellular membranes from rat liver. Immunological localization of cytochrome bs by electron microscopy: methodology and application to various sub- cellular fractions. J. Cell. Biol. 71: 535-550. Huttinger, M., H. Goldenberg, and R. Kramar. 1979. A characteristic membrane protein of liver microsomes indu- cible by clofibrate. Biochim. BiopAys. Acta. 558: 251-254.
17. Remacle, J. 1978. Binding of cytochrome b5 to membranes of isolated subcellular organelles from rat liver. J. Cell Biol.
Leighton, F., B. Poole, H. Beaufay, P. Baudhuin, J. W. Coffey, S. Fowler, and C. de Duve. 1968. The large scale separation of peroxisomes, mitochondria, and lysosomes from the livers of rats injected with Triton WR-1339. Im- proved isolation procedures, automated analysis, biochemi- cal and morphological properties of fractions. J. Biol. Chem.
19. de Duve, C., B. C. Pressman, R. Gianetto, R. Wattiaux, and F. Appelmans. 1955. Tissue fractionation studies. VI. Intracellular distribution patterns of enzymes in rat liver tissue. Biochem. J. 60: 604-617. -
20. Bronfman, M., N. C. Inestrosa, and F. Leighton. 1979. Fatty acid oxidation by human liver peroxisomes. Biochem. Biophys. Res. Commun. 88: 1030-1036. Hajra, A. K., and J. F Bishop. 1982. Glycerolipid bio- synthesis in peroxisomes via the acyl dihydroxyacetone phosphate pathway. Ann. NY Acad. Sci. 386: 170-182.
22. Lazarow, P. B., and C. de Duve. 1973. Synthesis and turn- over of rat liver peroxisomes. V. Intracellular pathway of catalase synthesis. J. Cell Biol. 59: 507-524.
23. Yonetani, T. 1967. Cytochrome oxidase: beef heart. Methodr Enzymol. 10: 332-335.
24. Beaufay, H., A. Amar-Costesec, E. Feytmans, D. Thines- Sempoux, M. Wibo, M. Robbi, and J. Berthet. 1974. Ana- lytical study of microsomes and isolated subcellular mem- branes from rat liver. I. Biochemical methods. J. Cell Biol.
25. Lowry, 0. H., N. J. Rosebrough, A. L. Farr, and R. J. Randall. 1951. Protein measurement with the Folin phenol reagent. J. Biol. Chm. 193: 265-275.
26. Katsuyoshi, M., and R. Sato. 1978. Detergent-solubilized NADH-cytochrome b5 reductase. Methods Enzymol. 12:
27. Fujuki, Y., S. Fowler, H. Shio, A. L. Hubbard, and P. B. Lazarow. 1982. Polypeptide and phospholipid composition of the membrane of rat liver peroxisomes: comparison with endoplasmic reticulum and mitochondrial membranes. J. Cell Biol. 93: 103-110.
28. Tokuyasu, K. T. 1973. A technique for ultracryotomy of cell suspensions and tissues. J. Biol. Chem. 57: 551-565.
29. Keller, G. A,, K. T. Tokuyasu, A. H. Dutton, and S. J. Singer. 1984. An improved procedure for immunoelectron
143: 66-79.
16.
79: 291-313. 18.
37: 482-513.
21.
61: 188-200.
102-103.
Gutiewez, Okita, and Krisans Cytochrome reductases in rat liver peroxisomes 627
by guest, on May 20, 2018
ww
w.jlr.org
Dow
nloaded from

30.
31.
32.
33.
34.
35.
36.
37.
38.
39.
40.
41.
42.
43.
microscopy: ultrathin embedding of immunolabeled ultra- thin frozen sections. Proc. Natl. Acad. Sci. USA. 81:
Laemmli, U. K. 1970. Cleavage of structural proteins during the assembly of the head of bacteriophage T4. Nature. 227: 680-685. Krisans, S. K., R. M. Mortensen, and P. B. Lazarow. 1980. Acyl-CoA synthetase in rat liver peroxisomes. J. Biol. Chem. 255: 9599-9607. Keller, G. A., M. Pazirandeh, and S. Krisans. 1986. 3-Hydroxy-3-methylglutaryl coenzyme A reductase locali- zation in rat liver peroxisomes and microsomes of control and cholestyramine-treated animals: quantitative biochem- ical and immunoelectron microscopical analyses. J. Cell Biol. 123: 875-886. Svoboda, D., and D. Azarnoff. 1966. Response of hepatic microbodies to hypolipidemic agent, ethyl chloro phenoxy- isobutarate (CPIB). J Cell Biol. 3 0 442-450. Svoboda, D., D. Azaroff, and J. Reddy. 1969. Microbodies in experimentally altered cells. 11. Relationship of micro- body proliferation to endocrine glands. J. Cell. Biol. 40:
Kreibich, G., D. Sabatini, and M. Adesnik. 1983. Bio- synthesis of hepatocyte endoplasmic reticulum proteins. Methods. Entymol. 96: 530-541. Masters, B. S. S., and R. T. Okita. 1980. The history, properties and function of NADPH-cytochrome P-450 reductase. Pharmacol. Ther. 9 227-244. Black, S. D., and M. J. Coon. 1982. Structural features of liver microsomal NADPH-cytochrome P-450 reductase. J. Biol. Chem. 257: 5929-5938. Strittmatter, P., M. J. Rogers, and L. Spatz. 1972. The binding of cytochrome b5 to liver microsomes. J. Biol. Chem. 247: 7188-7194. Takesue, S., and T. Omura. 1970. Immunological similarity between NADH-cytochrome c reductases of mitochondrial outer membrane and microsomes. Biochem. Biophys. Res. Commun. 40: 396-401. Keller, G. A., M. C. Barton, D. J. Shapiro, and S. J. Singer. 1985. 3-Hydroxy-3-methylglutaryl coenzyme A reductase is present in peroxisomes in normal cells. Pmc. Natl. Acad. Sci.
Markwell, M. K., E. N. Tolbert, and L. L. Bieber. 1976. Comparison of the carnitine acetyltransferase activities from rat liver peroxisomes and microsomes. Arch. Biochem. Biophys. 176: 479-488. Huttinger, M., M. Pavelka, H. Goldenberg, and R. Kramar. 1981. Membranes of rat liver peroxisomes. Histochemistv.
Hansson, R., and K. Wikvall. 1980. Hydroxylation in bio-
5744-5752.
734-746.
USA. 82: 770-774.
71: 259-267.
44.
45.
46.
47.
48.
49.
50.
51.
52.
53.
54.
55.
56.
57.
synthesis and metabolism of bile acids. J. Biol. Chem. 255:
Ernster, L., and S. Orrenius. 1965. Substrate-induced syn- thesis of the hydroxylating enzyme system of liver micro- somes. Fed. Proc. 24: 1190-1199. Holloway, P. W., and T. J. Katz. 1972. A requirement for cytochrome b5 in microsomal stearyl coenzyme A desatura- tion. Biochem&v. 11: 3689-3695. Ono, T., and K. Bloch. 1971. Solubilization and partial characterization of rat liver squalene epoxidase. J Biol. Chem. 250: 1571-1579. Paltauf, E 1974. Evidence for the participation of cyto- chrome b5 in plasmalogen synthesis. J. Biol. Chem. 249: 2661-2662. Fukushima, H., G. F. Grinstead, and J. L. Gaylor. 1981. Total enzymic synthesis of cholesterol from lanosterol.
Grinstead, G. F., and J. L. Gaylor. 1982. Total enzymic syn- thesis of cholesterol from 4,4,14a-trimethyl-5a-cholesta- 8,24-dien-3/3-01. Solubilization, resolution and reconstitu- tion of A7-sterol 5-desaturase. J. Biol. Chem. 257: 13937- 13944. Oshino, N., and T. Omura. 1973. Immunological evidence for the participation of cytochrome b5 in microsomal stearyl-CoA desaturation reaction. Arch. Biochem. Biophys.
Trzaskos, J. M., W. D. Bowen, A. Shafiee, R. T. Fischer, and J. Gaylor. 1984. Cytochrome P-450-dependent oxida- tion of lanosterol in cholesterol biosynthesis. J. Biol. Chem. 159: 13402-13412. Donaldson, R. P., R. E. Tully, 0. A. Young, and H. Beevers. 1981. Organelle membranes from germinating castor bean endosperm. 11. Enzymes, cytochromes, and permeability of the glyoxysome membrane. Plant P@siol.
Hicks, D. B., and R. P. Donaldson. 1982. Electron trans- port in glyoxysomal membranes. Arch. Biochem. Biophys. 215: 280-288. Thompson, S. L., R. Burrows, R. J. Laub, and S. K. Krisans. 1987. Cholesterol synthesis in rat liver peroxi- somes: conversion of mevalonic acid to cholesterol. J. Biol. Chem. 262: 17420-17425. Lazarow, P., and C. de Duve. 1976. A fatty acyl-CoA oxidizing system in rat liver peroxisomes: enhancement by clofibrate, a hypolipidemic drug. Pmc. NaB Acad Sci. USA. 73: 2043-2046. Lazarow, P. 1984. The Peroxisomal Membrane. Membrane Structure and Function. Vol. 5, Chapter 1. 1-31. Sato, R., and T. Omura. 1978. Hepatic Microsomal Sys- tem. Cytochrome P-450. Chapter 4. 138-163.
1643-1649.
J. Biol. Chem. 256: 4822-4826.
157: 395-404.
67: 21-25.
628 Journal of Lipid Research Volume 29, 1988
by guest, on May 20, 2018
ww
w.jlr.org
Dow
nloaded from