demystifying data science: a pragmatic guide to … · demystifying data science: a pragmatic guide...
TRANSCRIPT

Demystifying Data Science: A Pragmatic Guide to Building Big Data Use Cases
Bill Schmarzo, CTO

Start With The BusinessIdentify, qualify and prioritize business use cases

© Copyright 2017 Dell Inc.3
Identifying business use casesBUSINESS INITIATIVE
STAKEHOLDERS
KEY DECISIONS
QUESTIONS
DATA
ARCHITECTURE & BIG DATA TECHNOLOGIES

Introducing Data ScienceData science is the data monetization engine

© Copyright 2017 Dell Inc.5
Future
Business Value
Time Horizon
High
LowPast
Evolution of analyticsBusiness intelligence and data science
Data Science• Predictive analytics• Prescriptive analytics• What is likely to happen?• What should I do?
Business Intelligence• Standard reporting
• What happened?

© Copyright 2017 Dell Inc.6
What is data science?Data Science: Identifying those variables and metrics that might be better predictors of performance
6
2000 2001 2002 2003 2004 2005 2013

© Copyright 2017 Dell Inc.7
Step 1: Pre-build data schema (schema-on-load)
DW
Business intelligence process
Step 3: Use Business Intelligence (BI) tool’s graphical user interface (GUI) to construct query)
Step 5: SQL is run against data warehouse to create report
Step 4: BI tool creates SQL
Step 2: Define question to be answered(queries)

© Copyright 2017 Dell Inc.8
REP
EAT
Data science processStep 1: Define Hypothesis to test or
Prediction to be made
Step 3: Prepare data; Build schema (schema-on-query)
Step 4: Visualize the data (Tableau, Spotfire, ggplot2,…)
Step 5: Build analytic models (SAS, R, MADlib, Mahout,…)
Step 2: Gather data…and more data (Data Lake: SQL + Hadoop)
HistoricalGoogle Trends
PhysicianNotes
Local Events
Weather Forecast CDC
Lawson
EpicKronos
Step 6: Evaluate model “goodness of fit” (coefficients, confidence levels)

© Copyright 2017 Dell Inc.9
Different levels of analytics
Prescriptive Analytics(What should we do?)
Run BOGOF Burrito promotion 7–9pm to attract college students
Add 2 more workers 5:00pm–9:00pm on Saturday, May 6
Increase chicken inventory next week by 15%
Increase hiring pipeline next month by 20 candidates
Descriptive Analytics(What happened?)
What were revenues last week?
How many customers visited store during last Sunday’s Farmer’s Market?
What were our most popular products last week?
How many employees did we hire last month?
Predictive Analytics(What is likely to happen?)
What will revenues be next week?
How many customers will visit the store during next Sunday’s Farmer’s Market?
What will be our most popular products next week?
How many new employees will we need to hire next month?

© Copyright 2017 Dell Inc.10
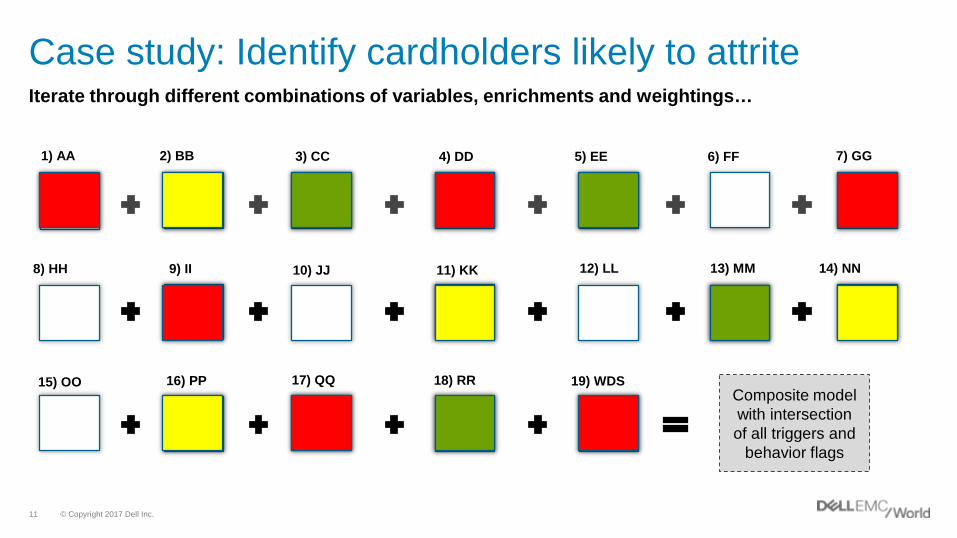
Composite model with intersectionof all triggers and
behavior flags
3) CC2) BB1) AA 5) EE4) DD 6) FF 7) GG
9) II8) HH 10) JJ 11) KK 13) MM12) LL 14) NN
16) PP15) OO 17) QQ 18) RR 19) WDS
Case study: Identify cardholders likely to attriteBrainstorm variables and metrics that might be better predictors of cardholder attrition
© Copyright 2017 Dell Inc.11
Case study: Identify cardholders likely to attriteIterate through different combinations of variables, enrichments and weightings…
3) CC2) BB1) AA 5) EE4) DD 6) FF 7) GG
9) II8) HH 10) JJ 11) KK 13) MM12) LL 14) NN
16) PP15) OO 17) QQ 18) RR 19) WDSComposite model with intersectionof all triggers and
behavior flags
© Copyright 2017 Dell Inc.12
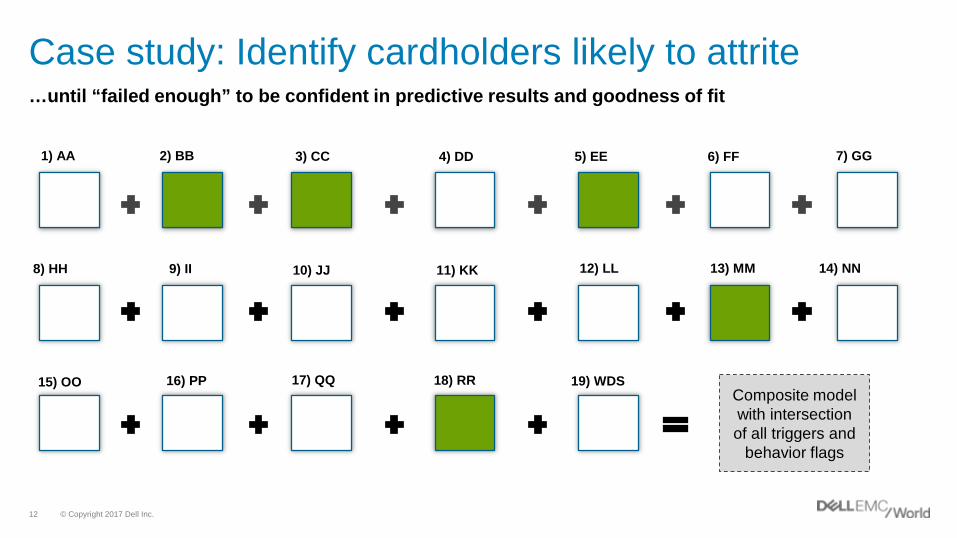
Case study: Identify cardholders likely to attrite…until “failed enough” to be confident in predictive results and goodness of fit
3) CC2) BB1) AA 5) EE4) DD 6) FF 7) GG
9) II8) HH 10) JJ 11) KK 13) MM12) LL 14) NN
16) PP15) OO 17) QQ 18) RR 19) WDSComposite model with intersectionof all triggers and
behavior flags

© Copyright 2017 Dell Inc.13
Final attrition model resultsRequires constant testing and refinement to maintain results
Model ResultsModel identified ~59% of attritors
As a benchmark, American Express publicizes a successful attrition model that identifies 24% of attritors*
*Source: “How predictive analytics is tackling customer attrition at American Express”http://www.cmo.com.au/article/458724/how_predictive_analytics_tackling_customer_attrition_american_express/

© Copyright 2017 Dell Inc.14
Customer 101 Customer 102 Customer 103 Customer 104
Current LTV
Ultimate goal: Predict customer lifetime valueCreate Predicted LTV score to prioritize customer retention and up/cross-sell efforts
([Current LTV], [Wealth Potential], [Referrals], [Loyalty], …)[Predicted LTV]=
• Investing History• Withdrawals• Portfolio mix• Income• Net worth• Demo-graphics• Tenure• Social Security• Frequency• Recency
Predicted LTV
• Income potential • Wealth potential• Career potential• Ownership potential• Family potential• Legacies/Donations• Trusts• Home value• Lifestyle• Life stage• Advocacy/Referrals• Risk Tolerance• Spending tendencies• Nearest Neighbor

© Copyright 2017 Dell Inc.15
Continuum of predictive analytic algorithms
http://www.kdnuggets.com/2016/06/data-science-variable-selection-review.html

© Copyright 2017 Dell Inc.16
Difference between BI and data science
Business Intelligence (BI) Data Science
Retrospective Forward-looking view
Reports, Dashboards, KPI’s Patterns, Correlations, Models
Descriptive Questions Predictive / Prescriptive Analytics
What Happened? What Is Likely To Happen?
Summarized Data Granular Data
Aggregated (Comparative) Analysis Individual (Behavioral) Analysis
Questions are Informative Decisions are Actionable

Determining Economic Value of DataData and analytics: assets of the modern business

© Copyright 2017 Dell Inc.18
Data is an unusual currency. Most currencies exhibit a one-to-one transactional relationship. For example, the quantifiable value of a dollar is considered to be finite - it can only be used to buy one item or service at a time, or a person can only do one paid job at a time. But measuring the value of data is not constrained by transactional limitations. In fact, data currency exhibits a network effect, where data can be used at the same time across multiple use cases thereby increasing its value to the organization. This makes data a powerful currency in which to invest.Source: “Determining the Economic Value of Data”

© Copyright 2017 Dell Inc.19
Where an increase in spending produces an increase in national income and consumption greater than the initial amount. Every time there is an injection of money into the economy, there is an economic multiplier effect.
Customer point of sales data
SalesPromotional effectiveness
+2.5%
MarketingCustomer acquisition
+2.0%
Call CenterCustomer retention
+3.5%
Product DevNew product
intro
+2.6%
Economic multiplier effect: Data

© Copyright 2017 Dell Inc.20
Intellectual capital “Rubik’s Cube” challenges• How does the organization determine the economic value
of its data in order to drive prioritization and investment decisions?
• How does the organization avoid data silos, shadow IT spend and unmanaged data proliferation that thwart the potential value of data?
• How does the organization avoid the disillusionment of “orphaned analytics”?
• How do you re-tool the organization to establish a technical and cultural environment for collaborative value creation?
How does one leverage assets that appreciate (not depreciate) with usage, and can be used simultaneously across multiple business processes?

© Copyright 2017 Dell Inc.21
Intellectual capital “Rubik’s Cube” solution
Detailed historical transactions coupled with internal unstructured and publicly-
available data sources
Data transformed into actionable analytic insights (scores, rules, propensities,
segments, recommendations)
ANALYTICSDATA
Clusters of decisions around common subject area in support of organization’s key business initiatives
USE CASES
© Copyright 2017 Dell Inc.22
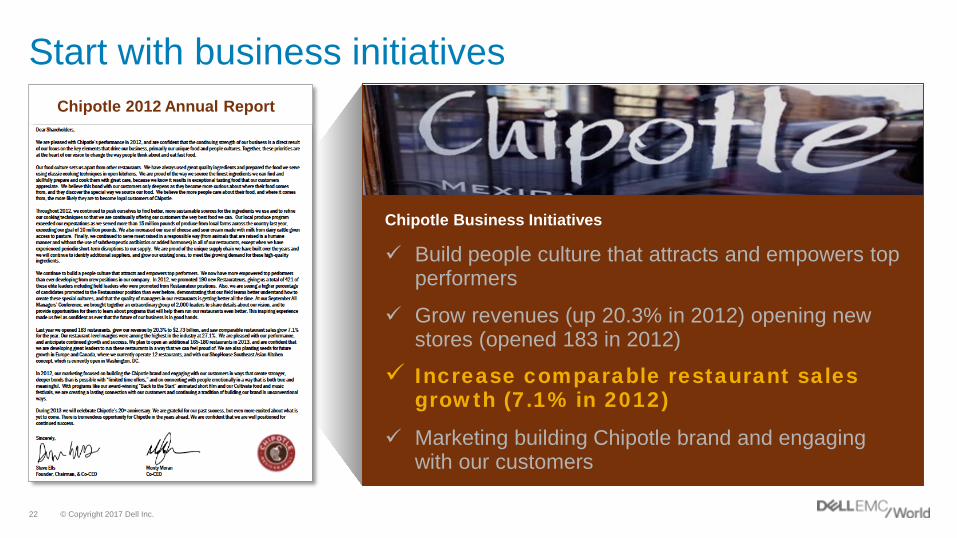
Start with business initiativesChipotle 2012 Annual Report
Chipotle Business Initiatives
Build people culture that attracts and empowers top performers
Grow revenues (up 20.3% in 2012) opening new stores (opened 183 in 2012)
Increase comparable restaurant sales growth (7.1% in 2012)
Marketing building Chipotle brand and engaging with our customers

© Copyright 2017 Dell Inc.23
Group decisions into common subject areas or use casesBusiness initiative: Increase same store sales
Decision
Decision
Decision
Decision
DecisionDecision
Decision
Decision
Decision
Decision
Decision
Decision
Decision
Decision
Decision
Decision
Decision
Decision
Decision
Decision
Decision
Decision
Decision
DecisionDecision
Decision
Increase Store Traffic via Loyalty program
Increase corporate catering
Increase Store Traffic via local events marketing
Increase shopping bag revenue
Increase non-corporate catering
Improve New Product Introduction Effectiveness
Improve promotional effectiveness

© Copyright 2017 Dell Inc.24
Data source x use case mappingData is the fuel of the modern, intelligent organization – an asset to be gathered, enriched and re-used across multiple Use Cases
Data Sources
Increase Store Traffic Local Events
$62MPoint of Sales √Market Baskets √Store Demographics
Local Competition √Store Manager Demo
Consumer Comments
Social Media √Weather
Local Events √Traffic
Increase Store Traffic
Loyalty
$56M√√
√√√
Increase Shopping
Bag Revenue
$26M√√
√√√
Increase Corporate Catering
$24M√
√√√
√
Increase Non-corporate Catering
$14M
√√
√
√
Improve New Product
Introductions
$18M√
√
√√√√
Improve Promotional
Effectiveness
$27M√√√
√√

© Copyright 2017 Dell Inc.25
Analytic Profiles standardize the collection and re-application of analytics about Business Entities across multiple Use Cases
Analytic profiles capture analytics for re-use
Bill SchmarzoChipotle Analytic Profile
NCE Score Var Trend

© Copyright 2017 Dell Inc.26
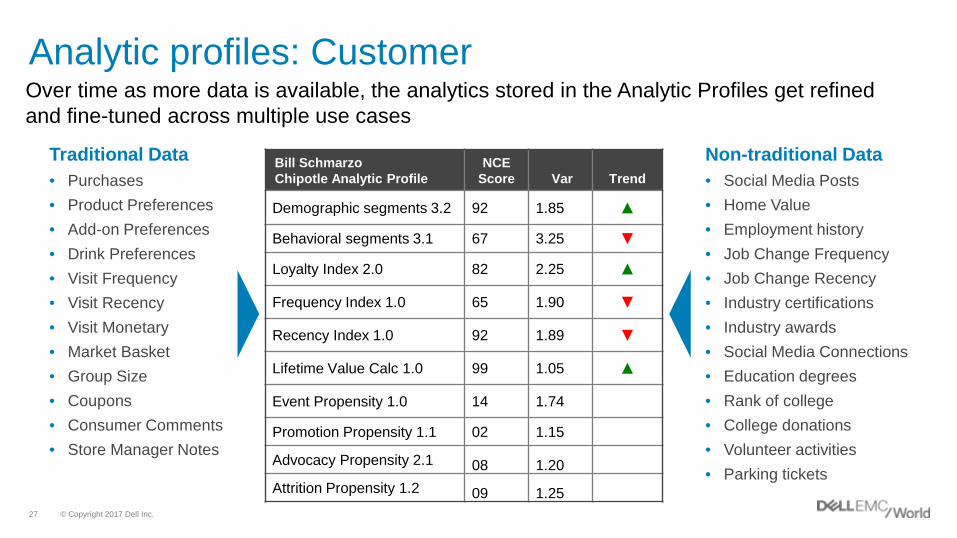
Analytic profiles: CustomerCreate Scores that support the Decisions that comprise each Use Case, and store those scores in the Analytic Profile
Bill SchmarzoChipotle Analytic Profile
NCE Score Var Trend
Demographic segments 1.0 92 1.85 ▲
Behavioral segments 1.0 67 3.25 ▼Behavioral segments 1.1 67 3.25 ▼
Loyalty Index 1.0 82 2.25 ▲
Frequency Index 1.0 65 1.90 ▼
Behavioral segments 1.2 67 3.25 ▼
Recency Index 1.0 92 1.89 ▼
Loyalty Index 2.0 82 2.25 ▲
Use Case #1 Improve campaign effectiveness
Use Case #2 Increase customer loyalty
Use Case #3Increase customer store visits
Use Case #4Reduce customer attrition
© Copyright 2017 Dell Inc.27
Bill SchmarzoChipotle Analytic Profile
NCE Score Var Trend
Demographic segments 3.2 92 1.85 ▲
Behavioral segments 3.1 67 3.25 ▼
Loyalty Index 2.0 82 2.25 ▲
Frequency Index 1.0 65 1.90 ▼
Recency Index 1.0 92 1.89 ▼
Lifetime Value Calc 1.0 99 1.05 ▲
Event Propensity 1.0 14 1.74
Promotion Propensity 1.1 02 1.15
Advocacy Propensity 2.1 08 1.20Attrition Propensity 1.2 09 1.25
Non-traditional Data• Social Media Posts• Home Value• Employment history• Job Change Frequency• Job Change Recency• Industry certifications• Industry awards• Social Media Connections• Education degrees• Rank of college• College donations• Volunteer activities• Parking tickets
Traditional Data• Purchases• Product Preferences• Add-on Preferences• Drink Preferences• Visit Frequency• Visit Recency• Visit Monetary• Market Basket• Group Size• Coupons• Consumer Comments• Store Manager Notes
Over time as more data is available, the analytics stored in the Analytic Profiles get refined and fine-tuned across multiple use cases
Analytic profiles: Customer

© Copyright 2017 Dell Inc.28
Analytic Profiles capture and codify analytic insights (scores, indices, rules, propensities) about Business Entities that support multiple Use Cases
Analytic profile x use case mapping
Analytic Profiles(Business Entities)
Improve Campaign
Effectiveness
Increase Customer
Loyalty
Increase Customer
Store Visits
Reduce Customer Attrition
Improve Customer Cross-sell
Increase Customer Advocacy
Improve New Product
Introductions
$62M $56M $26M $24M $14M $18M $27M
Customers √ √ √ √ √ √ √
Products √ √ √ √ √ √ √
Stores √ √ √ √ √
Managers √ √ √ √
Local Events √ √
Competitors √ √ √ √
Suppliers √ √ √ √

© Copyright 2017 Dell Inc.29
Data lake promotes collaborative value creation
Increase Customer Cross-sell
Increase Customer Loyalty
Reduce Customer Attrition
Increase Customer Advocacy
Optimize Store Remodeling
Improve Manager Retention
Improve New Product Introductions
Increase Customer Store Visits
Improve Hiring Effectiveness
Improve Campaign Effectiveness
DATA LAKE
© Copyright 2017 Dell Inc.30
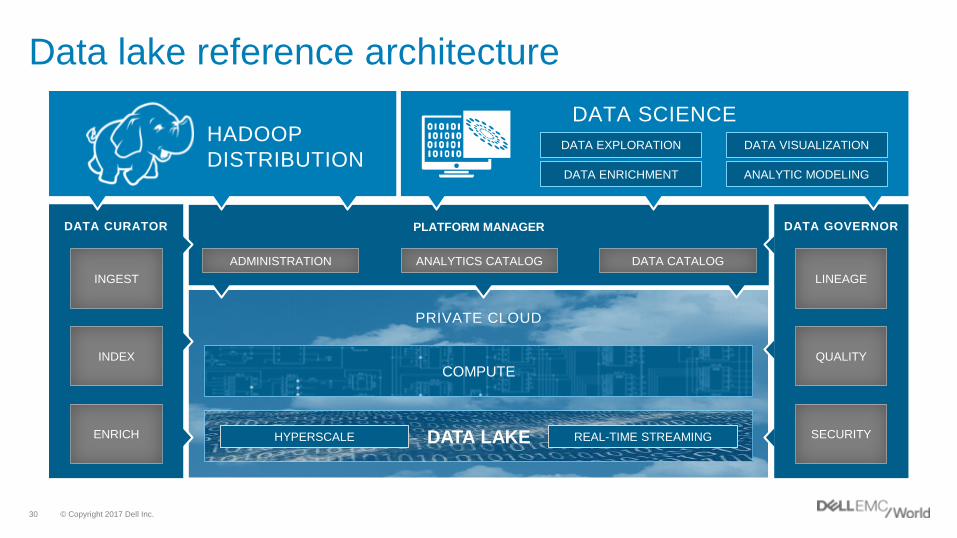
Data lake reference architecture
PLATFORM MANAGER DATA GOVERNORDATA CURATOR
ENRICH
INGEST
INDEX
PRIVATE CLOUD
DATA LAKE REAL-TIME STREAMINGHYPERSCALE
LINEAGE
QUALITY
SECURITY
ADMINISTRATION ANALYTICS CATALOG DATA CATALOG
HADOOP DISTRIBUTION
DATA SCIENCEDATA EXPLORATION DATA VISUALIZATION
DATA ENRICHMENT ANALYTIC MODELING
COMPUTE

SUMMARYEarning your “Big Data MBA”

© Copyright 2017 Dell Inc.32
Big data business model maturity index
BUSINESS OPTIMIZATION
BUSINESS INSIGHTSBUSINESS
MONITORING
INSIGHTSMONETIZATION
BUSINESSMETAMORPHOSIS
PrescriptiveRecommendations
Economic Drivers
Key Business Processes
Measures effectiveness of leveraging data and
analytics to power business

© Copyright 2017 Dell Inc.33
Measures effectiveness of leveraging data and
analytics to power business
BUSINESS OPTIMIZATION
BUSINESS INSIGHTSBUSINESS
MONITORING
INSIGHTSMONETIZATION
BUSINESSMETAMORPHOSIS
PrescriptiveRecommendations
Economic Drivers
Key Business Processes
DESCRIPTIVESTATISTICS
PREDICTIVEMODELING
PRESCRIPTIVERECOMMENDATIONS
ARTIFICIALINTELLIGENCE
DATA MINING
MACHINE LEARNINGAI
Big data business model maturity index
© Copyright 2017 Dell Inc.33

© Copyright 2017 Dell Inc.34
Dell EMC big data services
Deploy
Implement the analytics use case into production to create an
operational Big Data solution to a business problem.
Business(analytics use cases)
Technology(capabilities)
DEPLOYASSESS PROVE
(Build)Big Data Technical
Implementation
Big Data Vision
Workshop
(Buy)Analytic Insights Module:• Software Installation• Use Case Implementation
Big Data Technology
Advisory
Buildor
Buy?
Big Data Proof of
Value
Big DataProof of
Technology
Assess
Identify and prioritize an analytics use case that offers an optimal
combination of business benefits and implementation feasibility.
Prove
Demonstrate how the analytics use case would deliver analytic lift if put
into production and prove the potential ROI.

© Copyright 2017 Dell Inc.35
Thank you!BILL SCHMARZO
• Dell EMC Services, CTO, Big Data Practice• Executive Fellow, University San Francisco School of ManagementUniversity San Francisco Research: Economics of Data and Analytics
Blog: http://infocus.emc.com/author/william_schmarzo/– To Achieve Big Data’s Potential, Get It Into The Boardroom
– Big Data Business Model Maturity Index
– Big Data For Competitive Differentiation
– History lesson on economic-driven business transformation
– User Experience: the new king of the business
– How I’ve Learned To Stop Worrying And Love The Data Lake
– Thinking Like A Data Scientist
Contact InformationEmail: [email protected]
Twitter: @schmarzo
