denver and the state of low- and middle-income housing · pdf file ·...
TRANSCRIPT

P O L I C Y A D V I S O R Y G R O U P
R E S E A RC H R E PO R T
Denver and the State of Low- and
Middle-Income Housing Strategies to Preserve Affordability and Opportunities for the Future
Diana Elliott Tanaya Srini Carl Hedman Shiva Kooragayala
Cary Lou
May 2017

A BO U T THE U RBA N IN S T ITU TE
The nonprofit Urban Institute is dedicated to elevating the debate on social and economic policy. For nearly five
decades, Urban scholars have conducted research and offered evidence-based solutions that improve lives and
strengthen communities across a rapidly urbanizing world. Their objective research helps expand opportunities for
all, reduce hardship among the most vulnerable, and strengthen the effectiveness of the public sector.
Copyright © May 2017. Urban Institute. Permission is granted for reproduction of this file, with attribution to the
Urban Institute. Cover photo via Shutterstock.

Contents Executive Summary v
Denver and the State of Low- and Middle-Income Housing 1
Introduction 1
A Brief History of Housing in Denver Neighborhoods 3
Changing Demographics in Denver’s Neighborhoods 9
Housing Units 17
Lending Activity 21
Neighborhood Change Typology: Understanding Opportunities for Preserving and Creating LMI
Housing 22
The Denver Community: Policies and Practices for Inclusive Neighborhoods 47
Current LMI Affordable Housing Policies Employed by Denver Leadership 47
Community and Nongovernmental Affordable Housing Resources in Denver 49
Denver Stakeholders: Themes from Conversations about LMI Affordable Housing Issues 51
LMI Affordable Housing Program Recommendations in the Denver Context 57
Conclusion 66
Appendix A. Demographic Characteristics 68
Appendix B. Housing Characteristics 82
Appendix C: Neighborhood Change Typology Indexes 91
Appendix D. Data and Methods 99
Neighborhood Typology 100
Demographic and Housing Indicators 103
HUD Income Limits 103
Lending Activity 104
Policy Recommendations 105
Notes 106
References 111
About the Authors 113
Statement of Independence 114

I V A C K N O W L E D G M E N T S
Acknowledgments This report was funded by a grant from JPMorgan Chase. We are grateful to them and to all our funders,
who make it possible for Urban to advance its mission.
The views expressed are those of the authors and should not be attributed to the Urban Institute,
its trustees, or its funders. Funders do not determine research findings or the insights and
recommendations of Urban experts. Further information on the Urban Institute’s funding principles is
available at www.urban.org/support.
We thank Liza Cowan, Rolf Pendall, and Erika Poethig for their expertise and helpful suggestions.
We are also grateful to David Hinson for his editorial support.
Finally, we are tremendously grateful to Seth Mones and Yvette Ruiz for facilitating our work in
Denver and the many stakeholders we met with in the city and county, including Denver Office of
Economic Development leadership and staff, Denver-based developers, nonprofit and philanthropic
affordable housing advocates, and Globeville community organizers and housing experts. These
stakeholders contributed their time and thoughts on the local context of affordable housing and
community development to this work, and the report would not have been possible without their
insights. Any errors in the characterizations of stakeholder perspectives should be attributed to the
authors.

E X E C U T I V E S U M M A R Y V
Executive Summary Denver is experiencing rapid population growth and economic success, which has led to rising housing
costs that make the city cost-prohibitive to longtime residents and newcomers alike. This is especially
the case for low- and middle-income (LMI) households (i.e., families who make between 50 and 120
percent of the area median income), who make too much for subsidies and too little to pay market
prices. This report examines the state of LMI housing in Denver through a data-rich analysis of the
population and housing market changes from 2000 to 2015. Through a typology, we identify which
neighborhoods are changing the most for LMI residents and which ones most need to create and
preserve LMI housing. Finally, informed by our meetings with stakeholders, we identify policy and
programmatic tools that could make a difference for LMI housing affordability in Denver.
Population and housing stock trends indicate that Denver’s population has exploded over the last
15 years. The following findings describe where Denver’s families live and how their housing has
changed:
Neighborhoods that were once LMI strongholds (e.g., Five Points and Whittier) have gentrified
in the last 15 years, and longtime residents may be left out of the prosperity. Many
neighborhoods in the Lower Downtown area have changed, and residents there have higher
income and are more highly educated than was the case 15 years ago. Homeownership rates
have increased in the downtown areas. Consequently, LMI housing policy could focus on how to
create and preserve workforce housing in these areas because of such rapid changes.
Many LMI households in 2015 are located in southwest Denver, putting a priority on
preserving naturally occurring affordable housing in these neighborhoods. This is also where
many of Denver’s Latino families live. Neighborhoods such as Bear Valley, Fort Logan, Harvey
Park, and Marston have remained consistently LMI and are likely to remain so.
Rental cost burdens, households paying 30 percent or more of their income on housing costs,
have increased from 2000 to 2015 for very low–income (VLI) and LMI families (60 to 82
percent among VLI households and 7 to 26 percent among LMI households). In the Belcaro
neighborhood, rental cost burden for LMI families increased from 46 to 77 percent from 2000
to 2015. Renters in Denver are feeling a housing-cost squeeze.
Historic preservation and light rail development are factors in gentrification. The creation and
continued development of the Lower Downtown area has changed the composition of the

V I E X E C U T I V E S U M M A R Y
population downtown, and fewer VLI and LMI families live in this area in 2015 than in 2000.
Similarly, neighborhoods near light rail locations have seen rapid changes in rental and housing
prices, as well as in the composition of the population, such that more high-income residents
resided there in 2015 than in 2000.
The data and stakeholder information suggest that Globeville is a neighborhood for immediate
LMI housing preservation. Given its current low housing costs, large stock of naturally
occurring affordable housing, existing LMI population, and considerable planned economic
development and a light rail station to be opened this year, the neighborhood could be on the
cusp of gentrification.
In meetings with housing stakeholders in Denver, we heard about barriers to LMI affordable
housing, as well as tremendous opportunities for programmatic and policy solutions. Key points include
the following:
Denver’s extraordinary population growth is changing the city’s demographics and demand for
housing in ways that intersect with equity issues. Displacement, for example, is occurring in LMI
neighborhoods, such as Globeville, which have been populated by majorities of Latino families
in recent decades. The population migrating into Denver is more likely to be young, white, and
higher income than many of the city’s longtime residents. These demographic shifts suggest
that the city should use a lens focused on equity and inclusion in future conversations, planning,
and decisionmaking about housing and economic development policies.
State policy is a constraint on Denver’s abilities to address affordable housing. Colorado does
not allow rent control, and even if municipalities such as Denver wanted to stabilize rising
rents, the Telluride decision prohibits them from creating local laws that do so. The state’s
construction defect law was enacted to protect home and condominium buyers from
construction flaws, but has instead provided incentives for developing market-rate apartment
units rather than condominiums. These policies have contributed to an unbalanced housing
market in Denver, such that a proliferation of market-rate units contributes to rent inflation,
but the city has few levers to protect affordability for renters. Land trusts and expanded
tenants’ rights (e.g., preservation of affordable units through the right of first refusal) may be
increasingly important strategies for Denver moving forward.
Denver has been thoughtful and forward thinking in its approach to LMI affordable housing
policies and programs, but the city and other affordable housing stakeholders cannot keep pace
with demand, particularly in neighborhoods slated to undertake rapid change in coming years.

E X E C U T I V E S U M M A R Y V I I
The recently passed Affordable Housing Trust Fund was a successful collaboration to seed a
fund for the next 10 years with up to $150 million for developing affordable housing. But
stakeholders suggest that the funds will not fully meet the demand for affordable housing.
Private funding may provide gap financing for preserving and constructing new affordable units
in Denver. For example, social impact investing—whether an accelerator fund or locally based
investment fund, such as a real estate investment trust—can leverage private funding to
supplement public funds.
These findings suggest that Denver, an already innovative city compared with most in approaching
affordable housing, will need to think creatively about LMI affordability as it continues to experience
growth and economic success.


Denver and the State of Low- and
Middle-Income Housing
Introduction
Denver, like many western cities, is experiencing rapid population growth. As its economy flourishes
and young professionals are drawn to the city for its robust job market, abundant sunshine, and
proximity to nature and outdoor activities, an already tight housing market has become tighter. This
puts pressure on both new arrivals and existing residents to find affordable housing in a city where it
has become scarce. Facing particular challenges are low- and middle-income (LMI) residents, especially
renters, because rents are rising in many neighborhoods without an adequate supply of housing to keep
up with the demand for affordable units. Although Denver’s lowest-income renters are eligible for
federal housing subsidies, LMI families make too much to qualify for subsidies and too little to afford
rapidly rising housing prices. Consequently, there is a need to understand the state of LMI housing in
Denver’s neighborhoods and to identify opportunities to bolster affordable housing and strengthen
communities.
This report explores the state of LMI housing in Denver by focusing on changes in the city’s more
than 80 neighborhoods. By focusing on households making between 50 and 120 percent of the area
median income (AMI), or $40,050 to $96,120 a year in 2016 for a household of four,1 this report
highlights households who may be especially challenged by Denver’s rising housing costs. Furthermore,
this report describes Denver’s LMI households and affordable housing within a neighborhood context,
reflecting how the community, developers, and planners think about these issues within their city.
This report has two key components. First, a data-rich analysis of demographic, economic, and
housing trends is presented across Denver’s neighborhoods to identify where the most potential exists
for maintaining and creating affordable housing for LMI households. Second, insights from meetings
with stakeholders involved in housing and development in Denver are summarized to best identify the
direction that the city and its residents should move toward on these issues. Through integrating
rigorous neighborhood-level data and the guidance and policy needs of those working directly in the
community, we can identify strategies to preserve the economic diversity of Denver’s residents and to
ensure that all may benefit from the city’s prosperity.

2 D E N V E R A N D T H E S T A T E O F L O W - A N D M I D D L E - I N C O M E H O U S I N G
BOX 1
LMI Households within the Continuum of Affordable Housing Choices and Strategies
A continuum of affordable housing options and strategies align with family income levels defined in
relation to the area median income. Municipalities generally pursue several policy and programmatic
options to meet families’ needs across the income spectrum. The strategies listed above are only a
sample of the options and best practices municipalities use.
This report focuses on the needs of low- and middle-income (LMI) families who earn too much to
qualify for publicly subsidized rental assistance, but not enough to afford much of the market-rate
housing available. For LMI families, municipalities typically pursue strategies that expand their access to
affordable rental and owner-occupied workforce housing or assist them with homeownership. The
strategies municipalities pursue for LMI families vary by place and local context. These context-specific
policy and program options are the focus of this report.

D E N V E R A N D T H E S T A T E O F L O W - A N D M I D D L E - I N C O M E H O U S I N G 3
A Brief History of Housing in Denver Neighborhoods
Across its relatively young history, Denver has been characterized by periodic and explosive growth,
arrivals of new and diverse residents in its LMI neighborhoods, and constraints and opportunities in its
development and city planning. These themes shed light on why present-day Denver has challenges
with housing affordability for LMI residents. This section explores a brief history of the city, how the
history relates to LMI households and housing issues, Denver’s recent population growth, and the
unique policy context of the city and state that affect affordable housing availability for LMI residents.
Denver, like many western cities, has its origin in the gold rush and 19th century expansion. Denver
was sparsely populated until 1858, when gold was discovered and miners began to settle the area in
growing numbers. Two of Denver’s original encampments during the gold rush were St. Charles and the
present-day neighborhood of Auraria, settlements formed in 1858 across from each other on the South
Platte River at the junction of Cherry Creek.2 Although St. Charles was named Denver first, Auraria was
soon integrated within the incorporation, laying the foundation for the present-day city.3
As Denver grew, its neighborhoods expanded around the original city core. Some of Denver’s oldest
neighborhoods (e.g., Curtis Park, Five Points, and Whittier) came into being during an era of prosperity
in Denver—between 1870, when the city became an important railroad hub, and 1893, when Denver’s
economy nearly collapsed because of a devaluation in silver.4 During this period, Denver experienced
the same explosive population growth and development that the city is experiencing today. Denver’s
earliest neighborhoods were mixed income and mixed occupation before Denver’s most privileged
residents created their own neighborhood enclaves (e.g., Capitol Hill) at the beginning of the 20th
century and left such older neighborhoods to be populated mainly by LMI and new immigrant
households.5 But in the renaissance of Denver’s neighborhoods in the last 15 years, even traditionally
LMI neighborhoods are experiencing gentrification.6
Other neighborhoods that spread out from the center were working-class neighborhoods by
design, home to the city’s earliest LMI residents. Barnum, on the western border of the city, is one such
neighborhood, which started intentionally as a working-class Denver suburb, keeping this identity over
the years. In the post–World War II era, Barnum’s first wave of working-class residents began moving to
more far-removed suburbs and more Hispanic residents moved in, shifting the demographics from 10
percent Hispanic to 75 percent Hispanic between 1950 and 2000. But Barnum’s status as a working-
class neighborhood has been secured, as homeowners of modest means have continuously populated
the neighborhood over its history.7 Even today, many LMI households live in neighborhoods in the west
and southwest of the city, such as Barnum.

4 D E N V E R A N D T H E S T A T E O F L O W - A N D M I D D L E - I N C O M E H O U S I N G
Denver’s early history of housing and development was one of growth outward from the inner core
as more land was annexed, sparsely populated neighborhoods were created, and density in those
neighborhoods increased. Yet, as these population and settlement dynamics were happening, policies
and regulations were dictating how the city land was planned and used. This has become an especially
prominent issue in recent years, as Denver’s explosive population growth has created unprecedented
demand for housing, especially affordable housing. Denver’s population in 2010 was 604,414 and grew
nearly 13 percent to 682,545 by 2015, with the addition of nearly 80,000 new residents.8 As a result of
the population boom and lagging housing stock, housing costs have increased faster than incomes.9
Denver’s residents and leaders are aware of the growing affordable housing issue and have pursued
various strategies to create and preserve affordable housing through funding, policy, and regulation.
With respect to funding, like most state and local efforts, Denver programs that directly support
developing and preserving affordable housing financially seek to leverage other public (federal) and
private investments by providing gap funds. The city has several programs that fall into this category.
Established in 2015, the city’s revolving affordable housing loan fund offers funds to low-income
housing developers through the City of Denver, leveraging state and city funds, to provide gap financing
to encourage take-up of the federal government’s 4 percent Low-Income Housing Tax Credit (LIHTC)
program (Denver Office of Economic Development 2016).10 This program will provide around $10
million in funding over 10 years and is replenished as the loans are paid off, but is not a permanent
program (Denver Office of Economic Development 2015a; Peterson 2016). The revolving loan fund was
instrumental in completing three LMI housing developments in the first year of the program, which
added nearly 300 new affordable housing units (Denver Office of Economic Development 2015a). The
revolving loan fund replaced the inclusionary housing ordinance, which had required all new, for-sale
housing developments with 30 or more units to reserve 10 percent of units for affordable housing,
negotiate alternative arrangements that are more flexible on one requirement but exceed criteria in
others, or pay a fee-in-lieu that had previously created 479 affordable units in the city primarily through
fees paid-in-lieu (Denver Office of Economic Development 2015b). The state also funds its own 4
percent Low-Income Housing Tax Credit, set up in 2001 and recently extended through 2019, but this is
a relatively small piece of affordable housing funding, providing around $5 million in funding in 2015
(Peterson 2016).
Another way Denver has funded affordable housing is through transit-oriented design (TOD).
Denver is a pioneer in TOD as one of the first cities to develop a transit-focused strategic growth plan
and to create a fund dedicated toward TOD, a public-private partnership between Enterprise
Community Partners, the city, state offices, and nonprofits and philanthropies (Enterprise, n.d.).

D E N V E R A N D T H E S T A T E O F L O W - A N D M I D D L E - I N C O M E H O U S I N G 5
Originally a $15 million fund with a single borrower focused on the city, this program has grown in the
last few years into a broader $24 million regional effort with multiple participants looking to create and
preserve affordable housing at transit sites (Enterprise, n.d.). Similar to other state and local efforts, this
program helps guarantee the cost of land around transit by buying and banking lots while developers
await additional tax credits and funding to build.
Recognizing the magnitude of demand and the need for a sustainable strategy, these activities have
established a permanent, dedicated fund to support affordable housing development and preservation
by the city in 2016. Put into effect in 2017, this fund is supported by a property tax increase (of 0.5
mills) and one-time impact fees on new development, with an additional $8 million in city funds
dedicated in 2016 for current projects (Denver Office of Economic Development 2015a). The fund is
anticipated to grow to $150 million over the next 10 years and will be used to develop and preserve
many affordable housing options, including permanent supportive housing for residents at risk, rentals
for LMI residents, and homes for sale to middle-income buyers.11
In addition to the Affordable Housing Trust Fund, Denver has made other investments and has
started initiatives to stem the loss of affordable housing and to create more units. In 2015, Denver
invested nearly $8 million in nine new developments that will lead to over 600 new income-restricted
units through restrictive covenants with developers (Denver Office of Economic Development 2015a).
Other programs offer financial incentives directly to LMI homebuyers. One is the Metro Mortgage
Assistance Plus program, which provides up to 4 percent down payment and closing-cost assistance for
LMI homebuyers and has offered more than a thousand grants totaling $100 million since 2013 that
have facilitated the sale of 595 homes (City of Denver 2014; Denver Office of Economic Development
2016). The program is funded by bonds, but receives sustained funding through the resale of these
mortgages and serves borrowers up to 150 percent of the AMI, though most borrowers have income
below $60,000 a year (Denver Office of Economic Development 2015a). Another program to assist
first-time LMI homebuyers is the Mortgage Credit Certificate program, a federal income tax credit for
30 percent of interest paid on a mortgage up to $2,000 (Denver Office of Economic Development
2016). Although the credit applies to federal tax liability, eligibility is determined through state and
local programs that issue the certificates to qualifying buyers making eligible purchases.12 Denver also
funds the Colorado Housing Assistance Corporation, which issues loans to new LMI homebuyers to help
cover down payment and closing costs (Denver Office of Economic Development 2016).
Another promising regulatory tool is Denver’s affordable housing preservation ordinance—passed
in 2000 and recently strengthened in 2015—that allows the city the right of first refusal to purchase
affordable housing units on covenants being sold, as well as more advanced notice of units whose

6 D E N V E R A N D T H E S T A T E O F L O W - A N D M I D D L E - I N C O M E H O U S I N G
covenants are expiring (Denver Office of Economic Development 2016). Using zoning changes and
exceptions, the city has relaxed restrictions, including parking requirements in transit-served areas, as
part of TOD and allowed for greater density through infill and developer density bonuses (Peterson
2016). Finally, city government is also working with developers to streamline the process for building or
rehabilitating affordable housing by reducing the regulatory burden in the approvals process (City of
Denver 2014).
One way to better leverage these regulatory and funding tools is to improve data and information
about Denver’s efforts in these domains, a city government priority. One initiative seeks to identify and
map affordable housing and to get more timely information on units that are leaving covenants and
covenant units that are going to sale (City of Denver 2014; Denver Office of Economic Development
2016). The government has also been working to identify neighborhoods at high risk of gentrification
and has engaged in land banking, prioritizing the preservation of affordable units and engaging in
resident and business retention strategies in these areas (Denver Office of Economic Development
2016). Through such targeted information, the government can more rapidly respond to affordable
housing needs.
Many of these city-funded programs have emerged from policy strategies implemented, in some
cases, from the mayor’s office. For example, the mayor has a 3x5 Housing Initiative to create 3,000
affordable units in five years (2014–19) that is ahead of schedule (Denver Office of Economic
Development 2015a). Another element is Denver’s Road Home policy plan, a 10-year policy to end
homelessness that was started in 2005 and created nearly 3,000 new housing units for the chronically
homeless and provided 6,000 or more families with eviction assistance that prevented homelessness
(Denver Office of Economic Development 2015a). The mayor also established a Housing Task Force in
2012 composed of stakeholders from across the spectrum charged with guiding affordable housing
efforts and providing key recommendations that became the backbone of the city’s strategic plan (City
of Denver 2014). In 2017, the mayor also created the Office of Housing Opportunities for People
Everywhere (HOPE) and appointed its director to address housing issues comprehensively in the city
from homelessness to homeownership.13
BOX 2
Homelessness and Affordable Housing in Denver
This report focuses on the affordable housing needs of low- and middle-income families who are
typically ineligible for a housing subsidy. But homelessness is relevant to this narrative in Denver. The
2016 point-in-time survey found that about 3,600 people were homeless in the city, many of whom are

D E N V E R A N D T H E S T A T E O F L O W - A N D M I D D L E - I N C O M E H O U S I N G 7
veterans, families, or meet the US Department of Housing and Urban Development standard for
chronically homeless (MDHI 2016). Denver has included supporting housing affordability for homeless
residents as a critical rung in the continuum of housing presented in the Housing Denver: A 5-Year Plan
(City of Denver 2014) for affordable housing that expires in 2019. Similarly, Opening Doors (USICH
2015), the comprehensive federal plan for preventing and ending homelessness, considers access to
affordable housing, and lack thereof, as a critical cause and solution for effectively meeting its goals.
Data indicate that the cost of housing and cost burdens for renters and homeowners have grown in
recent years, and qualitative evidence suggests these trends are likely to continue in many historically
low-income neighborhoods. The consequences are twofold:
1. As the gap between families’ incomes and cost of housing grows, more people are at risk of
homelessness.
2. Although 30 percent of area median income is a conventionally cited threshold for being at risk
of homelessness, area median income is a relative metric. Families’ incomes may hover above
this threshold, but rising housing costs and increasing cost burdens can have the same effect as
low incomes. Absent income growth, families not at risk of homelessness stand to become
vulnerable in the future.
Preserving and expanding affordable housing is necessary to reduce the likelihood that low- and
middle-income families will face the risk of homelessness. The City of Denver has taken numerous steps
to this end, detailed in the plan for “Denver’s Road Home” that lasted from 2005 to 2015. A few
examples include the following:
The 3x5 Housing Initiative to add 3,000 affordable housing units by 2019
Recently updated zoning, building, and development codes to ensure an adequate supply of
affordable and emergency housing
The Denver Social Impact Bond Initiative is exploring financing mechanisms to connect the
private and public sectors and to provide affordable housing for chronically homeless people
Even as a leader in this area, Denver faces challenges providing affordable housing for its residents.
Some state laws limit the ability and tools available to the city in creating and preserving affordable
housing. A 1980 Colorado statute forbids cities from requiring rent controls except when the city has a
contract or equity stake in a development (Denver Office of Economic Development 2016). Further
hampering renters, the city’s inclusionary housing ordinance applies only to new, for-sale units and not
to those being developed for rent (Peterson 2016). These challenges facing renters are compounded
and magnified by the relative dearth of starter homes, in part a consequence of a 2009 state supreme
court decision that restricted condominium developers’ right to insurance for construction defects,

8 D E N V E R A N D T H E S T A T E O F L O W - A N D M I D D L E - I N C O M E H O U S I N G
which has had a chilling effect on new condominium construction (Peterson 2016). The 1982 Gallagher
and 1992 Taxpayer’s Bill of Rights amendments to the state constitution have limited the city’s and
state’s ability to raise taxes to fund investments in affordable housing and reduced the level of certainty
for funding in different domains by shifting funding decisions from elected officials to voters (The Bell
Policy Center 2015). The 1974 Poundstone amendment also imposed geographic constraints on
Denver’s size, making it more difficult to acquire land (Denver Office of Economic Development 2016).
Denver’s history as a frontier boom town and its recent and explosive population growth have
defined its development and have solidified its reputation as an attractive place to live. Denver has been
thoughtful about staying ahead of affordable housing issues through funding and programmatic
innovations, but the population increases and tight housing stock have culminated in a challenging and
pricey housing market. This makes the need to identify new and innovative programmatic and policy
solutions an especially pressing concern as LMI residents may be especially challenged by Denver’s
housing market.
BOX 3
Defining Denver’s Neighborhoods
Neighborhoods often reflect shared community identity across cities—boundaries understood by
residents, but not often quantified in official data sources. This report presents data at the
neighborhood level, using geographic information system boundaries made available through the City
of Denver to aggregate census tract–level data into the corresponding neighborhoods.a Analyses in this
report are broken out for neighborhoods wherever permitted with the data available. Denver has 78
neighborhoods (figure 1).
a Neighborhood boundaries can be found at “Statistical Neighborhoods,” Denver Open Data Catalog, last updated September 4,
2016, https://www.denvergov.org/opendata/dataset/city-and-county-of-denver-statistical-neighborhoods.
FIGURE 1

D E N V E R A N D T H E S T A T E O F L O W - A N D M I D D L E - I N C O M E H O U S I N G 9
Neighborhoods in Denver and Regional Transportation District Light Rail Lines
Source: Regional Transportation District.
Changing Demographics in Denver’s Neighborhoods
People drive the diversity and development of any city. Understanding population dynamics is critical
for identifying LMI housing opportunities. To understand Denver’s neighborhoods, we describe the
populations living in them and how these areas have changed. We rely on data from the 2000 Decennial
Census and the American Community Survey’s five-year sample from 2011 to 2015 for localized data
(referenced as “2015” throughout this report). As these data show, some of Denver’s neighborhoods
have lost LMI households, and others have gained them.

1 0 D E N V E R A N D T H E S T A T E O F L O W - A N D M I D D L E - I N C O M E H O U S I N G
Population and Households
Denver has experienced tremendous population growth. Since 2010, Denver has added over 75,000
new residents for a total population of 682,545 in 2015, growing 13 percent over six years.14 In 2000,
Denver had a population of 554,636. The city has added nearly 128,000 new residents since then,
growing 23 percent (appendix table A.1).
The neighborhoods where growth has been most concentrated have been in the center of the city
and on the edge of the city line at the boundary with Aurora. The Union Station, Auraria, Central
Business District, and Civic Center neighborhoods more than doubled in size between 2000 and 2015.
These neighborhoods have few residents compared with other areas. But the collective growth of the
neighborhoods of the Lower Downtown (LoDo) area reflect the revitalization and gentrification
brought about, in part, by city zoning and historic preservation.15 Such population growth in downtown
Denver also reflects a phenomenon found in other cities, where residents desire living closer to
workplaces and other city-life amenities. Not surprisingly, these LoDo neighborhoods have collectively
doubled the number of households within them since 2000.
Meanwhile, the Gateway–Green Valley Ranch, Lowry Field, and Stapleton neighborhoods on the
Denver-Aurora city border have been growing tremendously since 2000 (appendix table A.1). These
three neighborhoods in 2000 only had 15,000 residents, but by 2015, their collective population
increased to nearly 62,000 residents. The number of households in these communities increased by a
similar share—from over 4,700 households in 2000 to more than 20,000 by 2015. These three Denver
neighborhoods were part of redevelopment and annexation that happened in the 1990s, because of the
creation of Denver International Airport, the reuse of Stapleton Field, and the acquisition of Lowry Air
Field from the Air Force (City of Denver 2000). Because of long-term planning, these areas have seen
tremendous residential growth.
Key Demographics: Race, Ethnicity, Age, and Education
Like many cities, Denver has a diverse population, but its neighborhoods tend to reflect residential
clustering—by race and ethnicity, and between younger and older households. About 31 percent of
Denver’s population identifies as Hispanic or Latino, but some neighborhoods are ethnically
concentrated, such that in nine neighborhoods, at least 7 in 10 residents in 2015 were Hispanic or
Latino. Eight of these neighborhoods are clustered in southwest Denver, including Athmar Park,
Barnum, Barnum West, College View–South Platte, Mar Lee, Valverde, Villa Park, and Westwood, and
have all been majority Hispanic and Latino since 2000 (figure 2). Similarly, the city’s black population is

D E N V E R A N D T H E S T A T E O F L O W - A N D M I D D L E - I N C O M E H O U S I N G 1 1
clustered in the northeast corner, especially in the Northeast Park Hill neighborhood, where over 4 in
10 residents identified as such (appendix table A.2).
FIGURE 2
Hispanic Population in Denver Neighborhoods, 2011–15
Source: Urban Institute tabulations of 2011–15 American Community Survey data.
There is considerable overlap in those neighborhoods where Hispanic and Latino and black
households are concentrated and households with children in them. Over half the households in
Barnum, Elyria Swansea, Gateway–Green Valley Ranch, Montbello, Stapleton, Sun Valley, Valverde, and
Westwood have children under age 18 (appendix table A.3). Consequently, affordable housing
considerations in these neighborhoods should factor in the need for family-appropriate housing with
multiple bedrooms.
Shifts in who has a bachelor’s degree reveals a great deal about how the city has changed and who
has moved in. Between 2000 and 2015, the percentage of city residents with a bachelor’s degree
increased 5 percent (from 22 to 27 percent). But in some neighborhoods, this change was pronounced—
increasing 10 percentage points or more—reflecting an influx of highly educated residents into certain

1 2 D E N V E R A N D T H E S T A T E O F L O W - A N D M I D D L E - I N C O M E H O U S I N G
neighborhoods. This has been especially notable in select neighborhoods fanning out from the LoDo
district, where the population with a bachelor’s degree increased 15 percentage points or more,
including Auraria, City Park, City Park West, Highland, North Capitol Hill, and Whittier. The Highland
neighborhood, just north of Union Station, increased 23 percentage points, such that nearly 4 in 10
residents now have a bachelor’s degree (appendix table A.3). These shifts are one more sign that
gentrification has occurred throughout many Denver neighborhoods.
LMI Households: Who Are They, Where Are They Concentrated, and How Have
They Changed?
Amid an influx of new arrivals and increasing gentrification, especially around the city center, where do
LMI households (i.e., those who earn 50 to 120 percent of the Denver AMI) live, and how have
neighborhood income distributions changed (appendix table A.5)? Overall, 35 percent of Denver
households were LMI in 2000 and 38 percent of households were LMI in 2015. The percentage of very
low–income households (VLI, or households who earn less than 50 percent of the Denver AMI)
decreased 6 percent (from 44 to 38 percent) from 2000 to 2015, reflecting the shift in Denver’s
population to higher-income households.
Some neighborhoods have remained solidly LMI from 2000 to 2015. Thirteen neighborhoods in
Denver persisted as neighborhoods in which at least 4 in 10 households were LMI in 2000 and 2015:
Athmar Park, Barnum West, Bear Valley, Gateway–Green Valley Ranch, Hampden South, Harvey Park,
Indian Creek, Mar Lee, Marston, Montbello, Overland, Regis, and Rosedale. Many LMI households are in
southwest Denver. Two important exceptions are Montbello and Gateway–Green Valley Ranch in the
upper northeast corner, where about half of all households are LMI (figure 4). These neighborhoods
have persisted as ones where LMI households reside in higher shares, suggesting that these locations
are where LMI affordability should be prioritized.
Who lives in the average LMI household? Detailed data about the demographics of Denver by
income show that the average LMI household head is around age 45, prime working age, and the
average household size is 2.17 people. Very low–income household heads were on average four years
older than LMI heads, and high-income heads were on average two years older than LMI heads. Very
low–income households averaged less than two people, and high-income households averaged slightly
over 2.5 people (table 1). Looking at occupation, the heads of VLI and LMI households were largely
clustered in the service, retail, cleaning, and education sectors. High-income heads were more

D E N V E R A N D T H E S T A T E O F L O W - A N D M I D D L E - I N C O M E H O U S I N G 1 3
commonly in managerial or professional occupations (table 2). Low- and middle-income household
heads in Denver are teachers, nurses, retail employees, and office staff.
FIGURE 4
Share of Very Low–Income or Low-Income Households in Denver, 2011–15
Source: Urban Institute tabulations of 2011–15 American Community Survey data.
Notes: LMI = low and middle income; VLI = very low income.
TABLE 1
Select Characteristics by Income Group, Denver
VLI LMI HI
Average age of household head 48.6 44.6 46.5 Household size 1.82 2.17 2.52
Source: Urban Institute tabulations of 2011–15 American Community Survey Public Use Microdata Sample.
Notes: VLI = very low income (<50 percent AMI); LMI = low and middle income (50–120 percent AMI); HI = high income (>120
percent AMI).

1 4 D E N V E R A N D T H E S T A T E O F L O W - A N D M I D D L E - I N C O M E H O U S I N G
TABLE 2
Top 10 Reported Occupations for Head of Household by Income Group, Denver
Count Share of total (%)
VLI head of household Retail salespersons 2,241 2.7 Customer service representatives 2,027 2.4 Maids and housekeeping cleaners 1,768 2.1 Waiters and waitresses 1,761 2.1 Janitors and building cleaners 1,652 2.0 Secretaries and administrative assistants 1,478 1.8 Cashiers 1,465 1.8 Driver/sales workers and truck drivers 1,417 1.7 Cooks 1,299 1.6 Laborers and freight, stock, and material movers 1,233 1.5
LMI head of household Miscellaneous managers 2,547 2.6 Accountants and auditors 2,263 2.3 Elementary and middle school teachers 2,185 2.2 Customer service representatives 1,929 1.9 First-line supervisors of retail sales workers 1,630 1.6 Registered nurses 1,598 1.6 Secretaries and administrative assistants 1,441 1.5 Waiters and waitresses 1,432 1.4 Retail salespersons 1,377 1.4 Postsecondary teachers 1,316 1.3
High-income head of household Miscellaneous managers 3,566 5.4 Lawyers and judges, magistrates, and other judicial workers 2,243 3.4 Physicians and surgeons 1,946 3.0 Chief executives and legislators 1,814 2.8 Software developers, applications and systems software 1,586 2.4 Accountants and auditors 1,460 2.2 Management analysts 1,437 2.2 Marketing and sales managers 1,230 1.9 Real estate brokers and sales agents 1,199 1.8 Registered nurses 1,145 1.7
Source: Urban Institute tabulations of 2011–15 American Community Service Public Use Microdata Sample.
Notes: LMI = low and middle income; VLI = very low income.

D E N V E R A N D T H E S T A T E O F L O W - A N D M I D D L E - I N C O M E H O U S I N G 1 5
Renters and Homeowners
About half of Denver’s households are renters, and this has changed little since 2000 (up 3 percentage
points to 51 percent in 2015). The number of renter-occupied units increased most in the Civic Center
neighborhood (17 percent), Globeville (27 percent), Harvey Park (17 percent), and Overland (29
percent) (appendix table A.6 and figure 5). Why did Globeville and Overland’s share of renters increase
so much? These neighborhoods have seen influxes of new residents and housing development, in part
because these areas have been historically more affordable than other parts of the city.16 Changes in
affordability will have to be monitored as high-income residents move in and potentially displace low-
income ones. As cited in the Denver development plan for Globeville, affordable homeownership and
single-family dwellings have been historically important in the neighborhood, an asset to be preserved
as economic development progresses. Ensuring that low-income homeowners can stay in place as home
values rise is an element of the neighborhood plan (City of Denver 2016).
Overland’s population of renters changed in income mix tremendously. Although 64 percent of
Overland’s renters were very low income in 2000, just 30 percent were in 2015. At the same time, 27
percent of Overland’s renters were low and middle income in 2000, increasing to 56 percent by 2015.
Overland’s renters are increasingly high-income residents.

1 6 D E N V E R A N D T H E S T A T E O F L O W - A N D M I D D L E - I N C O M E H O U S I N G
FIGURE 5
Share of Renter-Occupied Households in Denver, 2011–15
Source: Urban Institute tabulations of 2011–15 American Community Survey data.

D E N V E R A N D T H E S T A T E O F L O W - A N D M I D D L E - I N C O M E H O U S I N G 1 7
Housing Units
Naturally occurring affordably housing (NOAH) is important for meeting LMI families’ needs. NOAH
opportunities tend to be in neighborhoods and municipalities with older housing stock or available
apartments at prices LMI households can afford. This section looks at the state of the housing stock
across Denver’s neighborhoods, including the availability, age, and price of rental units and homes for
purchase, to understand changes in affordable housing.
Changing Housing Stock
Denver’s housing stock changed considerably between 2000 and 2015. Some neighborhoods saw
tremendous growth in housing units. Neighborhoods that doubled in size include Gateway–Green
Valley (245 percent growth), Lowry Field (175 percent), Union Station (152 percent), Five Points (144
percent), and the Central Business District (139 percent). Meanwhile, four neighborhoods, all far from
the city center, grew less than 2 percent: Goldsmith, Hampden, Regis, and University (appendix table
B.1).
In contrast to the city’s population growth since 2000 (23 percent), the growth in housing units was
slower (17 percent). This may reflect a lag in the ability of new development to keep pace with the rapid
population influx.
NOAH neighborhoods are generally characterized by older housing stock, as units in older
structures are typically more affordable. In this analysis, we consider housing units built before 1980 to
be “old.” Denver’s share of older units dropped from 84 to 58 percent between 2000 and 2015. This
reflects a loss in older units and an extraordinary increase in new units. As of 2015, 17 percent of all
units were built since 2000.17 This is not uniformly the case across all Denver’s neighborhoods. In six
neighborhoods, all in southern Denver, 95 percent or more of the housing units were built before 1980:
Goldsmith (98 percent), Hampden (95 percent), Harvey Park (97 percent), Mar Lee (95 percent),
Virginia Village (95 percent), and Wellshire (95 percent) (appendix table B.5). Except for Wellshire,
these neighborhoods have the same or a greater percentage of units with rent below $1,000 a month
compared with Denver’s city average (appendix table B.4). Because of their older housing stock and
average to below-average rentals, these neighborhoods could be appropriate for preserving NOAH for
LMI families.

1 8 D E N V E R A N D T H E S T A T E O F L O W - A N D M I D D L E - I N C O M E H O U S I N G
In contrast, some neighborhoods have a great deal of newer housing stock, reflecting recent
development and growth. The areas on the city’s eastern border that were part of land annexation
following the redevelopment of the airport have seen new development since 1980, including Denver
International Airport and Gateway–Green Valley Ranch. Meanwhile, four neighborhoods east of LoDo
have seen a lot of new housing development, and less than a quarter of occupied housing units in these
areas were built before 1980, including City Park (21 percent), Civic Center (20 percent), Five Points
(17 percent), and Whittier (22 percent) (appendix table B.5).
NOAH is reflected in older and less-expensive housing units and in smaller-scale buildings. Areas
primarily composed of large multifamily housing units are in the LoDo area, including the Central
Business District (99 percent multifamily), Civic Center (99 percent), and Union Station (93 percent)
(appendix table B.3). Even in 2000, these areas were characterized by having mostly multifamily units,
so this reflects little change. In contrast, the Five Points and City Park neighborhoods saw a 15 and 14
percentage point increase in the share of multifamily units from 2000 to 2015, reflecting rapid
development and density growth. The neighborhood that has changed most in its housing unit
composition has been Overland, where in 2000, 87 percent of its housing units were single-family. By
2015, 49 percent were single-family units.
Renter Cost Burden
In 2015, around 51 percent of households in Denver rented. Renters are particularly vulnerable to
changes in the housing market, and rapidly rising property values can place tremendous pressure on
households to make rent, particularly LMI renters. The landscape of affordable rental units is rapidly
changing, but some neighborhoods have a higher concentration of affordable and older rental housing
units (appendix B). The important questions here are whether rentals are affordable to LMI households
and whether such families are burdened by housing costs. This section describes how renter
households, especially LMI households, are faring with respect to housing cost burden. A household is
cost burdened if it spends 30 percent or more of household income on housing.
Housing cost–burden rates have increased for renters in Denver over the last 15 years (figure 6).
Among renter households, around 47 percent were housing cost burdened in 2015 compared with 39
percent in 2000. For VLI and LMI renters, the change was more pronounced. Cost burden rates for VLI
renters increased from 60 to 82 percent. Low- and middle-income renter households, whose cost
burden rates were around 7 percent in 2000, had cost burden rates increase to 26 percent by 2015.
Cost burden rates for high-income renters remained around 1 percent.

D E N V E R A N D T H E S T A T E O F L O W - A N D M I D D L E - I N C O M E H O U S I N G 1 9
FIGURE 6
Renter Households by Cost Burden in 2000 and 2015
Source: Urban Institute tabulations of 2000 Decennial Census and 2011–15 American Community Survey data.
Note: AMI = area median income.
Although most LMI households were not cost burdened in 2015, 74 of the 78 neighborhoods had
increases in renter cost burden rates since 2000, and in some areas, the changes were dramatic (figure
7). Thirteen neighborhoods experienced an over 30 percentage point increase in the rate of housing
cost burden for LMI households (table 1). The areas with the largest growth were concentrated in the
northeast region of the city, in west Denver, in south central Denver, and in neighborhoods surrounding
the Central Business District. The dramatic changes within certain areas highlight the pressures LMI
renter households face in some Denver neighborhoods.
39%
60%
7%
1%
47%
82%
26%
1%
Overall Very low income (below 50%AMI)
Low and middle income (50 to120% AMI)
High income (above 120%AMI)
2000 2015

2 0 D E N V E R A N D T H E S T A T E O F L O W - A N D M I D D L E - I N C O M E H O U S I N G
FIGURE 7
Percentage-Point Change in Cost Burden Rate for LMI Renters in Denver, 2000–15
Source: Urban Institute tabulations of 2000 Decennial Census and 2011–15 American Community Survey data.
Note: LMI = low and middle income (50 to 120 percent of area median income).
TABLE 1
LMI Renter Cost Burden for Select Neighborhoods in 2000 and 2015
Neighborhood LMI renter cost burden rate (%), 2000
LMI renter cost burden rate (%), 2015
Difference (%)
Cherry Creek 14 58 45 Valverde 5 49 45 University Hills 13 54 42 Chaffee Park 19 59 40 Harvey Park South 5 44 39 Highland 5 42 36 University 8 43 35 Northeast Park Hill 10 43 32 Belcaro 46 77 31 Gateway–Green Valley Ranch 11 41 30 CBD 4 34 30
Source: Urban Institute tabulations of 2000 Decennial Census and 2011–15 American Community Survey data.
Notes: CBD = Central Business District; LMI = low and middle income (50 to 120 percent of area median income).

D E N V E R A N D T H E S T A T E O F L O W - A N D M I D D L E - I N C O M E H O U S I N G 2 1
Lending Activity
The Great Recession had a considerable impact on lending activity in Denver. Home Mortgage
Disclosure Act data indicate lending activity declined 45 percent between 2007 and 2011. But the city
was quick to recover, and by 2015, lending activity was approaching prerecession levels. Although there
was significant recovery from the 2011 low, the gains were not even across neighborhoods. The share
of lending in LMI neighborhoods fell between 2007 and 2015.
Lending in middle- and moderate-income neighborhoods has remained flat, while there has been
rapid growth in upper-income neighborhoods and, to a lesser extent, low-income neighborhoods (figure
8). In 2007, 15 percent of loans were issued in upper-income neighborhoods (120 percent or more of
the metropolitan statistical area, or MSA, median income), 43 percent of loans were in middle-income
neighborhoods (80 to 119.9 percent of the MSA median income), 32 percent of loans were in moderate-
income neighborhoods (50 to 79.9 percent of the MSA median income), and 9 percent of loans were in
low-income neighborhoods (less than 50 percent of the MSA median income). The share in upper-
income neighborhoods doubled to 30 percent by 2015 (increasing from 2,112 loans in 2007 to 3,876 in
2015). Meanwhile, the share in middle-income and moderate-income areas declined from being 75
percent of loans in 2007 to 54 percent of loans in 2015. But growth was not limited to upper-income
neighborhoods. The share of loans issued in low-income neighborhoods increased to 15 percent of the
total by 2015 (from 1,301 to 2,138).
The lending activity analysis does not include loans for multifamily units (i.e., properties with more
than five units) because the number of dwelling units on the property is not specified, making it
impossible to determine if it is a small or large multifamily development (Bureau of Consumer Financial
Protection 2015). But for Denver, multifamily housing units were a small share of originated loans. In
each year from 2007 to 2015, multifamily housing accounted for between 0.6 and 1.2 percent of total
loans each year.

2 2 D E N V E R A N D T H E S T A T E O F L O W - A N D M I D D L E - I N C O M E H O U S I N G
FIGURE 8
Loans Issued by Neighborhood Area Median Income Group, Denver
Source: Urban Institute tabulations of Home Mortgage Disclosure Act data, 2007–15.
Notes: MSA = metropolitan statistical area. The figure includes one- to four-unit family dwellings and manufactured housing.
Multifamily housing units, which account for less than 1 percent of loans originated each year, are excluded from the analysis.
Neighborhood Change Typology: Understanding
Opportunities for Preserving and Creating LMI Housing
The culmination of understanding the changing population, housing dynamics, and stock of affordable
housing across Denver’s neighborhoods is to determine where the best opportunities exist to preserve
and create LMI housing. Some areas are ripe for protecting NOAH and creating LMI housing, other
areas may be too developed, and other areas receive too little investment. This section presents data
from a typology created to identify neighborhoods where affordable housing needs can best be
addressed, so residents across the income distribution can continue to live in and contribute to
Denver’s diverse community.18 We look across neighborhoods from 2000 to 2015 to understand how
Denver’s LMI opportunities have changed.
-
2,000
4,000
6,000
8,000
10,000
12,000
14,000
16,000
2007 2008 2009 2010 2011 2012 2013 2014 2015
Upper income (120%+ ofMSA median income)
Middle income (80 to 119.9%MSA median income)
Moderate income (50 to79.9% MSA median income)
Low income (less than 50%MSA median income)
D E N V E R A N D T H E S T A T E O F L O W - A N D M I D D L E - I N C O M E H O U S I N G 2 3
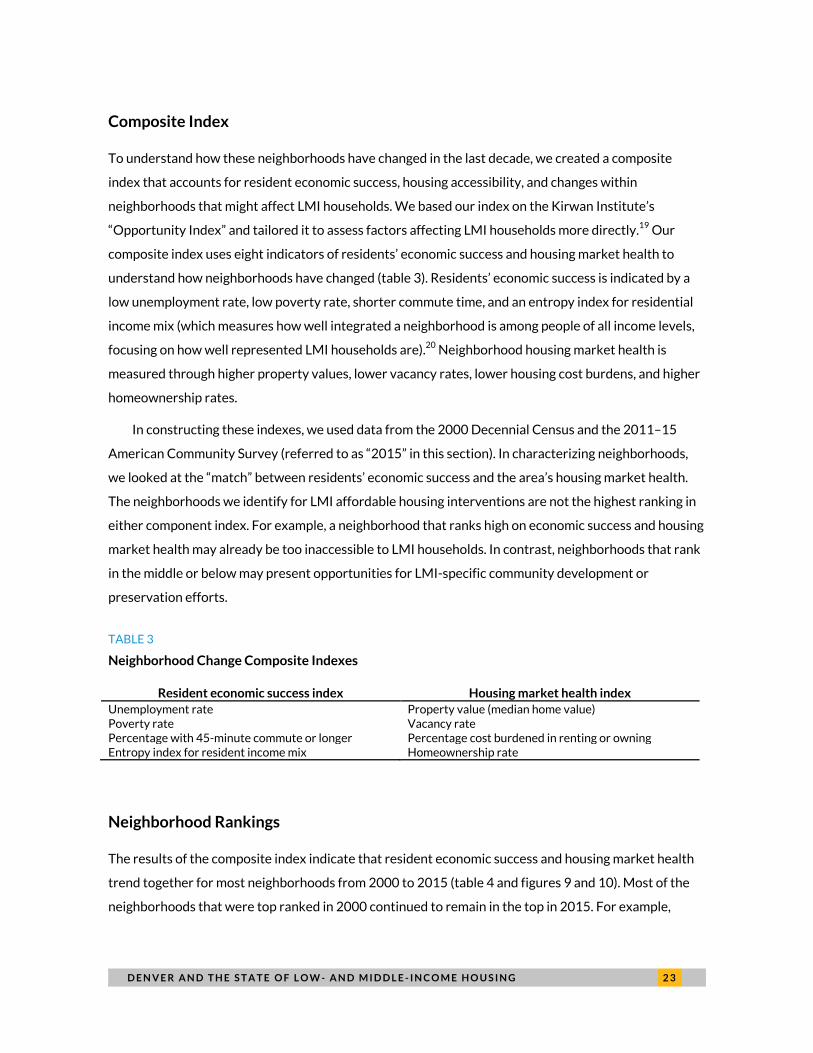
Composite Index
To understand how these neighborhoods have changed in the last decade, we created a composite
index that accounts for resident economic success, housing accessibility, and changes within
neighborhoods that might affect LMI households. We based our index on the Kirwan Institute’s
“Opportunity Index” and tailored it to assess factors affecting LMI households more directly.19 Our
composite index uses eight indicators of residents’ economic success and housing market health to
understand how neighborhoods have changed (table 3). Residents’ economic success is indicated by a
low unemployment rate, low poverty rate, shorter commute time, and an entropy index for residential
income mix (which measures how well integrated a neighborhood is among people of all income levels,
focusing on how well represented LMI households are).20 Neighborhood housing market health is
measured through higher property values, lower vacancy rates, lower housing cost burdens, and higher
homeownership rates.
In constructing these indexes, we used data from the 2000 Decennial Census and the 2011–15
American Community Survey (referred to as “2015” in this section). In characterizing neighborhoods,
we looked at the “match” between residents’ economic success and the area’s housing market health.
The neighborhoods we identify for LMI affordable housing interventions are not the highest ranking in
either component index. For example, a neighborhood that ranks high on economic success and housing
market health may already be too inaccessible to LMI households. In contrast, neighborhoods that rank
in the middle or below may present opportunities for LMI-specific community development or
preservation efforts.
TABLE 3
Neighborhood Change Composite Indexes
Resident economic success index Housing market health index
Unemployment rate Property value (median home value) Poverty rate Vacancy rate Percentage with 45-minute commute or longer Percentage cost burdened in renting or owning Entropy index for resident income mix Homeownership rate
Neighborhood Rankings
The results of the composite index indicate that resident economic success and housing market health
trend together for most neighborhoods from 2000 to 2015 (table 4 and figures 9 and 10). Most of the
neighborhoods that were top ranked in 2000 continued to remain in the top in 2015. For example,
2 4 D E N V E R A N D T H E S T A T E O F L O W - A N D M I D D L E - I N C O M E H O U S I N G
seven of the neighborhoods ranked in the top 10 in 2000 (Belcaro, Cory–Merrill, Country Club, Hilltop,
South Park Hill, Washington Park, and Wellshire) were also in the top 10 in 2015, with Country Club
remaining at the top over time. Three new entrants to the top 10 include North Park Hill, Platt Park, and
Stapleton that all happen to be locations of some of Denver’s light rail stations, a system created in
1994, which has blossomed in the intervening years and has helped spur economic development in
surrounding neighborhoods.21
Meanwhile, two neighborhoods that were ranked low in 2000 improved considerably and are in the
top tier in 2015. Whittier was number 58 on the list in 2000 and is now number 22. Housing indicators
in Whittier improved so much that the neighborhood moved from being number 55 in housing market
health in 2000 to number 14 by 2015. In 2000, 44 percent of homes had property values less than
$200,000 (in 2015 dollars). By 2015, just 8 percent were valued that low. Similarly, LMI renter cost
burden increased from 3 percent of LMI households to a quarter by 2015. Auraria had equally dramatic
changes in housing stock and is now ranked 23 out of all neighborhoods on the housing market health
index. These two neighborhoods have experienced dramatic shifts in home values and rental prices.
Neighborhoods ranked in the middle, neighborhoods that present the most potential for preserving
LMI housing, include some that have stayed solidly middle ranked since 2000. Bear Valley, Fort Logan,
Harvey Park, and Marston are all in the southwest corner of the city and have remained solidly LMI
neighborhoods from 2000 to 2015. These neighborhoods have older housing stock, have a significant
share of rentals under $1,000 a month, and housing values have remained affordable (a significant
portion are under $200,000). Policies that ensure these neighborhoods can be preserved as affordable
to LMI families should be considered here, particularly because they have remained relatively buffered
from other changes.
Finally, some neighborhoods in the bottom third of the neighborhood typology are on the rise, with
both rising economic success of the residents and housing market health as factors. Five Points has
quickly moved up from 2000 to 2015 because of economic and housing changes that point to
gentrification. Meanwhile, other neighborhoods have dropped into the bottom tier after having been
solidly in the middle grouping, including Montebello, Ruby Hill, Washington Virginia Vale, and Windsor,
primarily because residents’ economic success and the housing market health has stagnated and
dropped.
To understand the forces contributing to neighborhood changes, we will explore details about each
component index.

D E N V E R A N D T H E S T A T E O F L O W - A N D M I D D L E - I N C O M E H O U S I N G 2 5
FIGURE 9
Denver Neighborhood Composite Scores, 2000
Source: Urban Institute tabulations of 2000 Decennial Census data.

2 6 D E N V E R A N D T H E S T A T E O F L O W - A N D M I D D L E - I N C O M E H O U S I N G
FIGURE 10
Denver Neighborhood Composite Scores, 2015
Source: Urban Institute tabulations of 2011–15 American Community Survey data.

D E N V E R A N D T H E S T A T E O F L O W - A N D M I D D L E - I N C O M E H O U S I N G 2 7
TABLE 4
Neighborhood Change Typology Rankings
Neighborhood Overall ranking,
2000
Overall ranking,
2015
Change, 2000–15
RES, 2000
RES, 2015
Change, 2000–15
HMH, 2000
HMH, 2015
Change, 2000–15
Country Club 1 1 0 4 20 -16 1 1 0 Wellshire 3 2 1 8 3 5 3 6 -3 South Park Hill 8 3 5 15 9 6 8 3 5 Hilltop 4 4 0 1 18 -17 4 2 2 Belcaro 2 5 -3 11 8 3 2 4 -2 Platt Park 12 6 6 19 1 18 11 10 1 Stapleton 14 7 7 33 5 28 9 9 0 Cory–Merrill 6 8 -2 12 22 -10 6 5 1 Washington Park 5 9 -4 2 2 0 5 13 -8 North Park Hill 21 10 11 37 15 22 16 8 8 Montclair 9 11 -2 3 4 -1 13 16 -3 Washington Park West 10 12 -2 5 32 -27 12 7 5 Congress Park 19 13 6 21 7 14 17 19 -2 West Highland 25 14 11 27 34 -7 26 11 15 Indian Creek 11 15 -4 6 12 -6 18 20 -2 Cherry Creek 7 16 -9 10 11 -1 7 22 -15 Regis 27 17 10 40 35 5 20 12 8 Hampden South 15 18 -3 13 13 0 21 24 -3 Berkeley 24 19 5 25 31 -6 27 15 12 Rosedale 26 20 6 14 6 8 43 37 6 University Hills 13 21 -8 9 14 -5 22 25 -3 Whittier 58 22 36 63 44 19 55 14 41 Sloan Lake 39 23 16 42 36 6 36 21 15 Skyland 43 24 19 48 47 1 42 18 24 Chaffee Park 53 25 28 58 19 39 47 36 11 Hale 28 26 2 20 23 -3 34 31 3 Bear Valley 23 27 -4 47 37 10 15 27 -12 Fort Logan 17 28 -11 31 54 -23 10 17 -7 Lowry Field 50 29 21 36 17 19 63 40 23 Southmoor Park 18 30 -12 7 10 -3 24 51 -27 Athmar Park 36 31 5 39 24 15 35 34 1 Baker 49 32 17 53 26 27 46 35 11 Auraria 76 33 43 76 49 27 72 23 49 Highland 66 34 32 64 16 48 67 48 19 Speer 42 35 7 28 21 7 52 49 3 Harvey Park South 16 36 -20 22 40 -18 14 32 -18 University Park 20 37 -17 16 33 -17 23 43 -20 Marston 33 38 -5 34 42 -8 30 30 0 Cheesman Park 22 39 -17 18 29 -11 28 46 -18 Gateway–Green Valley Ranch 52 40 12 30 58 -28 70 26 44 Sunnyside 51 41 10 59 56 3 45 28 17 Hampden 32 42 -10 17 28 -11 44 50 -6 University 37 43 -6 38 45 -7 37 33 4 Harvey Park 29 44 -15 45 43 2 19 39 -20 Barnum West 40 45 -5 55 60 -5 25 29 -4 Virginia Village 30 46 -16 29 50 -21 32 44 -12 City Park 35 47 -12 32 30 2 40 55 -15

2 8 D E N V E R A N D T H E S T A T E O F L O W - A N D M I D D L E - I N C O M E H O U S I N G
Neighborhood Overall ranking,
2000
Overall ranking,
2015
Change, 2000–15
RES, 2000
RES, 2015
Change, 2000–15
HMH, 2000
HMH, 2015
Change, 2000–15
Union Station 48 48 0 41 57 -16 56 42 14 Mar Lee 38 49 -11 49 51 -2 29 45 -16 Capitol Hill 54 50 4 44 25 19 66 62 4 Civic Center 75 51 24 57 38 19 77 58 19 Overland 47 52 -5 35 27 8 59 61 -2 DIA 78 53 25 78 41 37 78 60 18 City Park West 65 54 11 61 59 2 65 52 13 North Capitol Hill 60 55 5 66 39 27 49 65 -16 Five Points 73 56 17 71 52 19 73 59 14 Washington Virginia Vale 31 57 -26 26 61 -35 33 53 -20 Windsor 41 58 -17 24 46 -22 51 63 -12 Ruby Hill 44 59 -15 50 62 -12 38 54 -16 Montbello 46 60 -14 51 68 -17 41 47 -6 Cole 70 61 9 74 74 0 58 41 17 Goldsmith 34 62 -28 46 53 -7 31 71 -40 Northeast Park Hill 55 63 -8 54 69 -15 61 57 4 Lincoln Park 71 64 7 62 65 -3 71 64 7 Villa Park 62 65 -3 68 64 4 54 66 -12 Valverde 67 66 1 72 48 24 53 76 -23 Elyria Swansea 69 67 2 69 72 -3 62 56 6 Jefferson Park 74 68 6 75 63 12 68 74 -6 Barnum 45 69 -24 52 76 -24 39 38 1 Westwood 64 70 -6 65 66 -1 60 70 -10 East Colfax 57 71 -14 56 73 -17 64 67 -3 Clayton 63 72 -9 67 70 -3 57 72 -15 West Colfax 72 73 -1 73 67 6 69 75 -6 Globeville 61 74 -13 70 75 -5 48 69 -21 CBD 68 75 -7 43 55 -12 75 78 -3 Kennedy 59 76 -17 23 71 -48 76 77 -1 College View–South Platte 56 77 -21 60 77 -17 50 68 -18 Sun Valley 77 78 -1 77 78 -1 74 73 1
Source: Urban Institute analysis of 2000 Decennial Census and 2011–15 American Community Survey data.
Notes: CBD = Central Business District; DIA = Denver International Airport; HMH = housing market health; RES = residential
economic success. Neighborhoods are listed in order of 2015 overall ranking.
Resident Economic Success Index
The economic success index measures whether residents are struggling in the economy and whether
the neighborhood reflects income diversity. The index comprises neighborhood unemployment rates,
poverty rates, the percentage of residents with commutes longer than 45 minutes, and an entropy index
that measures the neighborhood’s income mix with a focus on LMI households (table 3).

D E N V E R A N D T H E S T A T E O F L O W - A N D M I D D L E - I N C O M E H O U S I N G 2 9
Understanding changes in resident economic success in the context of composite index scores is
discordant, as drastic changes occurred at both ends of the neighborhood ranking (table 4). Lower-
ranking neighborhoods in the overall index, such as Five Points, Valverde, and North Capitol Hill,
improved in their resident economic success by 19, 24, and 27 positions, respectively. Neighborhoods
ranking highly overall, such as Washington Park West and Hilltop, experienced significantly decreased
economic resident success, dropping 27 and 17 positions, respectively. The highest-ranked third of
neighborhoods in the composite index also saw improved rankings on resident economic success. On
average, top-ranked neighborhoods’ economic success ranking increased 2.9 positions, with 11 seeing
decreases and the other 15 posting gains or maintaining their position. Mirroring this top-ranked group,
most neighborhoods ranking in the bottom third on the composite index also saw their economic
success ranking fall between 2000 and 2015, and just over a third made gains or stayed the same. The
average neighborhood in the bottom third saw its resident economic success ranking fall 4.3 positions.
Neighborhoods ranked in the middle third on the composite index were more mixed. Half this group
experienced declines in their resident economic success ranking, and the other half improved or
maintained their position. These mid-tier neighborhoods improved slightly in economic success, with
their average ranking increasing by 1.4 places.
The overall highest-ranking neighborhoods in 2015 generally had less poverty in 2015, but most of
these neighborhoods (65 percent) experienced marginal increases in poverty rates since 2000.
Unsurprisingly, these high-ranking neighborhoods also had the lowest resident commute times, with
most residents enjoying commutes less than 45 minutes. But the share of residents who have a 45-
minute or longer commute has increased in all the top-ranked neighborhoods. Unemployment rates
followed similar patterns, though less closely. Only a handful of the top third (e.g., Chaffee Park, Regis,
Skyland, and Stapleton) had better employment, and the other neighborhoods in this cohort
experienced modest increases or no change. Income segregation was least unified across this cohort,
with most worsening on resident segregation (Stapleton is indicative) and around a third improving, as
in Indian Creek and University Hills.
The neighborhoods ranked in the middle of the composite index were the most diverse performers
in unemployment rates, poverty rates, and changes in both these measures between 2000 and 2015.
Most experienced modest increases in unemployment and poverty. Among those within this cohort that
improved in these measures, improvements were significant, with many neighborhoods reducing
unemployment by 9 percentage points (Auraria and Highland) and poverty by as many as 38 percentage
points (Auraria). The percentage of residents with long commute times increased across almost all
Denver neighborhoods, and the middle-ranking neighborhoods experienced typical increases. The level

3 0 D E N V E R A N D T H E S T A T E O F L O W - A N D M I D D L E - I N C O M E H O U S I N G
of income segregation in this cohort decreased slightly, with increased diversity in most neighborhoods
in 2015 relative to 2000. Income diversity increased the most in Bear Valley, Overland, and Sunnyside,
and Lowry Field and Union Station had the greatest decreases in economic diversity.
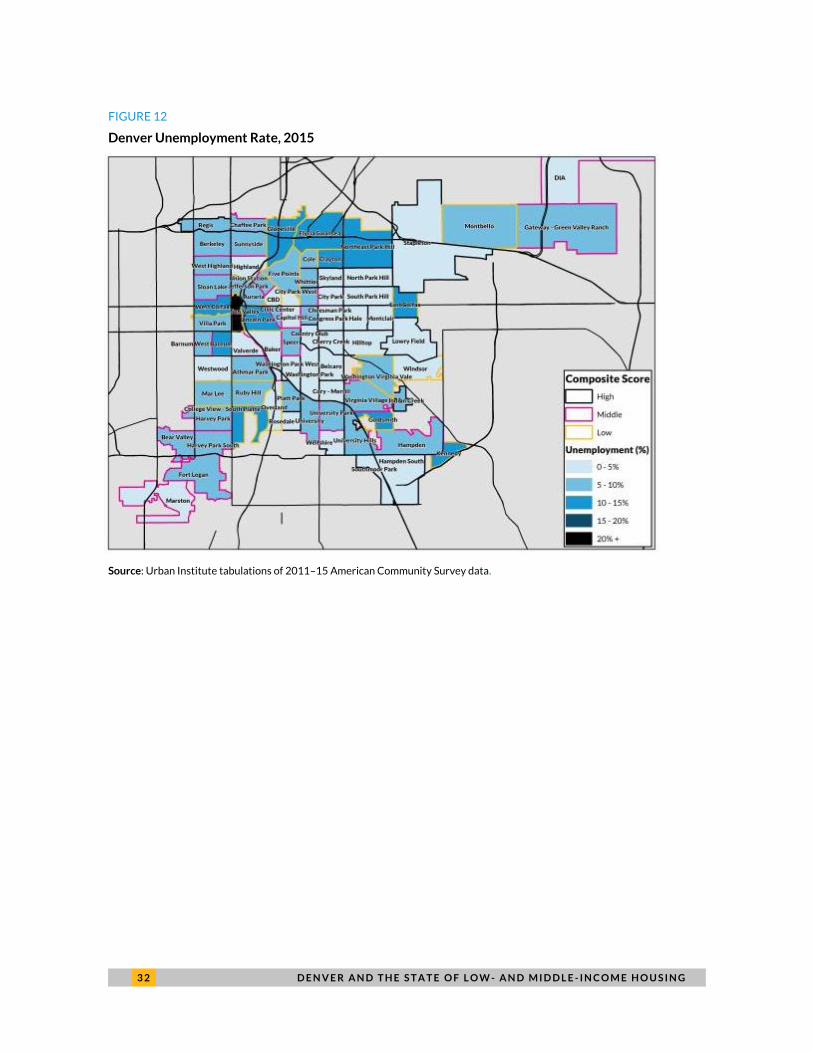
Residents of the neighborhoods that ranked in the bottom third of the neighborhood typology
experienced the highest unemployment and poverty rates, with few or modest improvements. Four
neighborhoods clustered in the northern part of Denver—Clayton, Elyria Swansea, Globeville, and
Northeast Park Hill—have among the highest unemployment rates in the city in 2015, similar to their
rates in 2000 (figures 11 and 12). Neighborhoods in the bottom third of the typology also dealt with
longer commute times than residents in other neighborhoods. In most neighborhoods in this cohort,
more than 33 percent of residents had journeys to work longer than 45 minutes. Like the top-ranking
neighborhoods, income segregation varied widely across neighborhoods at the bottom of the typology.
Some, such as North Capitol Hill and Five Points, made impressive gains to improve resident diversity,
but more than half remained at similar levels of income diversity or saw increased segregation. For
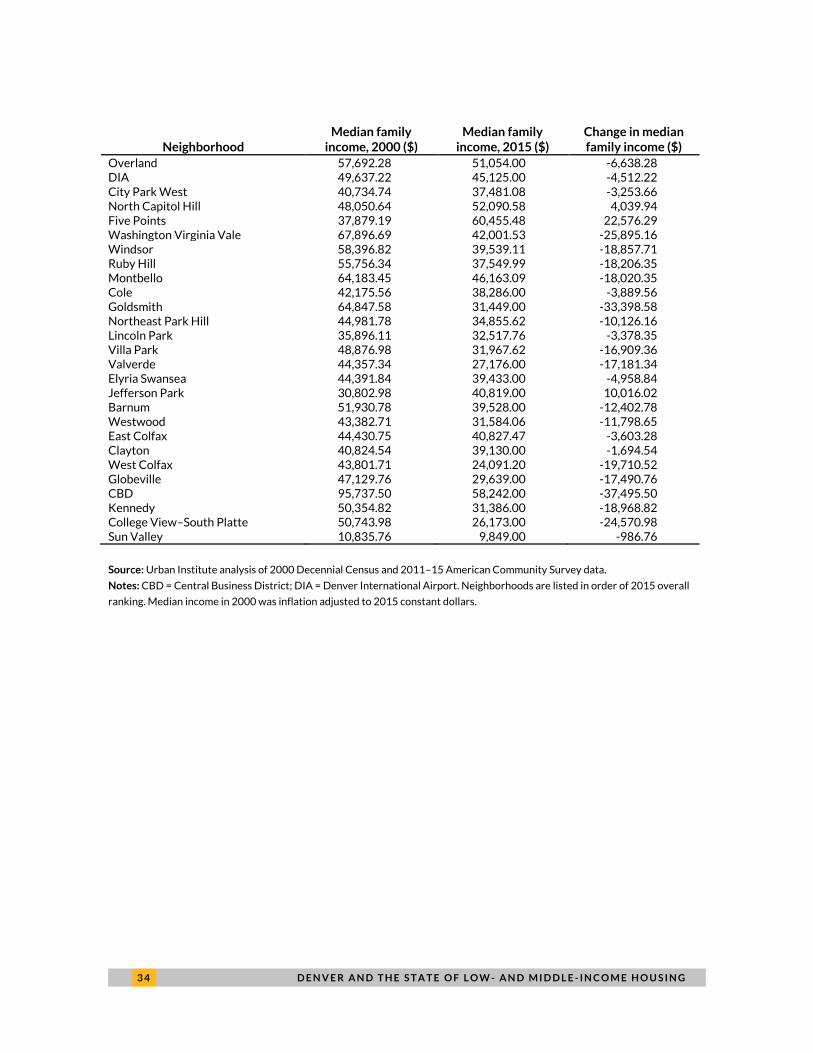
example, although many neighborhoods experienced income stagnation or income loss at the median, in
part because incomes have not kept pace with inflation, Five Points’ median family income increased
over $22,000 between 2000 and 2015. This reflects the considerable change in population (table 5).

D E N V E R A N D T H E S T A T E O F L O W - A N D M I D D L E - I N C O M E H O U S I N G 3 1
FIGURE 11
Denver Unemployment Rate, 2000
Source: Urban Institute tabulations of 2000 Decennial Census data.
3 2 D E N V E R A N D T H E S T A T E O F L O W - A N D M I D D L E - I N C O M E H O U S I N G
FIGURE 12
Denver Unemployment Rate, 2015
Source: Urban Institute tabulations of 2011–15 American Community Survey data.

D E N V E R A N D T H E S T A T E O F L O W - A N D M I D D L E - I N C O M E H O U S I N G 3 3
TABLE 5
Neighborhood Median Family Income, 2000 to 2015
Neighborhood Median family
income, 2000 ($) Median family
income, 2015 ($) Change in median family income ($)
Country Club 175,843.70 134,167.00 -41,676.73 Wellshire 114,776.00 99,716.00 -15,059.98 South Park Hill 113,803.70 105,524.60 -8,279.08 Hilltop 131,427.10 129,430.20 -1,996.85 Belcaro 182,298.00 131,333.00 -50,965.00 Platt Park 86,250.00 98,561.00 12,311.00 Stapleton 2,645.02 126,219.00 123,574.00 Cory–Merrill 94,742.52 94,583.00 -159.52 Washington Park 146,491.60 110,442.00 -36,049.60 North Park Hill 63,450.20 79,377.45 15,927.26 Montclair 109,930.80 77,868.00 -32,062.80 Washington Park West 98,962.26 86,938.11 -12,024.15 Congress Park 96,237.62 68,673.23 -27,564.39 West Highland 71,087.42 88,752.33 17,664.91 Indian Creek 89,493.00 56,940.00 -32,553.00 Cherry Creek 158,992.60 89,926.00 -69,066.56 Regis 71,637.18 56,691.00 -14,946.18 Hampden South 93,043.27 62,270.89 -30,772.38 Berkeley 63,138.71 65,065.75 1,927.04 Rosedale 72,234.72 64,725.00 -7,509.72 University Hills 75,434.26 64,036.49 -11,397.77 Whittier 41,286.84 58,861.00 17,574.16 Sloan Lake 59,304.20 59,990.23 686.04 Skyland 59,904.42 63,793.00 3,888.58 Chaffee Park 51,301.50 47,969.00 -3,332.50 Hale 81,805.13 58,059.36 -23,745.78 Bear Valley 80,576.13 60,257.70 -20,318.43 Fort Logan 89,172.07 66,763.98 -22,408.09 Lowry Field 99,452.52 77,864.30 -21,588.21 Southmoor Park 96,903.56 68,525.05 -28,378.52 Athmar Park 59,088.82 47,607.36 -11,481.46 Baker 50,408.64 49,318.00 -1,090.64 Auraria 22,903.86 82,788.00 59,884.14 Highland 46,901.00 66,877.27 19,976.27 Speer 69,614.87 52,746.70 -16,868.16 Harvey Park South 71,341.52 50,239.66 -21,101.86 University Park 84,869.77 54,776.34 -30,093.43 Marston 96,913.52 59,206.56 -37,706.96 Cheesman Park 88,423.67 56,002.38 -32,421.29 Gateway–Green Valley Ranch 85,973.89 68,959.63 -17,014.27 Sunnyside 51,751.91 50,122.50 -1,629.41 Hampden 81,124.90 51,684.04 -29,440.86 University 81,482.90 47,478.87 -34,004.03 Harvey Park 65,401.23 46,540.99 -18,860.24 Barnum West 52,140.54 49,878.00 -2,262.54 Virginia Village 66,430.27 55,201.89 -11,228.38 City Park 70,149.54 58,487.00 -11,662.54 Union Station 99,867.84 81,961.00 -17,906.84 Mar Lee 57,110.58 45,969.28 -11,141.30 Capitol Hill 53,881.34 43,213.71 -10,667.63 Civic Center 112,940.60 69,638.00 -43,302.58
3 4 D E N V E R A N D T H E S T A T E O F L O W - A N D M I D D L E - I N C O M E H O U S I N G
Neighborhood Median family
income, 2000 ($) Median family
income, 2015 ($) Change in median family income ($)
Overland 57,692.28 51,054.00 -6,638.28 DIA 49,637.22 45,125.00 -4,512.22 City Park West 40,734.74 37,481.08 -3,253.66 North Capitol Hill 48,050.64 52,090.58 4,039.94 Five Points 37,879.19 60,455.48 22,576.29 Washington Virginia Vale 67,896.69 42,001.53 -25,895.16 Windsor 58,396.82 39,539.11 -18,857.71 Ruby Hill 55,756.34 37,549.99 -18,206.35 Montbello 64,183.45 46,163.09 -18,020.35 Cole 42,175.56 38,286.00 -3,889.56 Goldsmith 64,847.58 31,449.00 -33,398.58 Northeast Park Hill 44,981.78 34,855.62 -10,126.16 Lincoln Park 35,896.11 32,517.76 -3,378.35 Villa Park 48,876.98 31,967.62 -16,909.36 Valverde 44,357.34 27,176.00 -17,181.34 Elyria Swansea 44,391.84 39,433.00 -4,958.84 Jefferson Park 30,802.98 40,819.00 10,016.02 Barnum 51,930.78 39,528.00 -12,402.78 Westwood 43,382.71 31,584.06 -11,798.65 East Colfax 44,430.75 40,827.47 -3,603.28 Clayton 40,824.54 39,130.00 -1,694.54 West Colfax 43,801.71 24,091.20 -19,710.52 Globeville 47,129.76 29,639.00 -17,490.76 CBD 95,737.50 58,242.00 -37,495.50 Kennedy 50,354.82 31,386.00 -18,968.82 College View–South Platte 50,743.98 26,173.00 -24,570.98 Sun Valley 10,835.76 9,849.00 -986.76
Source: Urban Institute analysis of 2000 Decennial Census and 2011–15 American Community Survey data.
Notes: CBD = Central Business District; DIA = Denver International Airport. Neighborhoods are listed in order of 2015 overall
ranking. Median income in 2000 was inflation adjusted to 2015 constant dollars.
D E N V E R A N D T H E S T A T E O F L O W - A N D M I D D L E - I N C O M E H O U S I N G 3 5
Housing Market Health Index
The housing accessibility index assesses neighborhood housing market health using neighborhood
property values, vacancy rates, share of residents cost burdened in renting or owning, and the
homeownership rate (table 3).
Changes in housing market health across all Denver neighborhoods were mixed (table 4).
Neighborhoods at the top of the typology enjoyed an average rank increase of 4.5 places, whereas
neighborhoods at the bottom fell by an average 5.7 places. Most neighborhoods ranking in the top third
of the neighborhood typology saw their rankings improve between 2000 and 2015. The improvement
of the top-tier neighborhoods in housing market health was driven primarily by property values. Two-
thirds experienced increases of over $100,000 dollars, and only one neighborhood, Hale, experienced
declining property values (figures 13 and 14). Vacancy rates and the percentage of cost-burdened
residents declined or stayed the same for most neighborhoods within the cohort. Notable among these
are West Highland, whose share of cost-burdened residents declined almost 10 percentage points, and
Wellshire, whose share increased 13 percentage points. The change in homeownership rates for these
neighborhoods was also notable in that only four (Chaffee Park, Cory–Merrill, Rosedale, and University
Hills) experienced decreases. Cherry Creek, Congress Park, Hale, Hampden South, and Washington
Park West all increased this figure between 10 and 13 percentage points.
There was less movement in the middle-tier neighborhoods, who enjoyed modest increases (on
average, 1.2 ranks) if any by 2015. Half the 26 middle-ranking neighborhoods decreased in their
housing market health rankings, but property values rose for almost every neighborhood (18 of 26) in
the cohort. University Park is a standout, with its median property value increasing a notable $287,581
(figures 13 and 14). In contrast to the top-ranking neighborhoods, vacancy rates increased for half the
middle-ranking neighborhoods, though these increases were no greater than 6 percentage points
across the cohort. The percentage of cost-burdened residents also decreased in half of the middle-
ranked neighborhoods, though University and City Park experienced significant increases of 17 percent
and 16 percent, respectively. Like the top-ranking neighborhoods, homeownership rates increased in
most middle-tier neighborhoods, with the largest gains occurring in Capitol Hill, Cheesman Park, City
Park, Civic Center, and Union Station.
Only about a third of the neighborhoods ranked in the bottom third of the neighborhood typology
saw their housing market health ranks increase by 2015. But even in these neighborhoods, property
values grew most notably in Five Points and Jefferson Park, whose median property values increased
almost $130,000 (figures 13 and 14). Changes in vacancy rates were mixed across this cohort, with

3 6 D E N V E R A N D T H E S T A T E O F L O W - A N D M I D D L E - I N C O M E H O U S I N G
nearly half the neighborhoods experiencing increases and the other half experiencing declines or no
change. For those neighborhoods that experienced increases, the increases hovered at or below 5
percent across the board. Changes in homeownership rates were likewise split down the middle, with
about half experiencing increases and the other half experiencing decreases. Denver International
Airport and Globeville have experienced the largest declines (40 percentage points and 21 percentage
points, respectively), with Westwood and Elyria Swansea also posting decreases of 10 or more
percentage points. Windsor (34 percentage point increase) and the Central Business District (33
percentage point increase) have seen the greatest growth in the homeownership rate, followed by City
Park West with a 14 percentage point jump. The share of cost-burdened residents in the bottom-
ranking neighborhoods increased in all but five neighborhoods (City Park West, Denver International
Airport, Elyria Swansea, Five Points, and Lincoln Park), with some experiencing increases of over 20
percentage points (Kennedy with a 27 percent increase and Goldsmith with a 22 percent increase are
indicative). The Central Business District, College View–South Platte, Globeville, Washington Virginia
Vale, and Valverde also experienced double-digit increases in cost-burdened residents.

D E N V E R A N D T H E S T A T E O F L O W - A N D M I D D L E - I N C O M E H O U S I N G 3 7
FIGURE 13
Denver Median Home Values, 2000
In 2015 dollars
Source: Urban Institute tabulations of 2000 Decennial Census data.

3 8 D E N V E R A N D T H E S T A T E O F L O W - A N D M I D D L E - I N C O M E H O U S I N G
FIGURE 14
Denver Median Home Values, 2015
Source: Urban Institute tabulations of 2011–15 American Community Survey data.

D E N V E R A N D T H E S T A T E O F L O W - A N D M I D D L E - I N C O M E H O U S I N G 3 9
BOX 4
Neighborhood Case Study: Globeville
Globeville is a small neighborhood in
north central Denver along the bank of
the South Platte River. Only a few
miles from downtown, the
neighborhood of about 3,500
residents (appendix table A.1) is a
largely blue-collar immigrant
community surrounded by industry,
with historically high rates of
homeownership and a large
concentration of NOAH. Globeville’s
residents are experiencing gentrifying
pressures, with dramatic rises in
property values and a spurt of new
development projects. But unlike neighboring Five Points and Lower Downtown, which have seen
dramatic transformation, Globeville is in early stages of change. Several stakeholders from the city and
philanthropic and nonprofit sectors identified Globeville as a small, tight-knit community that would be
an ideal candidate to profile given its location and pending transformations. Along with the growth in
private development, the city has undertaken massive investment and planning efforts in the
neighborhood with the North Denver Cornerstone Collaborative, Regional Transportation District
expansion of rail lines in the neighborhood, and the Globeville Neighborhood Plan.a Without a
concerted policy effort to maintain affordability, it is unclear whether long-term residents can stay in
the community.
The neighborhood is largely an immigrant community. The area was first settled by Eastern
European immigrants who were drawn to work in smelting plants, meatpacking houses, and rendering
plants. As the first wave of immigrants moved out, a new wave of immigrants, largely from Mexico and
Central America, settled the area to work in the factories.b Since the neighborhood’s incorporation into
Denver, it has faced multiple infrastructural, economic, environmental, and educational issues, many of
which were long neglected or exacerbated by public officials. Perhaps the most notable monument to

4 0 D E N V E R A N D T H E S T A T E O F L O W - A N D M I D D L E - I N C O M E H O U S I N G
the neighborhood’s complicated relationship with local government is “the Mousetrap,” the massive
interchange of I-70 and I-25 constructed in the 1950s in the heart of what was historic Globeville. The
interchange remains an impressive physical barrier that divides the neighborhood into quadrants and
poses significant challenges to neighborhood connectivity (e.g., the only elementary school in the
neighborhood is in the southeast quadrant, and most residents live in the northeast). Following the
construction of the interchange, residents and city officials battled over zoning codes and classifications
for the area. There was pressure in the city government to turn much of the community into an
industrial park to take advantage of the prime proximity to transportation hubs. Although the industrial
park plan was never implemented, in the 1950s, the city rezoned much of Globeville’s residential areas
as industrial, which meant homeowners could not receive the necessary permitting required to modify,
repair, or improve their homes. Although the zoning struggle was officially resolved in 2006 with the
resurrection of the original residential codes, the years of neglect on the structures and lack of
investment from the city has left a lasting mark on the community.c The struggle also left a lasting
distrust in the relationship between Globeville residents and city government.
Although much of the original heavy industry that defined the neighborhood has declined, the
factories that brought wealth and jobs to Denver had a profound environmental impact on the
surrounding community. One of the oldest and most significant industrial sites in Globeville—the
Asarco Globe Smelter, which operated for over 120 years and gives the area its name—polluted the
neighborhood’s groundwater and soil with high levels of cadmium, lead, arsenic, and zinc. A 4.5-square-
mile area around the factory in northern Globeville was declared an Environmental Protection Agency
Superfund site in 1993.d Following the declaration, a massive $28 million cleanup was initiated that
lasted over 20 years. Despite the significant challenges, residents largely chose to stay in the
neighborhood and develop a resilient tight-knit community with strong local support networks.
In recent years, the industrial zones have become home to a relatively new industry in Denver—
legal marijuana growing facilities—which bring different issues to the neighborhood. We heard from
some stakeholders that this could be related to displacement issues. A federal banking loophole
prevents money made from drugs, even if legally earned, to be deposited in most banks.e There is
speculation that those in the legal marijuana industry have been purchasing nearby Globeville homes in
cash for investment purposes.f

D E N V E R A N D T H E S T A T E O F L O W - A N D M I D D L E - I N C O M E H O U S I N G 4 1
Since 2010, the city has taken a renewed focus to address the legacy of infrastructural,
environmental, zoning, and economic challenges. Much of the city’s recent development and planning
work in Globeville has been directed through the North Denver Cornerstone Collaborative, which was
created in 2013 to align six planning efforts in the Elyria Swansea, Globeville, and River North
neighborhoods: Brighton Boulevard Redevelopment, Central 70, National Western Center,
Neighborhood Plans, River North, and Regional Transportation District Station Development.g The
Globeville Neighborhood Plan, adopted in December 2014 as the first comprehensive plan for the area
since 1989, is meant to be the guiding framework for development and community building. The plan
includes efforts to improve walkability, parks, and transit options and to attract jobs and improve access
to goods and services (City of Denver 2016). Notably, the plan outlines the redevelopment of the
former Asarco Smelter site into an industrial park with warehouses and light manufacturing facilities
and is estimated to bring between 800 and 1,500 jobs to the area.h Yet, representatives from
community organizations expressed concern that the project may not improve economic opportunities
for neighborhood residents. There is also fear that the initiatives will accelerate gentrification
pressures. To address some of these concerns, the plan includes recommendations for improving access
to housing for residents, such as developing a land bank strategy with local nonprofit partners,
constructing more affordable housing units, and making recommendations for new mixed-use
developments.
Although redevelopment is in a relatively early stage, stakeholders noted that the community is
showing early signs of change and resident displacement. Demographic differences between 2000 and
2015 hint at changing circumstances in Globeville. The neighborhood only added about 100 residents
from 2000 to 2015, but added 160 new households, suggesting a shift away from larger families.
Notably, the share of households with at least one child under age 18 decreased nearly 20 percentage
points from 52 to 35 percent. This confirms stakeholder reports that school enrollment is declining at
Globeville schools, in part because of displacement. Globeville remained a predominately Hispanic
neighborhood, but the population share decreased from 77 to 61 percent. Furthermore, the
neighborhood income composition changed, with increases in very low–income (VLI) households (56 to
62 percent) and decreases in LMI households (35 to 30 percent) from 2000 to 2015. Notably, renter
households became more cost burdened (paying more than 30 percent of income on rent), with a 20
percent increase for all renters, with nearly all VLI renter households experiencing cost burdens,
confirming stakeholder reports of increasing rents precipitating displacement.

4 2 D E N V E R A N D T H E S T A T E O F L O W - A N D M I D D L E - I N C O M E H O U S I N G
Demographic Profile of Globeville Residents, 2000 and 2015
2000 2015
Population 3,454 3,551 Households 911 1,071 Hispanic 77% 61% Households with at least 1 person under 18 52% 35% Households with at least 1 person over 65 21% 17% VLI households 56% 62% LMI households 35% 30% Cost-burdened renters 43% 63% VLI cost-burdened renters 71% 91% LMI cost-burdened renters 7% 24%
Source: Urban Institute tabulations of 2000 Decennial Census and 2011–15 American Community Survey data.
Notes: LMI = low and middle income; VLI = very low income.
Given the modest to negative economic changes for Globeville residents, the dramatic rise in
Globeville property values places pressure on residents. Using Zillow sale price figures, we found an up-
to-date profile of housing price change. The change in Globeville property values has largely followed
the City of Denver average between 1996 and 2003, with the average square-foot price around $20
less in Globeville than the city average. From 2004 to 2010, Globeville’s prices dropped while Denver’s
prices remained relatively constant. Between 2012 and 2016, though, the average square-foot price in
Globeville more than doubled (from $105 to $251), and the gap between the neighborhood and the rest
of Denver was narrowing and was only $50 lower in 2016.

D E N V E R A N D T H E S T A T E O F L O W - A N D M I D D L E - I N C O M E H O U S I N G 4 3
Average Monthly Sale Price per Square Foot, Globeville and City of Denver
Source: Urban Institute tabulations of 1996–2016 monthly Zillow sale price data.
The rapid rise in property values has placed mounting pressures on homeowners to sell. As
property values increase, so do property taxes, which can be challenging for homeowners with fixed or
limited income. The dramatic increase has also attracted the attention of real estate agents and
speculators. Stakeholders reported that many homeowners have been approached to sell their homes.
A recent survey of residents conducted by the local community organizations Front Range Economic
Strategy Center and LiveWell Colorado in Globeville and adjacent Elyria Swansea found that 8 in 10
residents have no intention of leaving, and this was even higher among homeowners (nearly 9 in 10 said
they either had no plans to move or no intention to sell) (FRESC 2016). For homeowners, sales could
result in a large windfall of cash. For those who sell their homes, stakeholders said this certainly meant
these families were leaving the city (as the average-price-per-square-foot data indicate, Globeville
remains more affordable than the rest of Denver). Stakeholders underscored how tight-knit the
neighborhood is and that the community means more to residents than a place to live. To address the
challenge of preserving affordability and the strong sense of community, stakeholders suggested a
property tax moratorium for longtime homeowners. Strategies promoting homeownership for first-
time buyers—such as down payment assistance and gap financing—were also recommended.
$-
$50
$100
$150
$200
$250
$300
$350
1996 1998 2000 2002 2004 2006 2008 2010 2012 2014 2016
Denver Globeville

4 4 D E N V E R A N D T H E S T A T E O F L O W - A N D M I D D L E - I N C O M E H O U S I N G
Single-Family House in Globeville
Photo credit: Tanaya Srini/Urban Institute.
Note: Sign reads “My Community Is Not For Sale.”
The sizable renter population in Globeville is particularly vulnerable to rising property values and is
increasingly cost burdened. Nonprofit representatives noted that there are few multifamily
developments in the neighborhood, and most renters occupy single-family homes, often managed by
“mom and pop” landlords rather than large property management companies. We also heard from
stakeholders that some landlords are based out of state and may be less invested in preserving the
neighborhood’s character if approached to sell. The recent survey of Globeville and Elyria Swansea
residents revealed that 61 percent of renters have a six-month lease or less (FRESC 2016). Without a
formal agreement, there are no legal protections against dramatic increases in rent or short-notice
evictions. Several stakeholders stressed the importance of working with mom and pop landlords to
create incentives to preserve rental affordability. Certainly landlords are seeing tax bills rise, so a
potential policy option would be to offer a lower rate for those who preserve affordability in their units.
Stakeholders in the neighborhood also suggested that speculative buying was happening and that

D E N V E R A N D T H E S T A T E O F L O W - A N D M I D D L E - I N C O M E H O U S I N G 4 5
vacant units were increasing, suggesting that a tax increase on vacant properties might be another
strategy to preserve affordability. It was also suggested that financing for creating accessory dwelling
units, or small detached units that homeowners can rent at an affordable price, would allow a revenue
stream for homeowners and more affordable housing stock in the neighborhood.
Several nonprofit organizations are working in Globeville to improve services for the community
and combat displacement. The Mile High United Way was referenced by many stakeholders as an
organization with a strong and lengthy investment in Globeville. The organization is coordinating a
United Neighborhood’s collective impact strategy in Globeville and Elyria Swansea in partnership with
North Denver Cornerstone Collaborative and a group of nonprofits, community members,
policymakers, and other stakeholders. Their strategy in the neighborhood is still developing, but
identified affordable housing as a key area of focus. A representative involved with the project
indicated that the main goal of the affordable housing working group (which includes developers, Office
of Economic Development staff, residents, banks, and nonprofit staff) is to help longtime residents
avoid displacement and to increase affordable housing options. The Globeville Elyria Swansea Anti-
Displacement Coalition, which combines nine organizations, is working with the community to organize
residents in Globeville and neighboring Elyria Swansea to lobby and elevate the issue at the city level.
In addition, the Urban Land Conservancy is working on a community land trust strategy to acquire
and preserve land in Globeville and Elyria Swansea for long-term affordability.i In the model, a nonprofit
organization would create a trust to purchase or construct a portfolio of single-family or multifamily
housing in a target area with rising property values and maintains ownership permanently. Rather than
a traditional sale, perspective LMI homeowners interested in a property would enter a long-term,
renewable lease with the trust. When the homeowner “sells,” he or she earns only a portion of the
increased property value. The rest of the equity is kept by the trust, maintaining the property’s long-
term affordability for future LMI families. The Urban Land Conservancy is conducting a community land
trust feasibility analysis and business plan in coordination with Burlington Associates, a national
consulting cooperative that supports community land trusts and other shared equity homeownership
strategies. The analysis will produce recommendations on implementing a long-term viable trust,
including recommendations for staffing, organizational capacity, and capital needs, as well as strategies
for land acquisition, housing development, homeowner services, and long-term landholding and land
leasing (ULC 2017).

4 6 D E N V E R A N D T H E S T A T E O F L O W - A N D M I D D L E - I N C O M E H O U S I N G
The issues facing Globeville are not unique. As the city continues to boom and attract people from
across the country, many residents are experiencing housing pressures. But with the coordinated focus
on Globeville, city and community groups have a unique opportunity to work together to address
housing affordability issues and curtail displacement. The Globeville Neighborhood Plan has introduced
recommendations to preserve and produce additional affordable housing, representing an important
acknowledgement of the challenges facing longtime residents. If implemented, it would be a significant
commitment to preserve affordability for the neighborhood’s residents. In addition to these strategies,
stakeholders recommended policies aimed at targeting homeowners and landlords, such as property
tax moratoriums and financing and zoning accommodations to assist with creating accessory dwelling
units. Stakeholders also recommended promoting down payment assistance and gap financing
programs for first-time buyers who may have difficulty purchasing homes in the competitive market.
With very low–income families making up 62 percent of households in Globeville, improving
resident economic opportunity is also necessary to promote the community’s long-term sustainability.
The neighborhood plan outlines strategies aimed at expanding job growth within Globeville, including
job training and workforce development, retaining industrial jobs, and attracting small businesses.
Helping residents boost their income not only addresses their abilities to cope with housing cost
burdens in the short term, but makes them better able to live and thrive in the city over the long term.
a See “About the North Denver Cornerstone Collaborative,” City of Denver, North Denver Cornerstone Collaborative, accessed
May 4, 2017, https://www.denvergov.org/content/denvergov/en/north-denver-cornerstone-collaborative/about-ndcc.html; and
City of Denver (2016). b
See the blog Globeville Story for more on the history of the neighborhood: http://globevillestory.blogspot.com/. c
Natasha Gardner and Matt Slaby, “Welcome to Globeville,” 5280, November 2014, http://www.5280.com/globeville/. d
Jon Murray, “Globeville site nears turning point as Asarco cleanup approaches end,” Denver Post, July 5, 2014,
http://www.denverpost.com/2014/07/05/globeville-site-nears-turning-point-as-asarco-cleanup-approaches-end/. e
Sophie Quinton, “Why Marijuana Businesses Still Can’t Get Bank Accounts,” The Pew Charitable Trusts, March 22, 2016,
http://www.pewtrusts.org/en/research-and-analysis/blogs/stateline/2016/03/22/why-marijuana-businesses-still-cant-get-
bank-accounts. f The Urban Institute research team could not verify this with data.
g “About the North Denver Cornerstone Collaborative,” City of Denver, North Denver Cornerstone Collaborative, accessed May
4, 2017, https://www.denvergov.org/content/denvergov/en/north-denver-cornerstone-collaborative/about-ndcc.html. h
Steve Raabe, “Trammell Crow Signs On to Redevelop Asarco Smelter Site in Globeville,” Denver Post, October 29, 2014,
http://www.denverpost.com/2014/10/29/trammell-crow-signs-on-to-redevelop-asarco-smelter-site-in-globeville/. i See community land trust discussion in the LMI Affordable Housing Program Recommendations in the Denver Context section of
this report.

D E N V E R A N D T H E S T A T E O F L O W - A N D M I D D L E - I N C O M E H O U S I N G 4 7
The Denver Community: Policies
and Practices for Inclusive
Neighborhoods The previous section established that Denver neighborhoods are going through radical changes in the
composition of the population, the diminishing availability of affordable housing, and the prospects for
preserving such housing. The city is experiencing such rapid population growth that it must balance the
need to preserve an inclusive community for all households across the income distribution and the
economic development that accompanies the arrival of new residents. This section addresses how
policies and practices within the city and county can move low- and middle-income affordable housing
forward by describing existing affordable housing policies in Denver; community and nongovernmental
resources; the voices of affordable housing stakeholders; and the interventions that could make sense
within the local context. Through a deeper understanding of the opportunities and constraints within
Denver, there is promise to promote programs and policies that can create and preserve an inclusive
community, ensuring that LMI households can continue to thrive.
Current LMI Affordable Housing Policies Employed by
Denver Leadership
Denver’s leadership is aware of and proactive about meeting the affordable housing challenges. The city
is at the vanguard of policy innovations that address LMI affordable housing issues, but state policies
pose some constraints on implementing key corrective actions to preserve and expand the availability
of such housing. Much of the city’s innovative vision around affordable housing has been articulated in
Housing Denver: A Five-Year Plan. The document outlines the city’s priorities and policies as they pertain
the city’s housing needs (City of Denver 2014). At a high level, the city’s priorities around affordable
housing revolve around eight areas:
1. Increasing housing resources
2. Revising and articulating the city funding process
3. Reducing the regulatory burden of subsidized housing development
4. Providing additional critical needs and homeless housing

4 8 D E N V E R A N D T H E S T A T E O F L O W - A N D M I D D L E - I N C O M E H O U S I N G
5. Increasing housing diversity
6. Preserving workforce and critical needs housing
7. Providing greater homeownership opportunities
8. Encouraging sustainable housing development (City of Denver 2014)
Furthermore, the newly created Office of Housing and Opportunities for People Everywhere
(HOPE) will “craft a coordinated and comprehensive strategic road map for the city’s policies, programs,
and projects along the full homeless-to-homeownership spectrum.”22
This section highlights the Affordable Housing Trust Fund and a few of Denver’s other laudable
policies and illustrates some of the ways the city is working to maintain and create a sufficient supply of
affordable housing for LMI families.
Affordable Housing Trust Fund. Denver’s city council approved the creation of a dedicated trust
fund for affordable housing in the fall of 2016. The trust fund, which is expected to raise $150 million
over the next 10 years, will make available funding for the development and preservation of affordable
housing that meet the needs of various populations, including LMI families. The trust fund’s revenues
will come from a portion of a property tax of 0.5 mills and a one-time impact fee on commercial and
residential development. The stated uses of the money from this trust fund include preserving
permanent supportive housing for homeless people, workforce rental housing, and for-sale housing. As
designed, the revenues from the trust fund can serve rental households earning up to 80 percent of the
AMI and for-sale housing investments up to the AMI. Although a positive step, this new Affordable
Housing Trust Fund is unlikely to provide all the funding needed to address the growing gap in
affordability. Further, the trust fund replaces the city’s long-standing Inclusionary Zoning Ordinance,
which used to require developers to include affordable units in projects with more than 30 units. This
new fund intends to distribute the responsibility of affordable housing creation and preservation more
broadly.23
Tax credits. Denver’s Office of Economic Development (OED) has long depended on the Low-
Income Housing Tax Credit (LIHTC) to assist developers with gap financing that is often necessary for
developing affordable housing units. The LIHTC credits are distributed by the Colorado Housing and
Finance Authority, and Denver’s OED provides additional funding support for 4 percent tax credit
developments. The revolving affordable housing loan fund and the state low-income housing tax credits
are usually used for this additional financing.
Acquisition capital. Denver’s OED provides balloon payment loans that can be used to acquire land
or property. The maximum size of these loans are $2.5 and $3 million, respectively. These loans assist

D E N V E R A N D T H E S T A T E O F L O W - A N D M I D D L E - I N C O M E H O U S I N G 4 9
with developing affordable housing. Projects financed with land acquisition loans must reserve at least
51 percent of units developed for households earning less than 80 percent of the AMI. The property
acquisition capital can only be used for income-restricted units.24
Metro Mortgage Assistance Plus Program. This program provides down payment assistance for
LMI families who want to apply for 30-year, fixed-rate mortgages. The city will provide down payment
assistance and closing costs assistance for up to 4 percent of a loan package. The program was
established in 2013 and has assisted in almost 600 home sales since 2013 (City of Denver 2014).
The Affordable Housing Revolving Housing Fund. Since its incorporation in the fiscal year 2014
budget, the revolving housing loan fund has provided gap financing for acquiring and rehabilitating
affordable housing units, particularly for the workforce rental population. Although the 2014 budget
included a $3 million allocation to this fund, the 2017 budget does not include any additional transfers
to this fund. The 2017 estimated expenditures for this fund are $2.8 million.
Although these plans and actions are promising, there remains a great need for large-scale efforts
to preserve and expand the availability of affordable housing.
Community and Nongovernmental
Affordable Housing Resources in Denver
In addition to a strong governmental presence on LMI affordable housing issues, Denver has an
extensive network of community and nongovernmental organizations ensuring that all families can
afford to live in Denver. This section describes a few of these organizations and their role in moving
policies and the discussion surrounding LMI affordable housing issues forward.
Local nonprofits and community development organizations, such as the members of the
Neighborhood Development Collaborative, are important partners in developing and protecting
affordable housing. Founded in 2009 to jointly manage a large Neighborhood Stabilization Program
grant, the collaborative is composed of 12 Denver-based community-based organizations working in
the affordable housing space and spanning the housing continuum, from organizations working on
homelessness to those focused on public housing to neighborhood-based community development
corporations. The collaborative builds partnerships with agencies at all levels of government and
private investors and leverages resources for investment in various strategies to promote affordable
housing. The strategies range from direct creation of affordable for-sale and rental units to community

5 0 D E N V E R A N D T H E S T A T E O F L O W - A N D M I D D L E - I N C O M E H O U S I N G
development services such as housing counseling to more traditional advocacy and fundraising efforts.
Since beginning its work, the collaborative has created over 4,000 affordable units and invested over
$660 million in the affordable housing market and has created over 5,000 jobs for Denver residents via
its new construction and programs, which speaks to an important link between housing affordability
and other interventions to improve the lives of LMI families.25
Another important organization is Mile High Connects, whose collaborative structure is focused on
building equity into Denver’s transit system. Mile High Connects is a leader in transit-oriented design
advocacy throughout the city. Recently, the organization has been involved with passing the affordable
housing revolving fund, continued work with Regional Transportation District to develop low-income
discount fare programs, and convened various stakeholders around the need for more robust training
opportunities and local hiring quotas. Aside from these policy-specific activities, Mile High Connects
engages in data collection to better identify and amplify community needs (Mile High Connects 2016).
Last year, it completed a survey of Globeville and Elyria Swansea residents regarding barriers to
employment and workforce development needs and began a study of public investment in first- and
last-mile connections to transit in its effort to improve access to Denver’s growing public transit system.
In addition to these important policy and advocacy efforts, Mile High Connects also helps manage the
Denver Regional Transit Oriented Development Fund, a financing tool that supports preservation and
creation of affordable housing near transit (Mile High Connects 2016).
One member of both Neighborhood Development Collaboration and Mile High Connects is the
Denver chapter of Urban Land Conservancy (ULC), a key developer of affordable housing. As a master
developer, ULC leverages partnerships with the city government and other organizations to operate
various sites across the city. These projects are in line with Denver’s TOD standards and establish long-
term or permanent affordable units at transit sites. As a real estate steward, ULC intervenes before
affordable properties are lost to the market and supports the transition of these sites into community
land trust or other models that promote permanent affordability (ULC, n.d.). Urban Land Conservancy
is also engaged in community asset development via its Ours to Own Platform that operates as a
microinvestment platform where Denver citizens can invest small amounts of money into (and earn
returns on) a greater fund that small businesses and nonprofits can use for development. The platform—
through which ordinary Denver residents are financially involved in community development—has
supported over 400 businesses and nonprofits, many of which are located in ULC’s strategic focus areas
of the city, including Northeast and West Denver (Ours to Own, n.d.).
These three organizations, along with others working on specific issues across the continuum of
affordable housing needs or focusing on rapidly changing neighborhoods, agree on many policy

D E N V E R A N D T H E S T A T E O F L O W - A N D M I D D L E - I N C O M E H O U S I N G 5 1
perspectives that were repeated frequently during our conversations with Denver community
members and stakeholders. Perhaps most frequently raised was that although creating the affordable
housing revolving fund is a good start, its initial $10 million investment is hardly sufficient to address
the enormous mismatch between limited supply and growing demand. Thus, many organizations are
seeking innovative financial tools that can help close the financing gap for developers or preserve
affordable units for the long term. Although Denver is on the forefront of cities establishing innovative
funds for such work, with its trust fund and TOD fund, the desire to push this work further clearly exists
among nongovernmental organizations and community-based organizations. The organizations also
agree that although affordability requirements for developers need to be more rigorous, developers
also need better incentives to meet such requirements. Finally, every organization knows that
affordable housing cannot happen in a bubble. Many are pursuing additional community development
initiatives with an eye toward employment. Between advocating for higher local hiring standards and
dedicating funds to apprenticeships and other training programs during the construction of new
affordable units, workforce development should to be pursued in conjunction with affordable housing
solutions.
Denver Stakeholders: Themes from Conversations
about LMI Affordable Housing Issues
The Urban Institute met with affordable housing stakeholders and government officials in Denver on
February 2 and 3, 2017, to discuss the landscape and potential for advancing programs in the interest of
preserving and creating LMI housing. This section documents the overarching themes that emerged
from our conversations:
1. Extraordinary population growth—fueled by rapid in-migration from other areas—is changing
the population of the city and increasing the demand for housing and the cost of it.
2. Displacement is growing among LMI renters and intersects with race and equity.
3. Denver is innovative with respect to LMI affordable housing policies and programs, but
stakeholders sense that the city cannot keep pace with demand and funding shortfalls.
4. Market-rate rental development has flourished while affordable housing development has
languished, in part because of insufficient incentives and unintended policy obstacles.

5 2 D E N V E R A N D T H E S T A T E O F L O W - A N D M I D D L E - I N C O M E H O U S I N G
This section explores these themes in detail, with consideration for Denver’s unique affordable
housing culture and the barriers and opportunities for retaining LMI families.
Extraordinary population growth is changing the city and housing landscape. Repeatedly, we
heard that rapid growth, particularly in-migration from other areas, was changing the city’s fabric and
housing availability. There was speculation that migration has been fueled by young white people
coming to Denver from the East and West Coasts, drawn to the area because of high-tech jobs, the
lower cost of living, the weather, access to the outdoors, and legal marijuana. Looking at migration data
in the 2011–15 American Community Survey, 14,354 householders moved to the Denver area from out
of state in 2015. Furthermore, among those new householders in 2015, 5,103, or 36 percent, were
white, non-Hispanic people under age 30 moving into the area from out of state.26 This is an uptick from
2005–09, when 8,803 householders moved to the Denver area from out of state and 2,828 (32 percent)
were non-Hispanic white people under age 30. But the notion that new arrivals to Denver were
disproportionately coming from either the East or West Coast was not evident in the American
Community Survey data. Nonetheless, stakeholders’ assessments about population change in Denver is
upheld in the data—there is a disproportionate influx of young, white householders moving into Denver
from out of state.
Newcomers are affecting the affordable housing landscape.27 Denver stakeholders told us that
developers have primarily created new, high-end, market-rate rentals in recent years in response to
population growth and the demand for housing. This trend is a national trend not unique to Denver
(Williams 2015) and it is putting upward pressure on rental prices. Economic theory supports “filtering,”
in that producing new market-rate units in a city creates low-income housing at a rate of 2.5 percent a
year for rentals and 0.5 percent a year for owner-occupied homes (Rosenthal 2014). But developing
high-end rental units can inflate rents throughout the market, especially at the lower end. As new high-
end rental units are developed, rental units that were previously high-end in that market become part of
the moderate- to lower-priced housing stock—yet maintain above-average rents relative to existing
units—meaning that low- and middle-income renters also start paying more for their housing.28 Until
more LMI rentals are developed in Denver, rent inflation at the lower end of the market seems likely to
continue.
Displacement is growing among LMI renters and may intersect with race and equity concerns.
New arrivals and rising rents cause displacement of longtime and low-income residents. Stakeholders
mentioned displacement in nearly every conversation, and despite incredible awareness of the issue,
policymakers and affordable housing advocates have found it to stem this trend. Displacement is
especially notable in majority black and Latino neighborhoods and among LMI families. This raises

D E N V E R A N D T H E S T A T E O F L O W - A N D M I D D L E - I N C O M E H O U S I N G 5 3
important race, ethnicity, and income equity challenges for the city, as its growth and economic
opportunities continue to develop.
Neighborhoods are particularly important for children’s long-term outcomes. Recent research finds
that low-income Latino and black adolescents assigned at random to different neighborhoods via
Denver Housing Authority’s public housing program had better educational outcomes when placed in
more economically secure neighborhoods (Galster et al. 2016). But displacement means that few LMI
families from traditionally disadvantaged neighborhoods in Denver are moving to more economically
secure neighborhoods. Gentrification is causing low-income families to move to areas with the lowest
rents they can find, which research shows only further concentrates disadvantage (Chizeck 2017).
Stakeholders said it is nearly impossible to know where families are moving, but anecdotal reports
suggest they are leaving Denver for the less expensive inner- and outer-ring suburbs, particularly areas
north of the city. One community-based stakeholder in Globeville suggested that their program is
considering following displaced families to their new communities in the suburbs to continue helping
them. The situation in Denver suggests that the concentrated neighborhood disadvantage and fragile
financial security of LMI renters in the city may be increasingly becoming a suburban and regional issue,
too.
Regional coordination for affordable housing may be more important than ever. One stakeholder
suggested that economic development has been the focus of a more regional coordinated effort, but
affordable housing has yet to receive the same attention. But promising developments may be on the
horizon. The Denver TOD fund was expanded in 2014 to include regional issues, and plans are to
develop a larger plan surrounding affordable housing along transit lines.29 In nearby Boulder, a draft
plan for regional housing includes both locally based and regionally based strategies for expanding
affordable housing throughout municipalities (BCRHP 2017). Although Denver and Boulder have made
commitments to increase their funding and supply of affordable housing, other nearby municipalities
have not fully addressed these needs.30 The Denver Regional Council of Governments lists housing
opportunity as a regional goal, but the strategies for achieving this goal are not well defined (DRSCI,
n.d.). As the issue of housing affordability continues to spill over into surrounding areas, a more
concerted regional planning effort will be needed.
Meanwhile, the stress of financial disadvantage and rising rents for LMI families is taking its toll on
residents and families before displacement. Stakeholders in Globeville reported that school officials are
seeing heightened signs of stress among their students because of the financial troubles their families
are experiencing from rising rents. One community-based organization in Globeville recently dedicated
its first funding stream in the neighborhood to hire a school psychologist to work with children, in part

5 4 D E N V E R A N D T H E S T A T E O F L O W - A N D M I D D L E - I N C O M E H O U S I N G
because of the stress of their families’ rental situations. We heard from Globeville stakeholders that
some landlords raise rents on tenants by hundreds of dollars, and because few renters in the
neighborhood have long-term contracts, there is little recourse. Although renters have the legal right of
first refusal to purchase their homes, one stakeholder told us that the down payment that renters in
Globeville would need to purchase the home is often more than they can afford. These factors are
contributing to displacement among LMI renters in Globeville and perhaps out of Denver permanently.
Globeville is a majority Latino and LMI neighborhood and reflects trends happening throughout the
city—displacement intersects with equity issues in Denver and the region overall and raises important
questions about who is benefitting from the city’s prosperity.
Denver is innovative with respect to LMI affordable housing policies and programs, but is
struggling with the rate of change. Denver has several innovative approaches to affordable housing
and is thinking creatively about future policies. Furthermore, an Affordable Housing Trust Fund was
passed by the city council in fall 2016,31 and the new Office of Housing and Opportunities for People
Everywhere—an initiative to address the continuum of housing issues from homelessness to
homeownership in Denver—was started by the mayor in January 2017.32 The city has also been
recognized as a national leader in TOD, having initiated affordable housing projects along its successful
light rail system.33
Despite these strategic initiatives for creating and preserving affordable housing, stakeholders said
that funding is only allowing them to replace units disappearing from the market rather than to meet
the rising demand. Stakeholders expressed concern that the new federal climate could affect LIHTC
funding, a concern substantiated in the national conversation about likely changes affecting the credits
and prospective affordable housing projects in the pipeline.34 Stakeholders are concerned that piecing
together funding is going to be challenging for affordable housing projects moving forward, only adding
to the timeline, fees, and complexity of securing financing. One stakeholder remarked that he used to
close his affordable housing financing deals with just one attorney present, but now needs as many as
seven. This is not necessarily because of processes within Denver, but reflective of challenges faced
nationwide. One developer reported that Denver stands out for its knowledge and ability to secure
funding for affordable housing development. But another developer reported that the cost of land
makes affordable housing in Denver a challenge.
Stakeholders directly involved in developing affordable housing are grappling with how to find new
funding sources. Some of the ideas suggested at the convening of affordable housing stakeholders
included dedicated social impact bonds, greater involvement of mission-oriented philanthropies in
funding initiatives, and intentional collaboration between nonprofit and for-profit developers on

D E N V E R A N D T H E S T A T E O F L O W - A N D M I D D L E - I N C O M E H O U S I N G 5 5
projects. New innovations in funding for Denver’s LMI affordable housing needs may rest in creative
innovations outside of government or through public-private partnerships.
The city is contemplating innovative public-private ventures to increase LMI affordable housing.
One innovation we heard from city leaders is a proposal that the Apartment Association of Metro
Denver brought to the city. The proposal would designate selected vacant apartments in large
developments to be guaranteed affordable housing units for 10- to 20-year terms.35 The city would
provide financial compensation to apartment owners, perhaps from the Affordable Housing Trust Fund.
It is unclear how much support there would be among apartment building owners, how accepting
current market-rate apartment dwellers would be of living among affordable housing recipients, and if
the city would be indirectly subsidizing market-rate units. But it could also be an immediate and cost-
efficient solution to the shortage of immediate LMI affordable units. Chicago’s Low-Income Housing
Trust Fund operates in a similar manner and offers landlords a one-year rental subsidy to provide
housing at an affordable rent to very low–income tenants.36
Denver is also coordinating a project with a condominium developer to create units on city-owned
land. This proposal would address the need for condominium units—a need created indirectly by the
Colorado construction defect law, which makes developers susceptible to lawsuits from homebuyers
for up to seven years after construction. With this proposal, the city as the landowner would shield the
developer from risk of arbitration in the arrangement. While the idea is nascent, it illustrates the
creativity with which Denver is seeking solutions to complicated hurdles in the affordable housing
landscape.
Market-rate rental development has flourished in recent years. Multiple stakeholders reported
that the housing market in Denver was imbalanced, such that market-rate rental units dominated the
development landscape in recent years. This is not solely because of the demographic shifts previously
mentioned, but also because of policy decisions including the construction defect law, state property
tax and rent control laws, and indirect consequences of marijuana legalization.
Colorado’s construction defect law came up repeatedly among stakeholders as an issue preventing
condos from being built and thus inflating the supply, demand, and cost of market-rate apartments. The
construction defect law allows homebuyers to sue developers for up to seven years after the project is
complete. But the law is broad in its definition of defect, meaning that minor issues can be brought to
suit. For example, rulings had to be changed so that developers at TOD sites could no longer be sued for
noise-related issues, an inadvertent consequence of developing housing near public transportation.37
One study cites developers believing there is a near 100 percent chance they will be sued if the

5 6 D E N V E R A N D T H E S T A T E O F L O W - A N D M I D D L E - I N C O M E H O U S I N G
condominium development has a homeowners association and that condominiums cost $15,000 more
per unit because of the additional related fees.38 This legislation was created to protect homebuyers on
their purchase, but it has inadvertently created a disincentive for developers to create condominiums in
Denver. Many stakeholders said that the construction defect law and the dampening of the
condominium market created unmet demand for entry-level homebuyers in the market, pushing them
into market-rate rentals. Developers only had further incentive to create more market-rate apartments
at the expense of affordable housing, causing rents to increase at all levels throughout Denver’s housing
market.39 Even if developers were provided incentives to create condominiums to meet this need, we
heard from stakeholders that insurers perceived great risk for potential lawsuits, making insurance
costly and difficult to attain. Some stakeholders cast some doubt, however, on assessments that the
construction defect law was holding developers back and that the demand in the market for
condominiums is so high that it could be profitable. We heard from other stakeholders that the city had
leverage to ask more from developers with respect to creating affordable housing when deals were
being negotiated. Recent indications suggest there may now be sufficient market-rate rental units
available to meet consumer demand,40 so opportunities to negotiate with developers may be waning.
In addition to the construction defect law, other state laws may pose barriers to Denver’s
affordable housing challenges. Because the state has a law that limits tax increases to prevent
government from growing too large, or the Taxpayers Bill of Rights,41 potential funding streams for
preserving and creating affordable housing are limited. The Affordable Housing Trust Fund had to be
created via a property tax mill and a one-time fee paid by developers of new construction because of
this limitation.42 Stakeholders reported that this law has held them back from sufficiently funding
affordable housing programs, leading them toward creative and hard-won solutions such as the
Affordable Housing Trust Fund.
Another impediment to the affordable housing situation is Colorado’s state ban on rent control, or
the Telluride decision, which forbids local jurisdictions from creating affordable housing that regulates
rent.43 Mandatory inclusionary zoning policies on rental properties, for example, would be considered
rent control under Colorado state law. Because of the Telluride decision, Denver would violate
Colorado state law if it attempted to implement such a policy. Mandatory inclusionary zoning policies,
which would have secured the creation of some affordable housing units in the apartment building
boom in Denver in recent years, were not possible. This has also put renters in a more tenuous position
and makes them vulnerable to extraordinary increases in rent. This is a contributing factor to the
displacement of LMI families. In nearly every conversation we had with stakeholders, tenants’ rights
came up as the next most important challenge facing those working on Denver’s affordable housing

D E N V E R A N D T H E S T A T E O F L O W - A N D M I D D L E - I N C O M E H O U S I N G 5 7
issues. Whether this is to be achieved through changing state legislation or creating provisions at the
local level is yet to be determined.
Finally, marijuana legalization has had an indirect effect on the affordable housing landscape. The
legal marijuana industry was referenced with respect to inflating housing costs. In stakeholder
meetings, we heard speculation that those in the marijuana-growing industry were purchasing homes in
cash to invest money that could not be deposited in banks because of restrictions in the federal banking
laws.44 The Urban team could not confirm anecdotal reports with data that those employed in the legal
marijuana industry were fueling all-cash sales of property, but more than one stakeholder made
reference to this. There was some suggestion that buyers involved in such all-cash sales could
sometimes remain hidden within the system. We heard reference to the city creating a more
transparent system for foreclosures and auction sales online,45 so this could curb all-cash sales moving
forward.
LMI Affordable Housing Program
Recommendations in the Denver Context
Each city has a unique cultural and political context in which programmatic recommendations may fail
or flourish, and Denver is no different. The following ideas reflect suggestions from stakeholders and
any of them could be successful in Denver. The following section explores ways to enhance the state of
LMI affordable housing in Denver and why these recommendations may have traction.
Consider piloting more accessory dwelling unit programs. During the stakeholder meetings, we
heard that accessory dwelling units, or ADUs, could both increase affordable housing within the city and
boost homeowners’ incomes. Accessory dwelling units are secondary units to a main house that
generally contain their own sleeping room, kitchen, and bathrooms and may be either attached or
detached.46 There are plans to pilot an ADU program in West Denver to stem displacement in these
primarily LMI neighborhoods as a way to add affordable housing and support multigenerational
families.47 There are some questions, however, about how this might work within the city’s regulations,
considering that plans for such units, or carriage houses in Denver’s code, are considered case by case
with respect to utilities, proximity to driveways, building code, and historic preservation.48
But other municipalities offer a potential road map for how Denver could develop a more concerted
plan for ADUs. In 2014, Minneapolis passed an ADU ordinance with significant input from the
community to address concerns including absentee landlords, safety, and the look and character of the

5 8 D E N V E R A N D T H E S T A T E O F L O W - A N D M I D D L E - I N C O M E H O U S I N G
units relative to the rest of the neighborhood. Legislators passed regulations to ensure these concerns
were addressed, including making sure that one of the units was owner-occupied, that units went
through inspection, and that the look of the units fit design standards set by the city. Santa Cruz,
California, offers seven preapproved plans for ADUs that conform to the city’s standards, making it
easier for homeowners to select a compliant design.49 Given the appetite for ADUs in the stakeholder
conversations, this idea could garner public support to not only create additional affordable housing
and boost the potential income of homeowners, but allow multiple family members, including older
residents and young families, to stay in place.
Help community land trusts be better used. Community land trusts (CLTs) are an affordable
housing strategy that several stakeholders suggested had gained traction. In the model, a nonprofit,
community-based organization creates a trust that purchases land and maintains ownership of it
permanently. Perspective homeowners enter into a long-term, renewable lease with the trust rather
than a traditional sale. When homeowners sell, they earn only a portion of the increased property value.
The rest of the equity is kept by the trust, maintaining the long-term affordability of the property for
future LMI families.50 The projects are attractive because they promote LMI homeownership and
require a one-time investment of private and public funds that can be used to maintain affordable units
in perpetuity. A few small CLT operate in Denver. The Colorado Community Land Trust, founded in
2002, maintains around 180 CLT properties in the Lowry Field neighborhood in East Denver and has
additional developments planned in other neighborhoods.51 The Urban Land Conservancy is exploring
the possibility of developing a CLT in the Globeville and Elyria Swansea neighborhoods, which would be
a first for the area. The initiative would involve an alternative strategy of purchasing single-family
homes across the area that are not necessarily contiguous. The prospective project would aim to
purchase a few hundred homes over several years, rather than all at once.52
But CLTs are highly capital intensive. The projects require nonprofits to purchase land and, in many
cases, construct or rehab homes before being sold at reduced market prices. Stakeholders noted that in
many Denver neighborhoods (Globeville and Elyria Swansea, in particular), developers have already
secured much of the land that would be available for these developments and that the asking price
would be too expensive to make the projects viable. A possible solution would be to transfer former
public land—such as closing school facilities and bus depots—to nonprofit trusts for CLT development.
The direct transfer or reduced market sale would reduce the significant barrier that land purchase
prices pose to CLT development. Alternatively, partial funding for CLTs could come from the city’s
affordable housing fund, which is projected to raise $150 million over the next decade.

D E N V E R A N D T H E S T A T E O F L O W - A N D M I D D L E - I N C O M E H O U S I N G 5 9
Provide better incentives for developers to create affordable housing. Stakeholders, including
developers, reported that the incentives to create affordable housing are not often attractive enough.
In part, this is because developers and others reported that construction costs are high and land is
expensive, making it a challenge for developers to create units that are both affordable and yield a
return on their investments.
There are incentives, however, that could encourage more affordable housing to be created and
save developers money. For example, developers reported that permitting was a challenge, and there
could sometimes be a five- to six-month lag time from permitting start to issuance. Expedited
permitting and approvals could be an additional incentive for developers and is an important cost-
cutting mechanism for affordable housing development (Jakabovics et al. 2014). A model in Pinellas
County, Florida, offers affordable housing development an expedited permitting process with a two-
week turnaround (Lubell 2016). A shorter permitting process could be sufficiently motivating for
developers because of the cost savings, and also offers benefits to the city and its residents by creating a
faster pipeline for the production of LMI affordable housing units.
We also heard from developers that the city’s fees for factors such as utilities, storm retention, and
other development often detracted from their bottom lines. This is confirmed in other research which
finds that nationally, fees can make affordable housing development financially challenging, particularly
if they are flat fees that disfavor smaller projects (Jakabovics et al. 2014). Some of Denver’s fees are
flat53 and adjusting them to the size of the project could be an important difference in whether a small
affordable housing development project is viable.
Finally, developers and other stakeholders underscored the rising cost of land in Denver being a
challenge for affordable housing projects. To the extent that the city has underutilized public lands that
could be given to developers for LMI affordable housing projects or to land trusts for future
partnerships with developers to create affordable housing, this could also be another important
strategy.
Social impact investing to fund affordable housing. Despite Denver’s innovative and proactive
steps to preserve and expand the stock of affordable housing, it has become clear that the public sector
cannot meet the great demand for affordable housing. Tax credits and other inducements have proven
effective but insufficient. For this reason, stakeholders raised the notion of increased private-sector
involvement in addressing this challenge. Although traditional tax credits such as LIHTC are designed to
induce private investment in producing below-market-rate housing, the city can consider other
innovative strategies that work toward this end.

6 0 D E N V E R A N D T H E S T A T E O F L O W - A N D M I D D L E - I N C O M E H O U S I N G
One of the ideas mentioned in the stakeholder convening was that social impact investing could be
a future funding source for affordable housing. The city is investing in the Denver Social Impact Bond
Initiative that is providing supportive housing for people who are chronically homeless and frequent
users of the emergency medical and criminal justice systems through an Assertive Community
Treatment and Housing First model (Cunningham et al. 2016). The program has been nationally
recognized for its innovative and rigorous design and for its potential to contribute to the growing body
of evidence around the “pay for success” financing mechanism.
Because of the city’s ongoing leadership and capacity building in this emerging field, there may be a
unique possibility and appetite for leveraging private-sector commitments for financing affordable
housing through impact investing. Impact investing refers to a class of financing that aims to generate a
social impact in addition to a financial return on investment. There is an emerging field of “social impact
investors” who are increasingly willing to place equity in investments, such as affordable housing, that
have socially desirable outcomes. One use of such financing can be the acquisition of class B and C
properties with expiring LIHTC income restrictions. The Denver Foundation is charting the way
forward through its Impact Investing Fund.54 The fund and its impact investment committee have made
investments in transit-oriented development, the Denver Social Impact Bond, and other community
development projects. There is potential to continue to leverage private and philanthropic capital to
invest in this emerging asset class of low-income housing that investors can use to hedge far riskier
investments.
A similar example is the San Francisco Housing Accelerator Fund that is a collaborative public-
private partnership that aims to be a “one-stop shop for housing investment.” The fund aims to employ a
fast-response model, build equity, and efficiently assemble private and public bridge financing
necessary for deals to “pencil out.” Another such innovative model is the Housing Partnership Equity
Trust, a socially minded real estate investment trust. The Housing Partnership Equity Trust operates as
a “quick, flexible, and reliable investment platform to compete directly with for-profit, market-rate
housing buyers looking to ‘acquire, reposition, and spike rents.’”55 The trust operates as a collaboration
between investment firms, nonprofit affordable housing providers, and foundations. The nonprofit
partners typically are used for identifying opportunities for investment by the for-profit investors. The
Housing Partnership Equity Trust encourages investors who are “looking for market returns that mesh
with the low level of risk inherent in its portfolio.” Affordable housing aimed at workforce populations
are typically in high demand, so the investment risk tends to be lower than in other investment classes.
Although the Housing Partnership Equity Trust operates across the nation, the organization’s

D E N V E R A N D T H E S T A T E O F L O W - A N D M I D D L E - I N C O M E H O U S I N G 6 1
collaborative model and operating strategy may be a worthwhile model for a local, Denver-specific
model for cross-sector partnerships in affordable housing development.
Explore ways to expand tenants’ rights. Because of state policy with respect to the Telluride
decision, which restricts local jurisdictions from creating rent stabilization policies in conflict with state
law, Denver faces challenges in curtailing rental increases on its residents. Colorado is a pro-business
state in its tenant rights and is less likely to adopt tenant-friendly laws. The laws that are adopted tend
to be pro-landlord, leaving renters with few protections (Hatch 2017). But there are ways Denver could
bolster tenants’ rights through other legal mechanisms.
For example, the city can control the rent of publicly owned and subsidized rental units. So, efforts
for Denver to more actively preserve affordable housing as it comes up for sale through right of first
refusal laws, allowing the city’s purchase, is increasingly important, especially if the city can maintain
such rentals as publicly owned (City and County of Denver 2016). In the right of first refusals for
tenants who live in the homes they rent, however, one of the challenges is coming up with a down
payment in an increasingly costly housing market. One stakeholder shared an example of a renter in
Globeville who works in the community and tried to purchase the home she was renting when it went
on the market. Because of her challenges coming up with the down payment and finding a lender who
could accommodate her needs, she could not purchase her home. In this case, a program that could have
granted her the money and could have worked with her on a creative mortgage would have been useful.
This could be a role for philanthropies or community development financial institutions to work with
renters in this capacity in a quick-response way. For example, the Texas State Affordable Housing
Corporation is a nonprofit that grants renters facing displacement 5 percent of the home’s value to
purchase it from landlords when the home is put up for sale. A similar program could be initiated by a
nonprofit or philanthropy focused on displacement in Denver. Community land trusts provide another
opportunity to assist families in making the transition from renting to owning. If sufficiently capitalized,
the CLT can purchase properties that have increasing rental costs and then work with the renters to
negotiate mortgages under the more affordable land trust terms. Although these strategies do not
necessarily promote tenants’ rights, they enable tenants to stay in their homes, avoid displacement, and
start gaining wealth and equity.
Incorporate an equity lens into discussions of housing and displacement. The changes in Denver’s
population over the last 15 years reveal that many neighborhoods that experienced rapid increases in
rent, home prices, and cost burden were historically inhabited by higher shares of the city’s black and
Latino residents. Meanwhile, shares of white and affluent residents have increased, reflecting who has
been drawn to Denver. Denver’s community engagement strategies (e.g., through the North Denver

6 2 D E N V E R A N D T H E S T A T E O F L O W - A N D M I D D L E - I N C O M E H O U S I N G
Cornerstone Collaborative strategy and the Globeville neighborhood plan) have robust community
engagement strategies incorporated into their plans. But considering the rapid changes in affordability
and displacement across many Denver neighborhoods and not just Globeville and Elyria Swansea, there
is space at the governmental level for a more coordinated racial and social equity platform, particularly
with regard to community engagement.
For example, the city of Portland, Oregon, and King County in Washington have explicit racial and
social equity platforms that undergird their governance.56 Although such explicit platforms may not be
right for Denver, ensuring that housing strategies are mindful of issues related to race and social equity
could create more inclusive conversations; preserve historic, cultural, and social connections; and slow
down residential displacement. Key to the strategy is more intentional inclusion of community voices.
For example, King County’s Communities of Opportunity Initiative has focused investments on select
neighborhoods where economic, health, housing, and social needs among residents were higher than in
the rest of the county.57 The county’s investments through the initiative are driven by the communities’
decisionmaking and the issue areas that they collectively decide they need. This is not unlike what the
United Way is doing via the United Neighborhoods project in Globeville and Elyria Swansea, where the
communities have identified the gaps and needs they would like to see filled, and the United Way’s
investments will be directed accordingly.58 By intentionally building more opportunities for community-
led initiatives into housing and economic development plans in the city government, Denver can stand
at the national forefront of cities that incorporate equity into economic growth and development
strategies to ensure all residents prosper.
Create more apprenticeship opportunities for LMI families, especially in construction work.
Housing cost burden is a function of rising rents and home prices and of stagnant or declining income.
Median income by neighborhood shows that when inflation is factored in, the typical household in many
of Denver’s neighborhoods has experienced declines in income since 2000, which contributes to
housing cost burden (table 5). One important way LMI families’ incomes could be boosted is through
higher-paying work, for example, in the construction industry.
We heard from stakeholders that state-funded construction apprenticeships held promise for
training future workers in the building industry, yet the take-up rate on training and ultimate placement
into jobs was low. A joint program funded through the 2015 state Work Act59 and offered by the
Associated General Contractors of Colorado and the Colorado Contractors Association, or Build
Colorado, offers a no-cost four-week training program to introduce participants to the construction
trades with a hiring fair at the end. Despite these efforts, there may still not be enough incentives for
employers to hire apprenticeships. For example, less than 5 percent of the city’s construction hours

D E N V E R A N D T H E S T A T E O F L O W - A N D M I D D L E - I N C O M E H O U S I N G 6 3
went to apprenticeships in recent years, prompting some city councilmembers to create a mandate that
requires contractors on the National Western redevelopment project to hire apprentices. But even with
mandates, potential construction workers may face such barriers as documentation, child care
constraints, and transportation.60 Understanding the nature of the barriers—among contractors not
providing enough training opportunities and potential construction workers who are not pursuing these
opportunities—may be needed to address this mismatch. For example, if a barrier for employees is the
inability to balance a construction job with child care demands, programs in other areas of the country
could be introduced and adapted to the Build Colorado program.61 As Denver considers expanding
opportunities for apprenticeships, it can consider using a pay for success model for engaging and
leveraging private-sector resources. Utah has begun exploring how pay for success can be used to tie
outcomes around employment and earnings to a workforce development program targeted at high
school dropouts and could be a potential model.
Help LMI families stay in gentrifying neighborhoods with tax increment financing. Tax increment
financing is a mechanism through which increases in property values are leveraged by the city toward
community redevelopment or other reinvestments, often in a specific gentrifying neighborhood. Tax
increment financing was referenced in Denver as a mechanism to incorporate affordable housing issues
into larger community redevelopment plans (Denver Office of Economic Development 2015a). One
example of how this could be implemented comes from Texas’s Homestead Preservation Reinvestment
Zone regulation, legislation directed toward locally designated areas of Austin and Dallas experiencing
rapid changes in property values (Lubell 2016). The legislation allows a portion of increasing property
tax valuations in designated areas to be applied toward preserving low- and middle-income housing in
those same places (Erickson 2011). Denver could create designated tax increment financing zones in
gentrifying neighborhoods (e.g., all or part of Globeville or Elyria Swansea) and could then specify that a
certain percentage of increasing property taxes collected within such zones be dedicated toward
encouraging first-time LMI homebuyers, deferring property tax burdens on longtime homeowners, or
preserving and creating affordable LMI rental housing. Property taxes yielded from newer market-rate
developments in the River North Art District area of Globeville could be redirected to preserve
affordability in proximal areas of the neighborhood on the verge of gentrification. By harnessing
increased property tax money from new high-income homebuyers and the high-value homes they
purchase, such funds could be directed toward LMI affordability.
Provide incentives for property owners to preserve affordability with tax abatements. An
important element of preserving LMI affordable housing is to facilitate incentives for landlords to keep
their existing NOAH rentals at below-market rates. Preserving affordable housing that is not protected

6 4 D E N V E R A N D T H E S T A T E O F L O W - A N D M I D D L E - I N C O M E H O U S I N G
by covenants is a strategic goal of Denver’s leadership, especially in gentrifying neighborhoods (Denver
Office of Economic Development 2015a). But the specific policies and strategies to do so are only
beginning to be formulated.
We heard from stakeholders that programs that help landlords with repairs on LMI rental units has
not been a strong incentive for maintaining affordability. But stakeholders felt that tax abatements
could be a stronger incentive. One strategy employed in Chicago coupled tax abatements for rental
property owners with the repair and rehabilitation of units, as long as a certain percentage of units were
set aside to be affordable for a fixed period (e.g., 10 or 15 years) (Lubell 2016). The Cook County Class 9
program cuts assessments and taxes in half and in exchange, developers agree to keep a certain share of
newly rehabilitated rental units affordable.62 This could be a way for Denver to provide incentives for
preserving LMI affordable housing units without violating the Telluride rule that forbids local
jurisdictions from mandating affordable rentals. Multifamily rental property owners would be opting
into the program in exchange for tax abatements. Given the rapid changes in Denver, such a program
could maintain LMI affordability in certain neighborhoods in the short term while long-term LMI
housing strategies were being developed and LMI housing units were being created.
Renew regional conversations about affordable housing. Although Denver is making a concerted
effort to fund affordable housing and create innovative policy strategies to help LMI families stay, the
city cannot solve this regional problem on its own. Nearby Boulder has recently developed a plan for
affordable housing that incorporates both a local and regional set of strategies.63 Expanding the
conversation regionally is a potential area of exploration for the larger Denver region. We heard from
numerous stakeholders that displacement of LMI families out of Denver and into nearby counties is
occurring in the wake of rapidly rising rental prices. Stakeholders who work with LMI families reported
anecdotes of families having to move to more affordable suburbs, only to be displaced soon after
because of rising housing costs there, too. This suggests that issues of affordability extend beyond the
city limits. The Denver region has demonstrated that it can create an innovative public transit system.
Affordable housing, especially coalescing around displacement, can be the next large issue ripe for
regional thought and collaboration.
Denver and surrounding counties and municipalities have engaged in conversations about various
regional challenges through the Metro Mayors Caucus. Regional coordination has been fruitful around
housing and transportation issues and for moving TOD efforts forward.64 Either through the caucus or
otherwise, the city can renew a focus on addressing regional affordable housing issues and drawing
upon its history of regional leadership and collaboration.

D E N V E R A N D T H E S T A T E O F L O W - A N D M I D D L E - I N C O M E H O U S I N G 6 5
But this could be a challenging task in light of funding challenges and potentially disproportionate
funding being directed toward preserving and creating affordable housing in different municipalities. In
California, the state legislated in 1980 that regions had to meet their “fair share” of housing across the
spectrum of affordability based on population estimates and that municipalities would share this
responsibility. But nearly 40 years later, challenges remain and regional coordination on incentives,
program and policy levers, and funding and taxes continue to be goals for best practices (Wiener and
Rutherford 2008). A more realistic strategy might be for Denver and local municipalities to reconsider
how affordable housing fits with an already robust regional transportation planning effort and to
discuss how these issues intersect with regional economic development. The risk is that without a
coordinated effort to ensure affordable housing for LMI workers (e.g., administrative assistants,
teachers, and service and hospitality workers; table 2) within close proximity to employment, there are
ramifications for the region’s labor market, transportation and infrastructure, and future economic
development. By framing the issue within the context of drawing the next wave of prospective
employers to the region and ensuring that businesses that started in Denver and have since flourished
can stay, there is the potential to reinvigorate regional coordination to ensure that all Denver-area
workers have better access to affordable housing.

6 6 D E N V E R A N D T H E S T A T E O F L O W - A N D M I D D L E - I N C O M E H O U S I N G
Conclusion Denver is uniquely situated to address low- and middle-income affordable housing issues, principally
because stakeholders from city leadership to nonprofit and community-based organizations to
developers are aware of a growing shortage of housing that can accommodate families across the
income spectrum. This awareness is critical because it means the issue is guided by a considerable
amount of consensus and cooperation among diverse parties. Yet Denver is having trouble keeping
pace with affordable housing for LMI families, in part because the population influx and the city’s
growth makes it hard to keep up with such dramatic and rapid change. New funding streams such as the
Affordable Housing Trust Fund and policy ideas such as city-owned LMI affordable housing
condominium developments are impressive examples of innovations in Denver, yet they may not be
happening at the magnitude needed to keep up with the changes.
But the spirit of collaboration and innovation in Denver’s approach to affordable housing holds
promise for introducing pilot programs and policies that are at the leading edge. For example, creative
approaches to accessory dwelling units and social impact investing for affordable housing, as well as
greater use of community land trusts to maintain affordability, could gain traction in the near term
because of its forward-looking approaches. In the long term, conversations about affordable housing
should focus on a regional vision, one that acknowledges that this is a regional challenge and one that
intersects with issues of social equity. Denver’s future economic prospects are promising and will be all
the more successful if all residents in the region can benefit from its growth.

D E N V E R A N D T H E S T A T E O F L O W - A N D M I D D L E - I N C O M E H O U S I N G 6 7
BOX 5
The Urban Institute’s Collaboration with JPMorgan Chase
The Urban Institute is collaborating with JPMorgan Chase over five years to inform and assess
JPMorgan Chase’s philanthropic investments in key initiatives. One of key initiatives is the Partnerships
for Raising Opportunity in Neighborhoods (PRO Neighborhoods), which is a five-year, $125 million
effort to invest in solutions to revitalize neighborhoods by growing small businesses, creating health
and social service facilities, improving access to affordable housing, and collecting better data to study
changing neighborhood demographics. The goals of the collaboration include using data and evidence to
inform JPMorgan Chase’s philanthropic investments, assessing whether its programs are achieving
desired outcomes, and informing the larger fields of policy, philanthropy, and practice. The Low- and
Middle Income (LMI) Residents Housing research draws upon rich data analysis of demographic,
economic, and housing trends in neighborhoods to identify where the most potential exists for
maintaining and creating affordable housing for LMI households.

6 8 A P P E N D I X A
Appendix A. Demographic
Characteristics TABLE A.1
Population and Households in Denver
Neighborhood Population,
2000 Population,
2011–15 Households,
2000 Households,
2011–15
Denver (total) 554,636 649,654 239,235 275,795 Athmar Park 8,664 8,659 2,880 2,937 Auraria 123 825 41 59 Baker 5,810 5,799 2,421 2,624 Barnum 6,060 6,593 1,811 1,960 Barnum West 5,558 5,860 1,788 1,725 Bear Valley 7,101 9,246 3,117 3,681 Belcaro 3,675 4,728 1,833 2,264 Berkeley 8,891 8,564 3,886 4,244 CBD 2,005 4,049 1,421 2,495 Capitol Hill 14,987 15,704 10,629 10,717 Chaffee Park 4,374 4,045 1,500 1,531 Cheesman Park 8,284 8,545 5,498 5,226 Cherry Creek 5,028 6,267 3,198 4,032 City Park 2,123 3,195 1,153 1,672 City Park West 4,286 4,583 2,249 2,536 Civic Center 619 1,769 400 1,251 Clayton 5,172 4,249 1,522 1,518 Cole 5,662 4,600 1,632 1,678 College View–South Platte 6,325 7,124 2,040 2,219 Congress Park 10,324 11,240 5,729 5,911 Cory–Merrill 3,486 4,718 1,801 1,855 Country Club 2,971 3,304 1,321 1,412 DIA 4 1,231 2 529 East Colfax 10,136 11,256 4,063 4,196 Elyria Swansea 6,708 6,676 1,741 1,736 Five Points 8,775 14,770 3,261 7,346 Fort Logan 8,769 8,777 3,279 3,214 Gateway–Green Valley Ranch 8,822 34,957 3,109 10,474 Globeville 3,454 3,551 911 1,071 Goldsmith 5,748 5,257 2,807 2,660 Hale 7,474 6,768 4,181 4,023 Hampden 18,747 18,866 9,861 9,325 Hampden South 13,578 14,838 6,889 7,381 Harvey Park 10,723 12,094 3,982 3,978 Harvey Park South 7,890 8,846 3,119 3,095 Highland 10,353 8,991 3,595 4,560 Hilltop 7,845 8,475 3,301 3,534 Indian Creek 3,341 3,512 1,967 1,938 Jefferson Park 3,330 2,827 1,065 1,418 Kennedy 3,393 4,610 2,051 2,416 Lincoln Park 6,431 6,038 2,673 2,647 Lowry Field 3,668 9,001 1,653 4,192

A P P E N D I X A 6 9
Neighborhood Population,
2000 Population,
2011–15 Households,
2000 Households,
2011–15
Mar Lee 12,232 13,667 4,118 4,108 Marston 9,817 11,287 4,447 5,277 Montbello 27,914 34,483 7,972 8,484 Montclair 5,373 5,908 2,739 2,771 North Capitol Hill 4,071 5,923 2,385 3,943 North Park Hill 10,057 10,533 3,944 4,120 Northeast Park Hill 7,824 9,087 2,633 3,108 Overland 2,081 3,241 874 1,613 Platt Park 5,310 5,745 2,702 2,777 Regis 4,088 4,218 1,649 1,631 Rosedale 2,689 2,424 1,295 1,245 Ruby Hill 9,761 10,811 3,400 3,387 Skyland 3,375 3,147 1,411 1,412 Sloan Lake 8,081 7,813 3,592 3,705 South Park Hill 8,541 9,150 3,644 3,671 Southmoor Park 2,881 4,844 1,538 2,727 Speer 11,460 11,759 7,413 7,427 Stapleton 2,575 17,626 3 5,779 Sun Valley 1,496 1,438 449 475 Sunnyside 11,555 9,832 3,867 4,040 Union Station 2,225 5,060 1,588 3,437 University 8,627 9,393 3,890 3,609 University Hills 5,554 5,924 2,588 2,638 University Park 6,870 7,560 3,557 3,599 Valverde 3,980 3,750 1,225 1,165 Villa Park 9,997 9,135 2,902 2,936 Virginia Village 13,617 14,118 6,380 6,189 Washington Park 6,650 7,199 3,390 3,218 Washington Park West 6,319 7,269 3,380 3,518 Washington Virginia Vale 12,758 13,824 6,433 6,728 Wellshire 3,044 3,363 1,351 1,385 West Colfax 10,825 9,120 3,581 3,664 West Highland 8,531 9,229 3,944 4,226 Westwood 14,999 16,569 4,254 4,577 Whittier 5,462 5,989 1,927 2,162 Windsor 11,790 13,604 6,739 7,563
Source: Urban Institute tabulations of 2000 Decennial Census and 2011–15 American Community Survey data.
Notes: CBD = Central Business District; DIA = Denver International Airport.

7 0 A P P E N D I X A
TABLE A.2
Race and Ethnicity in Denver
Neighborhood
White, 2000
(%)
Black, 2000
(%)
Other races, 2000
(%)
Hispanic, 2000
(%)
White, 2011–
15 (%)
Black, 2011–
15 (%)
Other races, 2011–
15 (%)
Hispanic, 2011–15
(%)
Denver (total) 65 11 21 32 53 9 7 31 Athmar Park 59 1 37 65 21 1 6 73 Auraria 41 13 40 58 56 3 24 18 Baker 64 3 32 54 56 3 7 34 Barnum 51 1 47 76 21 1 1 77 Barnum West 60 1 38 68 21 1 6 72 Bear Valley 80 1 13 22 47 4 6 43 Belcaro 96 1 2 3 93 1 1 5 Berkeley 74 1 24 36 71 0 3 26 CBD 80 8 9 12 75 7 8 10 Capitol Hill 82 5 10 13 79 4 7 10 Chaffee Park 53 1 45 64 37 1 3 58 Cheesman Park 84 6 7 9 84 3 5 7 Cherry Creek 93 1 3 4 87 1 6 6 City Park 79 11 8 10 81 7 4 8 City Park West 57 29 12 14 61 17 7 16 Civic Center 82 6 9 14 82 6 6 5 Clayton 21 40 37 50 29 26 3 42 Cole 34 22 44 71 32 13 3 53 College View–South Platte 57 2 34 58 18 2 7 74 Congress Park 84 7 7 9 82 5 4 10 Cory–Merrill 92 1 5 6 86 1 5 8 Country Club 96 0 2 2 90 0 7 3 DIA 50 25 25 0 32 36 11 21 East Colfax 43 32 24 32 37 25 13 25 Elyria Swansea 36 6 58 83 12 4 1 83 Five Points 43 26 30 43 65 10 5 21 Fort Logan 81 2 12 20 58 3 9 30 Gateway–Green Valley Ranch 51 31 14 16 23 27 9 41 Globeville 51 3 46 77 33 3 3 61 Goldsmith 71 8 16 22 55 10 10 26 Hale 79 7 8 10 74 5 8 12 Hampden 78 10 8 10 62 15 9 13 Hampden South 84 7 6 7 72 9 8 12 Harvey Park 70 1 24 43 31 2 8 59 Harvey Park South 74 1 19 32 40 2 10 49 Highland 54 2 43 67 66 4 4 27 Hilltop 88 5 4 5 90 3 5 2 Indian Creek 86 6 5 6 64 14 7 14 Jefferson Park 53 1 45 83 39 5 4 51 Kennedy 68 10 11 12 33 15 23 29 Lincoln Park 54 8 34 52 43 10 4 43 Lowry Field 72 15 10 10 79 5 6 10

A P P E N D I X A 7 1
Neighborhood
White, 2000
(%)
Black, 2000
(%)
Other races, 2000
(%)
Hispanic, 2000
(%)
White, 2011–
15 (%)
Black, 2011–
15 (%)
Other races, 2011–
15 (%)
Hispanic, 2011–15
(%)
Mar Lee 62 2 32 55 22 1 8 70 Marston 87 1 9 13 72 0 12 16 Montbello 25 45 27 37 11 24 4 61 Montclair 83 9 6 8 79 2 4 14 North Capitol Hill 70 10 16 22 78 6 8 8 North Park Hill 32 57 10 11 53 29 7 11 Northeast Park Hill 16 70 14 24 20 42 8 30 Overland 76 2 20 30 56 11 6 27 Platt Park 91 1 7 8 89 1 4 5 Regis 76 1 20 30 67 1 3 29 Rosedale 89 1 8 10 88 2 3 7 Ruby Hill 62 2 30 59 21 4 8 66 Skyland 18 65 16 22 41 38 4 17 Sloan Lake 69 2 26 43 58 8 5 30 South Park Hill 79 13 6 8 76 7 6 11 Southmoor Park 91 2 5 5 87 4 6 4 Speer 85 3 11 14 86 2 4 8 Stapleton 44 33 22 34 71 8 9 12 Sun Valley 30 18 39 53 16 26 12 46 Sunnyside 49 2 48 72 43 3 4 50 Union Station 80 3 7 9 83 1 7 9 University 87 2 6 6 78 3 12 7 University Hills 90 2 5 7 77 7 6 10 University Park 89 2 5 6 84 2 9 6 Valverde 51 3 44 75 11 3 8 77 Villa Park 51 2 46 80 24 2 2 72 Virginia Village 79 6 11 17 68 6 6 19 Washington Park 95 1 3 3 90 0 5 5 Washington Park West 91 1 6 8 85 1 7 7 Washington Virginia Vale 74 11 9 11 56 18 11 15 Wellshire 95 1 3 4 92 1 2 5 West Colfax 51 3 43 68 34 9 5 51 West Highland 79 1 18 31 79 3 2 15 Westwood 47 2 48 76 11 3 6 80 Whittier 31 45 24 33 50 24 3 23 Windsor 69 11 16 19 51 19 7 22
Source: Urban Institute tabulations of 2000 Decennial Census and 2011–15 American Community Survey data.
Notes: CBD = Central Business District; DIA = Denver International Airport. Blacks and whites are non-Hispanic. Hispanics are
any race.

7 2 A P P E N D I X A
TABLE A.3
Households in Denver by Age and Education
Neighborhood
Households
with at least 1 person
under 18, 2000
(%)
Households with at least 1 person
under 18, 2011–15
(%)
Households
with at least 1 person
over 65, 2000
(%)
Households
with at least 1 person
over 65, 2011–15
(%)
People over 25 with a
bachelor’s degree,
2000 (%)
People over 25 with a
bachelor’s degree,
2011–15 (%)
Denver (total) 26 26 19 19 22 27 Athmar Park 43 36 23 16 6 12 Auraria 52 0 18 7 4 40 Baker 24 17 12 16 23 32 Barnum 50 50 18 18 6 5 Barnum West 42 45 27 27 5 8 Bear Valley 27 30 25 22 20 16 Belcaro 18 19 36 29 34 38 Berkeley 26 21 23 21 17 34 CBD 3 1 13 7 33 44 Capitol Hill 4 4 7 8 30 42 Chaffee Park 37 28 27 19 11 16 Cheesman Park 7 6 13 22 34 45 Cherry Creek 7 11 24 30 38 34 City Park 11 13 14 13 27 46 City Park West 14 12 18 14 21 36 Civic Center 5 2 6 12 30 37 Clayton 49 32 24 22 7 19 Cole 49 42 22 14 8 17 College View–South Platte 46 40 15 17 6 6 Congress Park 15 16 10 11 34 44 Cory–Merrill 17 37 24 20 40 38 Country Club 28 26 15 27 34 43 DIA 50 40 0 7 0 13 East Colfax 36 29 11 15 13 21 Elyria Swansea 60 56 22 17 3 8 Five Points 30 15 17 7 14 36 Fort Logan 32 29 26 32 23 22 Gateway–Green Valley Ranch 48 56 4 11 22 15 Globeville 52 35 21 17 3 12 Goldsmith 18 23 20 17 25 21 Hale 16 14 13 14 33 34 Hampden 19 22 22 27 29 29 Hampden South 19 17 23 24 32 33 Harvey Park 37 42 27 20 10 13 Harvey Park South 32 33 31 27 18 12 Highland 35 18 19 14 16 39 Hilltop 31 33 31 31 33 40 Indian Creek 14 16 8 22 37 31 Jefferson Park 46 20 9 7 10 23 Kennedy 16 25 3 3 29 27 Lincoln Park 30 21 17 17 16 20 Lowry Field 27 27 19 18 28 35

A P P E N D I X A 7 3
Neighborhood
Households
with at least 1 person
under 18, 2000
(%)
Households with at least 1 person
under 18, 2011–15
(%)
Households
with at least 1 person
over 65, 2000
(%)
Households
with at least 1 person
over 65, 2011–15
(%)
People over 25 with a
bachelor’s degree,
2000 (%)
People over 25 with a
bachelor’s degree,
2011–15 (%)
Mar Lee 42 43 22 23 7 11 Marston 28 25 12 22 28 27 Montbello 56 58 11 19 8 6 Montclair 20 26 18 18 36 41 North Capitol Hill 7 4 14 8 22 42 North Park Hill 36 34 27 27 23 35 Northeast Park Hill 45 34 24 26 7 14 Overland 28 14 15 10 16 24 Platt Park 20 21 12 13 34 45 Regis 24 20 26 21 16 26 Rosedale 17 18 24 23 23 36 Ruby Hill 39 41 30 24 4 9 Skyland 31 18 35 27 15 29 Sloan Lake 26 22 25 22 22 34 South Park Hill 31 29 15 28 34 33 Southmoor Park 13 15 28 19 41 43 Speer 8 7 11 12 37 48 Stapleton 0 50 33 8 6 31 Sun Valley 75 63 10 16 0 4 Sunnyside 41 28 22 21 9 21 Union Station 2 4 28 14 30 35 University 14 20 13 13 37 35 University Hills 22 26 26 27 32 33 University Park 18 17 25 17 32 40 Valverde 51 50 20 17 2 9 Villa Park 53 41 18 19 4 11 Virginia Village 22 22 21 18 27 30 Washington Park 17 24 19 26 41 42 Washington Park West 15 17 12 14 43 42 Washington Virginia Vale 20 22 20 23 29 26 Wellshire 26 33 40 40 40 39 West Colfax 43 24 22 23 8 15 West Highland 21 21 19 17 26 38 Westwood 54 54 17 18 3 5 Whittier 38 32 19 13 16 32 Windsor 13 14 42 37 24 22
Source: Urban Institute tabulations of 2000 Decennial Census and 2011–15 American Community Survey data.
Notes: CBD = Central Business District; DIA = Denver International Airport.

7 4 A P P E N D I X A
TABLE A.4
Employment, Poverty, and Public Assistance Rates in Denver
Neighborhood
Labor force unemployed,
2000 (%)
Labor force unemployed, 2011–15 (%)
Poverty rate, 2000
(%)
Poverty rate,
2011–15 (%)
Households receiving
public assistance,
2000 (%)
Households receiving
public assistance,
2011–15 (%)
Denver (total) 6 6 14 17 3 3 Athmar Park 6 6 13 17 4 4 Auraria 20 9 48 8 9 0 Baker 4 4 24 26 5 3 Barnum 3 13 13 33 7 6 Barnum West 7 8 13 28 3 6 Bear Valley 4 6 6 10 1 2 Belcaro 4 5 1 3 0 0 Berkeley 6 6 8 9 2 3 CBD 6 4 21 21 7 3 Capitol Hill 5 5 18 16 2 2 Chaffee Park 10 6 16 10 5 3 Cheesman Park 3 6 11 13 3 2 Cherry Creek 2 4 8 10 6 2 City Park 7 4 10 13 3 3 City Park West 12 8 29 28 4 4 Civic Center 6 7 29 14 6 5 Clayton 11 12 28 25 8 8 Cole 19 10 26 25 10 3 College View–South Platte 8 15 20 45 8 6 Congress Park 3 4 11 11 2 3 Cory–Merrill 2 4 6 7 0 1 Country Club 2 3 1 3 0 1 DIA 67 4 0 19 0 1 East Colfax 6 11 22 37 2 5 Elyria Swansea 12 11 28 31 8 4 Five Points 13 6 32 23 8 4 Fort Logan 5 6 8 11 1 3 Gateway–Green Valley Ranch 4 6 4 8 2 3 Globeville 12 11 23 35 6 5 Goldsmith 8 12 15 18 1 2 Hale 3 4 14 11 2 1 Hampden 3 6 7 11 2 2 Hampden South 4 4 7 5 1 2 Harvey Park 3 7 9 21 3 2 Harvey Park South 3 6 8 15 3 4 Highland 13 4 24 15 4 4 Hilltop 2 4 5 5 1 1 Indian Creek 4 5 4 7 0 0 Jefferson Park 7 6 35 28 8 2 Kennedy 4 13 10 20 2 2 Lincoln Park 10 13 38 34 5 5 Lowry Field 5 4 10 8 2 1 Mar Lee 7 6 14 17 5 2 Marston 2 5 3 6 1 1

A P P E N D I X A 7 5
Neighborhood
Labor force unemployed,
2000 (%)
Labor force unemployed, 2011–15 (%)
Poverty rate, 2000
(%)
Poverty rate,
2011–15 (%)
Households receiving
public assistance,
2000 (%)
Households receiving
public assistance,
2011–15 (%)
Montbello 7 9 14 26 4 4 Montclair 2 3 4 8 1 1 North Capitol Hill 14 5 35 21 5 4 North Park Hill 5 4 9 12 3 1 Northeast Park Hill 7 12 24 27 9 6 Overland 9 3 11 21 4 4 Platt Park 4 7 6 8 1 3 Regis 5 6 7 13 2 3 Rosedale 2 3 7 9 2 2 Ruby Hill 7 6 18 24 9 4 Skyland 6 5 15 12 4 4 Sloan Lake 6 7 12 21 5 5 South Park Hill 3 4 7 6 2 0 Southmoor Park 5 3 2 7 1 1 Speer 4 6 12 14 2 1 Stapleton 3 3 0 0 Sun Valley 18 34 72 86 30 26 Sunnyside 8 8 19 21 7 5 Union Station 4 7 20 19 4 3 University 13 7 14 21 1 1 University Hills 2 6 4 7 2 1 University Park 4 6 11 20 1 0 Valverde 7 4 28 30 10 6 Villa Park 9 10 20 31 6 4 Virginia Village 4 7 11 15 2 2 Washington Park 2 3 2 5 0 1 Washington Park West 3 4 7 8 1 0 Washington Virginia Vale 2 9 10 20 3 4 Wellshire 4 4 2 5 1 0 West Colfax 14 11 29 39 9 6 West Highland 5 6 9 9 2 0 Westwood 8 5 24 32 7 3 Whittier 6 8 29 26 7 4 Windsor 4 5 9 19 2 3
Source: Urban Institute tabulations of 2000 Decennial Census and 2011–15 American Community Survey data.
Notes: CBD = Central Business District; DIA = Denver International Airport.
TABLE A.5
Very Low–Income and Low- and Middle-Income Households in Denver
Neighborhood
VLI households,
2000 (%)
VLI households,
2011–15 (%)
LMI households,
2000 (%)
LMI households,
2011–15 (%)
VLI and LMI
households, 2000 (%)
VLI and LMI
households, 2011–15
(%)
Denver (total) 44 38 35 38 79 75

7 6 A P P E N D I X A
Neighborhood
VLI households,
2000 (%)
VLI households,
2011–15 (%)
LMI households,
2000 (%)
LMI households,
2011–15 (%)
VLI and LMI
households, 2000 (%)
VLI and LMI
households, 2011–15
(%)
Athmar Park 47 44 41 45 88 88 Auraria 75 7 20 63 95 69 Baker 53 41 32 32 85 73 Barnum 50 51 36 45 86 95 Barnum West 46 41 45 47 91 88 Bear Valley 34 31 42 45 76 76 Belcaro 17 9 20 26 37 35 Berkeley 43 31 42 35 84 66 CBD 56 34 21 36 77 70 Capitol Hill 61 48 30 41 91 88 Chaffee Park 53 41 36 41 89 83 Cheesman Park 52 36 31 45 84 81 Cherry Creek 30 26 29 25 59 52 City Park 47 39 37 32 83 71 City Park West 64 50 26 31 90 80 Civic Center 56 34 12 31 68 66 Clayton 63 51 28 37 91 88 Cole 58 54 34 34 92 89 College View–South Platte 49 65 40 30 89 94 Congress Park 45 35 29 33 75 68 Cory–Merrill 27 14 39 41 66 55 Country Club 12 12 26 23 39 34 DIA 100 43 0 42 100 85 East Colfax 60 49 31 40 91 88 Elyria Swansea 55 51 35 42 91 93 Five Points 63 37 27 36 90 73 Fort Logan 31 31 36 39 67 69 Gateway–Green Valley Ranch 19 21 51 54 70 76 Globeville 56 62 35 30 91 93 Goldsmith 51 63 33 27 85 90 Hale 45 35 34 41 79 76 Hampden 39 41 38 40 76 81 Hampden South 31 28 40 42 72 70 Harvey Park 39 40 47 52 86 92 Harvey Park South 35 41 44 35 79 76 Highland 53 31 33 36 86 67 Hilltop 21 16 26 25 47 42 Indian Creek 20 31 50 46 70 78 Jefferson Park 57 49 34 34 91 83 Kennedy 56 60 31 33 87 93 Lincoln Park 61 55 28 31 89 86 Lowry Field 34 25 32 35 66 60 Mar Lee 47 42 41 48 88 89 Marston 24 29 44 50 68 79 Montbello 36 43 45 48 82 91 Montclair 26 24 39 34 65 59 North Capitol Hill 67 40 25 36 92 76 North Park Hill 38 27 38 37 75 63 Northeast Park Hill 57 55 34 34 91 89

A P P E N D I X A 7 7
Neighborhood
VLI households,
2000 (%)
VLI households,
2011–15 (%)
LMI households,
2000 (%)
LMI households,
2011–15 (%)
VLI and LMI
households, 2000 (%)
VLI and LMI
households, 2011–15
(%)
Overland 44 39 44 46 88 86 Platt Park 29 21 44 31 73 51 Regis 39 32 42 44 81 76 Rosedale 36 35 42 41 78 77 Ruby Hill 54 53 35 37 89 90 Skyland 57 36 28 33 85 68 Sloan Lake 47 37 35 28 82 65 South Park Hill 28 17 30 32 57 49 Southmoor Park 26 24 39 50 65 74 Speer 50 38 33 38 84 76 Stapleton 13 25 38 Sun Valley 96 99 4 1 100 100 Sunnyside 54 43 34 37 88 80 Union Station 50 31 17 29 67 60 University 46 46 31 29 77 75 University Hills 30 32 48 39 78 71 University Park 43 42 34 30 76 72 Valverde 59 62 34 35 93 97 Villa Park 55 58 35 35 90 93 Virginia Village 42 40 38 41 79 80 Washington Park 17 15 30 30 47 46 Washington Park West 31 18 35 40 66 58 Washington Virginia Vale 42 49 39 36 81 84 Wellshire 17 17 34 33 50 50 West Colfax 62 65 32 26 94 91 West Highland 42 24 39 32 80 56 Westwood 58 61 34 33 92 93 Whittier 54 37 31 36 85 73 Windsor 51 56 33 35 84 91
Source: Urban Institute tabulations of 2000 Decennial Census and 2011–15 American Community Survey data.
Notes: CBD = Central Business District; DIA = Denver International Airport; LMI = low and middle income; VLI = very low income.
TABLE A.6
Renters in Denver
Neighborhood
Renter-occupied
units, 2000 (%)
Renter-occupied
units, 2011–15
(%)
VLI renters,
2000 (%)
VLI renters,
2011–15 (%)
LMI renters,
2000 (%)
LMI renters,
2011–15 (%)
Denver (total) 48 51 61 48 30 41 Athmar Park 29 39 64 49 26 44 Auraria 73 73 89 0 10 86 Baker 60 63 68 52 23 28 Barnum 33 45 60 62 34 37

7 8 A P P E N D I X A
Neighborhood
Renter-occupied
units, 2000 (%)
Renter-occupied
units, 2011–15
(%)
VLI renters,
2000 (%)
VLI renters,
2011–15 (%)
LMI renters,
2000 (%)
LMI renters,
2011–15 (%)
Barnum West 21 34 63 59 32 40 Bear Valley 35 43 51 39 40 57 Belcaro 8 19 39 10 29 39 Berkeley 32 34 69 52 26 35 CBD 74 66 66 44 19 38 Capitol Hill 82 79 68 47 27 47 Chaffee Park 23 26 69 54 21 40 Cheesman Park 74 61 62 40 30 51 Cherry Creek 53 52 45 35 32 33 City Park 67 58 60 54 34 34 City Park West 78 70 73 62 23 31 Civic Center 56 73 89 45 7 25 Clayton 43 44 72 62 25 35 Cole 52 49 67 62 26 36 College View–South Platte 54 65 65 74 29 22 Congress Park 60 56 61 42 30 48 Cory–Merrill 19 27 32 15 33 57 Country Club 19 20 33 30 35 33 DIA 50 40 46 35 East Colfax 59 65 69 50 26 45 Elyria Swansea 39 55 69 54 27 42 Five Points 69 70 75 37 21 41 Fort Logan 20 22 57 48 32 42 Gateway–Green Valley Ranch 22 32 39 41 48 45 Globeville 37 64 57 65 34 25 Goldsmith 68 76 64 67 30 31 Hale 56 56 63 43 32 46 Hampden 50 53 50 47 40 47 Hampden South 39 43 44 34 44 54 Harvey Park 27 44 61 53 33 44 Harvey Park South 34 35 56 61 36 38 Highland 57 53 69 45 25 35 Hilltop 27 26 42 23 38 35 Indian Creek 21 33 29 42 48 50 Jefferson Park 77 71 66 54 30 36 Kennedy 100 100 56 56 32 37 Lincoln Park 80 72 66 61 26 29 Lowry Field 59 50 45 38 37 44 Mar Lee 31 46 69 43 28 49 Marston 33 40 45 37 41 59 Montbello 27 39 61 54 33 40 Montclair 29 33 49 36 43 45 North Capitol Hill 92 85 72 42 23 39 North Park Hill 17 15 58 49 33 42 Northeast Park Hill 52 55 71 66 23 26 Overland 44 73 64 30 27 56 Platt Park 35 31 40 35 43 40 Regis 28 29 61 43 35 49 Rosedale 50 53 50 33 37 50

A P P E N D I X A 7 9
Neighborhood
Renter-occupied
units, 2000 (%)
Renter-occupied
units, 2011–15
(%)
VLI renters,
2000 (%)
VLI renters,
2011–15 (%)
LMI renters,
2000 (%)
LMI renters,
2011–15 (%)
Ruby Hill 41 49 81 73 14 23 Skyland 37 35 74 58 18 22 Sloan Lake 44 43 68 62 29 26 South Park Hill 23 18 65 30 23 59 Southmoor Park 49 64 28 22 43 61 Speer 75 73 59 39 31 46 Stapleton 100 28 27 40 Sun Valley 95 96 95 99 5 1 Sunnyside 41 44 69 59 24 38 Union Station 56 64 76 36 13 32 University 55 57 59 62 29 31 University Hills 27 33 46 42 43 44 University Park 57 61 59 49 30 41 Valverde 49 57 75 75 24 25 Villa Park 49 58 65 64 28 31 Virginia Village 54 56 59 51 34 40 Washington Park 21 24 17 25 40 46 Washington Park West 42 37 48 23 36 50 Washington Virginia Vale 57 65 55 54 36 41 Wellshire 8 12 33 32 17 55 West Colfax 71 77 72 71 24 25 West Highland 36 38 57 34 34 44 Westwood 45 61 73 59 24 37 Whittier 47 44 68 46 25 42 Windsor 48 57 49 52 34 41
Source: Urban Institute tabulations of 2000 Decennial Census and 2011–15 American Community Survey data.
Notes: CBD = Central Business District; DIA = Denver International Airport; LMI = low and middle income; VLI = very low income.

8 0 A P P E N D I X A
TABLE A.7
Housing Cost–Burdened Households in Denver
Neighborhood
Cost-burdened
renters, 2000
(%)
Cost-burdened
renters, 2011–15
(%)
VLI cost-burdened
renters, 2000
(%)
VLI cost-burdened
renters, 2011–15
(%)
LMI cost-burdened
renters, 2000
(%)
LMI cost-burdened
renters, 2011–15
(%)
Denver (total) 39 47 60 82 7 26 Athmar Park 41 49 59 84 13 29 Auraria 45 0 50 0 0 Baker 35 36 52 65 0 10 Barnum 42 59 66 90 7 8 Barnum West 40 58 64 82 0 26 Bear Valley 38 42 68 93 7 15 Belcaro 32 42 46 100 46 77 Berkeley 40 34 56 61 5 22 CBD 35 45 51 84 4 34 Capitol Hill 38 42 55 78 2 16 Chaffee Park 63 73 86 93 19 59 Cheesman Park 36 39 55 83 4 13 Cherry Creek 30 48 56 76 14 58 City Park 29 52 48 88 2 18 City Park West 34 38 44 58 6 18 Civic Center 43 48 45 83 0 49 Clayton 42 63 58 91 0 27 Cole 33 56 47 83 6 22 College View–South Platte 36 60 54 80 2 15 Congress Park 33 38 52 75 2 18 Cory–Merrill 25 30 64 100 14 29 Country Club 24 28 41 100 22 20 DIA 52 100 16 East Colfax 45 52 64 94 3 17 Elyria Swansea 49 54 67 85 9 27 Five Points 47 38 61 77 7 26 Fort Logan 32 29 51 48 11 23 Gateway–Green Valley Ranch 38 58 84 99 11 41 Globeville 43 63 71 91 7 24 Goldsmith 39 61 61 90 0 5 Hale 41 39 61 79 10 15 Hampden 42 50 75 86 9 24 Hampden South 34 39 67 75 10 30 Harvey Park 36 44 56 76 7 16 Harvey Park South 28 57 47 70 5 44 Highland 45 53 63 93 5 42 Hilltop 38 31 78 100 15 36 Indian Creek 27 46 88 100 5 31 Jefferson Park 36 53 53 87 2 24 Kennedy 39 62 68 91 4 31 Lincoln Park 39 45 57 64 7 31 Lowry Field 43 45 81 83 17 36 Mar Lee 47 43 64 72 8 32 Marston 43 48 83 100 13 24 Montbello 43 55 66 89 6 32

A P P E N D I X A 8 1
Neighborhood
Cost-burdened
renters, 2000
(%)
Cost-burdened
renters, 2011–15
(%)
VLI cost-burdened
renters, 2000
(%)
VLI cost-burdened
renters, 2011–15
(%)
LMI cost-burdened
renters, 2000
(%)
LMI cost-burdened
renters, 2011–15
(%)
Montclair 35 49 60 93 13 39 North Capitol Hill 39 42 53 81 4 26 North Park Hill 44 59 68 92 15 37 Northeast Park Hill 53 63 71 88 10 43 Overland 36 35 55 81 0 21 Platt Park 27 47 55 96 13 37 Regis 39 42 53 59 16 33 Rosedale 47 39 69 90 35 21 Ruby Hill 36 59 42 76 12 33 Skyland 44 41 58 82 8 0 Sloan Lake 38 42 55 64 4 18 South Park Hill 45 33 60 90 24 15 Southmoor Park 41 38 97 96 28 30 Speer 39 36 63 82 4 14 Stapleton 40 97 46 Sun Valley 37 53 38 55 0 0 Sunnyside 38 43 53 64 6 23 Union Station 47 38 55 65 42 51 University 36 58 57 89 8 43 University Hills 33 62 60 90 13 54 University Park 42 52 64 96 12 27 Valverde 46 61 59 72 5 49 Villa Park 42 56 63 87 4 17 Virginia Village 37 46 61 84 4 17 Washington Park 17 38 61 95 17 42 Washington Park West 31 36 56 100 13 30 Washington Virginia Vale 37 56 65 90 4 23 Wellshire 26 45 62 100 35 61 West Colfax 43 57 57 76 8 31 West Highland 35 40 59 93 5 27 Westwood 45 54 61 87 2 26 Whittier 40 40 58 69 3 25 Windsor 34 48 63 84 9 17
Source: Urban Institute tabulations of 2000 Decennial Census and 2011–15 American Community Survey data.
Notes: CBD = Central Business District; DIA = Denver International Airport; LMI = low and middle income; VLI = very low income.

8 2 A P P E N D I X B
Appendix B. Housing Characteristics TABLE B.1
Occupied Housing Units in Denver
Neighborhood Housing units,
2000 Housing units,
2011–15 Occupied units,
2000 (%) Occupied units,
2011–15 (%)
Denver (total) 251,435 294,191 95 94 Athmar Park 2,880 3,055 98 96 Auraria 41 67 94 88 Baker 2,421 2,755 95 95 Barnum 1,811 1,998 97 98 Barnum West 1,788 1,847 98 93 Bear Valley 3,117 3,838 97 96 Belcaro 1,833 2,459 95 92 Berkeley 3,886 4,378 97 97 CBD 1,421 3,403 75 73 Capitol Hill 10,629 11,512 94 93 Chaffee Park 1,500 1,580 98 97 Cheesman Park 5,498 5,740 93 91 Cherry Creek 3,198 4,318 92 93 City Park 1,153 1,858 92 90 City Park West 2,249 2,766 88 92 Civic Center 400 1,406 90 89 Clayton 1,522 1,661 97 91 Cole 1,632 1,843 95 91 College View–South Platte 2,040 2,274 97 98 Congress Park 5,729 6,124 96 97 Cory–Merrill 1,801 1,903 97 97 Country Club 1,321 1,446 96 98 DIA 2 628 67 84 East Colfax 4,063 4,553 96 92 Elyria Swansea 1,741 1,901 96 91 Five Points 3,261 7,966 91 92 Fort Logan 3,279 3,374 98 95 Gateway–Green Valley Ranch 3,109 10,735 86 98 Globeville 911 1,193 95 90 Goldsmith 2,807 2,843 97 94 Hale 4,181 4,322 96 93 Hampden 9,861 10,036 95 93 Hampden South 6,889 7,855 96 94 Harvey Park 3,982 4,085 98 97 Harvey Park South 3,119 3,286 98 94 Highland 3,595 4,969 95 92 Hilltop 3,301 3,632 96 97 Indian Creek 1,967 2,025 98 96 Jefferson Park 1,065 1,536 94 92 Kennedy 2,051 2,643 95 91 Lincoln Park 2,673 2,942 93 90 Lowry Field 1,653 4,551 86 92 Mar Lee 4,118 4,297 98 96 Marston 4,447 5,617 95 94 Montbello 7,972 8,713 97 97

A P P E N D I X B 8 3
Neighborhood Housing units,
2000 Housing units,
2011–15 Occupied units,
2000 (%) Occupied units,
2011–15 (%)
Montclair 2,739 2,886 96 96 North Capitol Hill 2,385 4,269 92 92 North Park Hill 3,944 4,180 98 99 Northeast Park Hill 2,633 3,236 97 96 Overland 874 1,709 97 94 Platt Park 2,702 2,890 97 96 Regis 1,649 1,667 97 98 Rosedale 1,295 1,398 97 89 Ruby Hill 3,400 3,598 97 94 Skyland 1,411 1,493 95 95 Sloan Lake 3,592 3,848 95 96 South Park Hill 3,644 3,772 97 97 Southmoor Park 1,538 2,974 89 92 Speer 7,413 8,050 94 92 Stapleton 3 6,018 100 96 Sun Valley 449 499 94 95 Sunnyside 3,867 4,211 97 96 Union Station 1,588 4,009 86 86 University 3,890 3,795 94 95 University Hills 2,588 2,777 98 95 University Park 3,557 4,007 96 90 Valverde 1,225 1,259 99 93 Villa Park 2,902 3,159 97 93 Virginia Village 6,380 6,607 97 94 Washington Park 3,390 3,512 96 92 Washington Park West 3,380 3,629 95 97 Washington Virginia Vale 6,433 7,151 97 94 Wellshire 1,351 1,415 96 98 West Colfax 3,581 4,055 95 90 West Highland 3,944 4,508 96 94 Westwood 4,254 4,856 97 94 Whittier 1,927 2,183 92 99 Windsor 6,739 8,420 92 90
Source: Urban Institute tabulations of 2000 Decennial Census and 2011–15 American Community Survey data.
Notes: CBD = Central Business District; DIA = Denver International Airport.
TABLE B.2
Renter- and Owner-Occupied Units in Denver
Neighborhood
Renter-occupied units,
2000 (%)
Renter-occupied units,
2011–15 (%)
Owner-occupied units,
2000 (%)
Owner-occupied units,
2011–15 (%)
Denver (total) 51 48 52 49 Athmar Park 29 39 71 61 Auraria 73 73 27 27 Baker 60 63 40 37 Barnum 33 45 67 55 Barnum West 21 34 79 66 Bear Valley 35 43 65 57 Belcaro 8 19 92 81

8 4 A P P E N D I X B
Neighborhood
Renter-occupied units,
2000 (%)
Renter-occupied units,
2011–15 (%)
Owner-occupied units,
2000 (%)
Owner-occupied units,
2011–15 (%)
Berkeley 32 34 68 66 CBD 74 66 26 34 Capitol Hill 82 79 18 21 Chaffee Park 23 26 77 74 Cheesman Park 74 61 26 39 Cherry Creek 53 52 47 48 City Park 67 58 33 42 City Park West 78 70 22 30 Civic Center 56 73 44 27 Clayton 43 44 57 56 Cole 52 49 48 51 College View–South Platte 54 65 46 35 Congress Park 60 56 40 44 Cory–Merrill 19 27 81 73 Country Club 19 20 81 80 DIA 50 40 50 60 East Colfax 59 65 41 35 Elyria Swansea 39 55 61 45 Five Points 69 70 31 30 Fort Logan 20 22 80 78 Gateway–Green Valley Ranch 22 32 78 68 Globeville 37 64 63 36 Goldsmith 68 76 32 24 Hale 56 56 44 44 Hampden 50 53 50 47 Hampden South 39 43 61 57 Harvey Park 27 44 73 56 Harvey Park South 34 35 66 65 Highland 57 53 43 47 Hilltop 27 26 73 74 Indian Creek 21 33 79 67 Jefferson Park 77 71 23 29 Kennedy 100 100 0 0 Lincoln Park 80 72 20 28 Lowry Field 59 50 41 50 Mar Lee 31 46 69 54 Marston 33 40 67 60 Montbello 27 39 73 61 Montclair 29 33 71 67 North Capitol Hill 92 85 8 15 North Park Hill 17 15 83 85 Northeast Park Hill 52 55 48 45 Overland 44 73 56 27 Platt Park 35 31 65 69 Regis 28 29 72 71 Rosedale 50 53 50 47 Ruby Hill 41 49 59 51 Skyland 37 35 63 65 Sloan Lake 44 43 56 57 South Park Hill 23 18 77 82 Southmoor Park 49 64 51 36 Speer 75 73 25 27 Stapleton 100 28 0 72
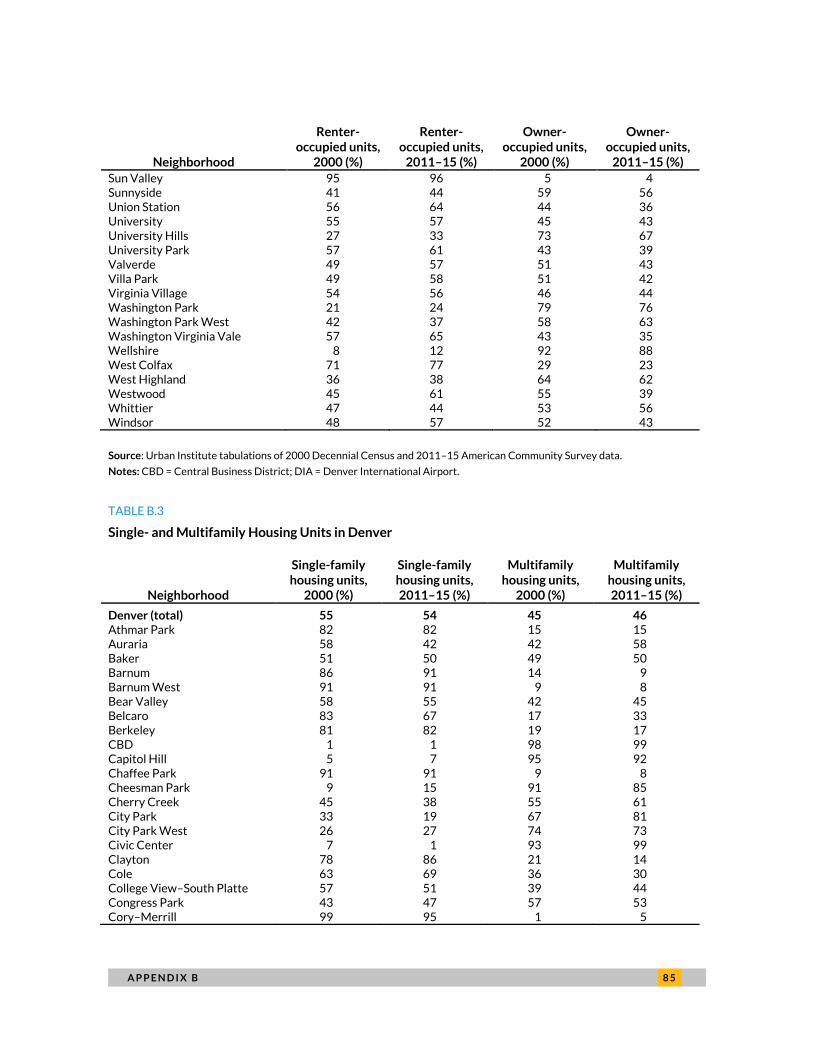
A P P E N D I X B 8 5
Neighborhood
Renter-occupied units,
2000 (%)
Renter-occupied units,
2011–15 (%)
Owner-occupied units,
2000 (%)
Owner-occupied units,
2011–15 (%)
Sun Valley 95 96 5 4 Sunnyside 41 44 59 56 Union Station 56 64 44 36 University 55 57 45 43 University Hills 27 33 73 67 University Park 57 61 43 39 Valverde 49 57 51 43 Villa Park 49 58 51 42 Virginia Village 54 56 46 44 Washington Park 21 24 79 76 Washington Park West 42 37 58 63 Washington Virginia Vale 57 65 43 35 Wellshire 8 12 92 88 West Colfax 71 77 29 23 West Highland 36 38 64 62 Westwood 45 61 55 39 Whittier 47 44 53 56 Windsor 48 57 52 43
Source: Urban Institute tabulations of 2000 Decennial Census and 2011–15 American Community Survey data.
Notes: CBD = Central Business District; DIA = Denver International Airport.
TABLE B.3
Single- and Multifamily Housing Units in Denver
Neighborhood
Single-family housing units,
2000 (%)
Single-family housing units, 2011–15 (%)
Multifamily housing units,
2000 (%)
Multifamily housing units, 2011–15 (%)
Denver (total) 55 54 45 46 Athmar Park 82 82 15 15 Auraria 58 42 42 58 Baker 51 50 49 50 Barnum 86 91 14 9 Barnum West 91 91 9 8 Bear Valley 58 55 42 45 Belcaro 83 67 17 33 Berkeley 81 82 19 17 CBD 1 1 98 99 Capitol Hill 5 7 95 92 Chaffee Park 91 91 9 8 Cheesman Park 9 15 91 85 Cherry Creek 45 38 55 61 City Park 33 19 67 81 City Park West 26 27 74 73 Civic Center 7 1 93 99 Clayton 78 86 21 14 Cole 63 69 36 30 College View–South Platte 57 51 39 44 Congress Park 43 47 57 53 Cory–Merrill 99 95 1 5

8 6 A P P E N D I X B
Neighborhood
Single-family housing units,
2000 (%)
Single-family housing units, 2011–15 (%)
Multifamily housing units,
2000 (%)
Multifamily housing units, 2011–15 (%)
Country Club 84 92 16 8 DIA 100 57 0 43 East Colfax 56 55 44 45 Elyria Swansea 83 85 13 13 Five Points 39 24 61 76 Fort Logan 75 74 25 26 Gateway–Green Valley Ranch 74 82 26 18 Globeville 93 74 7 26 Goldsmith 25 22 75 78 Hale 44 50 55 50 Hampden 36 35 64 65 Hampden South 52 51 48 49 Harvey Park 84 79 16 21 Harvey Park South 68 70 32 30 Highland 53 49 47 51 Hilltop 79 82 21 17 Indian Creek 70 52 30 48 Jefferson Park 35 33 65 67 Kennedy 0 1 100 99 Lincoln Park 41 34 59 66 Lowry Field 39 50 61 50 Mar Lee 80 75 20 25 Marston 56 51 44 49 Montbello 85 84 15 15 Montclair 82 87 18 13 North Capitol Hill 6 3 94 97 North Park Hill 96 98 4 2 Northeast Park Hill 66 67 34 33 Overland 87 49 13 50 Platt Park 84 84 15 16 Regis 83 88 17 11 Rosedale 77 70 23 30 Ruby Hill 67 70 32 30 Skyland 76 86 24 14 Sloan Lake 66 69 34 31 South Park Hill 86 85 13 15 Southmoor Park 39 26 61 74 Speer 24 25 76 75 Stapleton 75 25 Sun Valley 27 32 73 65 Sunnyside 76 78 24 22 Union Station 11 7 89 93 University 60 64 40 36 University Hills 87 86 13 14 University Park 50 46 50 54 Valverde 77 80 22 19 Villa Park 67 68 33 32 Virginia Village 53 52 47 48 Washington Park 80 78 20 22 Washington Park West 72 77 28 22 Washington Virginia Vale 37 35 62 65 Wellshire 98 99 1 1 West Colfax 44 40 56 60

A P P E N D I X B 8 7
Neighborhood
Single-family housing units,
2000 (%)
Single-family housing units, 2011–15 (%)
Multifamily housing units,
2000 (%)
Multifamily housing units, 2011–15 (%)
West Highland 75 76 24 24 Westwood 75 69 21 28 Whittier 72 76 28 24 Windsor 11 10 89 90
Source: Urban Institute tabulations of 2000 Decennial Census and 2011–15 American Community Survey data.
Notes: CBD = Central Business District; DIA = Denver International Airport.
TABLE B.4
Rental Units by Monthly Cost in Denver
Neighborhood
Rental units with gross rent
less than $1,000/month,
2000 (%)*
Rental units with gross rent
less than $1,000/month, 2011–15 (%)*
Rental units with gross rent
more than $1,000/month,
2000 (%)
Rental units with gross rent
more than $1,000/month,
2011–15 (%)
Denver (total) 67 54 33 46 Athmar Park 66 53 34 47 Auraria 89 33 11 67 Baker 77 69 23 31 Barnum 60 53 40 47 Barnum West 60 39 40 61 Bear Valley 53 58 47 42 Belcaro 60 8 40 92 Berkeley 67 59 33 41 CBD 59 43 41 57 Capitol Hill 86 69 14 31 Chaffee Park 51 37 49 63 Cheesman Park 74 59 26 41 Cherry Creek 50 28 50 72 City Park 79 60 21 40 City Park West 84 74 16 26 Civic Center 88 39 12 61 Clayton 71 71 29 29 Cole 82 71 18 29 College View–South Platte 83 78 17 22 Congress Park 76 64 24 36 Cory–Merrill 19 12 81 88 Country Club 41 28 59 72 DIA 0 28 0 72 East Colfax 77 56 23 44 Elyria Swansea 71 62 29 38 Five Points 80 37 20 63 Fort Logan 54 57 46 43 Gateway–Green Valley Ranch 8 20 92 80 Globeville 72 64 28 36 Goldsmith 80 89 20 11 Hale 75 70 25 30 Hampden 47 65 53 35 Hampden South 41 41 59 59

8 8 A P P E N D I X B
Neighborhood
Rental units with gross rent
less than $1,000/month,
2000 (%)*
Rental units with gross rent
less than $1,000/month, 2011–15 (%)*
Rental units with gross rent
more than $1,000/month,
2000 (%)
Rental units with gross rent
more than $1,000/month,
2011–15 (%)
Harvey Park 69 64 31 36 Harvey Park South 69 51 31 49 Highland 72 34 28 66 Hilltop 23 20 77 80 Indian Creek 16 18 84 82 Jefferson Park 92 76 8 24 Kennedy 77 61 23 39 Lincoln Park 56 62 44 38 Lowry Field 24 30 76 70 Mar Lee 70 56 30 44 Marston 33 44 67 56 Montbello 62 46 38 54 Montclair 62 33 38 67 North Capitol Hill 80 49 20 51 North Park Hill 56 41 44 59 Northeast Park Hill 72 60 28 40 Overland 70 32 30 68 Platt Park 57 59 43 41 Regis 63 49 37 51 Rosedale 44 36 56 64 Ruby Hill 85 67 15 33 Skyland 67 44 33 56 Sloan Lake 72 66 28 34 South Park Hill 62 51 38 49 Southmoor Park 2 6 98 94 Speer 74 60 26 40 Stapleton 0 15 0 85 Sun Valley 100 95 0 5 Sunnyside 75 71 25 29 Union Station 75 31 25 69 University 71 56 29 44 University Hills 40 28 60 72 University Park 62 61 38 39 Valverde 78 70 22 30 Villa Park 73 70 27 30 Virginia Village 70 71 30 29 Washington Park 25 25 75 75 Washington Park West 56 38 44 62 Washington Virginia Vale 66 68 34 32 Wellshire 34 19 66 81 West Colfax 76 77 24 23 West Highland 70 39 30 61 Westwood 73 70 27 30 Whittier 76 62 24 38 Windsor 62 59 38 41
Source: Urban Institute tabulations of 2000 Decennial Census and 2011–15 American Community Survey data.
Notes: CBD = Central Business District; DIA = Denver International Airport. Dollar figures from the 2000 Decennial Census are
inflation adjusted to constant 2015 dollars.
* Includes rental units with no cash rent.
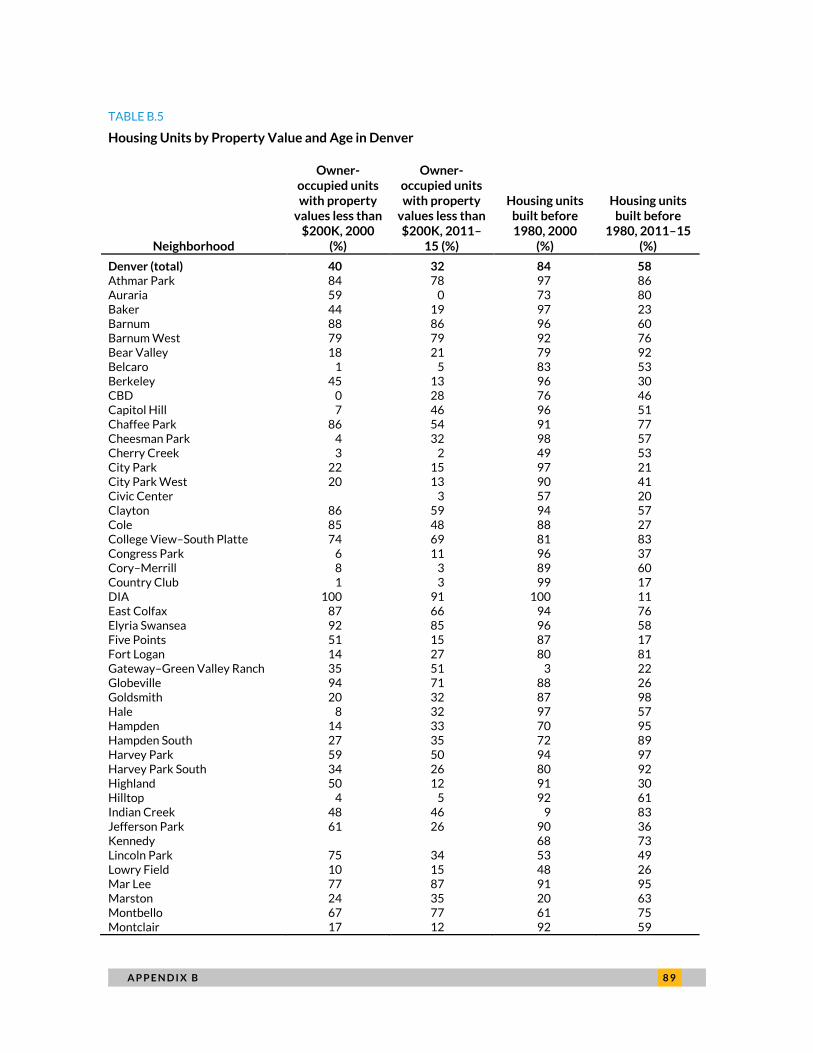
A P P E N D I X B 8 9
TABLE B.5
Housing Units by Property Value and Age in Denver
Neighborhood
Owner-occupied units with property
values less than $200K, 2000
(%)
Owner-occupied units with property
values less than $200K, 2011–
15 (%)
Housing units built before 1980, 2000
(%)
Housing units built before
1980, 2011–15 (%)
Denver (total) 40 32 84 58 Athmar Park 84 78 97 86 Auraria 59 0 73 80 Baker 44 19 97 23 Barnum 88 86 96 60 Barnum West 79 79 92 76 Bear Valley 18 21 79 92 Belcaro 1 5 83 53 Berkeley 45 13 96 30 CBD 0 28 76 46 Capitol Hill 7 46 96 51 Chaffee Park 86 54 91 77 Cheesman Park 4 32 98 57 Cherry Creek 3 2 49 53 City Park 22 15 97 21 City Park West 20 13 90 41 Civic Center 3 57 20 Clayton 86 59 94 57 Cole 85 48 88 27 College View–South Platte 74 69 81 83 Congress Park 6 11 96 37 Cory–Merrill 8 3 89 60 Country Club 1 3 99 17 DIA 100 91 100 11 East Colfax 87 66 94 76 Elyria Swansea 92 85 96 58 Five Points 51 15 87 17 Fort Logan 14 27 80 81 Gateway–Green Valley Ranch 35 51 3 22 Globeville 94 71 88 26 Goldsmith 20 32 87 98 Hale 8 32 97 57 Hampden 14 33 70 95 Hampden South 27 35 72 89 Harvey Park 59 50 94 97 Harvey Park South 34 26 80 92 Highland 50 12 91 30 Hilltop 4 5 92 61 Indian Creek 48 46 9 83 Jefferson Park 61 26 90 36 Kennedy 68 73 Lincoln Park 75 34 53 49 Lowry Field 10 15 48 26 Mar Lee 77 87 91 95 Marston 24 35 20 63 Montbello 67 77 61 75 Montclair 17 12 92 59

9 0 A P P E N D I X B
Neighborhood
Owner-occupied units with property
values less than $200K, 2000
(%)
Owner-occupied units with property
values less than $200K, 2011–
15 (%)
Housing units built before 1980, 2000
(%)
Housing units built before
1980, 2011–15 (%)
North Capitol Hill 28 10 83 28 North Park Hill 46 19 99 63 Northeast Park Hill 63 56 96 82 Overland 90 59 97 25 Platt Park 22 3 99 18 Regis 50 25 93 45 Rosedale 29 9 91 58 Ruby Hill 79 81 94 90 Skyland 65 28 96 67 Sloan Lake 34 13 88 61 South Park Hill 9 7 99 27 Southmoor Park 8 22 51 51 Speer 19 20 89 58 Stapleton 7 4 Sun Valley 100 75 89 67 Sunnyside 67 19 95 43 Union Station 0 2 63 31 University 24 11 98 66 University Hills 38 15 95 90 University Park 9 9 84 67 Valverde 91 66 95 77 Villa Park 86 81 96 72 Virginia Village 26 13 91 95 Washington Park 3 6 96 26 Washington Park West 11 6 99 18 Washington Virginia Vale 33 29 78 92 Wellshire 9 3 98 95 West Colfax 64 39 95 66 West Highland 29 10 99 26 Westwood 92 85 93 75 Whittier 44 8 99 22 Windsor 29 80 67 89
Source: Urban Institute tabulations of 2000 Decennial Census and 2011–15 American Community Survey data.
Notes: CBD = Central Business District. DIA = Denver International Airport.

A P P E N D I X C 9 1
Appendix C: Neighborhood Change
Typology Indexes TABLE C.1
Unemployment and Poverty Rates by Neighborhood
Neighborhood
RES 1: Unemploy-ment Rate (%), 2000
RES 1: Unemploy-ment Rate (%), 2015
RES 1: Change,
2000–15
RES 2: Poverty Rate (%),
2000
RES 2: Poverty Rate (%),
2015
RES 2: Change,
2000–15
Athmar Park 6 6 0 13 17 4 Auraria 20 9 -11 47 8 -39 Baker 4 4 0 24 26 2 Barnum 3 13 10 13 33 20 Barnum West 7 8 1 13 28 15 Bear Valley 4 6 2 6 10 4 Belcaro 4 5 1 1 3 2 Berkeley 6 6 0 8 9 1 Capitol Hill 5 5 0 18 16 -2 CBD 6 4 -2 21 21 0 Chaffee Park 10 6 -4 17 10 -7 Cheesman Park 3 6 3 11 13 2 Cherry Creek 2 4 2 8 10 2 City Park 7 4 -3 10 13 3 City Park West 12 8 -4 29 28 -1 Civic Center 6 7 1 29 14 -15 Clayton 11 12 1 28 25 -3 Cole 19 10 -9 26 25 -1 College View–South Platte 8 15 7 20 45 25 Congress Park 3 4 1 11 11 0 Cory–Merrill 2 4 2 6 7 1 Country Club 2 3 1 1 3 2 DIA 75 4 -71 20 19 -1 East Colfax 6 11 5 22 37 15 Elyria Swansea 12 11 -1 28 31 3 Five Points 13 6 -7 31 23 -8 Fort Logan 5 6 1 8 11 3 Gateway–Green Valley Ranch 4 6 2 4 8 4 Globeville 12 11 -1 23 35 12 Goldsmith 8 12 4 15 18 3 Hale 3 4 1 14 11 -3 Hampden 3 6 3 7 11 4 Hampden South 4 4 0 7 5 -2 Harvey Park 3 7 4 9 21 12 Harvey Park South 3 6 3 8 15 7 Highland 13 4 -9 24 15 -9 Hilltop 2 4 2 5 5 0 Indian Creek 4 5 1 4 7 3 Jefferson Park 7 6 -1 35 28 -7

9 2 A P P E N D I X C
Neighborhood
RES 1: Unemploy-ment Rate (%), 2000
RES 1: Unemploy-ment Rate (%), 2015
RES 1: Change,
2000–15
RES 2: Poverty Rate (%),
2000
RES 2: Poverty Rate (%),
2015
RES 2: Change,
2000–15
Kennedy 4 13 9 10 20 10 Lincoln Park 9 13 4 35 34 -1 Lowry Field 6 4 -2 11 8 -3 Mar Lee 7 6 -1 14 17 3 Marston 2 5 3 3 6 3 Montbello 7 9 2 14 26 12 Montclair 2 3 1 4 8 4 North Capitol Hill 14 5 -9 35 21 -14 North Park Hill 5 4 -1 9 12 3 Northeast Park Hill 7 12 5 24 27 3 Overland 9 3 -6 11 21 10 Platt Park 4 7 3 6 8 2 Regis 10 6 -4 7 13 6 Rosedale 2 3 1 7 9 2 Ruby Hill 7 6 -1 18 24 6 Skyland 6 5 -1 15 12 -3 Sloan Lake 6 7 1 12 21 9 South Park Hill 3 4 1 7 6 -1 Southmoor Park 5 3 -2 2 7 5 Speer 4 6 2 12 14 2 Stapleton 5 3 -2 13 3 -10 Sun Valley 18 34 16 72 86 14 Sunnyside 8 8 0 19 21 2 Union Station 4 7 3 20 19 -1 University 13 7 -6 14 21 7 University Hills 2 6 4 4 7 3 University Park 4 6 2 11 20 9 Valverde 7 4 -3 28 30 2 Villa Park 9 10 1 20 31 11 Virginia Village 4 7 3 12 15 3 Washington Park 2 3 1 2 5 3 Washington Park West 3 4 1 7 8 1 Washington Virginia Vale 2 9 7 10 20 10 Wellshire 4 4 0 2 5 3 West Colfax 14 11 -3 29 39 10 West Highland 5 6 1 9 9 0 Westwood 8 5 -3 24 32 8 Whittier 6 8 2 29 26 -3 Windsor 4 5 1 9 19 10
Source: Urban Institute tabulations of 2011–15 American Community Survey and 2000 Decennial Census data.
Notes: CBD = Central Business District; DIA = Denver International Airport; RES = resident economic success.

A P P E N D I X C 9 3
TABLE C.2
Commute Time and Entropy Index by Neighborhood
Neighborhood
RES 3: Share with 45-minute
commute or longer, 2000
(%)
RES 3: Share with 45-minute
commute or longer, 2015
(%)*
RES 3: Change,
2000–15
RES 4: Entropy
index, 2000
RES 4: Entropy
index, 2015
RES 4: Change,
2000–15
Athmar Park 12 22 10 0.94 0.98 4 Auraria 9 32* 24 0.66 0.71 5 Baker 13 22 9 1.04 1.09 5 Barnum 18 44 26 0.98 0.83 -15 Barnum West 16 30 14 0.90 0.97 7 Bear Valley 19 32 13 0.98 1.08 10 Belcaro 7 22* 15 0.63 0.71 8 Berkeley 10 30 20 0.95 1.02 7 Capitol Hill 11 27 16 1.02 1.01 -1 CBD 9 37 28 1.08 0.91 -17 Chaffee Park 14 25 11 0.97 1.06 9 Cheesman Park 9 27 18 1.08 1.06 -2 Cherry Creek 6 20 14 0.87 0.68 -19 City Park 11 31 20 1.06 0.98 -8 City Park West 9 29 20 1.01 1.08 7 Civic Center 9 28* 19 0.88 0.86 -2 Clayton 14 37 23 0.92 0.95 3 Cole 14 43 29 0.93 0.96 3 College View–South Platte 16 47 31 0.91 0.82 -9 Congress Park 9 17 8 1.06 0.83 -23 Cory–Merrill 8 29 21 0.98 0.97 -1 Country Club 7 31 24 0.72 0.56 -16 DIA 50 33* -17 1.07 1.02 -5 East Colfax 12 34 12 0.94 0.95 1 Elyria Swansea 14 37* 23 0.92 0.86 -6 Five Points 13 33 20 0.88 1.07 19 Fort Logan 13 40 27 1.03 1.08 5 Gateway–Green Valley Ranch 14 44 30 0.93 1.01 8 Globeville 17 41 24 0.91 0.98 7 Goldsmith 12 25 13 1.06 1.00 -6 Hale 7 28 21 1.04 1.02 -2 Hampden 9 28 19 1.07 1.08 1 Hampden South 7 25 18 1.03 1.02 -1 Harvey Park 17 28 11 0.96 0.94 -2 Harvey Park South 11 31 20 1.02 1.09 7 Highland 13 23 10 1.01 1.06 5 Hilltop 6 28 22 0.90 0.74 -16 Indian Creek 6 23 17 0.93 1.07 14 Jefferson Park 23 34 11 0.85 1.04 19 Kennedy 9 40 31 0.97 0.86 -11 Lincoln Park 8 24 16 0.91 0.94 3 Lowry Field 13 28 15 1.06 0.97 -9 Mar Lee 14 34 20 0.99 0.97 -2 Marston 18 41 23 0.95 1.01 6 Montbello 15 40 25 0.99 0.92 -7 Montclair 8 20 12 1.03 0.98 -5

9 4 A P P E N D I X C
Neighborhood
RES 3: Share with 45-minute
commute or longer, 2000
(%)
RES 3: Share with 45-minute
commute or longer, 2015
(%)*
RES 3: Change,
2000–15
RES 4: Entropy
index, 2000
RES 4: Entropy
index, 2015
RES 4: Change,
2000–15
North Capitol Hill 8 29 21 0.90 1.04 14 North Park Hill 14 25 11 1.06 1.04 -2 Northeast Park Hill 11 35 24 0.95 0.97 2 Overland 9 27 18 0.98 1.10 12 Platt Park 10 11 1 1.00 0.91 -9 Regis 12 29 17 0.97 1.06 9 Rosedale 9 20 11 1.07 0.95 -12 Ruby Hill 13 35 22 0.97 0.98 1 Skyland 13 39 26 1.06 1.05 -1 Sloan Lake 13 24 11 1.04 1.05 1 South Park Hill 8 22 14 0.99 0.84 -15 Southmoor Park 7 23 16 0.92 0.93 1 Speer 11 23 12 1.08 1.00 -8 Stapleton 11 20 9 0.98 0.69 -29 Sun Valley 24 31* 8 0.16 0.03 -13 Sunnyside 15 33 18 0.97 1.07 10 Union Station 11 34* 23 1.04 0.94 -10 University 7 29 22 1.06 1.04 -2 University Hills 8 25 17 0.92 1.06 14 University Park 7 26 19 1.04 0.97 -7 Valverde 20 28* 8 0.87 0.79 -8 Villa Park 20 30 10 0.93 0.92 -1 Virginia Village 11 35 24 1.05 1.09 4 Washington Park 7 18 11 0.85 0.75 -10 Washington Park West 6 34 28 1.01 0.98 -3 Washington Virginia Vale 12 33 21 1.06 1.06 0 Wellshire 7 18 11 0.87 0.86 -1 West Colfax 15 28 13 0.88 0.89 1 West Highland 11 32 21 1.03 0.95 -8 Westwood 17 42 25 0.91 0.88 -3 Whittier 14 25 11 1.00 1.09 9 Windsor 11 34 23 1.05 0.98 -7
Source: Urban Institute tabulations of 2011–15 American Community Survey and 2000 Decennial Census data.
Notes: CBD = Central Business District; DIA = Denver International Airport; RES = resident economic success.
* denotes values for which tract-level data was not available from Census. We imputed these values by averaging surrounding
tracts.

A P P E N D I X C 9 5
TABLE C.3
Median Home Values and Vacancy Rates by Neighborhood
Neighborhood
HMH 1: Median Home
value ($), 2000
HMH 1: Median Home
value ($), 2015*
HMH 1: Change,
2000–15 ($)
HMH 2: Vacancy rate (%),
2000
HMH 2: Vacancy rate (%),
2015
HMH 2: Change,
2000–15
Athmar Park 171,305 155,111 -16,194 1 3 2 Auraria 183,166 450,000 266,835 5 6 1 Baker 208,290 312,100 103,810 4 1 -3 Barnum 148,030 144,800 -3,230 3 1 -2 Barnum West 162,047 156,100 -5,947 1 1 0 Bear Valley 235,221 243,165 7,943 2 2 0 Belcaro 571,684 742,600 170,916 3 4 1 Berkeley 203,332 349,602 146,270 3 3 0 Capitol Hill 307,787 223,704 -84,082 5 4 -1 CBD 227,154 268,100 40,946 11 14 3 Chaffee Park 157,356 194,600 37,244 2 3 1 Cheesman Park 500,592 276,896 -223,696 4 4 0 Cherry Creek 543,650 645,300 101,650 5 5 0 City Park 262,000 343,600 81,600 7 5 -2 City Park West 255,789 327,153 71,364 9 6 -3 Civic Center 0 372,100 372,100 8 5 -3 Clayton 138,991 169,000 30,009 3 7 4 Cole 137,943 206,600 68,657 4 3 -1 College View–South Platte 163,176 166,800 3,624 3 2 -1 Congress Park 347,222 452,931 105,709 3 2 -1 Cory–Merrill 281,257 424,000 142,743 3 0 -3 Country Club 676,222 824,500 148,278 2 0 -2 DIA 138,348 124,200 -14,148 33 4 -29 East Colfax 150,622 169,621 19,000 4 5 1 Elyria Swansea 127,332 131,000 3,668 4 3 -1 Five Points 172,411 301,265 128,854 6 5 -1 Fort Logan 261,535 274,261 12,726 1 3 2 Gateway–Green Valley Ranch 211,756 200,287 -11,470 14 1 -13 Globeville 122,092 131,900 9,808 3 3 0 Goldsmith 267,633 275,400 7,767 3 4 1 Hale 308,436 283,993 -24,443 4 3 -1 Hampden 259,542 245,527 -14,015 4 5 1 Hampden South 289,139 300,026 10,887 4 4 0 Harvey Park 191,033 193,929 2,895 1 2 1 Harvey Park South 210,679 230,033 19,354 2 5 3 Highland 196,993 370,013 173,019 4 6 2 Hilltop 465,120 698,034 232,915 3 1 -2 Indian Creek 201,609 211,600 9,991 1 2 1 Jefferson Park 166,632 $294,000 127,368 4 6 2 Kennedy 0 213,233* 213,233 4 4 0 Lincoln Park 142,348 225,570 83,222 6 6 0 Lowry Field 399,763 450,203 50,440 10 6 -4 Mar Lee 167,185 146,676 -20,510 1 3 2 Marston 258,027 258,235 208 4 3 -1 Montbello 181,958 158,244 -23,714 3 1 -2 Montclair 261,607 348,600 86,993 3 2 -1

9 6 A P P E N D I X C
Neighborhood
HMH 1: Median Home
value ($), 2000
HMH 1: Median Home
value ($), 2015*
HMH 1: Change,
2000–15 ($)
HMH 2: Vacancy rate (%),
2000
HMH 2: Vacancy rate (%),
2015
HMH 2: Change,
2000–15
North Capitol Hill 434,513 316,646 -117,867 6 5 -1 North Park Hill 211,684 327,419 115,735 2 0 -2 Northeast Park Hill 177,100 191,173 14,073 2 2 0 Overland 153,663 180,400 26,737 3 4 1 Platt Park 252,306 423,500 171,194 2 2 0 Regis 195,161 238,700 43,539 1 1 0 Rosedale 222,700 342,700 120,000 3 5 2 Ruby Hill 165,745 165,867 121 2 4 2 Skyland 162,047 270,400 108,353 2 2 -0 Sloan Lake 221,694 353,803 132,109 4 4 0 South Park Hill 352,113 463,050 110,937 1 1 0 Southmoor Park 396,905 345,270 -51,635 9 5 -4 Speer 283,569 349,680 66,110 4 4 0 Stapleton 131,399 445,312 313,914 0 3 3 Sun Valley 111,350 137,500 26,150 5 2 -3 Sunnyside 169,312 277,265 107,953 2 3 1 Union Station 462,037 496,900 34,863 5 5 0 University 236,938 352,721 115,783 5 0 -5 University Hills 209,515 259,614 50,099 2 2 0 University Park 334,063 621,644 287,581 3 6 3 Valverde 146,720 157,900 11,180 1 6 5 Villa Park 153,290 147,328 -5,962 3 5 2 Virginia Village 216,842 281,636 64,794 2 4 2 Washington Park 402,307 578,339 176,032 3 6 3 Washington Park West 310,819 449,087 138,268 3 1 -2 Washington Virginia Vale 243,336 293,193 49,858 3 4 1 Wellshire 391,821 533,000 141,179 4 1 -3 West Colfax 173,482 248,561 75,079 5 5 0 West Highland 234,044 378,663 144,619 4 2 -2 Westwood 140,483 129,469 -11,014 2 5 3 Whittier 205,539 325,900 120,361 5 0 -5 Windsor 293,117 173,457 -119,660 5 5 0
Source: Urban Institute tabulations of 2011–15 American Community Survey and 2000 Decennial Census data.
Notes: CBD = Central Business District; DIA = Denver International Airport; HMH = housing market health.
* denotes values for which tract-level data was not available from Census. We imputed these values by averaging surrounding
tracts.

A P P E N D I X C 9 7
TABLE C.4
Housing Cost Burden and Homeownership Rate by Neighborhood
Neighborhood
HMH 3: Percentage
housing cost-
burdened (%), 2000
HMH 3: Percentage
housing cost-
burdened (%), 2015
HMH 3: Change,
2000–15
HMH 4: Homeownership
rate (%), 2000
HMH 4: Homeownership
rate (%), 2015
HMH 4: Change,
2000–15
Athmar Park 34 28 -6 64 61 -3 Auraria 39 7 -2 21 27 6 Baker 28 33 5 33 37 4 Barnum 31 35 4 62 55 -7 Barnum West 32 34 2 74 66 -8 Bear Valley 23 27 4 55 57 2 Belcaro 18 24 6 77 81 4 Berkeley 29 23 -6 63 66 3 Capitol Hill 32 31 -1 3 21 8 CBD 30 43 13 1 34 33 Chaffee Park 41 36 -5 75 74 -1 Cheesman Park 28 27 -1 7 39 32 Cherry Creek 21 30 9 34 48 14 City Park 21 37 16 25 42 17 City Park West 27 25 -2 16 30 14 Civic Center 36 35 -1 0 27 27 Clayton 36 44 8 53 56 3 Cole 31 32 1 44 51 7 College View–South Platte 32 49 17 41 35 -6 Congress Park 23 28 5 34 44 10 Cory–Merrill 21 19 -2 79 73 -6 Country Club 20 19 -1 76 80 4 DIA 55 45 -10 100 60 -40 East Colfax 35 39 4 38 35 -3 Elyria Swansea 37 34 -3 55 45 -10 Five Points 39 33 -6 24 30 6 Fort Logan 25 24 -1 65 78 13 Gateway–Green Valley Ranch 37 36 -1 77 68 -9 Globeville 33 46 13 57 36 -21 Goldsmith 22 44 22 21 24 3 Hale 28 26 -2 32 44 12 Hampden 29 29 0 33 47 14 Hampden South 25 23 -2 47 57 10 Harvey Park 29 35 6 72 56 -16 Harvey Park South 23 27 4 61 65 4 Highland 38 33 -5 35 47 12 Hilltop 23 24 1 70 74 4 Indian Creek 25 24 -1 61 67 6 Jefferson Park 33 42 9 22 29 7 Kennedy 29 57 28 0 0 0 Lincoln Park 32 31 -1 16 28 12 Lowry Field 38 31 -7 40 50 10 Mar Lee 32 32 0 64 54 -10

9 8 A P P E N D I X C
Neighborhood
HMH 3: Percentage
housing cost-
burdened (%), 2000
HMH 3: Percentage
housing cost-
burdened (%), 2015
HMH 3: Change,
2000–15
HMH 4: Homeownership
rate (%), 2000
HMH 4: Homeownership
rate (%), 2015
HMH 4: Change,
2000–15
Marston 28 31 3 52 60 8 Montbello 36 42 6 70 61 -9 Montclair 24 29 5 65 67 2 North Capitol Hill 32 34 2 3 15 12 North Park Hill 29 24 -5 80 85 5 Northeast Park Hill 38 42 4 42 45 3 Overland 38 32 -6 56 27 -29 Platt Park 23 21 -2 61 69 8 Regis 29 22 -7 68 71 3 Rosedale 32 25 -7 48 47 -1 Ruby Hill 31 35 4 56 51 -4 Skyland 33 25 -8 61 65 4 Sloan Lake 29 23 -6 49 57 8 South Park Hill 27 20 -7 73 82 9 Southmoor Park 22 29 7 38 36 -2 Speer 30 28 -2 18 27 9 Stapleton 19 18 -1 68 72 4 Sun Valley 32 36 4 3 4 1 Sunnyside 33 28 -5 55 56 1 Union Station 37 31 -6 6 36 30 University 26 43 17 43 43 0 University Hills 28 32 4 68 67 -1 University Park 29 39 10 38 39 1 Valverde 36 47 11 49 43 -6 Villa Park 33 40 7 46 42 -4 Virginia Village 27 30 3 42 44 2 Washington Park 20 24 4 68 76 8 Washington Park West 24 19 -5 53 63 10 Washington Virginia Vale 26 38 12 32 35 3 Wellshire 15 28 13 87 88 1 West Colfax 33 42 9 24 23 -1 West Highland 28 18 -10 58 62 4 Westwood 38 40 2 50 39 -11 Whittier 35 26 -9 49 56 7 Windsor 27 36 9 9 43 34
Source: Urban Institute tabulations of 2011–15 American Community Survey and 2000 Decennial Census data.
Notes: CBD = Central Business District; DIA = Denver International Airport; HMH = housing market health.

A P P E N D I X D 9 9
Appendix D. Data and Methods

1 0 0 A P P E N D I X D
Neighborhood Typology
Neighborhood Change Index
To better understand changes at the neighborhood level in Denver, we used 2000 data from the
Neighborhood Change Database and 2011–15 American Community Survey data to compare the
change in various demographic and housing indicators. Because these data were not available at the
neighborhood level, we used a weighting system to aggregate tract-level data up to the neighborhood
level.
BOX D.1
Neighborhood Change Database
The national Neighborhood Change Database reconciles a neighborhood’s changing boundaries (i.e.,
census tracts per their boundaries in 2010) and the changing definitions of the variables collected in
successive US Census Bureau surveys of households so researchers can study neighborhood changes
over time with fixed boundaries. The database is compiled by GeoLytics and the Urban Institute and
provides data from the US Census Bureau at the tract level back to 1970.
Neighborhood Tabulations
This analysis used a weighting strategy to produce tabulations at the neighborhood level. Because
tracts do not always fall neatly into one neighborhood, tracts were weighted based on their relative
geographic coverage in each neighborhood. To calculate this proportion, we began with the block-level
file for Denver and neighborhood boundary file (available via the city of Denver) and assigned each
block to a neighborhood based on where their centroids fell. Blocks, the smallest geography available,
do not cross tract or neighborhood boundaries. We used two neighborhood boundary files and
reconciled certain neighborhood boundaries between them to best represent how Denver residents
think about their neighborhoods. Next, we clipped the block file to the neighborhood boundaries to
exclude blocks that do not fall within Denver’s city boundaries. Using this new file, we aggregated the
block population up to the tract level by neighborhood. Tracts that fall into two neighborhoods have
two population records. We then merged a file with tract-level population estimates onto this block-to-

A P P E N D I X D 1 0 1
tract population file. This accounts for the full tract population without neighborhood assignment.
Finally, we calculated two weights, one for count variables and another for precalculated proportion
variables. The weights, defined below, were applied to tract-level data. These data were collapsed by
neighborhood to create estimates at the neighborhood level.
Count weight = (population of proportion of tract that falls into neighborhood) / (full tract
population)
Proportion weight = (population of proportion of tract that falls into neighborhood) / (full
neighborhood population)
Index Creation
To characterize economic opportunity and housing accessibility in Denver neighborhoods and gauge
change, we relied on the Kirwan Institute’s Opportunity Index methodology used in its Opportunity
Mapping series.65 We created three indexes: one to measure neighborhood residents’ economic success
(RES index), a second to measure housing market health (HMH index), and a third composite index to
examine these dimensions in concert. All data for the 2000 indexes are from the 2000 Decennial
Census via the Neighborhood Change Database. The 2011–15 American Community Survey data are
from the National Historic Geographic Information System. The indicators used for each index are
presented in table D.1. See table D.2 for a description of each indicator.
TABLE D.1
Neighborhood Change Indicators
Composite Index
Resident economic success index Housing market health index
Unemployment rate Property value (median home value) Poverty rate Vacancy rate Percentage with 45-minute commute or longer Percentage cost burdened in renting or owning Entropy index for resident income mix Homeownership rate

1 0 2 A P P E N D I X D
TABLE D.2
Indicator Construction
Index Indicator Variable construction Sign
RES 1 Unemployment rate
(Persons 16+ years old in the civilian labor force and unemployed) / (Persons 16+ years old in the civilian labor force)
(-)
RES 2 Poverty rate (Total persons below the federal poverty level last year) / (Total population with poverty status determined)
(-)
RES 3 Commute time (Workers 16+ years old with travel time to work more than 45 minutes) / (Workers 16+ years old working outside the home)
(-)
RES 4 Income mix Entropy index (+)
HMH 1 Property value Median value of owner-occupied housing units (+)
HMH 2 Vacancy rate (Total vacant housing units (minus seasonal, recreational, occasional, or migrant worker use)) / (Total housing units)
(-)
HMH 3 Cost burden (Renters and owners whose monthly housing costs are 35% or more of last year’s income) / (Total renters and owners)
(-)
HMH 4 Homeownership (Total specified owner-occupied housing units) / (Total occupied housing units)
(+)
Notes: RES = resident economic success; HMH = housing market health.
We turn each indicator into a z-score to standardize across units of measurement. These z-scores
are averaged by index to produce two component index scores and a composite index score. We
multiply indicators by -1 if a higher value corresponded to a negative life outcome. The sign associated
with each indicator is noted in table D.2. We do not apply weights to specific indicators. All are treated
as equal in importance to their respective indexes. We assess each component index separately and
together in our composite index and rank neighborhoods based on their index values in a given year, as
well as their change over time.
Entropy Index for Resident Income Mix
We include a measure to capture the income mixing within the neighborhood in our resident economic
success (and composite) index, as evidence suggests that income diversity in neighborhoods is
associated with the economic success of residents (Chetty and Hendren 2015; Sharkey and Graham
2013). Of the measures of segregation available, we employed an entropy index to capture the spatial
distribution of multiple groups (instead of just two groups, as is possible with common measures of
isolation or dissimilarity). The entropy index measures the “evenness” of the population distribution
based on certain identified groups. In this case, we measured the neighborhood distribution of residents
with income less than $40,000 a year, residents with income between $40,000 and $100,000 a year,
and residents with income greater than $100,000 a year. These buckets correspond with Denver’s area

A P P E N D I X D 1 0 3
median income (AMI) breakdowns for one-person households. The formula for calculating the entropy
index is provided by Dartmouth University (Forest 2005, 3).
Demographic and Housing Indicators
Data for housing and demographic conditions (see appendixes A and B) were collected from the
following data sources:
2000 Decennial Census. This analysis uses data from the Summary File 1 and the Summary File
3 sample. These data were sourced from the American FactFinder’s precalculated tabulations
and were obtained at the census tract level and then aggregated to the geographic
specifications listed below.
2011–15 American Community Survey five-year sample. This analysis also uses data from the
American Community Survey’s (ACS) 2011–15 five-year sample, which averages data over five
years. American Community Survey data were obtained at the Public Use Microdata Area and
the census tract levels and then aggregated to the geographic specifications listed below.
HUD Income Limits
Identifying households at various AMI-level “bands” requires using the US Department of Housing and
Urban Development’s (HUD) Income Limits data to classify individual-level survey responses from the
Integrated Public Use Microdata Series database into income bands for further analysis. We matched
each year of HUD Income Limits data to the same year of ACS or Census data. For example, if the ACS
data are from 2015, we use fiscal year 2014 HUD Income Limits. HUD Income Limits are available for
download.66
The AMI band for each household is determined by the number of people in the household and the
income level of the household, as well as the county-level cutoffs for each band. We examine the AMI-
band income categories defined in the HUD Income Limits section (box D.2). The middle-income and
high-income categories are not included in the HUD Income Limits file, but can be generated by
calculating 80 and 120 percent of AMI as AMI * 0.8 and AMI * 1.2, respectively.
For households with 9 to 30 people, we calculate the AMI level per HUD guidance.67 The formula is
(AMI-level cutoff for a four-person family * (1 + ((Number of persons in the household – 4) * 8) / 100)).

1 0 4 A P P E N D I X D
For a nine-person household at the 30 percent AMI level, this calculation is (30 percent of AMI-level
cutoff for a four-person family * (1 + ((9 – 4) * 8) / 100)), or (30 percent of AMI for a four-person family *
1.4). For each person in the household, increase the factor by 0.08, or 8 percentage points, so the factor
is 1.4 times the AMI level of a 4-person family for a 9-person household, 1.48 for a 10-person
household, 1.56 for an 11-person household, and so on up to a 30-person household.
BOX D.2
Area Median Income Definitions
Extremely low–income renter households: 0 to 29.9 percent of AMI Very low–income renter households: 30 to 49.9 percent of AMI Low-income renter households: 50 to 79.9 percent of AMI Middle-income renter households: 80 to 119.9 percent of AMI High-income renter households: 120 percent or more of AMI
Lending Activity
The data on lending activity was generated via the Home Mortgage Disclosure Act (HMDA), which
requires most lending institutions to report mortgage loan applications, including the application
outcome, information about the loan and applicant, property location, structure type, lien status, and if
the loan had a high interest rate. The Federal Financial Institutions Examination Council collects the
data to determine whether financial institutions are meeting a community’s housing credit needs, to
target community development funds to attract private investment, and to identify possible
discriminatory lending patterns. HMDA data are not a good proxy for the general housing market in
areas where cash sales make up a significant share of the home sales.
HMDA requires financial institutions with assets totaling at least $44 million as of 2015 to report.
Because not all institutions are required to file under HMDA, mortgage lending coverage for a
neighborhood may be incomplete. We accessed tract-level HMDA data from 2005 to 2014 through the
Consumer Protection Financial Bureau open data download portal.68 To identify tracts within Denver,
we used a tract-level crosswalk generated from the Missouri Census Data Center Geocorr Tool.

A P P E N D I X D 1 0 5
Policy Recommendations
Urban Institute researchers traveled to Denver, Colorado, in February 2017 to meet with stakeholders
and community members and share findings from our empirical analysis. Policy recommendations were
identified and workshopped, and the researchers used these insights to formulate the final implications
section that appears in the report.
Stakeholder Meetings
On February 3, 2017, we shared insights from our empirical analysis with city government officials.
These meetings were used to brainstorm policy solutions and sharpen our empirical analyses.
Stakeholder Focus Group
On February 3, 2017, the Urban Institute and JPMorgan Chase hosted a focus group for stakeholders to
respond to empirical findings and brainstorm policy solutions for Denver’s LMI populations. Housing
developers, nonprofit affordable housing stakeholders, and philanthropic leaders were present.
Spotlight on Globeville
For our Globeville case study, we spent time in the neighborhood meeting with organizations working
with residents on issues related to affordable housing and development. These organizations include
Focus Points, Front Range Economic Strategy Center, Habitat for Humanity, the United Way Denver,
and Zeppelin Development. We conducted interviews and site observations in Globeville on February
2, 2017.

1 0 6 N O T E S
Notes 1. In 2015, the median income in the previous 12 months among households in Denver County was $58,003. See
Table S1903 for Denver County from the American Community Survey (ACS): “Median Income in the Past 12
Months (in 2014 Inflation-Adjusted Dollars),” US Census Bureau, American FactFinder, accessed May 2, 2017,
http://factfinder.census.gov/faces/tableservices/jsf/pages/productview.xhtml?pid=ACS_14_1YR_S1903&prod
Type=table.
2. “Auraria Neighborhood History,” Denver Public Library, accessed May 2, 2017,
https://history.denverlibrary.org/auraria-neighborhood.
3. Ibid. See also “History of Denver,” Wikipedia, last updated April 5, 2017,
https://en.wikipedia.org/wiki/History_of_Denver.
4. “Curtis Park: Denver’s Oldest Neighborhood,” Denver Public Library, accessed May 2, 2017,
https://history.denverlibrary.org/curtis-park-denvers-oldest-neighborhood-upgrade; “Five Points-Whittier
Neighborhood History,” Denver Public Library, accessed May 2, 2017, https://history.denverlibrary.org/five-
points-whittier-neighborhood-history.
5. Ibid.
6. “Barnum Neighborhood History,” Denver Public Library, accessed May 2, 2017,
https://history.denverlibrary.org/barnum-neighborhood-history.
7. “Total Population: 2015 American Community Survey 1-Year Estimates,” US Census Bureau, American
FactFinder, accessed May 11, 2017,
https://factfinder.census.gov/faces/tableservices/jsf/pages/productview.xhtml?pid=ACS_15_1YR_B01003&p
rodType=table.
8. Emilie Rusch, “First Affordable Housing Project Funded by Denver Revolving Loan Fund Opens in Northfield,”
Denver Post, November 4, 2016, http://www.denverpost.com/2016/11/04/affordable-housing-project-
northfield-stapleton/.
9. “Total Population: 2015 American Community Survey 1-Year Estimates,” US Census Bureau, American
FactFinder, accessed May 11, 2017,
https://factfinder.census.gov/faces/tableservices/jsf/pages/productview.xhtml?pid=ACS_15_1YR_B01003&p
rodType=table.
10. See Claire Martin and Steve Raabe, “$10M Revolving Loan Fund Launched to Boost Denver Affordable
Housing,” Denver Post, February 6, 2015, http://www.denverpost.com/2015/02/06/10m-revolving-loan-fund-
launched-to-boost-denver-affordable-housing/.
11. “Dedicated Affordable Housing Fund,” Denver Office of Economic Development, accessed May 2, 2017,
https://www.denvergov.org/content/denvergov/en/denver-office-of-economic-development/housing-
neighborhoods/DenversPermanentFundforHousing.html.
12. “Publication 530–Main Content,” Internal Revenue Service, accessed May 2, 2017,
https://www.irs.gov/publications/p530/ar02.html#en_US_2016_publink100011905.
13. For more information about the new initiative, see Jon Murray, “Denver Mayor Taps Former Philadelphia
Housing Leader to Coordinate Affordability, Homelessness Policy,” Denver Post, January 9, 2017,
http://www.denverpost.com/2017/01/09/erik-solivan-named-denver-housing-homeless-leader/.
14. “Total Population: 2015 American Community Survey 1-Year Estimates,” US Census Bureau, American Fact
Finder, accessed May 11, 2017,

N O T E S 1 0 7
https://factfinder.census.gov/faces/tableservices/jsf/pages/productview.xhtml?pid=ACS_15_1YR_B01003&p
rodType=table.
15. “LoDo–Denver’s Lower Downtown Success Story,” Denver Public Library, accessed May 2, 2017,
https://history.denverlibrary.org/lodo-denvers-lower-downtown-success-story.
16. For information about changes in Overland Park, see Joe Vaccarelli, “Overland Park Residents Optimistic
about Future of Denver Neighborhood,” Denver Post, February 3, 2015,
http://www.denverpost.com/2015/02/03/overland-park-residents-optimistic-about-future-of-denver-
neighborhood/.
17. For the year that housing structures were built in Denver County, see “Selected Housing Characteristics: 2015
American Community Survey 1-Year Estimates,” US Census Bureau, American FactFinder, accessed May 2,
2017,
https://factfinder.census.gov/faces/tableservices/jsf/pages/productview.xhtml?pid=ACS_15_1YR_DP04&pro
dType=table.
18. The Neighborhood Change Database (NCDB), which reconciles neighborhoods’ changing boundaries over
time, is used in this section. Different weighting strategies used by the NCDB versus the authors may lead to
some discrepancies between sections. Because of NCDB data limitations, a slightly different threshold was
used to determine which residents were cost burdened in this section. See the methodology and sources
section for more.
19. The Kirwan Institute’s Opportunity Index and its methodology can be found in the appendix of Reece and
coauthors (n.d.).
20. The entropy index used in this study measures how much a neighborhood is more or less integrated with
respect to income than other Denver neighborhoods. See the methodologies section for additional details on
how this index is calculated.
21. For more information about the origin of the light rail system, see Colin Woodard, “The Train That Saved
Denver,” Politico, May 19, 2016, http://www.politico.com/magazine/story/2016/05/what-works-denver-rail-
system-growth-213905.
22. “Mayor Hancock Names First Executive Director of New Office of HOPE,” press release, January 9, 2017,
https://www.denvergov.org/content/denvergov/en/mayors-office/newsroom/2017/mayor-hancock-names-
first-executive-director-of-new-office-of-ho.html.
23. “Dedicated Affordable Housing Fund,” Denver Office of Economic Development, accessed May 2, 2017,
https://www.denvergov.org/content/denvergov/en/denver-office-of-economic-development/housing-
neighborhoods/DenversPermanentFundforHousing.html.
24. “2017 Housing Investment Term Sheets,” Denver Office of Economic Development, accessed May 2, 2017,
https://www.denvergov.org/content/dam/denvergov/Portals/690/Housing/1%20Affordable%20Housing%2
0Financing%20Products%20-%202017.pdf.
25. For information on the Neighborhood Development Collaborative, see Neighborhood Development
Collaborative (2013).
26. Urban calculations of in-migration from out of state into the Denver-area Public Use Microdata Areas, using
2015 Public Use Microdata Sample microdata.
27. Jon Murray, “Denver Grows by Another 18,582 People as City’s Boom Accelerates,” Denver Post, March 24,
2016, http://www.denverpost.com/2016/03/24/denver-grows-by-another-18582-people-as-citys-boom-
accelerates/.
28. Jonathan McCarthy and Richard Peach, “Differences in Rent Inflation by Cost of Housing,” Liberty Street
Economics (blog), Federal Reserve Bank of New York, November 4, 2015,

1 0 8 N O T E S
http://libertystreeteconomics.newyorkfed.org/2015/11/differences-in-rent-inflation-by-cost-of-
housing.html#.Vju36tKrS00.
29. Christi Smith, “Denver TOD Fund Expands to Regional $24 Million Affordable Housing Resource,” Urban Land
Conservancy, December 17, 2014, https://www.urbanlandc.org/announcements/denver-tod-fund-expands/.
30. Emile Rusch, “Cities Step Up as Affordable Housing Evaporates along Front Range,” Denver Post, February 12,
2016, http://www.denverpost.com/2016/02/12/cities-step-up-as-affordable-housing-evaporates-along-
front-range/.
31. Jon Murray, “Denver Council Approves Creation of City’s First Affordable-Housing Fund,” Denver Post,
September 19, 2016, http://www.denverpost.com/2016/09/19/denver-affordable-housing-fund/.
32. Jon Murray, “Denver Mayor Taps Former Philadelphia Housing Leader to Coordinate Affordability,
Homelessness Policy,” Denver Post, January 9, 2017, http://www.denverpost.com/2017/01/09/erik-solivan-
named-denver-housing-homeless-leader/.
33. Taras Grescoe, “How Denver Is Becoming the Most Advanced Transit City in the West,” CityLab, June 24,
2014, https://www.citylab.com/transportation/2014/06/how-denver-is-becoming-the-most-advanced-
transit-city-in-the-west/373222/.
34. Josh Cohen, “Trump Tax Promise Is Already Affecting Affordable Housing,” Next City, January 26, 2017,
https://nextcity.org/daily/entry/trump-tax-promise-hurt-affordable-housing-developers.
35. Vincent Carroll, “Making the Most of Denver’s Affordable Housing Fund,” Denver Post, December 3, 2016,
http://www.denverpost.com/2016/12/03/making-the-most-of-denvers-affordable-housing-fund/.
36. “Chicago Low-Income Housing Trust Fund,” City of Chicago, accessed May 4, 2017,
https://www.cityofchicago.org/city/en/depts/dcd/supp_info/chicago_low-incomehousingtrustfund0.html.
37. Matt Kiszka, “Construction Defect Laws and Issues,” memorandum to interested persons, April 17, 2015,
https://www.colorado.gov/pacific/sites/default/files/Interested%20Persons%20Memo%20on%20Constructi
on%20Defects%20Issues33115115550_1.pdf.
38. Ibid.
39. Jonathan McCarthy and Richard Peach, “Differences in Rent Inflation by Cost of Housing,” Liberty Street
Economics (blog), Federal Reserve Bank of New York, December 9, 2015,
http://libertystreeteconomics.newyorkfed.org/2015/11/differences-in-rent-inflation-by-cost-of-
housing.html#.Vju36tKrS00.
40. Christopher Dean, “Denver Metro Rents Decrease Following Completion of Nearly 10,000 New Apartments,”
Apartment Association Metro Denver, January 18, 2017,
https://www.aamdhq.org/index.php?src=news&submenu=news&srctype=detail&category=Industry%20New
s&refno=87.
41. “Colorado’s TABOR,” The Bell Policy Center, accessed May 4, 2017,
http://www.bellpolicy.org/basic/colorados-tabor.
42. “Dedicated Affordable Housing Fund,” Denver Office of Economic Development, accessed May 4, 2017,
https://www.denvergov.org/content/denvergov/en/denver-office-of-economic-development/housing-
neighborhoods/DenversPermanentFundforHousing.html.
43. The Telluride decision: Town of Telluride v. Thirty-Four Venture, 3 P.3d 30 (2000),
http://law.justia.com/cases/colorado/supreme-court/2000/98sc547-0.html.
44. Sophie Quinton, “Why Marijuana Business Still Can’t Get Bank Accounts,” The Pew Chartitable Trusts, March
22, 2016, http://www.pewtrusts.org/en/research-and-analysis/blogs/stateline/2016/03/22/why-marijuana-
businesses-still-cant-get-bank-accounts.

N O T E S 1 0 9
45. “Auction Bids and Results,” Denver Office of the Clerk and Recorder, accessed May 4, 2017,
https://www.denvergov.org/content/denvergov/en/denver-office-of-the-clerk-and-
recorder/foreclosures/auction-information.html.
46. “Accessory Dwelling Units (ADUs),” US Department of Housing and Urban Development, Office of Policy
Development and Research, accessed May 4, 2017, https://www.huduser.gov/portal/casestudies/study-
09082016.html.
47. Rose Architectural Fellowship, “Field Notes: Piloting Accessory Dwelling Units for West Denver’s Missing
Middle,” Enterprise Community Partners, July 28, 2016,
http://www.enterprisecommunity.org/blog/2016/07/field-notes-piloting-accessory-dwelling-units-west-
denvers-missing-middle.
48. “Project Guide for Detached Dwelling Units,” Denver Development Services, accessed May 4, 2017,
https://www.denvergov.org/content/denvergov/en/denver-development-services/home-projects/building-
expanding-a-home/detached-dwelling-carriage-house.html.
49. “Accessory Dwelling Units (ADUs),” US Department of Housing and Urban Development, Office of Policy
Development and Research, accessed May 4, 2017, https://www.huduser.gov/portal/casestudies/study-
09082016.html.
50. “Community Land Trusts (CLTs),” Democracy Collaborative, Community-wealth.org, accessed May 4, 2017,
http://community-wealth.org/strategies/panel/clts/index.html.
51. “CCLT Properties,” Colorado Community Land Trust,” accessed May 4, 2017, https://coloradoclt.org/cclt-
properties/.
52. Eric Peterson, “Community Land Trusts: Permanently Affordable Housing,” Confluence-Denver, February 22,
2017, http://www.confluence-denver.com/features/community-land-trusts-022217.aspx.
53. “Building and Land Development Fees,” Denver Development Services, accessed May 4, 2017,
https://www.denvergov.org/content/denvergov/en/denver-development-services/help-me-find-/fees.html.
54. “Impact Investing,” The Denver Foundation, accessed May 4, 2017,
http://www.denverfoundation.org/Community/Impact-Investing.
55. Sarah Borchersen-Keto, “Minding the Gap in Affordable Housing,” REIT, November/December 2016,
https://www.reit.com/news/reit-magazine/november-december-2016/minding-gap-affordable-housing.
56. “Citywide Racial Equity Goals and Strategies,” Portland Office of Equity and Human Rights, accessed May 4,
2017, https://www.portlandoregon.gov/oehr/68111; and “Equity and Social Justice Strategic Plan,” King
County, last updated September 13, 2016, http://kingcounty.gov/elected/executive/equity-social-
justice/strategic-plan.aspx.
57. Communities of Opportunity, “Our Focus,” King County, last updated November 21, 2016,
http://www.kingcounty.gov/elected/executive/health-human-services-transformation/coo/our-focus.aspx.
58. “Investing in Denver’s Globeville, Elyria, and Swansea Neighborhoods,” Mile High United Way, accessed May
4, 2017, http://www.unitedwaydenver.org/news/investing-denver%E2%80%99s-globeville-elyria-and-
swansea-neighborhood.
59. Danika Worthington, “New Construction Training Program Launched to Meet Growing Need,” Denver Post,
July 20, 2016, http://www.denverpost.com/2016/07/20/new-construction-training-program-launched-to-
meet-growing-need/.
60. Erica Meltzer, “When the National Western is Rebuilt, Denver Apprentices Should Be on the Job, Council
Members Say,” Denverite, January 27, 2017, https://www.denverite.com/national-western-targeted-hire-
construction-jobs-denver-28127/.

1 1 0 N O T E S
61. Moore Community House in Biloxi, Mississippi, offers child care in conjunction with their construction training
program through the “Women in Construction” program. See Jeff Clark, “$3.5M Grant Will Help Moore
Community House Build New Careers for Women,” Sun Herald, June 18, 2016,
http://www.sunherald.com/latest-news/article84474307.html.
62. “Multifamily Assistance,” Chicago Planning and Development, accessed May 4, 2017,
https://www.cityofchicago.org/city/en/depts/dcd/supp_info/multi-family_assistance.html.
63. For Boulder’s regional housing plan, see BCRHP (2017).
64. “Housing,” Metro Mayors Caucus, accessed May 4, 2017, http://www.metromayors.org/index.aspx?NID=97.
65. “Opportunity Communities,” Ohio State University, Kirwan Institute for the Study of Race and Ethnicity,
accessed March 15, 2017,
http://kirwaninstitute.osu.edu/researchandstrategicinitiatives/#opportunitycommunities.
66. “Income Limits,” US Department of Housing and Urban Development, Office of Policy Development and
Research, last updated March 28, 2016, https://www.huduser.gov/portal/datasets/il.html.
67. See pages 3 and 4 in Carol J. Galante and Sandra B. Henriquez, “Transmittal of Fiscal Year (FY) 2014 Income
Limits for the Public Housing and Section 8 Programs,” letter to directors, December 18, 2013,
http://www.huduser.gov/portal/datasets/il/il14/HUD_sec8_14.pdf.
68. “The Home Mortgage Disclosure Act,” Consumer Financial Protection Bureau, accessed March 15, 2017,
https://www.consumerfinance.gov/data-research/hmda/.

R E F E R E N C E S 1 1 1
References BCRHP (Boulder County Regional Housing Partnership). 2017. Priorities and Strategies for Ensuring a Diverse Housing
Inventory. Boulder, CO: BCRHP.
Bureau of Consumer Financial Protection. 2015. “Home Mortgage Disclosure (Regulation C), Final Rule.” Federal
Register 80 (208): 66128–340.
Chetty, Raj, and Nathaniel Hendren. 2015. The Impacts of Neighborhoods on Intergenerational Mobility: Childhood
Exposure Effects and County-Level Estimates. Cambridge, MA: Harvard University and National Bureau of
Economic Research.
Chizeck, Seth. 2017. “Gentrification and Changes in the Stock of Low-Cost Rental Housing in Philadelphia, 2000 to
2014.” Cascade Focus (January): 1–14.
City and Council of Denver. 2016. “FAQ Public Comments and Questions.” Materials distributed at affordable
housing public meeting, Denver, CO, April 26.
City of Denver. 2000. Denver Comprehensive Plan 2000: A Vision for Denver and Its People. City of Denver.
———. 2014. Housing Denver: A Five-Year Plan. City of Denver.
———. 2016. Globeville Neighborhood Plan. City of Denver.
Cunningham, Mary, Mike Pergamit, Sarah Gillespie, Devlin Hanson, and Shiva Kooragayala. 2016. Denver Supportive
Housing Social Impact Bond: Evaluation and Research Design. Washington, DC: Urban Institute.
Denver Office of Economic Development. 2015a. 2015 Housing Report. Denver Office of Economic Development.
———. 2015b. Denver Inclusionary Housing Ordinance: 2015 Interim Report. Denver Office of Economic Development.
———. 2016. Gentrification Study: Mitigating Involuntary Displacement. Denver Office of Economic Development.
DRSCI (Denver Regional Sustainable Communities Initiative). n.d. “Sustainable Communities Regional Principles.”
Denver: DRSCI.
Enterprise (Enterprise Community Partners). n.d. “Denver Regional Transit-Oriented Development (TOD) Fund.”
Washington, DC: Enterprise.
Erickson, Kristen. 2011. “Protecting Low-Income Residents during Tax Increment Financing Redevelopment.”
Journal of Law and Policy 36:203–32.
Forest, Benjamin. 2005. “Measures of Segregation and Isolation.” Hanover, NH: Dartmouth University.
FRESC (Front Range Economic Strategy Center). 2016. “2016 Community Survey.” Denver: FRESC.
Galster, George, Anna Santiagoa, Lisa Stack, and Jackie Cutsinger. 2016. “Neighborhood Effects on Secondary
School Performance of Latino and African American Youth: Evidence from a Natural Experiment in Denver.”
Journal of Urban Economics 93 (May): 30–48.
Hatch, Megan E. 2017. “Statutory Protection for Renters: Classification of State Landlord-Tenant Policy
Approaches.” Housing Policy Debate 27 (1): 98–119.
Jakabovics, Andrew, Lynn M. Ross, Molly Simpson, and Michael Spotts. 2014. Bending the Cost Curve: Solutions to
Expand the Supply of Affordable Rentals. Washington, DC: Urban Land Institute.
Lubell, Jeffrey. 2016. “Preserving and Expanding Affordability in Neighborhoods Experiencing Rising Rents and
Property Values.” Cityscape: A Journal of Policy Development and Research 18 (3): 131–50.
Mile High Connects. 2016. 2016 Annual Report. Denver: Mile High Connects.

1 1 2 R E F E R E N C E S
MDHI (Metro Denver Homeless Initiative). 2016. “2016 Point-in-Time Report: Seven-County Denver Metro
Region.” Denver: MDHI.
Neighborhood Development Collaborative. 2013. “2013 Economic Impact Update.” Denver: Neighborhood
Development Collaborative.
Ours to Own Denver. n.d. “Ours to Own Denver.” Bethesda, MD: Calvert Foundation.
Peterson, Eric. 2016. “Overcoming Barriers to Affordable Housing in Colorado: Creative Solutions for Developers,
Public Officials, and Housing Advocates.” Denver: Urban Land Institute Colorado.
Rosenthal, Stuart S. 2014. “Are Private Markets and Filtering a Viable Source of Low-Income Housing? Estimates
from a ‘Repeat Income’ Model.” American Economic Review 104 (2): 687–706.
Sharkey, Patrick, and Bryan Graham. 2013. “Mobility and the Metropolis: How Communities Factor into Economic
Mobility.” Washington, DC: Pew Charitable Trusts.
The Bell Policy Center. 2015. “The Road to 2016.” Denver: The Bell Policy Center.
ULC (Urban Land Conservancy). n.d. “Preserving Real Estate to Build Stronger Communities: Three-Year Strategic
Framework.” Denver: ULC.
———. 2017. “Scope of Work and Budget for GLobeville, Elyria, Swansea (GES) Community Land Trust Feasibility
Analysis and Business Plan.” Denver: ULC.
USICH (US Interagency Council on Homelessness). 2015. Opening Doors: Federal Strategic Plan to Prevent and End
Homelessness. Washington, DC: USICH.
Wiener, Robert, and Darryl Rutherford. 2008. “Developing a Regional Affordable Housing Strategy: A Look at
California’s Housing Challenges and Ingredients Needed for a Successful Regional Strategy.” Davis: University
of California, Davis, Center for Regional Change.
Williams, Stockton. 2015. Preserving Multifamily Workforce and Affordable Housing: New Approaches for Investing in a
Vital National Asset. Washington, DC: Urban Land Institute.

A B O U T T H E A U T H O R S 1 1 3
About the Authors Diana Elliott is a senior research associate in the Center on Labor, Human Services, and Population at
the Urban Institute, where she studies families’ financial security, economic mobility, asset building, and
debt.
Tanaya Srini is a research assistant in the Metropolitan Housing and Communities Policy Center at the
Urban Institute. She works on place-based research projects focusing on several domestic and
international issues, including affordable housing preservation, inclusive economic development, and
resilience planning. Since joining Urban, she has been involved with projects for the US Department of
Housing and Urban Development, US Department of Education, and Habitat for Humanity
International.
Carl Hedman is a research associate in the Metropolitan Housing and Communities Policy Center. His
work focuses on policy issues surrounding economic and racial residential segregation, neighborhood
change, early childhood education, financial services, and housing affordability. He has worked on
several projects, including the Neighborhood Change Database, Mapping America’s Futures, and Down
Payment Assistance: An Assessment of the LIFT Program.
Shiva Kooragayala is a research associate in the Metropolitan Housing and Communities Policy Center.
His research interests include community and economic development, education policy, and the spatial
dimensions of inequality and opportunity. At Urban, Kooragayala offers research support to the Denver
Social Impact Bond Initiative, provides technical assistance to the Feeding America’s Collaborating for
Clients Initiative, and works on the local evaluation and data team for the DC Promise Neighborhood
Initiative.
Cary Lou is a research associate in the Center on Labor, Human Services, and Population. His work
focuses on quantitative analysis of survey data on such topics as immigration, income instability, and
affordable housing. In addition, he has contributed to projects on the federal budget and state
Temporary Assistance for Needy Families policies. Before joining Urban, Lou worked on state higher
education and workforce issues at the Georgetown University Center on Education and the Workforce.

S T A T E M E N T O F I N D E P E N D E N C E
The Urban Institute strives to meet the highest standards of integrity and quality in its research and analyses and in
the evidence-based policy recommendations offered by its researchers and experts. We believe that operating
consistent with the values of independence, rigor, and transparency is essential to maintaining those standards. As
an organization, the Urban Institute does not take positions on issues, but it does empower and support its experts
in sharing their own evidence-based views and policy recommendations that have been shaped by scholarship.
Funders do not determine our research findings or the insights and recommendations of our experts. Urban
scholars and experts are expected to be objective and follow the evidence wherever it may lead.
2100 M Street NW
Washington, DC 20037
www.urban.org