denver gold presentation 2012
TRANSCRIPT

www.richmont-mines.com Copyright 2012 by Richmont Mines TSX - NYSE MKT: RIC 1
Denver Gold
September 2012
www.richmont-mines.com
TSX – NYSE MKT: RIC
RICHMONT MINES INC.
www.richmont-mines.com Copyright 2012 by Richmont Mines TSX - NYSE MKT: RIC 2
SAFE HARBOR STATEMENT & CAUTIONARY NOTE TO
U.S. INVESTORS CONCERNING RESOURCE ESTIMATES
This presentation contains forward-looking statements that include risks and uncertainties. The factors that could cause actual results to differ materially from those indicated in such forward-looking statements include changes in the prevailing price of gold, the Canadian-U.S. exchange rate, grade of ore mined and unforeseen difficulties in mining operations that could affect revenue and production costs. Other factors such as uncertainties regarding government regulations could also affect the results. Other risks may be detailed from time to time in Richmont Mines Inc.’s periodic reports and annual notice.
The resource estimates in this presentation were prepared in accordance with Regulation 43-101 adopted by the Canadian Securities Administrators. The requirements of Regulation 43-101 differ significantly from the requirements of the United States Securities and Exchange Commission (the “SEC”). In this presentation, we use the terms “Measured”, “Indicated” and “Inferred” Resources. Although these terms are recognized and required in Canada, the SEC does not recognize them. The SEC permits U.S. mining companies, in their filings with the SEC, to disclose only those mineral deposits that constitute “Reserves”. Under United States standards, mineralization may not be classified as a Reserve unless the determination has been made that the mineralization could be economically and legally extracted at the time the determination is made. United States investors should not assume that all or any portion of a Measured or Indicated Resource will ever be converted into “Reserves”. Further, “Inferred Resources” have a great amount of uncertainty as to their existence and whether they can be mined economically or legally, and United States investors should not assume that “Inferred Resources” exist or can be legally or economically mined, or that they will ever be upgraded to a higher category.
U.S. Investors are urged to consider the disclosure in our annual report on Form 20-F, File No. 001-14598, which may be obtained from us or from the SEC’s web site: http://sec.gov/edgar.shtml .

www.richmont-mines.com Copyright 2012 by Richmont Mines TSX - NYSE MKT: RIC 3
RICHMONT MINES OVERVIEW
RIC *: TSX (CAN$) NYSE Amex (US$)
52 week price range $3.30 – $13.39 $3.23 – $13.40
Average 3 month volume 102,500 202,600
Shares Outstanding (6/30/2012) 33,589,563
Mgmt. & Director Ownership ~ 16%
Institutional Ownership ~ 35% - 45%
(in CAN$ millions, except closing price) 6/30/2012 3/31/ 2012 12/31/2011 12/31/2010
Working capital: $56.5 $72.2 $68.7 $43.9
Cash & equivalents: $55.5 $69.3 $63.5 $40.0
Operating cash flow: ($4.5) $6.8 $38.8 $18.3
Closing price TSX: $4.73 $7.77 $10.94 $5.11
Market capitalization: $158 $260 $362 $160
RIC has produced over 1.2 million ounces of gold from its operations in Quebec, Ontario and Newfoundland since 1991.
www.richmont-mines.com Copyright 2012 by Richmont Mines TSX - NYSE MKT: RIC 4
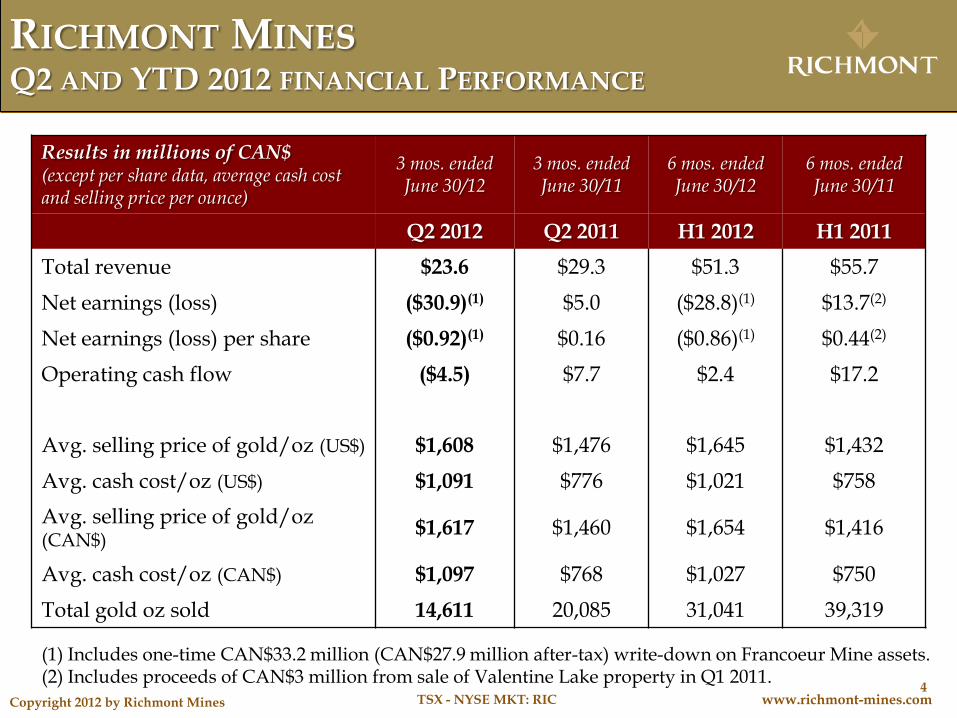
RICHMONT MINES Q2 AND YTD 2012 FINANCIAL PERFORMANCE
Results in millions of CAN$ (except per share data, average cash cost and selling price per ounce)
3 mos. ended June 30/12
3 mos. ended June 30/11
6 mos. ended June 30/12
6 mos. ended June 30/11
Q2 2012 Q2 2011 H1 2012 H1 2011
Total revenue $23.6 $29.3 $51.3 $55.7
Net earnings (loss) ($30.9)(1) $5.0 ($28.8)(1) $13.7(2)
Net earnings (loss) per share ($0.92)(1) $0.16 ($0.86)(1) $0.44(2)
Operating cash flow ($4.5) $7.7 $2.4 $17.2
Avg. selling price of gold/oz (US$) $1,608 $1,476 $1,645 $1,432
Avg. cash cost/oz (US$) $1,091 $776 $1,021 $758
Avg. selling price of gold/oz (CAN$)
$1,617 $1,460 $1,654 $1,416
Avg. cash cost/oz (CAN$) $1,097 $768 $1,027 $750
Total gold oz sold 14,611 20,085 31,041 39,319
(1) Includes one-time CAN$33.2 million (CAN$27.9 million after-tax) write-down on Francoeur Mine assets. (2) Includes proceeds of CAN$3 million from sale of Valentine Lake property in Q1 2011.

www.richmont-mines.com Copyright 2012 by Richmont Mines TSX - NYSE MKT: RIC 5
845 892 911
1,1131,290
1,559
0
10,000
20,000
30,000
2009 2010 2011 2012F 2013FOunces gold sold Cash cost per ounce Selling price
BEAUFOR MINE OVERVIEW
OVERVIEW:
• Located near Val-d’Or, QC
• Production: 500,000+ Au ounces since 1996
• Underground, shaft access
• 5 years no lost-time accident
• Ore processed 50 km away at 100%-owned Camflo Mill
(Ounces) (US$)
Annual Gold Sales
Note: Cash cost includes royalties.
RESERVES + RESOURCES (as of Dec. 31/11) Proven + Probable Reserves: 69,191 Au oz Measured + Indicated Resources: 182,334 Au oz Inferred Resources: 182,185 Au oz
20,854 oz
22,258 oz
Target: 20,000
to 25,000
oz
26,947 oz
Target: 20,000
to 25,000
oz
www.richmont-mines.com Copyright 2012 by Richmont Mines TSX - NYSE MKT: RIC 6
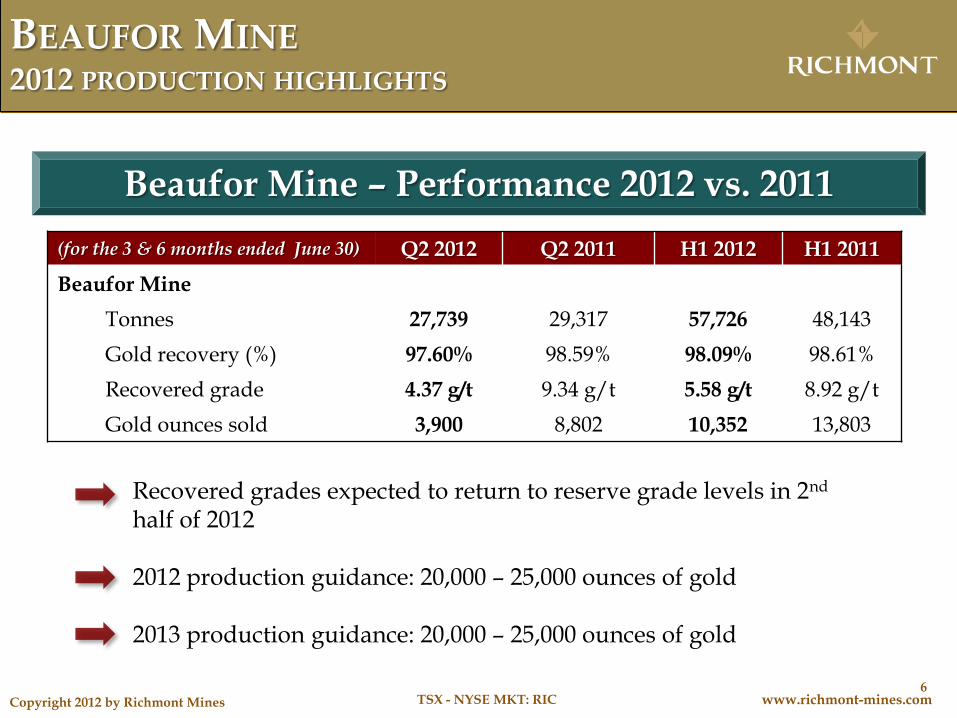
BEAUFOR MINE 2012 PRODUCTION HIGHLIGHTS
(for the 3 & 6 months ended June 30) Q2 2012 Q2 2011 H1 2012 H1 2011
Beaufor Mine
Tonnes 27,739 29,317 57,726 48,143
Gold recovery (%) 97.60% 98.59% 98.09% 98.61%
Recovered grade 4.37 g/t 9.34 g/t 5.58 g/t 8.92 g/t
Gold ounces sold 3,900 8,802 10,352 13,803
Beaufor Mine – Performance 2012 vs. 2011
Recovered grades expected to return to reserve grade levels in 2nd half of 2012
2012 production guidance: 20,000 – 25,000 ounces of gold 2013 production guidance: 20,000 – 25,000 ounces of gold
www.richmont-mines.com Copyright 2012 by Richmont Mines TSX - NYSE MKT: RIC 7
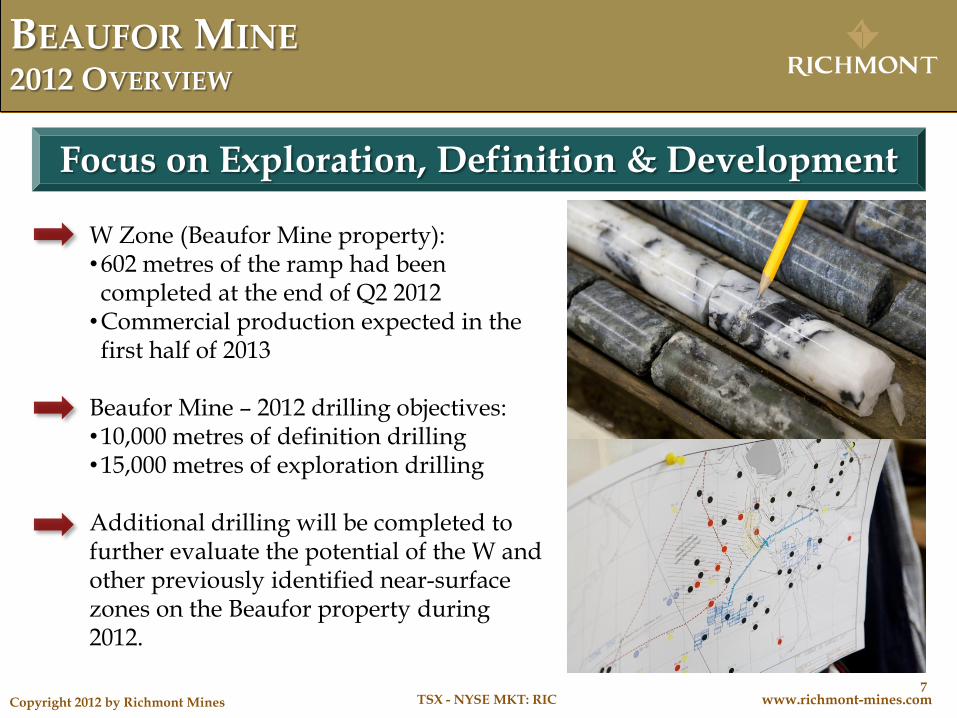
BEAUFOR MINE 2012 OVERVIEW
Focus on Exploration, Definition & Development
W Zone (Beaufor Mine property): •602 metres of the ramp had been completed at the end of Q2 2012
•Commercial production expected in the first half of 2013
Beaufor Mine – 2012 drilling objectives: •10,000 metres of definition drilling •15,000 metres of exploration drilling
Additional drilling will be completed to further evaluate the potential of the W and other previously identified near-surface zones on the Beaufor property during 2012.
www.richmont-mines.com Copyright 2012 by Richmont Mines TSX - NYSE MKT: RIC 8
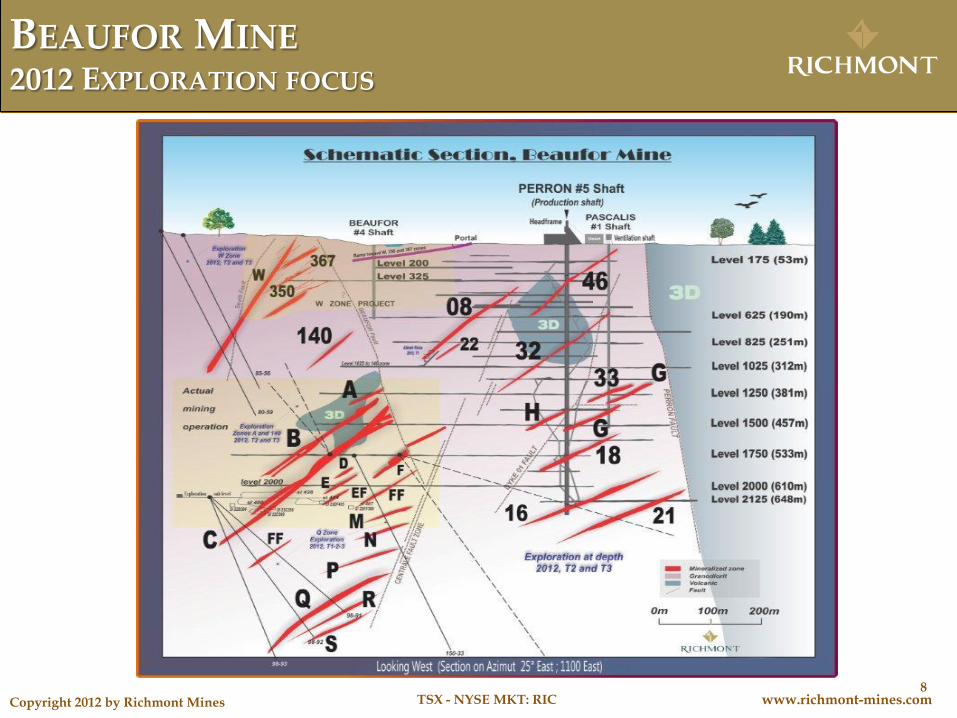
BEAUFOR MINE 2012 EXPLORATION FOCUS

www.richmont-mines.com Copyright 2012 by Richmont Mines TSX - NYSE MKT: RIC 9
841806
758
1,104
1,275
1,549
0
500
1,000
1,500
0
25,000
50,000
75,000
2009 2010 2011 2012F 2013F
Ounces gold sold Cash cost per ounce Selling price
ISLAND GOLD MINE OVERVIEW
Annual Gold Sales
(Ounces) (US$) OVERVIEW:
• Located in NE Ontario
• Production: 225,000+ Au ounces since October 2007
• Underground, ramp access
• 850 tpd CIP mill on-site
• Promising drill results at depth in 2012
• 1+ year no lost time accident
Note: Cash cost includes royalties.
49,196 oz
RESERVES + RESOURCES (as of Dec. 31/11) Proven + Probable Reserves: 171,814 Au oz Measured + Indicated Resources: 153,920 Au oz Inferred Resources: 67,238 Au oz
45,865 oz
38,879 oz
Target: 40,000
to 45,000
oz
Target: 45,000
to 50,000
oz

www.richmont-mines.com Copyright 2012 by Richmont Mines TSX - NYSE MKT: RIC 10
ISLAND GOLD MINE DEEP DRILLING SHOWS POTENTIAL
Four main zones identified (G, C, D, E1E) between -500 metres and -900 metres of vertical depth between the Lochalsh and Island Main zones.
Results from more than 23,000 metres of deep drilling in 2011 have confirmed the potential at depth of this mine. Notable intercepts (all true widths and cut-grades) include:
• 13.39 g/t Au over 4.84 metres (Zone E1E) • 16.42 g/t Au over 4.08 metres (Zone E1E) • 22.08 g/t Au over 6.58 metres (G Zone) • 12.28 g/t Au over 7.24 metres (C Zone) • 27.26 g/t Au over 5.88 metres (C Zone) • 33.36 g/t Au over 2.18 metres (D Zone) • 20.22 g/t Au over 2.05 metres (D Zone) Planning 35,000 metres of deep drilling at Island Gold in 2012, with the goal of establishing resources below the current infrastructure.
Deep Drilling Yields Potential at Depth

www.richmont-mines.com Copyright 2012 by Richmont Mines TSX - NYSE MKT: RIC 11
5.37/2.1
6.12/2.0
22.08/6.6
4.47/2.216.42/4.1
27.26/5.9
STH-13.23/3.7 3.81/3.4
12.28/7.2
3.66/2.0
13.39/4.8
20.22/2.1
11.65/2.6
3.39/2.0
3.49/2.1
7.10/3.8
33.36/2.23.20/2.2
3.44/2.7
6.68/2.1
3.80/5.0
6.00/3.8
5.80/2.0
3.64/5.3
8.68/2.34.78/2.0
14.28/2.0
3.97/2.63.82/2.1 4.95/2.6
3.08/2.0
8.51/9.6
10.51/2.9
6.49/2.44.65/2.0
3.96/2.2X-16.65/2.5
3.46/3.13.21/2.4
7.30/2.6
8.21/3.2
3.71/3.3
3.37/2.0
ISLAND GOLD MINE LONGITUDINAL SECTION – DEEP DRILLING RESULTS
Portal
Level 290
-500m
Crown Pillar
W
Planned drifts
Actual ramp and drifts
Mined out
Proven Reserves
Probable Reserves
Indicated Resources
Inferred Resources
Level 190
Level 340
E
-300m
-700m
100 m
Lochalsh
Island Main
Goudreau
Ext. 1 Ext. 2
-900m
Au g/t, Cut 75g / True
thickness metres
4.47/2.2
Dia
base D
yke
Only intersections with a grade of at least 3 g/t Au
over a minimum true width of 2 m are presented here.
D
G
E1E
C
New results
Previous results
Intersections below 3 g/t Au
Open at depth & laterally

www.richmont-mines.com Copyright 2012 by Richmont Mines TSX - NYSE MKT: RIC 12
ISLAND GOLD MINE 2012 PRODUCTION HIGHLIGHTS
Island Gold Mine – Performance 2012 vs. 2011
(for the 3 & 6 months ended June 30) Q2 2012 Q2 2011 H1 2012 H1 2011
Island Gold Mine
Tonnes 63,488 58,860 121,411 131,240
Gold recovery (%) 96.21% 96.03% 96.09% 96.08%
Recovered grade 5.25 g/t 5.96 g/t 5.30 g/t 6.05 g/t
Gold ounces sold 10,711 11,283 20,689 25,516
2012 production guidance: 40,000 – 45,000 ounces of gold 2013 production guidance: 45,000 – 50,000 ounces of gold
www.richmont-mines.com Copyright 2012 by Richmont Mines TSX - NYSE MKT: RIC 13
FRANCOEUR MINE OVERVIEW
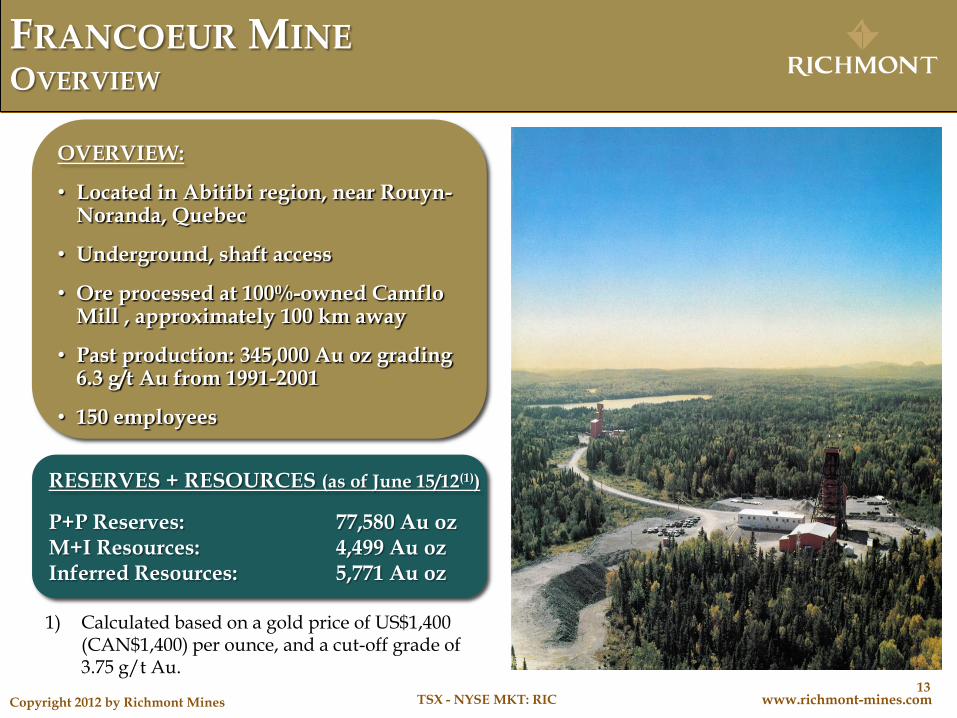
RESERVES + RESOURCES (as of June 15/12(1))
P+P Reserves: 77,580 Au oz M+I Resources: 4,499 Au oz Inferred Resources: 5,771 Au oz
OVERVIEW:
• Located in Abitibi region, near Rouyn-Noranda, Quebec
• Underground, shaft access
• Ore processed at 100%-owned Camflo Mill , approximately 100 km away
• Past production: 345,000 Au oz grading 6.3 g/t Au from 1991-2001
• 150 employees
1) Calculated based on a gold price of US$1,400 (CAN$1,400) per ounce, and a cut-off grade of 3.75 g/t Au.
www.richmont-mines.com Copyright 2012 by Richmont Mines TSX - NYSE MKT: RIC 14
FRANCOEUR MINE 2012 – 2013 FOCUS
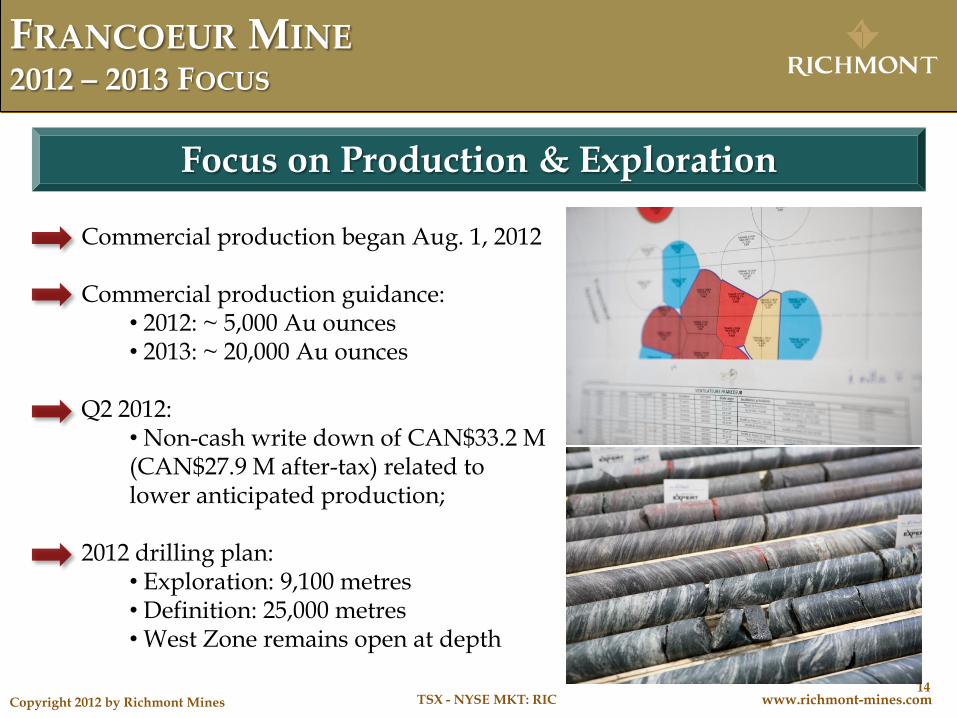
Focus on Production & Exploration
Commercial production began Aug. 1, 2012 Commercial production guidance:
• 2012: ~ 5,000 Au ounces • 2013: ~ 20,000 Au ounces
Q2 2012:
• Non-cash write down of CAN$33.2 M (CAN$27.9 M after-tax) related to lower anticipated production;
2012 drilling plan:
• Exploration: 9,100 metres • Definition: 25,000 metres • West Zone remains open at depth
www.richmont-mines.com Copyright 2012 by Richmont Mines TSX - NYSE MKT: RIC 15
EWSurface
- 500m
-1000m
2 000m
Zone 3Zone 3Zone 3Zone 3Zone 3Zone 3Zone 3Zone 3Zone 3
South ZoneSouth ZoneSouth ZoneSouth ZoneSouth ZoneSouth ZoneSouth ZoneSouth ZoneSouth Zone
North ZoneNorth ZoneNorth ZoneNorth ZoneNorth ZoneNorth ZoneNorth ZoneNorth ZoneNorth Zone
East ZoneEast ZoneEast ZoneEast ZoneEast ZoneEast ZoneEast ZoneEast ZoneEast Zone
Zone 7Zone 7Zone 7Zone 7Zone 7Zone 7Zone 7Zone 7Zone 7
Zone 2Zone 2Zone 2Zone 2Zone 2Zone 2Zone 2Zone 2Zone 2
Zone 1Zone 1Zone 1Zone 1Zone 1Zone 1Zone 1Zone 1Zone 1
Zone 8Zone 8Zone 8Zone 8Zone 8Zone 8Zone 8Zone 8Zone 8
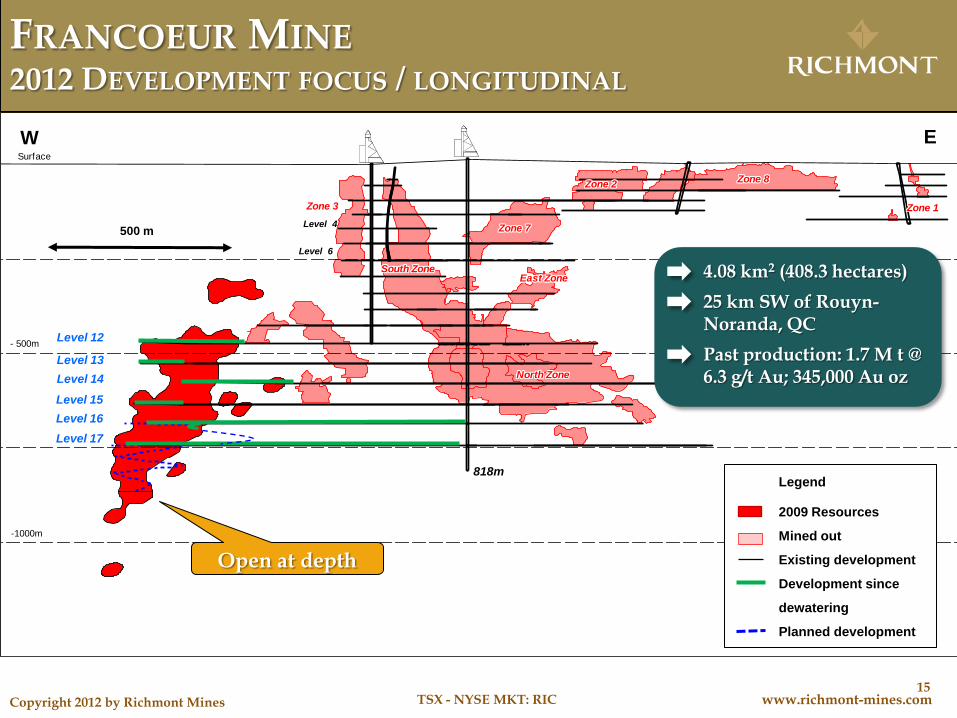
FRANCOEUR MINE 2012 DEVELOPMENT FOCUS / LONGITUDINAL
Level 13
Level 15
Level 16
Level 17
Level 4
Level 6
500 m
Level 14
Level 12
Open at depth
2009 Resources
Mined out
Existing development
Development since
dewatering
Planned development
Legend
4.08 km2 (408.3 hectares)
25 km SW of Rouyn-Noranda, QC
Past production: 1.7 M t @ 6.3 g/t Au; 345,000 Au oz
818m

www.richmont-mines.com Copyright 2012 by Richmont Mines TSX - NYSE MKT: RIC 16
WASAMAC GOLD PROPERTY OVERVIEW
RESERVES + RESOURCES (as of Dec 31/11)
M+I Resources: 556,385 Au oz Inferred Resources: 2,130,532 Au oz
Located in Quebec Abitibi region, 15 km from Rouyn-Noranda
5.91 km2 (591 hectares)
100%-owned
No royalties or back-in rights
Past production (1965-1971): 1,892,448 tonnes at 4.16 g/t Au ; 252,923 onces Au
Exploration drilling programs:
• 2010: 20,000 metres • 2011: 52,000 metres • 2012: ~ 55,000 metres
Wasamac
www.richmont-mines.com Copyright 2012 by Richmont Mines TSX - NYSE MKT: RIC 17
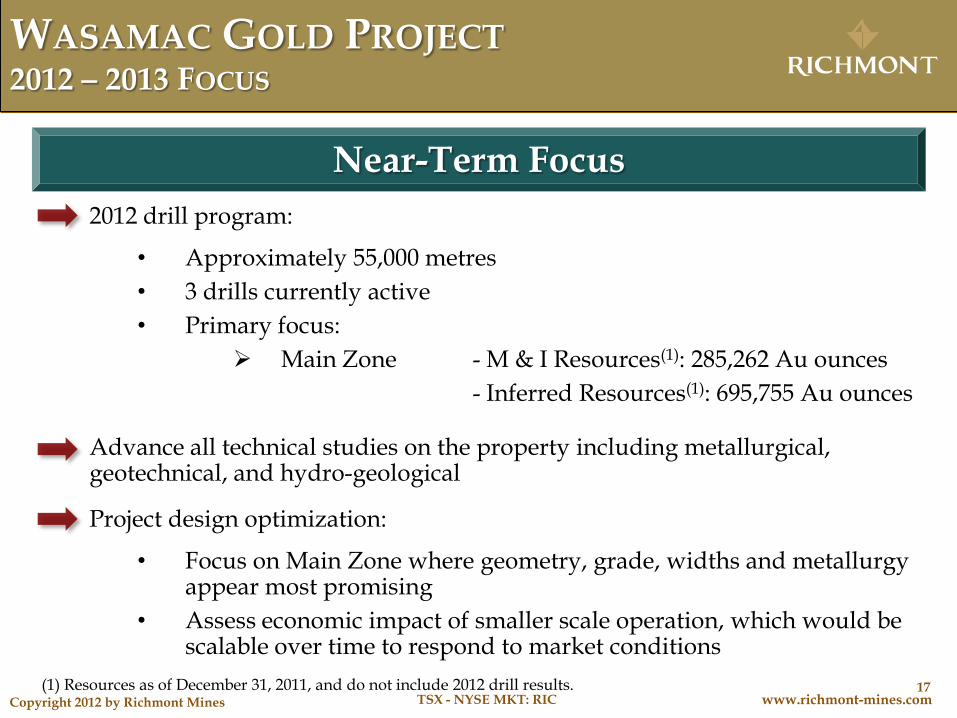
WASAMAC GOLD PROJECT 2012 – 2013 FOCUS
2012 drill program:
• Approximately 55,000 metres
• 3 drills currently active
• Primary focus:
Main Zone - M & I Resources(1): 285,262 Au ounces
- Inferred Resources(1): 695,755 Au ounces
Advance all technical studies on the property including metallurgical, geotechnical, and hydro-geological
Project design optimization:
• Focus on Main Zone where geometry, grade, widths and metallurgy appear most promising
• Assess economic impact of smaller scale operation, which would be scalable over time to respond to market conditions
Near-Term Focus
(1) Resources as of December 31, 2011, and do not include 2012 drill results.

www.richmont-mines.com Copyright 2012 by Richmont Mines TSX - NYSE MKT: RIC 18
800
600
400
800
1000
200
600
1175
1350
400
200
WASAMAC GOLD PROJECT RESOURCES (DECEMBER 2011), CUT-OFF: 1.5 G/T AU
Zone 1
Zone 2
-500 m
-1000 m
3500E
4000E
W E
Zone 3
Mined out / Opening
Drillhole Intersections
Measured & Indicated Resources :
3,182,577T at 2.79 g/t Au; 285,262 oz
Au
Inferred Resources:
3,624,125T at 2.84 g/t Au; 331,006 oz
Au
Main Zone
Measured & Indicated Resources :
239,059T at 2.50 g/t Au; 19,238 oz Au
Inferred Resources:
8,822,590T at 2.62 g/t Au; 743,246 oz Au
Measured & Indicated Resources :
1,526,991T at 2.08 g/t Au; 102,351 oz Au
Inferred Resources:
4,704,746T at 2.15 g/t Au; 324,892 oz Au
Indicated Resources :
40,299T at 1.87 g/t Au; 2,419 oz Au
Inferred Resources:
3,170,004T at 2.49 g/t Au; 253,988 oz Au
Measured & Indicated Resources :
6,762,455T at 2.56 g/t Au; 556,385 oz Au
Inferred Resources:
25,686,159T at 2.58 g/t Au; 2,130,532 oz Au
WASAMAC TOTAL RESOURCES
Zone 1
Zone 2
Zone 3
Inferred Resources :
3,932,289T at 2.89 g/tAu;
364,749 oz Au
Main Zone (Old Mine)
Looking 360°
Wasamac Mine / Main Zone (1965-1971)
Production: 1,892,448 T at 4.16 g/t Au
252,923 onces Au
Measured & Indicated Resources :
1,773,529T at 2.58 g/t Au; 147,115 oz Au
Inferred Resources:
1,432,404T at 2.45 g/t Au; 112,650 oz Au
Crown Pillar
250 metres
www.richmont-mines.com Copyright 2012 by Richmont Mines TSX - NYSE MKT: RIC 19
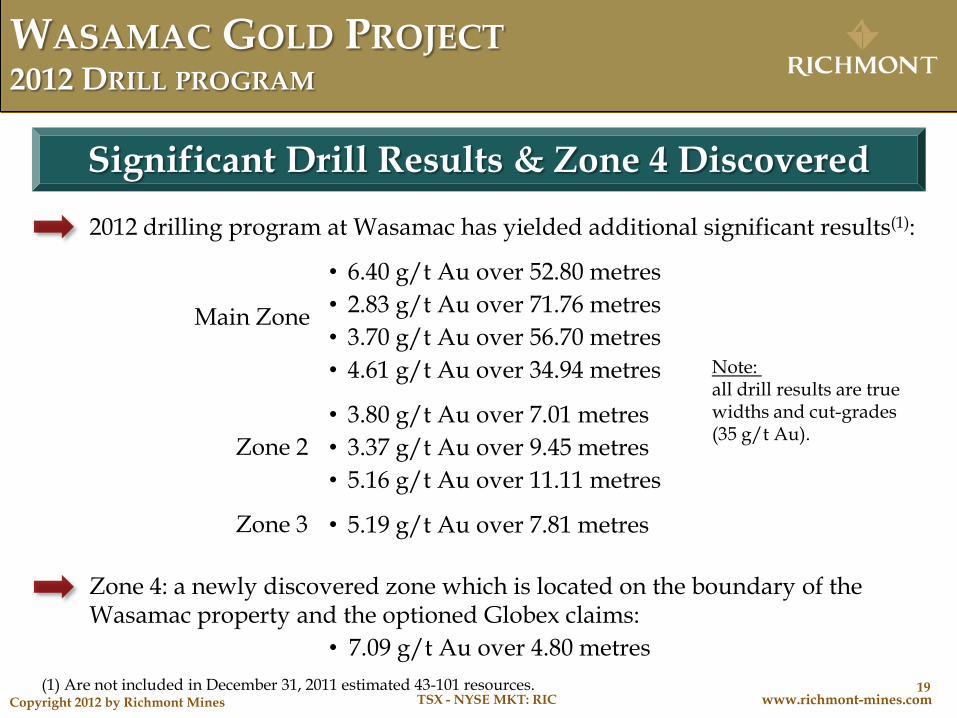
WASAMAC GOLD PROJECT 2012 DRILL PROGRAM
Significant Drill Results & Zone 4 Discovered
2012 drilling program at Wasamac has yielded additional significant results(1):
• 6.40 g/t Au over 52.80 metres
• 2.83 g/t Au over 71.76 metres
• 3.70 g/t Au over 56.70 metres
• 4.61 g/t Au over 34.94 metres
• 3.80 g/t Au over 7.01 metres
• 3.37 g/t Au over 9.45 metres
• 5.16 g/t Au over 11.11 metres
• 5.19 g/t Au over 7.81 metres
Zone 4: a newly discovered zone which is located on the boundary of the Wasamac property and the optioned Globex claims:
• 7.09 g/t Au over 4.80 metres
Main Zone
Zone 2
Zone 3
Note: all drill results are true widths and cut-grades (35 g/t Au).
(1) Are not included in December 31, 2011 estimated 43-101 resources.
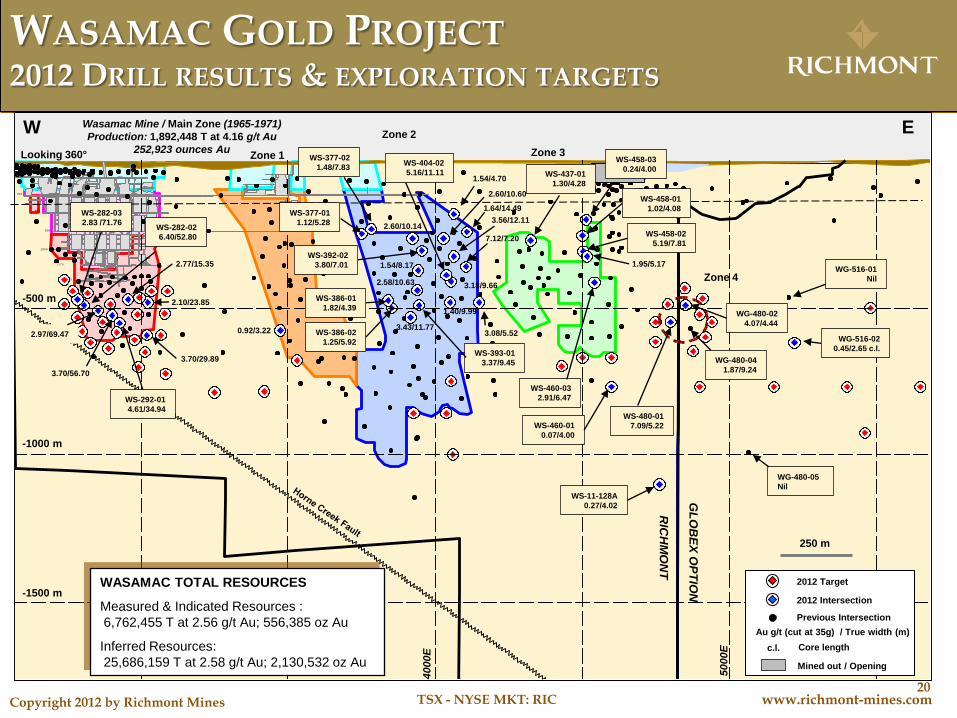
www.richmont-mines.com Copyright 2012 by Richmont Mines TSX - NYSE MKT: RIC 20
800
600
400
800
1000
200
600
1175
1350
400
200
Zone 1
Zone 2
-500 m
-1000 m
4000E
5000E
W E
Zone 3
Mined out / Opening
Previous Intersection
WASAMAC TOTAL RESOURCES
Measured & Indicated Resources :
6,762,455 T at 2.56 g/t Au; 556,385 oz Au
Inferred Resources:
25,686,159 T at 2.58 g/t Au; 2,130,532 oz Au
Looking 360°
Wasamac Mine / Main Zone (1965-1971)
Production: 1,892,448 T at 4.16 g/t Au
252,923 ounces Au
250 m
2012 Intersection
2012 Target
-1500 m
RIC
HM
ON
T
GL
OB
EX
OP
TIO
N
Zone 4
2.97/69.47 0.92/3.22
2.10/23.85
3.70/56.70
1.54/4.70
3.70/29.89
2.60/10.60
3.08/5.52
3.56/12.11
1.95/5.17
1.64/14.49
2.58/10.63 3.18/9.66
2.77/15.35
3.43/11.77
1.40/9.99
2.60/10.14
7.12/7.20
1.54/8.17
WS-282-03
2.83 /71.76
WS-292-01
4.61/34.94
WS-282-02
6.40/52.80
WG-516-01
Nil
WG-480-05
Nil
WG-516-02
0.45/2.65 c.l.
WS-11-128A
0.27/4.02
WS-460-01
0.07/4.00
WG-480-04
1.87/9.24
WS-480-01
7.09/5.22
WS-437-01
1.30/4.28
WS-458-03
0.24/4.00
WS-458-01
1.02/4.08
WS-458-02
5.19/7.81
WS-377-02
1.48/7.83
WS-377-01
1.12/5.28
WS-392-02
3.80/7.01
WS-393-01
3.37/9.45
WS-386-02
1.25/5.92
WS-386-01
1.82/4.39
WS-404-02
5.16/11.11
WS-460-03
2.91/6.47
WG-480-02
4.07/4.44
Au g/t (cut at 35g) / True width (m)
c.l. Core length
WASAMAC GOLD PROJECT 2012 DRILL RESULTS & EXPLORATION TARGETS
www.richmont-mines.com Copyright 2012 by Richmont Mines TSX - NYSE MKT: RIC 21
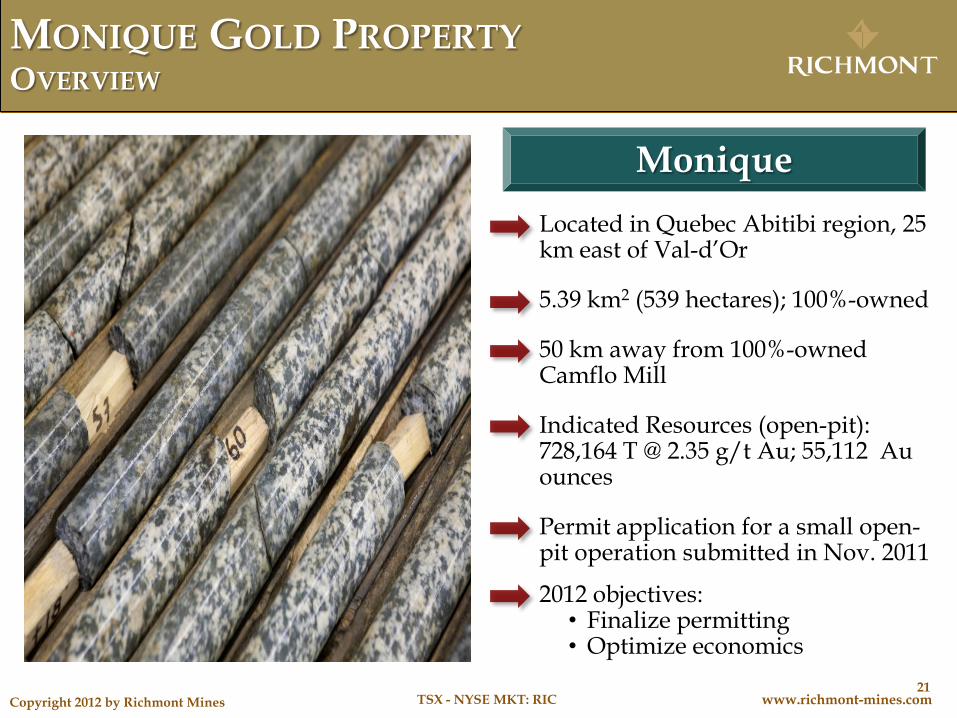
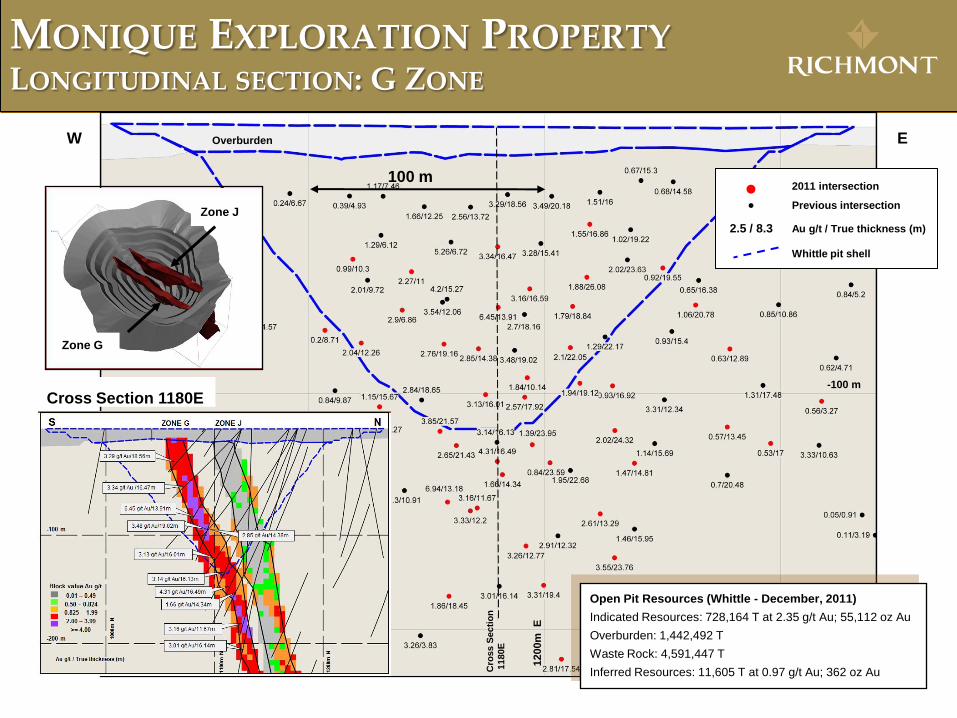
MONIQUE GOLD PROPERTY OVERVIEW
Located in Quebec Abitibi region, 25 km east of Val-d’Or
5.39 km2 (539 hectares); 100%-owned
50 km away from 100%-owned Camflo Mill
Indicated Resources (open-pit): 728,164 T @ 2.35 g/t Au; 55,112 Au ounces
Permit application for a small open-pit operation submitted in Nov. 2011
2012 objectives: • Finalize permitting • Optimize economics
Monique
www.richmont-mines.com Copyright 2012 by Richmont Mines TSX - NYSE MKT: RIC 22
W E
2011 intersection
Previous intersection
Au g/t / True thickness (m) 2.5 / 8.3
Overburden
© 2011 Richmont Mines Inc.
100 m
-100 m
Whittle pit shell
1200m
E
1100m
E
Zone G
Zone J
Open Pit Resources (Whittle - December, 2011)
Indicated Resources: 728,164 T at 2.35 g/t Au; 55,112 oz Au
Overburden: 1,442,492 T
Waste Rock: 4,591,447 T
Inferred Resources: 11,605 T at 0.97 g/t Au; 362 oz Au
Cross Section 1180E
Cro
ss S
ecti
on
1180E
MONIQUE EXPLORATION PROPERTY LONGITUDINAL SECTION: G ZONE

www.richmont-mines.com Copyright 2012 by Richmont Mines TSX - NYSE MKT: RIC 23
CAMFLO MILL QUEBEC, CANADA
0
100
200
300
400
500
2008 2009 2010 2011 2012F
Francoeur Monique Custom milling Beaufor
Tonnes (thousands)
Annual Capacity: 425,000 tonnes
Replacement value of >CAN$35 million;
100%-owned;
No major capex in 2012; 2+ years no lost-time accident;
Excess capacity = ability to capitalize on regional discoveries & opportunities.
www.richmont-mines.com Copyright 2012 by Richmont Mines TSX - NYSE MKT: RIC 24
RICHMONT MINES CORPORATE OBJECTIVES
Produce 250,000 ozs of gold annually;
Build 1,000,000 ozs of gold reserves;
Achieve valuation parity with our peer group;
Grow through organic production and M & A.
Corporate Objectives

www.richmont-mines.com Copyright 2012 by Richmont Mines TSX - NYSE MKT: RIC 25
RICHMONT MINES FOCUS ON GROWTH
Focus on Growth
Wasamac exploration property: • M + I Resources: 556,385 Au ounces • Inferred Resources: 2,130,532 Au ounces
Promising future at Island Gold Mine: • Exploration results at depth
W Zone - Beaufor Mine property: • To be accessed in the near-term
Excellent management team & skilled workforce: • 579 employees at end of Q2 2012 • 20 year operating track record
Extensive drilling program in 2012: • 100,000 + metres
Active M&A growth strategy

www.richmont-mines.com Copyright 2012 by Richmont Mines TSX - NYSE MKT: RIC 26
RICHMONT MINES M&A STRATEGY
Increased corporate M&A deal flow and capability with new executives and Board members;
Focused predominantly on Canada; secondarily on key politically stable jurisdictions;
Preference for producing or near production assets;
Experienced technical team in place for project evaluation, permitting and production;
Sound balance sheet and capital structure.
M&A Strategy