denver public schools: leveraging system transformation to...
TRANSCRIPT

© Education Resource Strategies, Inc., 2014
Draft—do not cite or disseminate
Denver Public Schools:Leveraging System Transformation to
Improve Student ResultsMarch, 2017

© Education Resource Strategies, Inc., 2014
Draft—do not cite or disseminate
© 2017 Education Resource Strategies. All rights reserved.
Education Resource Strategies (ERS)is a non-profit organization
dedicated to transforming how urban school systems organize resources
(people, time, technology, and money) so that every school succeeds for every student.

3
SaintPaul
Chicago
Cincinnati
Atlanta
Philadelphia New York City
SyracuseRochesterProvidence
BaltimorePrince George’s County, MDWashington,
D.C.
Charlotte-Mecklenburg
Duval County
Boston
Georgia DistrictsFulton CountyHall CountyVidalia CityTreutlen CountyMarietta City
Cleveland
Austin
Albuquerque
Michigan
Tennessee
Waterbury, CT
Aldine
Newark
District workState work2015-16 partnersRecent partners
Knox County
Lake County
Indianapolis
Nashville
Georgia
Santa Fe
New Haven, CT
Tulsa
Palm Bach County
Los Angeles
Oakland
Sacramento
California
Buffalo
Over the last 10 years, ERS has worked closely with the nation’s largest school systems to improve resource use

Why school systems?
Every student succeeds
SUCCESSFUL STUDENTS
EFFECTIVE DISTRICTS
Coherent systems that give schools the flexibility, capacity, and support they need
Do your district’s structures and policies maximize the enabling conditions for excellent schools?
EFFECTIVE SCHOOLS
Schools that deliberately manage talent, time, and money around a clear instructional model
Are practices and resource use aligned with high performing strategies at every school?
EFFECTIVE TEACHING
High-quality instruction that is aligned with standards
Are the structures in place to improve instructional quality and alignment?
4

What is the School System 2020 Diagnostic?
Every student succeeds
SUCCESSFUL STUDENTS
EFFECTIVE DISTRICTS
Coherent systems that give schools the flexibility, capacity, and support they need
Do your district’s structures and policies maximize the enabling conditions for excellent schools?
EFFECTIVE SCHOOLS
Schools that deliberately manage talent, time, and money around a clear instructional model
Are practices and resource use aligned with high performing strategies at every school?
EFFECTIVE TEACHING
High-quality instruction that is aligned with standards
Are the structures in place to improve instructional quality and alignment?
District Impact: To help district leaders answer these questions and identify and track changes to System Conditions and Resource Use that lead to improved student achievement
Field Building: To build a data set of where districts are along this spectrum, to highlight best practices and ultimately to demonstrate that creating system conditions that promote the strategic use of resources in districts and schools drives improved student outcomes
5

School System 20/20 identifies key transformational levers across seven areas of district activity
Teaching
Standards and Instruction
LeadershipPartners
Funding School Support
School Design
• Broad, but high level
• Research-based
• Includes qualitative and
quantitative measures
• Benchmarks against best
practice and other districts
6

To date we have conducted School System 20/20 in 16 districts, including 3 districts we’ve identified as best practice case studies:
Addison, NY (2016)Aldine, TX (2014)Baltimore City, MD (2016)Boston, MA (2015)Charlotte, NC (2016)Cleveland, OH (2016)Denver, CO (2016)El Paso, TX (2017)Indianapolis, IN (2015)Lawrence, MA (2014)Memphis, TN (2017)Norwalk, CT (2016)Oakland, CA (2015)Palm Beach County, FL (2015)Tulsa, OK (2015)Spring Branch, TX (2017)
7
“I’ve been inundated with so much information, and this is by far the most strategic, easiest to understand and most useful.” - Dr. Sonja Santelises, Superintendent, Baltimore City Schoolseninundated with so “You were successful in
doing what is the hardest thing, which is making the link between budget and school design…If we had this information as we were developing our strategic plan, we would have had a better strategic operating plan.”-Steven Adamowski, Norwalk Superintendent

Looking at this information helps us to understand:
How does performance growth in DPS compare to other districts in Colorado and nationwide?What actions over the past five years have driven
changes in system conditions, resource use, and student outcomes?How does DPS compare to other leading districts and
research-based best practice?Where should DPS target future investments?What can other district leaders and policy makers
learn from DPS’ experience?8

What is our history with DPS? ERS has partnered with DPS over the past 8 years on a
number of paid engagements ERS is currently engaged with DPS in two areas: Teacher compensation workshops New teacher case studies with DPS-specific supplement
The work we are reviewing today was funded by the Charles and Lynn Schusterman Foundation as a case study
9

DPS’ performance story
10

According to Stanford NCES comparison data, DPS had the second highest growth of any district >25K nationwide between 2009-10 and 2012-13
Denver
Washington DC
Davidson, TNAnaheim, CA
Washington, UTLincoln, NE
Fremont, CA
-1.5
-1
-0.5
0
0.5
1
1.5
0% 10% 20% 30% 40% 50% 60% 70% 80% 90% 100%
Grow
th in
Grad
e Equ
ivalen
t Unit
s, Av
erag
ed A
cross
Gr
ades
, 200
9-20
13
District Percent FRL
Denver Average Grade Equivalent Unit Growth2009-2013, Against Large Districts
Stanford Educational Data Archive, NCES; comparison includes all districts with more than 25,000 students, data only available 2009-2013 11
Averaged across grades and subjects, DPS performance
improved almost an entire grade level, from 1.5 grade levels behind in 09-10 to .5 grade
levels behind in 12-13.

45% 54%
36%
69% 70%
41%
0%
10%
20%
30%
40%
50%
60%
70%
80%
2004 2005 2006 2007 2008 2009 2010 2011 2012 2013 2014 2015 2016
DPS vs. Colorado % Proficient & AdvancedTCAP Reading
DPS Percent ProficientState Percent Proficient (Excluding DPS)
12Source: Colorado Department of Education, Achievement Percentile Rank Report
CMAS PARCC Assessment
…and within Colorado

Proficiency increased across all subgroups
54%
44%
42%
46%
0%
10%
20%
30%
40%
50%
60%
2004 2005 2006 2007 2008 2009 2010 2011 2012 2013 2014
ELA
Perce
nt Pr
oficie
nt
ELA Percent Proficient- all tested grades
All Students FRL ELL Non-White
Source: CDE website-DPS student enrollment & performance data, 2004-2014 13

And across both charter and district-run schools
43%
57%
45%
54%
38%
51%
31%
42%
0%
10%
20%
30%
40%
50%
60%
70%
2004 2005 2006 2007 2008 2009 2010 2011 2012 2013 2014
ELA
Perce
nt Pr
oficie
nt
ELA Percent Proficient by School Type
Charter Traditional Charter - FRL Traditional - FRL
Source: CDE website-DPS student enrollment & performance data, 2004-2014 14

The combination of improvements across charter and district schools with a shift of student into charters increased DPS’ % proficient in ELA from 49% to 54% between 2008 and 2014
5%
87%
8%
% of Performance Improvement by source
15Source: ERS Analysis
Charter school improvement: 8% of students were in charter schools from 08-14; proficiency in those schools improved on average 4 points
District-run school improvement: DPS-run schools gained on average 4% pts proficiency since 2008. In 2008 these schools served 92% of students.
Shift from district-run to charter: From 2008 to 2014, 7% of students moved from district schools to charter schools. In addition to the 4% they would have gained in district schools (in dark blue), the schools they moved into were performing 4% better than the district-run schools, accounting for 5% of the overall improvement.

And despite DPS having a significantly higher need population than the rest of the state…
62% 62%
68%64% 66% 66%
71% 72% 72% 71% 72% 70% 68%
27% 28%31% 31% 31% 32%
35% 37% 38% 38% 39% 38% 39%
0%
10%
20%
30%
40%
50%
60%
70%
80%
2004 2005 2006 2007 2008 2009 2010 2011 2012 2013 2014 2015 2016
% of students eligible for free and reduced lunch
DPS % FRL State % FRL (Excluding DPS)
16Source: Colorado Department of Education, Achievement Percentile Rank Report

..gaps with the state for ELL and FRL students narrowed; and as of 2014 DPS was outperforming the state with white students
0%
20%
40%
60%
80%
100%
2004 2005 2006 2007 2008 2009 2010 2011 2012 2013 2014
ELL
DPS ELL Colorado ELL
Source: CDE website-DPS student enrollment & performance data, 2004-2014 17
0%
20%
40%
60%
80%
100%
2004 2005 2006 2007 2008 2009 2010 2011 2012 2013 2014
x
FRL
DPS FRL Colorado FRL
0%
20%
40%
60%
80%
100%
2004 2005 2006 2007 2008 2009 2010 2011 2012 2013 2014
Non-Minority
Colorado Non-Minority DPS Non-Minority
0%
20%
40%
60%
80%
100%
2004 2005 2006 2007 2008 2009 2010 2011 2012 2013 2014
Minority
Colorado Minority DPS Minority
ELA Percent Proficient

Though we don’t have national comparison data beyond 2013, state data indicates that DPS’ improvement trajectory has continued and even steepened
45% 54%
36%
69% 70%
41%
0%
10%
20%
30%
40%
50%
60%
70%
80%
2004 2005 2006 2007 2008 2009 2010 2011 2012 2013 2014 2015 2016
DPS vs. Colorado Percent Proficient & Advanced TCAP Reading to PARCC ELA
DPS Percent ProficientState Percent Proficient (Excluding DPS)
18Source: Colorado Department of Education, Achievement Percentile Rank Report
CMAS PARCC Assessment
Closed the gap by 2 percentage points
from 09-10 to 12-13
Closed the gap by 12 percentage points
from 12-13 to 15-16

More than might be suggested by the narrowing need gap with the rest of the state
62% 62%
68%64% 66% 66%
71% 72% 72% 71% 72% 70% 68%
27% 28%31% 31% 31% 32%
35% 37% 38% 38% 39% 38% 39%
0%
10%
20%
30%
40%
50%
60%
70%
80%
2004 2005 2006 2007 2008 2009 2010 2011 2012 2013 2014 2015 2016
% of students eligible for free and reduced lunch
DPS % FRL State % FRL (Excluding DPS)
19Source: Colorado Department of Education, Achievement Percentile Rank Report

How did DPS do it?
20

The School System 20/20 framework identifies the key transformations we believe that districts must make to drive significant, sustained improvement
21
System 20/20 Area Key transformations
STANDARDS• Rigorous, information-age standards with effective curricula, instructional
strategies, and assessments to achieve them.
TEACHING• Selective hiring, development, and strategic assignment to schools and
teams. Career path and compensation enable growth and reward contribution.
SCHOOL DESIGN• Schools with restructured teams and schedules: personalized learning and
support that responds to student needs and promotes instructional collaboration.
LEADERSHIP• Clear standards and accountability with the support school leaders need to
succeed.
SCHOOL SUPPORT• A central office that serves as a strategy partner, leveraging data to increase
efficiency and identify best practices.
FUNDING• A central office that serves as a strategy partner, leveraging data to increase
efficiency and identify best practices.
• Partnering with families, community institutions, youth service organizations, and online instructors to serve students’ needs.PARTNERS

For over a decade, DPS has undertaken a broad array of structural changes aimed at many of these key levers
22
System 20/20 Area DPS Actions
STANDARDS• Development of CCRS readiness assessment for schools• Creation of curriculum and instructional support resources
TEACHING• Implementation of LEAP• Teacher leadership program• Incentives to attract teachers to highest-need subjects and schools• Cross-district year-long plan for professional development
SCHOOL DESIGN
• Increased school level flexibility• Focus on whole child
LEADERSHIP• Expanded principal pipeline and development programs• Implement LEAD• Incentives to attract and retain effective principals in high-need schools
SCHOOL SUPPORT
• Data systems• Accountability system• Lower instructional superintendent ratios, especially for turnaround
schools
FUNDING• Shared funding system across charter and district run schools• Incorporation of ELL weights into funding system• Active management of school portfolio across district-run and charter
schools

The result is a measurable improvement in system conditions and practice & resource use
23Source: DPS financial, student, and school data; ERS database.
2015-162009-10
STANDARDS
TEACHING
SCHOOL DESIGN
SYSTEMCONDITIONS
PRACTICE &RESOURCE USE
LEADERSHIP
SCHOOL SUPPORT
FUNDING
PARTNERS
2015-162009-10

These efforts have created the most strategic enabling conditions of any district we’ve studied
24
Denver 2015-16
Charlotte 2015-16
Aldine 2012-13
Lawrence 2013-14
Palm Beach County 2014-15
Boston 2014-15
Denver 2009-10
1 1.5 2 2.5 3
Less Strategic More Strategic
System CondistionsSystem Conditions

Practice & resource use in DPS lags system conditions, but is also among the leaders of districts we’ve studied
25
Denver 2015-16
Charlotte 2015-16
Aldine 2012-13
Lawrence 2013-14
Palm Beach County 2014-15
Boston 2014-15
Denver 2009-10
1 1.5 2 2.5 3
Less Strategic More Strategic
Practice & Resource Use System CondistionsSystem Conditions

Key Funding & Portfolio findings DPS is unique in how you have leveraged you chartering authority to
create a more level playing field across district-run and charter schools Willingness to put teeth into accountability systems by closing chronically
underperforming schools Strategic approach to opening new schools that avoids the unplanned and
fragmented enrollment impacts on surrounding schools often seen in other districts Deliberately moving beyond choice to increase equity of access Implementation of single system designed to ensure equitable funding across all
schools This approach has resulted in better options for students
Increase in high quality seats across all regions; largest in regions with fewest high quality seats
More similarity in student needs between district-run and charter schools than in many districts
But high quality options are still lagging in some high need regions
26
Funding & Portfolio

DPS has the most sophisticated portfolio management approach of all districts we’ve studied
27
Metric # Metric Less Strategic
More Strategic
Fund
ing an
d Por
tfolio
Portf
olio
School opening and closing decisions supportlong-term portfolio goals.
The district calculates the cost of different school types and has a clear plan for staffing small and specialty schools to balance access
The district has deliberately created a portfolio of school governance types and decision models (e.g., charter, autonomy) to reflect district capacity and to meet the needs of the students in the district.
The district has deliberately created a portfolio of school grade levels and sizes to meet the needs of the students in the district.
The district has deliberately created a portfolio of school program offerings (e.g., magnet, academy, specialized programming, themed schools) to meet the needs of the students in the district.
The district proactively balances the number of seats by deliberately reducing the number of seats at one school when seats are added at another.
Boston Charlotte Lawrence Denver
Funding & Portfolio

Across the district, the number of high-quality seats has increased most in areas with the lowest access
27% 28%34%
57%
68%
31%
41% 44%
60%67%
0%
10%
20%
30%
40%
50%
60%
70%
80%
Far Northeast Northwest Southwest Near Northeast Southeast
Percent of Students in High-Quality Seats by Year
09-10 15-16
28Source: DPS school enrollment and performance data 09-10 and 15-16
Funding & Portfolio
15-16 % Poverty 81% 78% 89% 58% 45%

DPS has more similarity in student needs between charter and district-run schools than we see in many other districts
Source: DPS school enrollment 09-10 and 15-16
73% 68%
0%
20%
40%
60%
80%
Charter Traditional
% FRL
37%30%
0%
10%
20%
30%
40%
Charter Traditional
% ELL
10%12%
0%2%4%6%8%
10%12%14%
Charter Traditional
% SPED
84% 76%
0%10%20%30%40%50%60%70%80%90%
Charter Traditional
% Non-White
30% 34%
0%5%
10%15%20%25%30%35%40%
Charter Traditional
% Incoming Proficiency6th Grade ELA
28% 32%
0%5%
10%15%20%25%30%35%
Charter Traditional
% Direct Certification
Funding & Portfolio
29
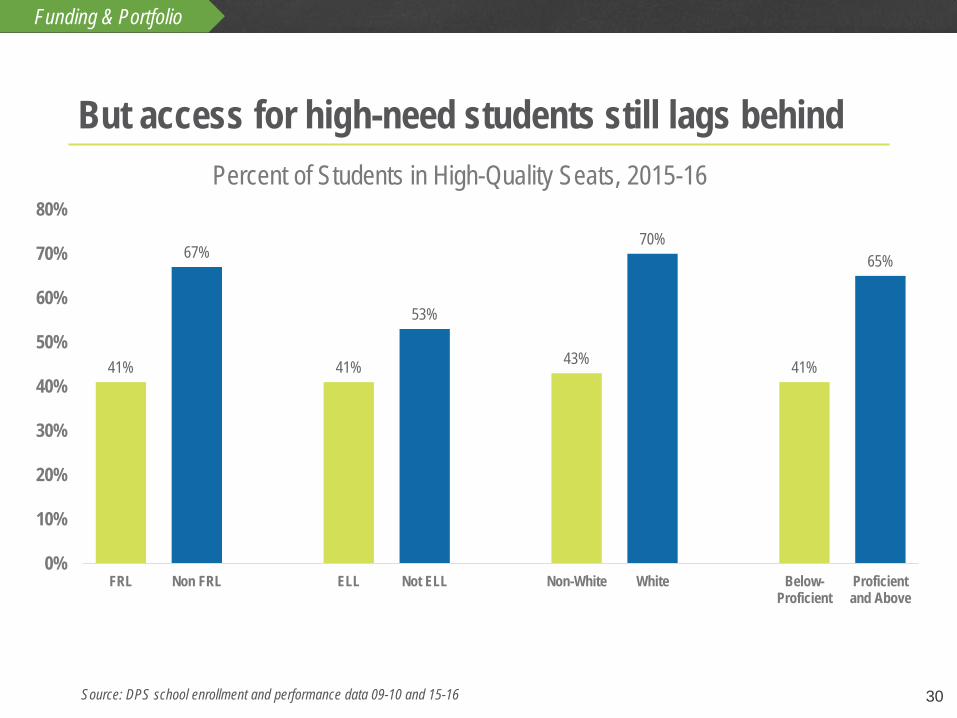
But access for high-need students still lags behind
30
Funding & Portfolio
41%
67%
41%
53%
43%
70%
41%
65%
0%
10%
20%
30%
40%
50%
60%
70%
80%
FRL Non FRL ELL Not ELL Non-White White Below-Proficient
Proficientand Above
Percent of Students in High-Quality Seats, 2015-16
Source: DPS school enrollment and performance data 09-10 and 15-16

Key Teaching and Leadership Findings DPS investment in LEAP, LEAD and growth supports for
teachers and leaders seems to be paying off Increased rigor in teacher evaluation High retention of strongest performers coupled with relatively
higher attrition of lowest performers But high need schools are lagging in teacher and leader
stability and quality Turnover and % novice teachers and leaders is much higher in
higher need schools ProComp incentives for priority schools compete with incentives
for high growth/high performing schools Schools are not consistently maximizing the opportunities
provided by the district, particularly around the hiring timeline, and teacher leaders
31
LeadershipTeaching

DPS’ highest performing teachers are also most likely to stay, which is a leading indicator of teaching quality
1%
19% 19%23%
18%
0%
5%
10%
15%
20%
25%
Aldine Boston Charlotte All Teachers Non-Probationary teachers
Pct. Point Difference Between Retention of Teachers Below Effective vs Above Effective
32
Retention of Teachers above effective 86% 89% 89% 91% 92%
Retention of Teachers below effective 85% 70% 70% 68% 74%
Denver

However, low-performing schools tend to have a higher share of novice teachers and higher attrition rates
33
14%
6%
54%
33%
0%
10%
20%
30%
40%
50%
60%
70%
80%
90%
100%
Lowest-Performing Quartile Highest-Performing Quartile
Percent Novice SY17 and Within School Attrition (SY15-SY17)by Performance Quartile
Percent Novice Percent Attrition (2 years)
Leadership
Note: Turnover adjusted to exclude new and closed schools
Teaching

Key School Design/Standards/School Support Findings DPS has implemented strong enabling conditions and
supports for school improvement School-level flexibilities Curriculum, assessments, and instructional support Instructional superintendent support targeted to lowest performers
But these conditions do not consistently result in strategic school designs that meet the needs of all students and teachers Lack of consistent, adequate, high-quality collaborative planning
time is constraining shifts in instructional practice Inconsistent matching of talent and time to student need within
schools is a missed opportunity to improve student outcomes
34
School SupportStandardsSchool Design

DPS schools have more flexibility than comparison districts
35353535
Metric # Metric Less Strategic More Strategic
Scho
ol De
sign
Flexib
ility
Schools have flexibility over how they spend their budget, including class size and staffing ratios, and can trade staff positions, positions for $, and $ for positions.
Schools have the flexibility to hire teachers whose skills and expertise match school and student needs.
Schools have the flexibility to make schedule changes without a contract renegotiation or a full faculty vote.
Schools have the flexibility to vary special education service and instructional models as long as they meet IEP requirements.
Schools have the flexibility to vary teacher teams, assignments, and schedules with data support in order to provide time for collaboration and match resources to student needs.
School SupportStandardsSchool Design
Boston Charlotte Lawrence Denver

Looking forward
36

Denver’s 2020 goal is even more ambitious than its already impressive gains
0%
10%
20%
30%
40%
50%
60%
70%
80%
90%
100%
2004 2005 2006 2007 2008 2009 2010 2011 2012 2013 2014 2015 2016 2017 2018 2019 2020
DPS 3rd Grade reading ScoresActual Continued 2010-2014 trend Needed to reach goal
37Source: CDE website-DPS student performance data, 2004-2014; ERS projection
Goal #2: A Foundation For Success in School. By 2020 80% of DPS third Grade Students will be at or above grade level in reading and writing
And that’s before accounting for the switch to PARCC

Reaching DPS’ 3rd grade reading goals will require greater gains than those seen in even the most successful districts
38
80%
53%
60%
88%
73%
45%
60%
39%
51%
65%
59%
41%
Denver Aspirations
RSD New Orleans
Denver 09-10 to13-14
Aldine, TX
Norfolk, VA
Lawrence, MA
Growth in Elementary Reading Proficiency Start
End
Gain/year (%)
# of Years
Enrollment (000)
+1 4 14
+1.8 8 34
+2.3 10 65
+2.3 4 90
+2.8 5 30
+3.3 6 90
Source: ERS database, DPS performance data, Denver 2020 plan

And while system-wide efforts have raised performance for all, significant achievement gaps remain
29%40%
44%
65%69%
82%
0%
10%
20%
30%
40%
50%
60%
70%
80%
90%
2004 2005 2006 2007 2008 2009 2010 2011 2012 2013 2014
Whit
e, No
n-W
hite P
erce
ntage
Poin
t Ach
ievem
ent G
ap
FRL- Non FRL Achievement Gap, ELA
Source: 2004-2014 TCAP data for all tested grades from CDE websiteNote: we limited this view to TCAP data because only one year of PARCC data is publicly available disaggregated by FRL status to date.
Non FRL students
FRL students
39 pts
38 pts
29 pts
39

Targeting support to high-need schools and students will be key to continuing progress and closing gaps
Focus portfolio management efforts on maintaining and increasing equity as demographics shift Leverage portfolio management and student enrollment processes to maximize opportunities for high-needs students including strategic deployment of proven models and operators and policies that encourage integration in gentrifying neighborhoods.
Leverage talent management to support high need schoolsContinue work to build structures to help lower performing/higher need schools attract, develop and retain talent, including increasing support for the high number of new teachers in these schools.
Support schools in implementing high-quality strategic school designs
Improve support for school leaders to implement strategic school designs and strong professional learning practices in order to turn district-wide systems into on the ground changes that improve student performance.
40

DPS’ journey holds valuable lessons for any district working to transform student outcomes The importance of creating effective system supports through a
sustained and integrated redesign approachDPS’ systematic creation of the enabling structures and conditions for high-quality schools across all of the School System 20/20 areas has steadily improved performance in district-run schools and should continue to drive improvement into the future.
The power of a system-wide approach to human capital managementDPS’ has focused on creating the conditions to attract, develop and retain high performing teachers and leaders across all areas of the system including evaluation, compensation and career paths and professional development.
The value of deliberate portfolio management DPS has accelerated overall district performance growth through a deliberate approach to portfolio management coupled with its chartering authority. Notably, this has also avoided the unplanned under-enrollment and performance degradation in district schools that too often accompanies charter growth.
The challenge of driving from enabling conditions through to practice Translating strong enabling conditions into school-level changes in practice and resource use requires active support to build capacity and change behaviors.
41

Thank you!
www.erstrategies.org/signup
@ERStrategies
www.erstrategies.orgVISIT
SUBSCRIBE
LIKE + FOLLOW