department of animal sciences university of florida - …€¦ · department of animal sciences...
TRANSCRIPT

José Eduardo P. Santos Department of Animal Sciences
University of Florida
METRITIS AND ENDOMETRITIS: A
TOPIC OF CONTROVERSY

Defining the diseases
Epidemiology
Therapeutics
Prevention
Costs
Final remarks
OUTLINE OF THE PRESENTATION

DEFINING AND DIAGNOSING THE
DISEASES

Calving 10 20 30 40 50 60
Metritis PVD (clinical
endometritis)
Cytological
endometritis RP
Pyometra
Timeline of Uterine Diseases

The classical definition of metritis is
based on an abnormally enlarged uterus
and presence of watery, reddish/brownish
uterine discharge of foul smell concurrent
with systemic signs including fever
30 to 50% of the cows with metritis do not
display fever on the day of diagnosis
40 to 50% of the cows with metritis and no
fever eventually develop fever
5
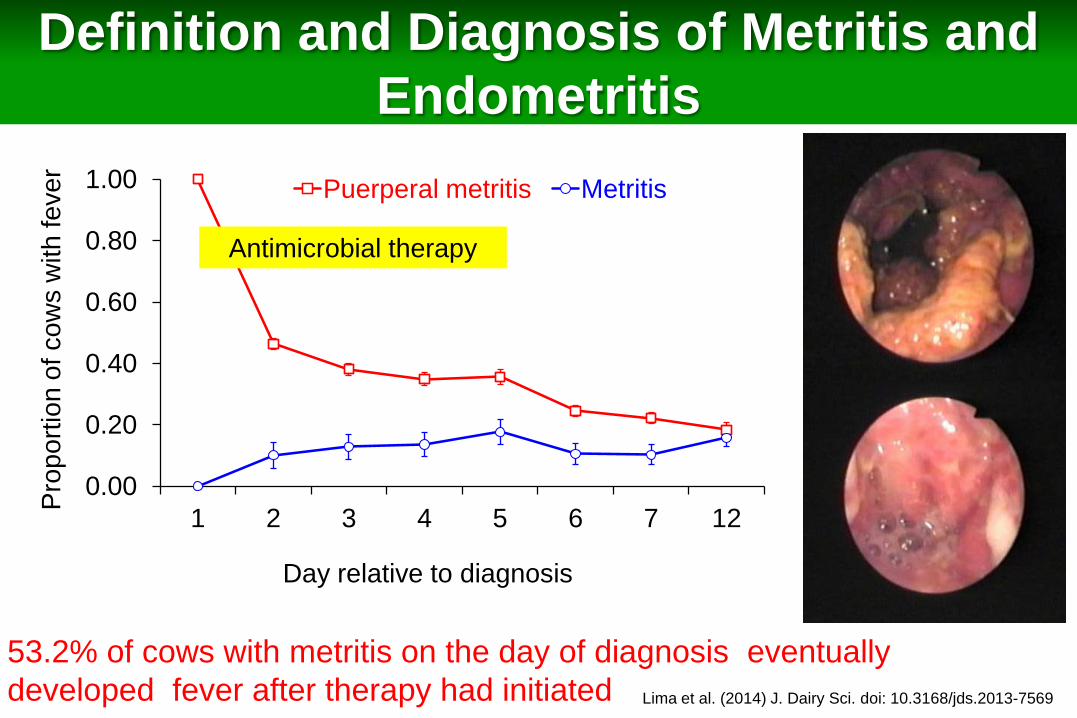
Definition and Diagnosis of Metritis and
Endometritis
Unfortunately, dairy cows do not read the textbook

Day relative to the diagnosis of metritis
Recta
l te
mpera
ture
, oC
Day relative to the diagnosis of metritis
Tem
pera
tura
reta
l, o
C
= metritis and fever (n = 39)
= metritis no fever (n = 55)
= healthy (n = 356)
= metritis (n = 94)
= healthy (n = 356)
Rectal Temperature and Metritis in Dairy Cow
Benzaquen et al. J. Dairy Sci. (2007) 90: 2804-2814
Definition and Diagnosis of Metritis and
Endometritis
0.00
0.20
0.40
0.60
0.80
1.00
1 2 3 4 5 6 7 12
Pro
port
ion o
f co
ws w
ith fever
Day relative to diagnosis
Puerperal metritis Metritis
Antimicrobial therapy
Lima et al. (2014) J. Dairy Sci. doi: 10.3168/jds.2013-7569
53.2% of cows with metritis on the day of diagnosis eventually
developed fever after therapy had initiated

• Occurs in the first 2 weeks postpartum – Peak between days 4 and 9 postpartum
• Puerperal metritis (acute metritis) – risk for the cow
– Fetid, watery, reddish/brownish uterine discharge, enlarged and flaccid uterus, lack of grooves in the uterine wall at palpation, fever (> 39.5 oC) and systemic signs of diseases (reduced production, lack of appetite, etc.)
• Metritis
– Fetid, watery, reddish/brownish uterine discharge, enlarged and flaccid uterus, lack of grooves in the uterine wall, but without systemic signs of disease
Metritis

• Occurs after 21 d postpartum – Before 3 weeks, it has no impact on reproductive performance
• Diagnoses performed with vaginal palpation, metricheck or vaginoscopy – Characterized by the presence of pus in the uterine/cervical mucus
Clinical Endometritis or Purulent Vaginal
Discharge

• Diagnosed usually after 4 weeks postpartum
– Associated with reduced fertility in dairy cows
– Inflammatory process of the superficial and glandular epithelium
of the endometrium (possibly a combination of acute and
chronic)
• Diagnosis
– Presence of inflammatory cells in the endometrium
– Diagnosis typically done by endometrial cytology
Cytological Endometritis


Metritis
≤ 21 DIM ≥ 21 DIM ≥ 35 DIM
Metritis with no systemic signs
Puerperal metritis (acute disease)
Clinical
Endometritis Cytological
Endometritis

EPIDEMIOLOGY and
PATHOGENESIS OF THE DISEASES

Region Herds Cows Twins Dystocia RP Metritis
Midwest 17 556 6.3 1.1 7.9 6.5 (7)
Northeast 20 660 3.8 8.2 5.4 6.2 (5)
Southeast 10 494 1.2 8.7 7.3 17.4 (7)
Southwest 8 653 2.6 25.1 9.0 35.7 (6)
Total 55 2,363 3.5 11.3 7.4 16.7 (6)
Chapinal et al. (2011) J. Dairy Sci. 94:4897-4903
Distribution and Incidence (%) of Peripartum Problems
(DIM Diagnosis) in Dairy Cows in US and Canadian Herds

Day Postpartum at Diagnosis
0
10
20
30
40
50
60
70
80
90
100
1 2 3 4 5 6 7 8 9 10 11 12 13 14 15 16 17 18 19 20 21
Fre
qu
en
cy
Days postpartum
N = 753 cows with metritis in dairy
farms in NY, OH, and CA
Galvão et al. (2014)

0-3 DIM 7-14 DIM 20-35 DIM 35-45 DIM parturition
Several risk factors:
NEB, DMI, DOA, parity,
RP, Ease, twins, …
Metritis is diagnosed.
Sick cows will have heavy
anaerobic contamination
Subclinical endometritis; A.
pyogenes?, inflamation and no
bacteria?
Fimbriated E. coli
contamination is the # 1
cause uterine diseases
T. Pyogenes and F.
necrophorum cause clin.
endometritis
Metritis, CE, and CytE will
impact repro performance
> VWP
Sequence of Events Based on Literature
Courtesy of R.C. Bicalho, Cornell University

• Retained placenta
• Lactation
– Primiparous > Multiparous
• Dystocia
• Calf gender
– Male > Female
• Stillbirth and twins
• Hygiene in the maternity area
• Hypocalcemia (clinical and subclinical)
• Weight loss (excessive fat mobilization prepartum)
• Stress prepartum (heat-stress, low DM intake, high cortisol, etc)
• Immunosuppression (inadequate vitamin E, Se, etc)
Risk Factors

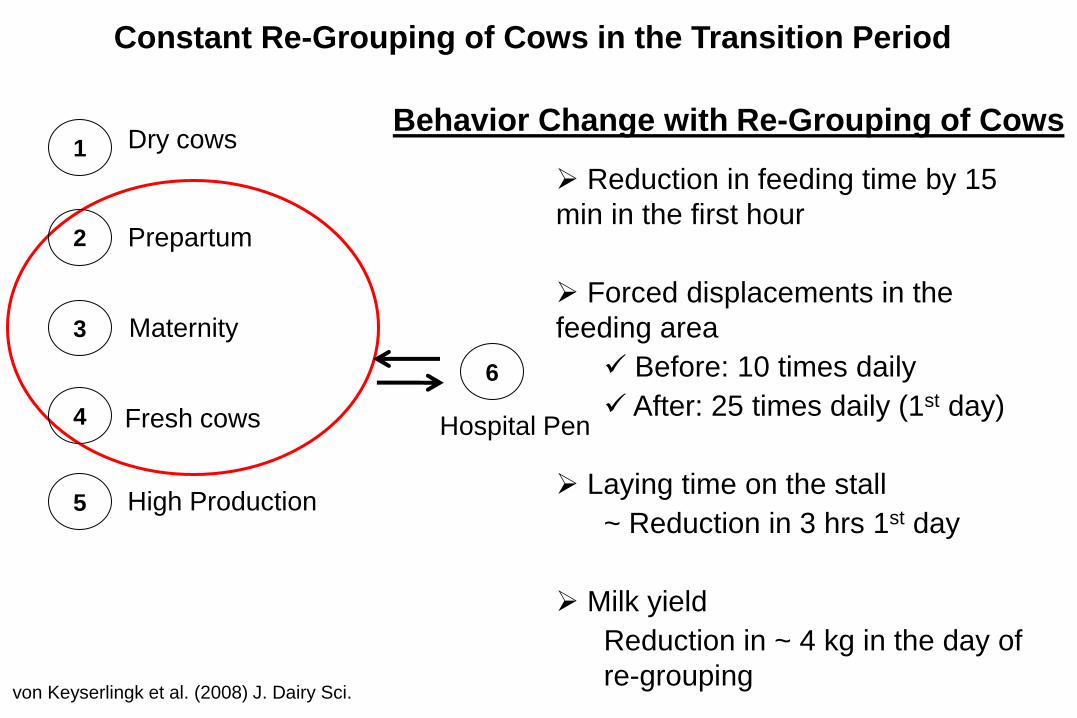
Constant Re-Grouping of Cows in the Transition Period
Reduction in feeding time by 15
min in the first hour
Forced displacements in the
feeding area
Before: 10 times daily
After: 25 times daily (1st day)
Laying time on the stall
~ Reduction in 3 hrs 1st day
Milk yield
Reduction in ~ 4 kg in the day of
re-grouping
1 Dry cows
2 Prepartum
3 Maternity
5 High Production
4 Fresh cows Hospital Pen
6
Behavior Change with Re-Grouping of Cows
von Keyserlingk et al. (2008) J. Dairy Sci.

200
400
600
800
1000
05
10
15
20
30
-20 -10 0 10 20 30
Day relative to calving
AGL
CMS D
MI,
Kg
/d
NE
FA
, u
M
Dry Matter Intake and Plasma NEFA
Bertics et al. (1992) J. Dairy Sci.
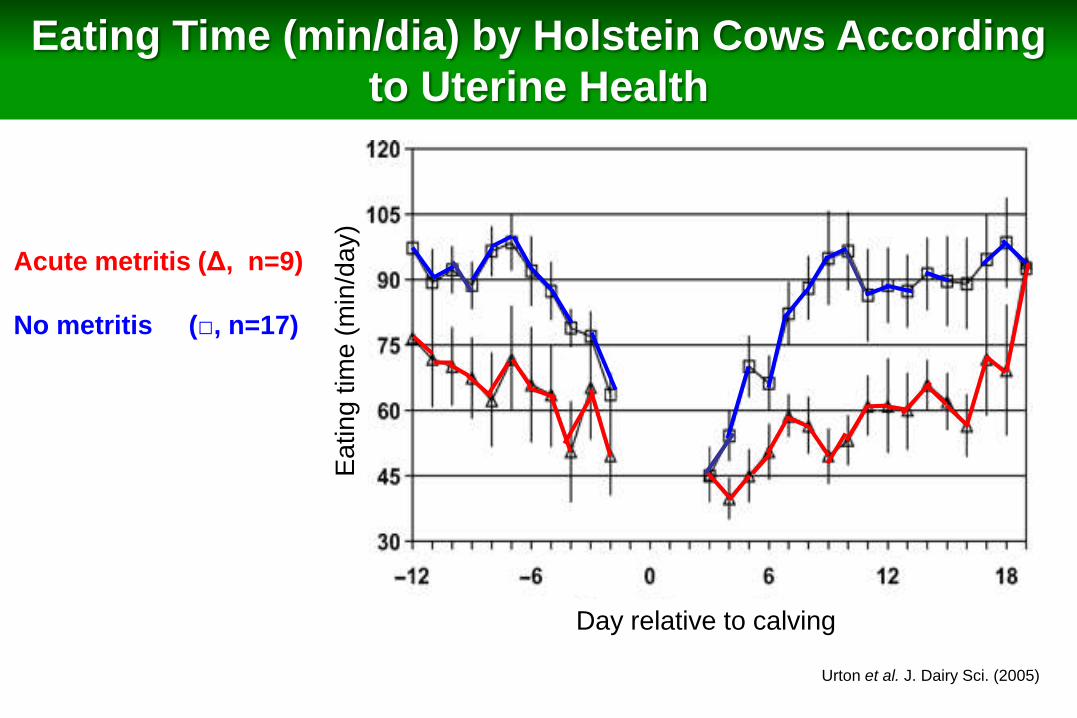
Acute metritis (Δ, n=9)
No metritis (□, n=17)
Urton et al. J. Dairy Sci. (2005)
Eating Time (min/dia) by Holstein Cows According
to Uterine Health
Day relative to calving
Ea
tin
g tim
e (
min
/da
y)

Vazquez-Añon et al., 1994; JDS
Negative Nutrient Balance

BHBA and in vitro Neutrophil Function
Grinberg et al., 2008; Infec. Immun.

Cows that Develop Uterine Disease Have
Reduced Cytosolic Glycogen in PMN
0
5
10
15
20
25
30
35
40
Category 1
Gly
cogen,
μg/1
06 P
MN
Healthy SCE Metritis
Galvão et al., 2010; JDS
a a b
a, b P < 0.05

Calcium during transition
Kimura et al., 2006; JDS

1.0
2.0
3.0
4.0
5.0
6.0
7.0
0 1 3
Ne
utr
op
hils
, 10
3 /µ
L
Day postpartum
Normocalcemia
Subclinical hypocalcemia
*
*
Neutrophil Function
50.0
55.0
60.0
65.0
70.0
75.0
80.0
85.0
90.0
0 1 3
Ne
utr
op
hil
tota
l ph
ag
ocy
tosi
s, %
Day postpartum
Normocalcemia
Sub-hypocalcemia
*
1.0
2.0
3.0
4.0
5.0
6.0
7.0
0 1 3
Ne
utr
op
hils, 1
03/µ
L
Day postpartum
Normocalcemia
Subclinical hypocalcemia
*
*
* Within a day, P < 0.05
20.0
25.0
30.0
35.0
40.0
45.0
50.0
55.0
60.0
0 1 3
Ne
utr
op
hil
oxi
da
tive
bu
rst,
%
Day postpartum
Normocalcemia
Sub-hypocalcemia
*
*
Martinez et al. (2012) J. Dairy Sci. 95:7158-7172

Low Risk High Risk Low Risk High Risk
Metritis, % *,¶ 40.7 (11/27) 77.8 (35/45) 14.3 (4/28) 20.0 (2/10)
Puerperal metritis, %*,¶ 29.6 (8/27) 53.5 (24/45) 0 (0/28) 10.0 (1/10)
Subclinical hypocalcemia1 Normocalcemia
*Effect of hypocalcemia (P < 0.05),
¶ Effect of metritis risk (P < 0.05). 1 Serum Ca ≤ 8.59 mg/dL in the first 3 d postpartum. 2 Puerperal metritis was defined as metritis with presence of fever (≥ 39.5°C).
Martinez et al. (2012) J. Dairy Sci. 95:7158-7172
Subclinical Hypocalcemia and Metritis
Subclinical hypocalcemia Normocalcemia P
PVD (clinical endometritis), % 82.6 (57/69) 68.4 (26/38) 0.04
Cytological endometritis, % 46.2 (30/65) 21.1 (8/38) 0.07

Martinez et al. (2014) J. Dairy Sci. 97 :874–887
0
20
40
60
80
100
120
140
160
24 48 72
Neu
tro
ph
il p
hag
ocy
tosi
s, %
bas
elin
e
Hour relative to infusion
NC
SCH
* *
0
20
40
60
80
100
120
140
160
180
24 48 72
Neu
tro
ph
il o
xid
ativ
e b
urs
t, %
bas
elin
e
Hour relative to infusion
NC
SCH
*
0.5
0.6
0.7
0.8
0.9
1.0
1.1
1.2
1.3
1.4
Base 2 4 6 8 10 12 14 16 18 20 22 24 72
Blo
od
Ca
2+, m
M
Hour relative to beginning of infusion
NC
SCHI
P < 0.01
Infusion 0.0
3.0
6.0
9.0
12.0
15.0
18.0
21.0
Pre-stimulation Post-maximum Post-end
Neu
tro
ph
il c
yto
soli
c C
a2
+,
Flu
o-4
:Fu
ra R
ed
rati
o
Stage relative to ionophore stimulation
NC
SCHI*
Induced Subclinical Hypocalcemia in Dairy Cows

Proposed Mechanism
Decline in serum Ca
Excess of Ca loss in colostrum
+
•Inadequate Ca intake/absorption
•Insufficient Ca mobilization
Cow undergoes
parturition
Subclinical
hypocalcemia ( [Ca] < 8.59 mg/dL)
Develops Metritis
29
Reduced [Ca+2 ]i for
neutrophil activation
Adapted form Nunez and Demaurex, Journal of Leukocyte Biology, 2010
Compromises innate immunity
Reduced cell function

0 10 20 30 40 50 600
25
50
75
100
% a
nim
als
wit
h u
teri
ne
bac
teri
a
Days postpartum
Pathogens more commonly isolated:
•Escherichia coli
•Arcanobacterium pyogenes
Bacterial Uterine Infection in Postpartum Dairy
Cows %
of cow
s w
ith b
acte
ria isola
ted f
rom
the
ute
rus
Days postpartum I.M. Sheldon
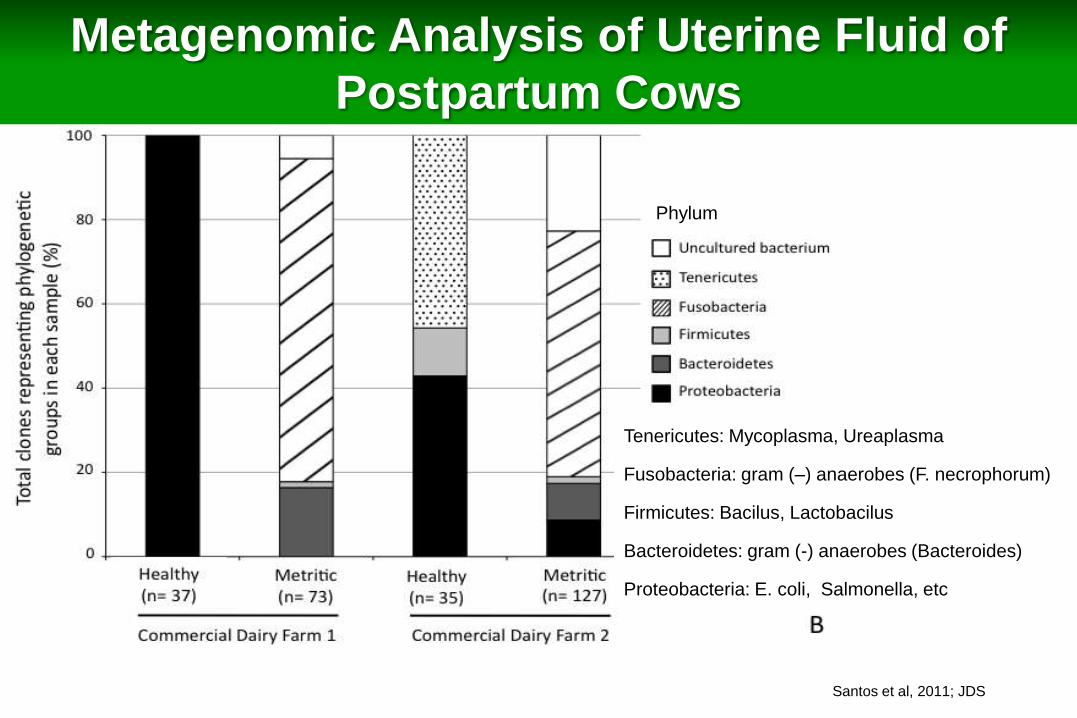
Phylum
Santos et al, 2011; JDS
Metagenomic Analysis of Uterine Fluid of
Postpartum Cows
Tenericutes: Mycoplasma, Ureaplasma
Fusobacteria: gram (–) anaerobes (F. necrophorum)
Firmicutes: Bacilus, Lactobacilus
Bacteroidetes: gram (-) anaerobes (Bacteroides)
Proteobacteria: E. coli, Salmonella, etc
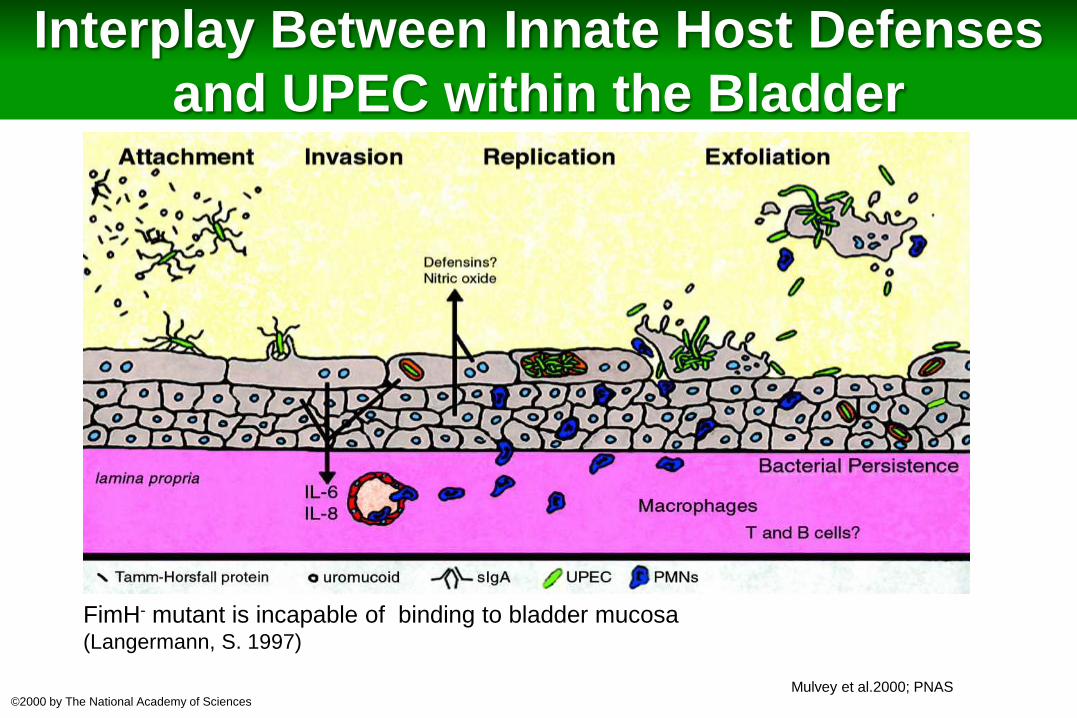
Mulvey et al.2000; PNAS ©2000 by The National Academy of Sciences
FimH- mutant is incapable of binding to bladder mucosa (Langermann, S. 1997)
Interplay Between Innate Host Defenses
and UPEC within the Bladder
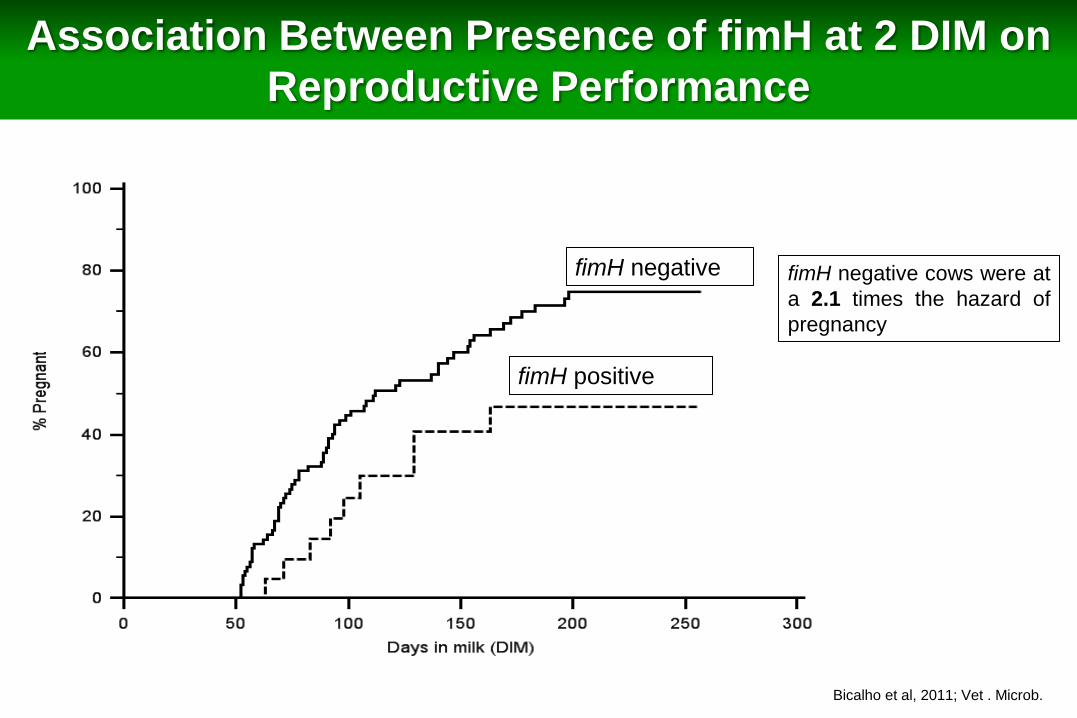
fimH negative
fimH positive
Bicalho et al, 2011; Vet . Microb.
fimH negative cows were at
a 2.1 times the hazard of
pregnancy
Association Between Presence of fimH at 2 DIM on
Reproductive Performance

LIMA I 11TH ANNUAL RESEARCH SYMPOSIUM ANIMAL MOLECULAR CELL BIOLOGY
EGFP
T. PYOGENES DAMAGES THE ENDOMETRIUM
COWS TREATED WITH
TNFα
CONTROL COWS COWS INFUSED WITH TRUEPERELLA
PYOGENES

T. pyogenes induces early luteolysis
J. Dairy Sci. 96:594. E-Suppl. 1
0.0
1.0
2.0
3.0
4.0
5.0
6.0
7.0
8.0
9.0
10.0
4 5 6 7 8 9 10 11 12 13 14 15 16 17 18 19 20 21
Pro
geste
rone,
ng/m
L
Day of Estrous Cycle
Control
TNF
TP
A
B
B
Treatment: P = 0.58
Time: P < 0.001
Treatment*Time: P = 0.60
Within day, concentrations of progesterone tend to be differed (A, B; P < 0.10).
4
8
12
16
20
24
28
32
36
4 5 6 7 8 9 10 11 12 13 14 15 16 17 18 19 20 S
ize o
f C
L (
mm
)
Day of Estrous Cycle
Control TNF TP
a a
b b
b
b
b
b
a
a
b
b
Treatment: P = 0.22
Time: P < 0.001
Treatment*Time: P < 0.01
Within day, size of the corpus luteum differed (a, b; P < 0.10).
1The criterion to determine luteolysis was reduction plasmatic concentration of progesterone below 1.0 ng/mL. 2The criterion to determine early luteolysis was less than 14 days between ovulation luteolysis.
Early luteolysis Control = 0%
TNF = 25%
TP = 42.9%

THERAPEUTICS FOR METRITIS AND
ENDOMETRITIS

In general, the uterus of a postpartum cows is like
“Carnaval”, people do all kinds of things
Major reasons:
High rate of spontaneous cure (55 to 70%)
High failure of antimicrobial to cure (20 to 35% no cure)
Lack of extensive literature on multi-site powered and properly
designed studies
Lack of studies that evaluated parameters beyond clinical cure
(survival, pregnancy, production)
“Feel good” aspect of doing something for a cow that smells
very bad and is sick
Therapy of Metritis and Endometritis

Efficacy of therapies for puerperal metritis in dairy cows
Reference and treatment (no of cows)
Cure,
%
Pregnant
1st AI, %
Days open,
d
Pregnant end
of study, %
Goshen and Shpigel (2006)
Untreated controls – Primiparous (n=121) --- 34.0b 146.4 58.0b
IU chlortetracyline – Primiparous (n=120) --- 47.4ª 147.9 65.5ª
Untreated controls – Multiparous (n=130) --- 18.0b 165.5ª 54.9b
IU chlortetracycline – Multipaorus (n=134) --- 42.5a 136.2b 70.6ª
Clinical cure, %
Chenault et al. (2004) Day 6 Day 10 Day 14
Untreated controls (n=121) 23 44 62b
Ceftiofur 1,1 mg/kg (n=123) 27 46 65ab
Ceftiofur 2,2 mg/kg(n=123) 26 41 77a

Efficacy of Ceftiofur or Ampicillin for
Therapy of Metritis
23.1 50.4 66.1 17.6 37.9 67.4 0
10
20
30
40
50
60
70
80
5 7 12
Perc
en
tag
e o
f cow
s w
ith m
etr
itis
cure
d
Days after metritis diagnosis
Cure Based on VD < 5 and RT < 39.5 C
Ampicillin
Ceftiofur
a
b
a,b P < 0.05
Lima et al. (2014) J. Dairy Sci. doi: 10.3168/jds.2013-7569
Treatment
Ampicillin Ceftiofur No Metritis P
Adjusted means (n/n)
Cyclic at 67 DIM 74.8
(184/245)
75.9
(185/246)
75.1
(198/258) 0.96
Pregnancy per AI
Day 34 28.9
(61/230)
29.1
(70/227)
32.0
(84/247) 0.87
Day 62 27.9
(58/230)
28.3
(65/227)
30.5
(76/247) 0.91
Pregnancy loss 5.8 (3/61) 6.1 (5/70) 11.3 (8/84) 0.52
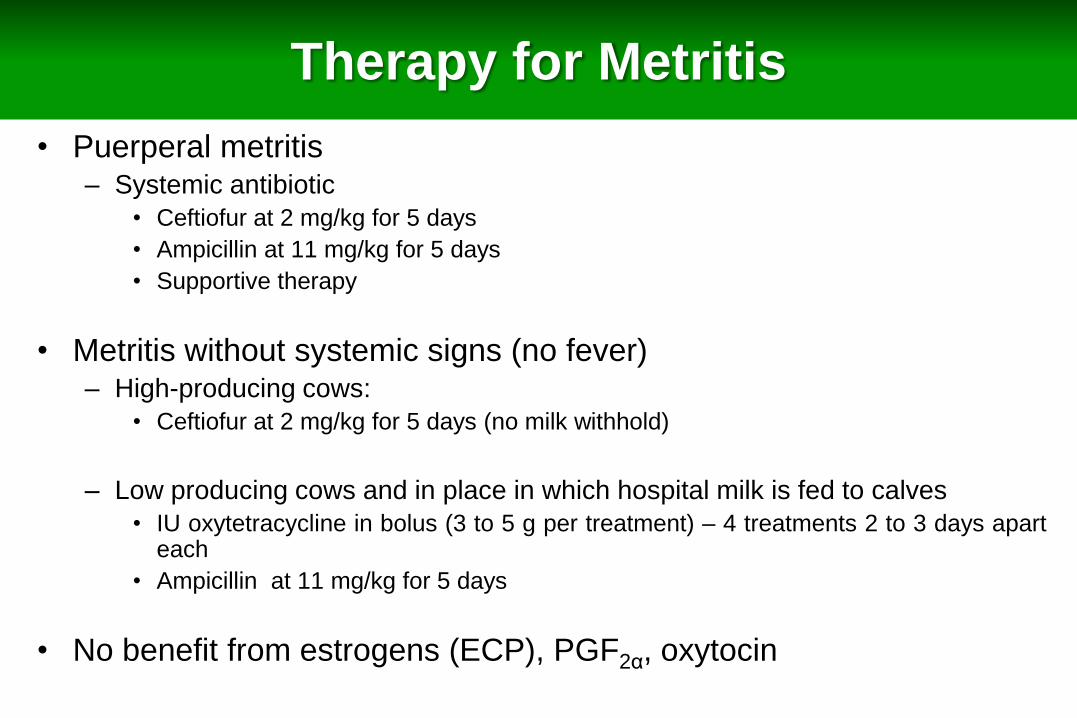
• Puerperal metritis – Systemic antibiotic
• Ceftiofur at 2 mg/kg for 5 days
• Ampicillin at 11 mg/kg for 5 days
• Supportive therapy
• Metritis without systemic signs (no fever) – High-producing cows:
• Ceftiofur at 2 mg/kg for 5 days (no milk withhold)
– Low producing cows and in place in which hospital milk is fed to calves
• IU oxytetracycline in bolus (3 to 5 g per treatment) – 4 treatments 2 to 3 days apart each
• Ampicillin at 11 mg/kg for 5 days
• No benefit from estrogens (ECP), PGF2α, oxytocin
Therapy for Metritis

In the US, we do not have any product that has been critically evaluated for therapy of clinical and cytological endometritis
Other countries (Canada, countries in South America, European countries, Australia, NZ, etc) Intrauterine use of 500 mg of cephapirin (Metricure)
Options:
Systemic antimicrobials that reach the uterus and result in MIC > 90 for the
typical pathogens that cause endometritis (e.g. cephalosporins)
Intrauterine use of antimicrobials
Use of anti-inflammatory drugs
Use of prostaglandins
Therapy for Endometritis
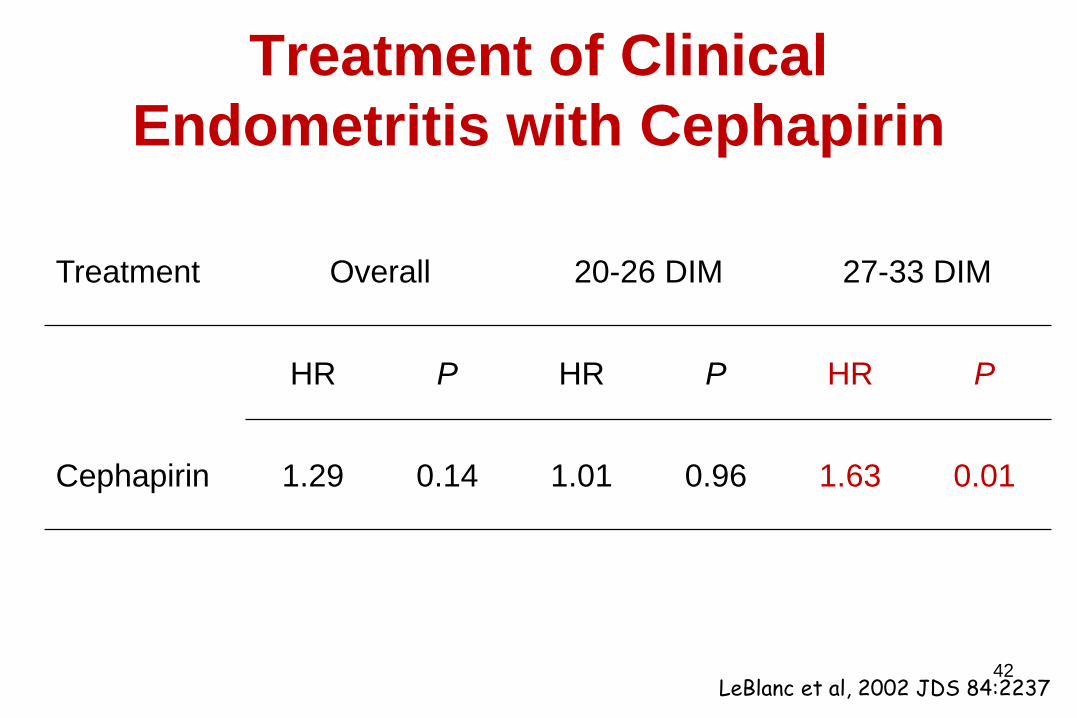
42
Treatment of Clinical
Endometritis with Cephapirin
Treatment Overall 20-26 DIM 27-33 DIM
HR P HR P HR P
Cephapirin 1.29 0.14 1.01 0.96 1.63 0.01
LeBlanc et al, 2002 JDS 84:2237

Adjusted HR = 0.93 (0.80 – 1.07; P = 0.31)
Median days open
Control = 80 d
Ceftiofur = 81 d
Treatment with IU Ceftiofur (125 mg) at 44 DIM
Galvão et al. (2009) J. Dairy Sci. 92 :1532–1542
Control ── IU Ceftiofur --------

25 3 32 3 39 3 46 3
7d 7d 7d
25 3 32 3 39 3 46 3
7d 7d 7d
PGF2α
25 3 32 3 39 3 46 3
7d 7d 7d
PGF2α
PGF2α
UC UC UC+MC
UC UC UC+MC
UC UC UC+MC
CONTROL = 454
1PGF = 474
2PGF = 414
Double Ovsynch
Criterion for PVD – VD > 2
1 2 3 4 5
Criterion for subclinical
endometritis
PMNL ≥5
3 4 5
Lima et al. (2013) J. Dairy Sci. 96 :6480–6488
Prostaglandin F2α

PREVALENCE OF PVD AND SUBCLINICAL ENDOMETRITIS
ACCORDING TO TREATMENT
0
5
10
15
20
25
30
35
40
PVD d 25 25 32 46
Pe
rce
nta
ge
Control 1PGF 2PGF
Subclinical endometritis
AB
B
A
b b
a
a,b different superscripts among treatments denote statistical difference (P < 0.05).
A,B different superscripts among treatments tended to differ (P < 0.10). Lima et al. (2013) J. Dairy Sci. 96 :6480–6488

EFFECT OF ONE OR TWO TREATMENTS OF PGF2α ON
P/AI AND PREGNANCY LOSS IN DAIRY COWS
SUBJECTED TO A TIMED AI PROGRAM
Treatment
P
Item Control 1PGF 2PGF
TRT C1 C2
Pregnant ……………. % (n/n) ……..……..
d 32 38.1 (173/454) 40.7 (193/474) 41.1 (170/414)
0.58 0.32 0.72
d 60 33.7 (153/454) 36.7 (174/474) 35.0 (145/414)
0.70 0.43 0.78
Loss 11.6 (20/173) 9.8 (19/193) 14.7 (25/170)
0.36 0.87 0.16
Lima et al. (2013) J. Dairy Sci. 96 :6480–6488

PREVENTION OF METRITIS AND
ENDOMETRITIS
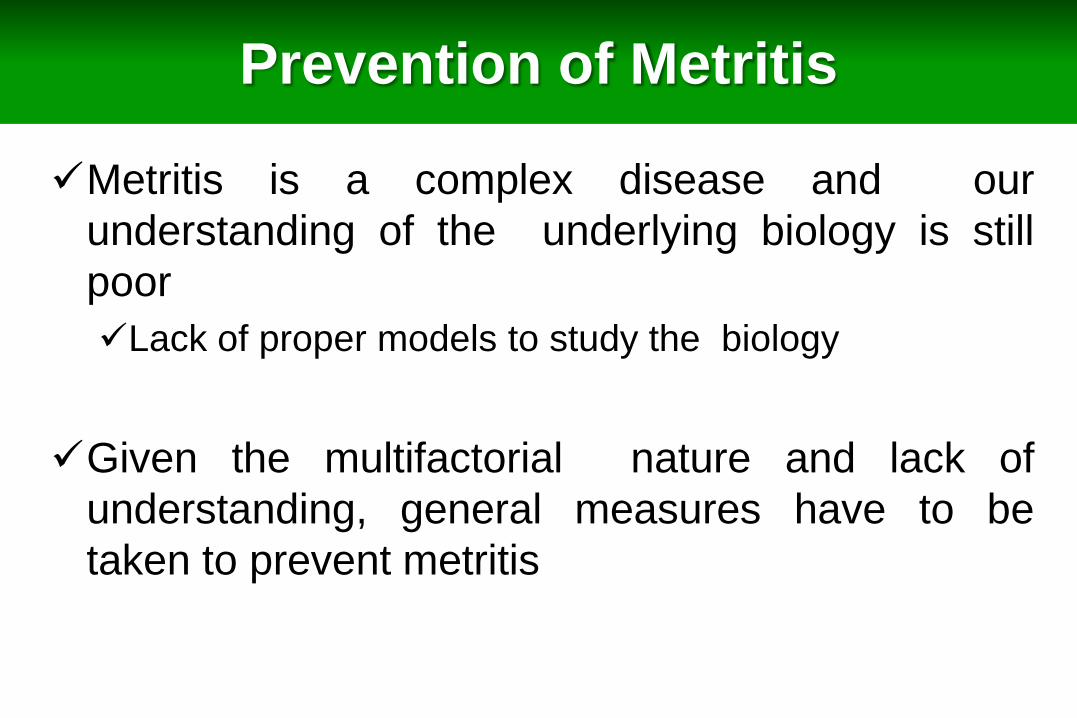
Prevention of Metritis
Metritis is a complex disease and our
understanding of the underlying biology is still
poor
Lack of proper models to study the biology
Given the multifactorial nature and lack of
understanding, general measures have to be
taken to prevent metritis

Prevention of Metritis
Nutritional and metabolic distresses that cause
immunosuppression
Minize exacerbate negative nutrient balance
Control subclinical hypocalcemia
Reduce trauma at calving
Genetic selection agains stillbirth and difficult calving
Proper training in the maternity

Prevention of Metritis
Minimize contamination
Clean environment, clean intervention
New tools in the horizon
Vaccination
Immunostimulants
Nonconventional antimicrobial therapy

Prevention of Metritis
Should preventative antimicrobials be used in high
risk cows?
McLaughlin et al. (2013) Theriogenology 79: 725–734
Control: 100 high risk calvings, 44 cows treated for metritis
Metaphylatic group: 100 calvings, 100 treatments at calving + 29 cows treated for metritis

Vaccine 1 = Inactivated E. coli, F. necrophorum and T. puogenes, FimH, PLO, and LKT;
Vaccine 2 = FimH, PLO, and LKT;
Vaccine 3 = E. coli, F. necrophorum and T. pyogenes;
Vaccine 4 = E. coli, F. necrophorum and T. pyogenes i.v.;
Vaccine 5 = PLO and LKT i.v.
Control % (n)
Vaccinated % (n) OR (95%C.I) P
control vs. vaccine 1
11.9% (101)
6.1% (49) 2.1 (0.5 – 7.7) > 0.10
control vs. vaccine 2 4.0% (50) 3.2 (0.7 – 15.1) > 0.10
control vs. vaccine 3 2.0% (50) 6.6 (0.8 – 52.3) > 0.10
control vs. vaccine 4 11.9% (101)
13.2% (53) 0.9 (0.3 – 2.4) > 0.10
control vs. vaccine 5 15.4% (52) 0.7 (0.3 – 1.9) > 0.10
control vs. SQ
11.9% (101)
4.0% (149) 3.2 (1.2 – 8.9) < 0.05
control vs. i.v. 14.3% (105) 0.8 (0.4 – 1.8) > 0.10
Machado et al., 2014; PLoS One
Vaccine Study

COST OF METRITIS
Overton and Fetrow (2008) Proc. DCRC pp. 39-44
Therapy cost and milk discarded
Increased risk of death and culling
Reduced milk yield
Reduced reproductive performance

COST OF METRITIS
Overton and Fetrow (2008) Proc. DCRC pp. 39-44
Therapy cost and milk discarded
Increased risk of death and culling
Reduced milk yield
Reduced reproductive performance

COST OF METRITIS
Therapy cost and milk discarded
Increased risk of death and culling
Reduced milk yield
Reduced reproductive performance
Overton and Fetrow (2008) Proc. DCRC pp. 39-44
33 extra median days
open
14% additional culling
(73% pregnant vs.
59%)
6% culling/death in
the first 60 DIM
8% due to metritis
caused infertility

COST OF METRITIS
Antimicrobial therapy cost and milk discarded = $53 to $109
(16%)
Increased risk of culling and death = $85 (26%)
Reduced milk yield = $83 (25%)
Reduced reproductive performance = $109 (33%)
Each case of metritis costs $330 to $386
The largest component was the reproductive loss in this
study (33 extra median days to pregnancy and 8% extra
nonpregnant cows at the end of the lactation) Overton and Fetrow (2008) Proc. DCRC pp. 39-44

FINAL REMARKS

Category Cyclic, % Adjusted OR (95% CI) P
Healthy 84.1 1.00 ---
1 case of disease 80.0 0.97 (0.72 – 1.30) 0.83
> 1 case of disease 70.7 0.60 (0.44 – 0.82) 0.001
Type of health problem
Calving problem 70.5 0.52 (0.40 – 0.68) < 0.001
Metritis 63.8 0.37 (0.28 – 0.50) < 0.001
Clinical endometritis 68.9 0.51 (0.37 – 0.71) < 0.001
Fever postpartum 80.0 0.55 (0.40 – 0.74) < 0.001
Mastitis 81.5 0.87 (0.55 – 1.36) 0.53
Clinical ketosis 77.7 0.71 (0.47 – 1.07 0.10
Lameness 85.0 0.82 (0.52 – 1.30) 0.40
Pneumonia 88.9 1.78 (0.22 – 14.34) 0.59
Digestive problem 60.7 0.54 (0.25 – 1.17) 0.12
5,719 postpartum dairy cows evaluated daily for health disorders in seven dairy farms in the US. 58
Health Problems in the First 60 DIM and Resumption of Estrous
Cyclicity in Dairy Cows
Santos et al. (2010) Soc. Reprod. Fertil. 67:387-403

Category Pregnant, % Adjusted OR (95% CI) P
Healthy 51.4 1.00
1 case of disease 43.3 0.79 (0.69 – 0.91) 0.001
> 1 case of disease 34.7 0.57 (0.48 – 0.69) < 0.001
Type of health problem
Calving problem 40.3 0.75 (0.63 – 0.88) < 0.001
Metritis 37.8 0.66 (0.56 – 0.78) < 0.001
Clinical endometritis 38.7 0.62 (0.52 – 0.74) < 0.001
Fever postpartum 39.8 0.60 (0.48 – 0.65) < 0.001
Mastitis 39.4 0.84 (0.64 – 1.10) 0.20
Clinical ketosis 28.8 0.50 (0.36 – 0.68) < 0.001
Lameness 33.3 0.57 (0.41 – 0.78) < 0.001
Pneumonia 32.4 0.63 (0.32 – 1.27) 0.20
Digestive problem 36.7 0.78 (0.46 – 1.34) 0.38
5,719 postpartum dairy cows evaluated daily for health disorders in seven dairy farms in the US 59
Health Problems in the First 60 DIM and Pregnancy in
Dairy Cows
Santos et al. (2010) Soc. Reprod. Fertil. 67:387-403

Health problem (n = 476) % of cows Grades 1 & 2, % AOR (95% CI) P
Healthy 56.3 71.8 1.00
Clinical disease 43.7 59.1 0.57 (0.34-0.94) 0.03
Multiple diseases 24.3 56.0 0.56 (0.30-1.05) 0.07
Type of clinical disease
Healthy 56.3 71.8 1.00
Uterine disease 18.9 50.0 0.42 (0.22-0.80) <0.01
Ketosis 11.1 40.0 0.29 (0.12-0.67) <0.01
Mastitis 21.6 63.3 0.82 (0.43-1.55) 0.54
60
Impact of Clinical Diseases on Proportion of Single Ovulating Dairy
Cows with Embryos as Embryos Grades 1 & 2
Bisinotto et al. (2012) Anim. Reprod. 9:260-272
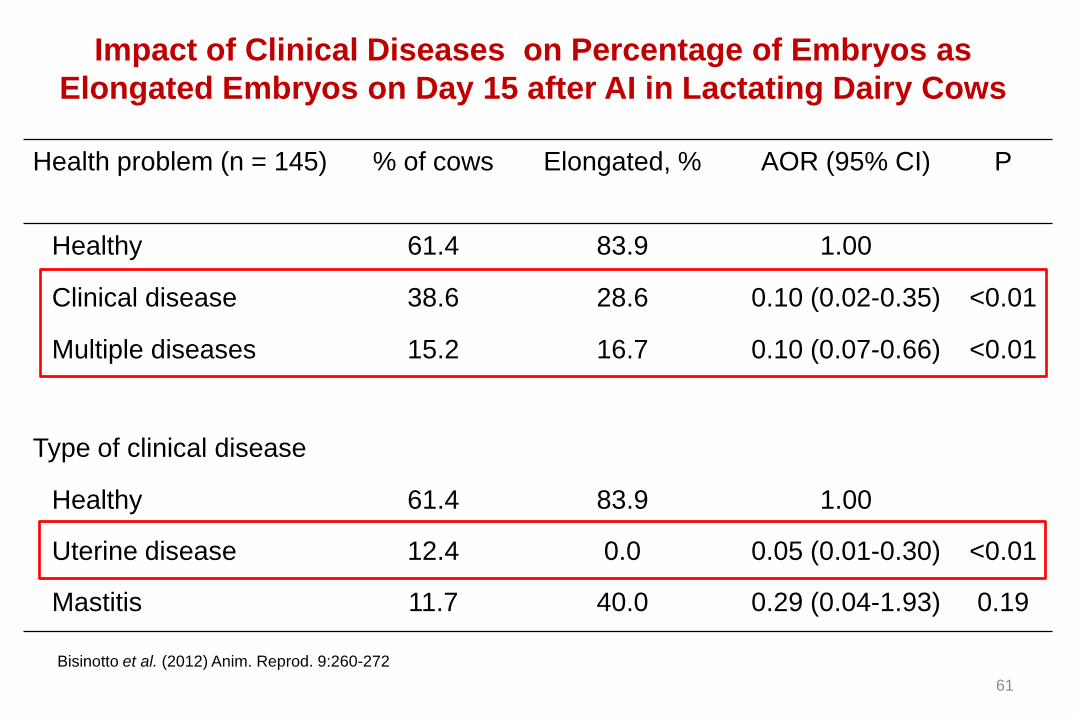
Health problem (n = 145) % of cows Elongated, % AOR (95% CI) P
Healthy 61.4 83.9 1.00
Clinical disease 38.6 28.6 0.10 (0.02-0.35) <0.01
Multiple diseases 15.2 16.7 0.10 (0.07-0.66) <0.01
Type of clinical disease
Healthy 61.4 83.9 1.00
Uterine disease 12.4 0.0 0.05 (0.01-0.30) <0.01
Mastitis 11.7 40.0 0.29 (0.04-1.93) 0.19
61
Impact of Clinical Diseases on Percentage of Embryos as
Elongated Embryos on Day 15 after AI in Lactating Dairy Cows
Bisinotto et al. (2012) Anim. Reprod. 9:260-272

Changes in transcriptome during conceptus elongation
Ovoid Tubular Filamentous
↑ PPARG
Ribeiro et al. (2014) J. Dairy Sci. Abstr
The cells of conceptuses recovered from cows affected by diseases postpartum did not express
fatty acid translocase cluster of differentiation (CD) 36, but the same gene was highly expressed
in conceptuses from healthy cows

Xxx Xxx Xxx xxx
Xxx
Peripheral blood
Corpus luteum
Leukocytes
Peripheral blood Pregnancy-specific protein B
Maternal capillary
Maternal capillary

Uterine diseases influence peripheral responses to pregnancy
54
0
3 5
1 8 6
Different response
to pregnancy
Pregnancy
in healthy cows
Pregnancy in cows
that suffered metritis
36 arrays:
• 9 pregnant healthy cows
• 9 nonpregnant healthy cows
• 9 pregnant cows that suffered metritis
• 9 nonpregnant cows that suffered metritis
MX1
MX2
RTP4
OAS1
GSR
IFI6
BLA-DQB
EIF2AK2
BST2
DDX58
CD40
CD244
CXCL16
Peripheral blood leukocytes
day 19 after AI
Ribeiro et al. (2014) J. Dairy Sci. Abstr

THANK YOU
José Eduardo P. Santos
Department of Animal Sciences
University of Florida – Gainesville