department of commerce - nist...
TRANSCRIPT
DEPARTMENT OF COMMERCE
Technologic Papersof THE
Bureau of StandardsS. W. STRATTON, DIRECTOR
No. 201
FRICTION AND CARRYING CAPACITY OFBALL AND ROLLER BEARINGS
BY
H. L. WHITTEMORE, Mechanical Engineer
S. N. PETRENKO, Assistant Mechanical Engineer
Bureau of Standards
OCTOBER 6, 1921
PRICE, 10 CENTS
Sold only by the Superintendent of Documents, Government Printing Office
Washington, D. C
WASHINGTONGOVERNMENT PRINTING OFFICE
1921


FRICTION AND CARRYING CAPACITY OF BALL ANDROLLER BEARINGS
By H. L. Whittemore and S. N. Petrenko
ABSTRACT
The experiments were undertaken by the Bureau of Standards to determine the
maximum safe load and the static friction under load of ball and flexible roller bearings.
Tests were made on balls of i.oo, 1.25 and 1.50 inches diameter in grooved races
and on rollers 1.25 inches in diameter and 5.25 inches long in flat and cylindrical races.
The total deformation and area of contact of bearings and races were measured and
compared with Hertz's theory.
Conclusions.— 1. The results agree roughly with Hertz's theory. The differences
are ascribable to inhomogeneity of the material.
2. The ratio of friction to load is practically constant and equal to 0.00055 for all
three sizes of balls up to a "critical" load, which varies with the diameter of ball:
1300 pounds for 1.00-inch, 1 700 pounds for 1.25-mch, and 22copoundsfor 1.5-inch balls.
3. A similar "critical" load, 25 000 pounds, was found for the roller bearings with
a ratio of friction to load equal to 0.00075.
4. This "critical" load at which the friction began to increase more rapidly was in
all cases lower than the safe load as determined by permanent deformation and as
calculated from Stribeck's law.
CONTENTS Page
I. Introduction 4
II. Apparatus 4
1
.
Balls 4
2
.
Ball races 4
3 . Rollers 5
4. Roller races 5
5. Hardness and dimensions 6
III. Tests 8
1. Static friction test on ball bearing 8
(a) Method of test 8
(b) Results 9(c) Conclusions 10
2. Static friction test on roller bearing 12
(a) Method of test 12
(6) Results 12
(c) Conclusions 14
3. Compression test on ball bearing 14
(a) Method of test 14
(b) Compression and set 14
(c) Contact area 16
(d) Results 18
(e) Conclusions 20
4. Compression test on roller bearing'
26
(a) Method of test 26
(b) Results 2?
(c) Conclusions 27
3

4 Technologic Papers of the Bureau of Standards
I. INTRODUCTIONIn order to facilitate the training of large guns, it is very desir-
able to reduce the friction at the trunnion bearings. These bear-
ings are moved infrequently and at very low speeds. They maybe, however, subjected to great loads when the gun is fired.
These conditions are very different from those usual for bearings
in engineering work. For the latter the speed is much greater
and the periods of operation much longer. They, however, are
not often subject to great loads or to impact.
The use of ball and roller bearings for line shafts, vehicle wheels,
etc., has become quite extensive, due to their high efficiency.
The results obtained from service tests of this kind give very lit-
tle data for the design of ordnance bearings.
These tests were undertaken by the Bureau of Standards, at
the request of the Navy Department, to obtain experimental data
on the frictional resistance of both ball and roller bearings at very
low speeds and also the loads which they will safely sustain.
The tests may be listed as follows: i, Static friction test on
ball bearing; 2, static friction test on roller bearing; 3, compression
test on ball bearing; and 4, compression test on roller bearing.
II. APPARATUSThe special apparatus required for these tests was designed and
built by the Navy Department in consultation with the Bureau of
Standards. The balls and rollers were obtained from commercial
manufacturers and were such as were considered suitable for this
use.1. BALLS
The hardened steel balls were 1.00, 1.25 and 1.50 inches diam-
eter. Four of each size were provided.
2. BALL RACES
The cost of making complete bearings was prohibitive. If,
however, complete bearings had been tested, the results could not
be used for a bearing having a different diameter, due to the impos-
sibility of measuring the load on the individual balls. Sections of
a complete race, only, were represented by small rectangular steel
blocks. These are shown in Figs. 1 and 4. Each block had a
cylindrical groove on one face, parallel to the opposite face, having
a radius slightly greater than that of the ball with which it was
to be used. These races were hardened and the groove ground to
the required radius. In an actual ball bearing, the axis of the
groove would be an arc of a circle about the axis of rotation.

Bureau of Standards Technologic Paper No. 201
Fig. i.—Measuring the static friction of a ball bearing
Fig. 2.—Measuring the static friction of a roller bearing

Bureau of Standards Technologic Paper No. 201
Fig. 3.
—
Measuring the deformation of a ball and race under load
!
'
Fig. 4.
—
Apparatus for measuring deformation of a ball and race

Ball and Roller Bearings 5
The experimental work was much easier because races having
straight grooves were used and it is believed that the results apply
with reasonable accuracy to bearings having a large diameter such
as are used for ordnance work.
Grooved races are used in practice as with them the area of
contact between the ball and the race is greater than is obtained
with plane races, and therefore the allowable load on the bearing
is increased. The load is without doubt a maximum for races
grooved to the same diameter as the ball; the friction, however,
would be excessive in a bearing of this kind. Two pairs of
races were therefore made for each size of ball. One had, per-
haps, the smallest practicable radius and the other was somewhat
greater. The ratios of groove radii to ball radii are given in
Table 1. These races were used both for the friction and the
load tests.
TABLE 1.—Ratio of Groove Radii to Ball Radii
Ball diameter, inchesSmallgroove
Largegroove
LOO 1.03
1.04
1.04
1.10
1.25 1. 12
1. 50 1. 12
3. ROLLERS
The rollers were of the flexible roller type. They were closed
helices made from steel bars of about 0.52 by 0.30 inch in cross
section. The length was about 5.25 inches and the internal
diameter about 0.65 inch. They were hardened and the external
cylindrical surface ground to about 1.25 inches diameter. These
rollers are shown in Fig. 2. Six were provided for these experi-
ments.4. ROLLER RACES
Two flat plates were used in the roller tests to represent bearings
having a large diameter. These are shown in Fig. 2. In order
to obtain data also upon bearings such as might be used—for
example, for gun trunnions—two segmental bearings having inner
diameters of 7 and 20 inches were made. The outer diameter
was, of course, greater than the inner diameter by twice the diam-
eter of the rollers. The smaller bearing is shown in Fig. 5. The
larger bearing is shown in Figs. 6 and 7. Each of these bearings
consisted of the inner race, two portions of the outer race, with
apparatus for holding these parts in their proper relative position
in a hydraulic testing machine having a capacity of 230 000

6 Technologic Papers of the Bureau of Standards
pounds. The smaller bearing is shown in the machine in Fig. 8.
Side plates furnished bearings for a shaft through the inner race
(see Fig. 7) constraining it to rotate about the axis of the bearing.
Two rollers, diametrically opposite each other, were used in each
of these bearings. As it was found that the rollers tended to
become displaced, so that their axes were not parallel to the axis
of the bearing, retainers or "cages" were made which rotated
about the same shaft as the inner race. One of these cages is
shown in Fig. 7. A lever attached to the shaft through the inner
race allowed the torque required to rotate the inner race to be
measured as shown in Fig. 8.
The bearing surfaces of all flat plates and bearings were hardened
and ground.5. HARDNESS AND DIMENSIONS
The hardness of all bearing parts was measured by the sclero-
scope, using the universal diamond pointed hammer. The dimen-
sions of the bearing surfaces were also measured. These data are
given in Table 2. In the case of the ball races it was found that
the ends of grooves were harder than the middle portion of the
groove. As the latter portion was used in the experimental workits hardness is given for the average value.
TABLE 2.—Dimensions and Hardness of Balls, Rollers, and Races
Diameter or
radius of
curvature
Scleroscope hard-ness
Specimen No.Diameter orradius of
curvature
Scleroscope hard-ness
Specimen No. Extremevariations
of
readings
Average
Extremevariations
of
readings
Average
Diameter of
balls
Inches
1.0003
1.2503
1.5000
.515
.515
.550
.550
.650
.650
.700
.700
.779
.778
.839
.843
62-69
57-63
64-70
62-92
65-95
65-86
60-93
69-89
63-90
70-92
61-91
64-67
60-91
71-93
71-91
66
60
68
At mid-
dle of
groove
62
65
65
60
69
63
70
61
64
60
71
71
Diameter of
rollers:
1
Inches
1.249
1.249
1.249
1.249
1.250
1.250
3.499
10. 000
11.252
11.252
4.750
4.750
Flat within
.0002
71-73
67-73
69-71
67-72
68-70
68-73
80-92
97-102
70-93
95-97
62-70
71-74
93-101
94-100
Do 72
Do. . . 2 70
3 70
4 70
5 69
31 . 6 70
32 Radius of inner
roller races:
43
33
34 86
35 44 99
36 Radius of outer
roller races:
39
37
38 81
27 40 96
28 41 66
29 42 73
30 Plates:
25 97
26 97

Bureau of Standards Technologic Paper No. 201
Fig. Apparatus for measuring the deformation of a roller in a race having aninner diameter of J inches
Fig. (>.- -Apparatus for measuring deformation of a roller in a race having an inner
diameter of 20 inches

Bureau cf Standards Technologic Paper No. 201
Fig. 7."'
—
Retainer for roller with inner race
Fig. -Apparatus for making static friction test of roller and races having aninner diameter of J inches

Ball and Roller Bearings
TABLE 3.—Static Friction of Ball (1 Inch Diameter)
Radius of races 0.515 inch Radius of races 0.550 inch
Load on ball, poundsFriction,
pounds
Ratio friction to
load Coeffi-
cient of
rolling
friction
Friction,
pounds
Ratio friction to
load Coeffi-cient of
Observedvalue
Graphvalue
Observedvalue
Graphvalue
rolling
friction
250 0.11
.23
.37
.51
.79
1.19
1.53
2.13
2.81
3.49
0.00044
.00046
.00049
.00051
.00063
.00079
.00087
.00107
.00125
.00140
0. 00044
.00046
.00049
.00054
.00063
.00075
.00089
.00105
.00123
.00140
0.00022
.00023
.00025
.00027
.00032
.00038
.00045
.00053
.00062
.00070
0.12
.31
.42
.62
.84
1.15
1.63
2.13
2.71
3.40
0.00048
.00062
.00056
.00062
.00067
.00077
.00093
.00107
.00120
.00136
0. 00048
.00052
.00056
.00062
.00068
.00078
.00092
.00106
.00120
.00135
0.00024
500 .00026
750 .00028
1000 .00031
1250 .00034
1500 .00039
1750 . 00046
2000 .00053
2250 .00060
2500 .00068
TABLE 4.—Static Friction of Ball (1.25 Inches Diameter)
Load on ball, pounds
Radius of races 0.650 inch
Friction,
pounds Observedvalue
Ratio friction to
load
Graphvalue
Coeffi-cient of
rollingfriction
Radius of races 0.700 inch
Friction,
pounds Observed Graphvalue value
Ratio friction to
load Coeffi-cient ofrolling
friction
250.
500.
750.
1000
1250
1500
1750
2000
2250
2500
0.12
.19
.35
.50
.69
.87
1.00
1.44
2.10
2.61
0.00048
.00038
.00047
.00050
.00055
.00058
.00057
.00072
.00093
.00104
0.00044
.00046
.00049
.00051
.00053
.00057
.00064
.00076
.00090
.00106
0.00028
.00029
.00031
.00032
.00033
.00036
.00040
.00048
.00056
.00061
0.14
.26
.43
.52
.66
.81
1.16
1.69
2.49
3.21
0.00056
.00052
.00057
.00052
.00053
.00054
.00066
.00084
.00111
.00128
0.00052
.00053
.00054
.00055
.00057
.00061
.00071
.00086
.00106
.00128
0.00032
.00033
.00034
.00034
.00036
.00038
.00044
.00054
.00066
TABLE 5.—Static Friction of Ball (1. 50 Inches Diameter)
Radius of races 0.779 inch Radius of races 0.841 inch
Load on ball, poundsFriction,
pounds
Ratio friction to
load Coeffi-cient of
rollingfriction
Friction,
pounds
Ratio friction to
load Coeffi-cient of
Observedvalue
Graphvalue
Observedvalue
Graphvalue
rolling
friction
250 0.15
.29
.42
.54
.69
.88
1.02
1.19
1.65
2.19
0.00060
.00058
.00056
.00054
.00055
.00059
.00058
.00060
.00073
.00088
0. 00055
.00056
.00056
.00056
.00057
.00057
.00059
.00064
.00072
.00086
0.00041
.00042
.00042
.00042
.00043
.00043
.00044
.00048
.00054
.00065
0.13
.27
.43
.52
.70
.90
1.02
1.17
1.60
1.95
0.00052
.00054
.00057
.00052
.00056
.00060
.00058
.00059
.00071
.00078
0.00054
.00054
.00055
.00055
.00056
.00056
.00058
.00062
.00069
.00080
0.00041
500 .00041
750 .00041
1000 .00041
1250 . 00042
1500 .00042
1750 .00044
2000 .00047
2250 .00053
2500 .00060
8 Technologic Papers of the Bureau of Standards
III. TESTS
1. STATIC FRICTION TEST ON BALL BEARING
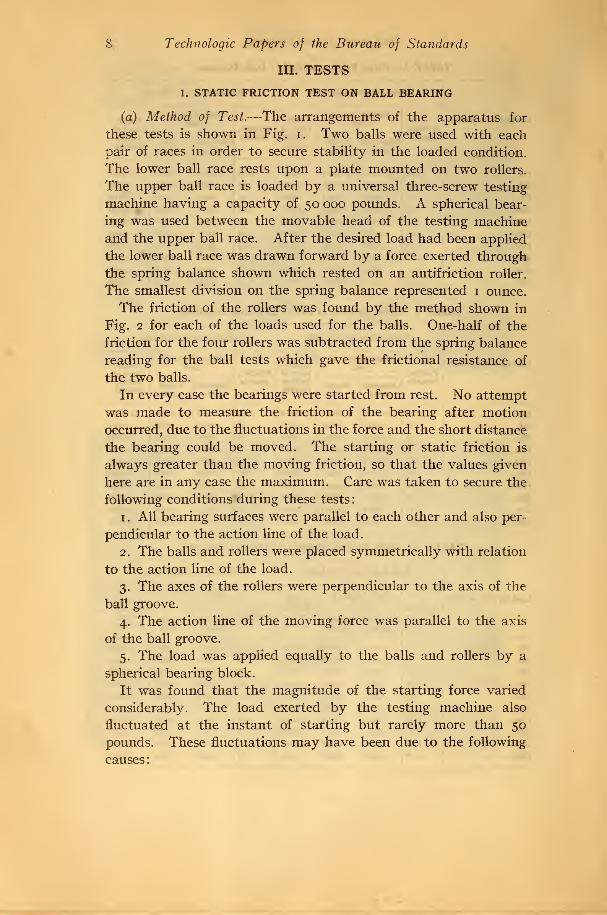
(a) Method of Test.—The arrangements of the apparatus for
these tests is shown in Fig. i. Two balls were used with each
pair of races in order to secure stability in the loaded Condition.
The lower ball race rests upon a plate mounted on two rollers.
The upper ball race is loaded by a universal three-screw testing
machine having a capacity of 50 000 pounds. A spherical bear-
ing was used between the movable head of the testing machine
and the upper ball race. After the desired load had been applied
the lower ball race was drawn forward by a force exerted through
the spring balance shown which rested on an antifriction roller.
The smallest division on the spring balance represented 1 ounce.
The friction of the rollers was found by the method shown in
Fig. 2 for each of the loads used for the balls. One-half of the
friction for the four rollers was subtracted from the spring balance
reading for the ball tests which gave the frictional resistance of
the two balls.
In every case the bearings were started from rest. No attempt
was made to measure the friction of the bearing after motion
occurred, due to the fluctuations in the force and the short distance
the bearing could be moved. The starting or static friction is
always greater than the moving friction, so that the values given
here are in any case the maximum. Care was taken to secure the
following conditions during these tests
:
1. All bearing surfaces were parallel to each other and also per-
pendicular to the action line of the load.
2. The balls and rollers were placed symmetrically with relation
to the action line of the load.
3. The axes of the rollers were perpendicular to the axis of the
ball groove.
4. The action line of the moving force was parallel to the axis
of the ball groove.
5. The load was applied equally to the balls and rollers by a
spherical bearing block.
It was found that the magnitude of the starting force varied
considerably. The load exerted by the testing machine also
fluctuated at the instant of starting but rarely more than 50
pounds. These fluctuations may have been due to the following
causes:

Ball and Roller Bearings 9
1. Slight variations in the diameter of the balls and the rollers
and variations in the surfaces of the races from the true cylinderor plane.
2. Nonuniform hardness of the bearing surfaces of the races.
(The balls and rollers were much more uniform in hardness thanthe races.)
The conditions under which these tests were made representideal rolling friction along a straight line. They are never ob-tained in practice, so that values in practice may be much larger,
SCO 1000 /J00 zooo zsoo
lcad //? fx?£//?e/f
Fig. 9.—Staticfriction test on i-inch ball and races (rl=o.ji5 M»cAi ^=0.550 inch)
due to the sliding friction which occurs. Even in these experi-ments there was some sliding friction, due to the fact that thearea of contact between ball and race, although small, was ap-preciable. It was also impossible to secure exact arrangement ofthe parts of the apparatus.
(6) Results.—the. results are given in Tables 3, 4, and 5 andin Figs. 9, 10, and 11. The values given in the tables for thefriction are the averages of several trials for slightly differentpositions of the balls, rollers, and races. The graph values are
57715°—21 2

IO Technologic Papers of the Bureau of Standards
obtained from the smooth curve drawn to represent the mostprobable values.
The coefficients of rolling friction were computed from the graph
values by the following formula:1
PdCoefficient of rolling friction = —^
2Qin which
:
P— = starting friction on one side for one ball or roller, in pounds.
d = diameter of ball or roller in inches.
Q = load on the ball or roller in pounds.
500 WOO fSOO ZOCO 2500
Fig. io.—Static friction test on i%-inch ball and races (rx=o.6^o inch, r2=o.?oo inch)
For some of these tests the balls, rollers, and races were well
coated with a good mineral lubricating oil. The observed values
of the friction, when this was done, appeared to be the same as
those obtained when no oil was used.
(c) Conclusions,— i. The starting friction is nearly the same
for both sizes of groove. The groove having the larger radius
gave the lowest value for the friction.
1 R. Thurston, A Treatise on Friction and Lost Work, p. 82, 1885.

Ball and Roller Bearings n
2. The ratio of starting friction to the load increases slowly as
the load increases, then much more rapidly. The critical loads
are approximately as follows:
Ball diameter in Critical load ininches pounds
r. oo I3°°
1-25 1700
1. 50 2200
If the frictional resistance is to be kept low, these critical loads
should not be exceeded. The very rapid rise in the friction at
\oa>//
'
\0CDOi
\
f Jk 0.0001
\\
ft
>
A$%
<
|i 1 j
I IP——"*"'r^( 1
^0.0003 i > 1
} r
%
500 /OOP /SOP ZOOO 2SO0
Fig. 11.
—
Static friction test on iyi-inch ball and races {r^—o.yyg inch, r2=o.84i inch)
greater loads would seem to indicate that internal work was being
performed on the material of either the balls or races which might
cause heating and their destruction if the bearings were operated
continuously under loads greater than the critical loads.
3. The ratio of frictional resistance to load is practically the
same for balls of all diameters up to the critical load and may be
taken as 0.00055. For this reason the coefficient of rolling fric-
tion as found from the above equation was of little use in these
tests.
4. Oil is of little, if any, use upon ball bearings in reducing the
static frictional resistance.

12 Technologic Papers of the Bureau of Standards
2. STATIC FRICTION TEST ON ROLLER BEARING
(a) Method of Test.—The static friction of the rollers loaded
between two steel plates was measured as for balls. The arrange-
ment of apparatus is shown in Fig. 2.
The tests of static friction for the two segmental bearings were
made in a hydraulic testing machine having a capacity of 230 000
pounds.
The arrangement of the apparatus for the smaller of these
bearings is shown in Fig. 8. Two rollers diametrically opposite
1«\
t1
1kactzb\\
h3
—
—
s: < 1
1
O.0OC&
500 zax? 23X>IOC& /SCO
Fig. 12.
—
Staticfriction test of i%-inch rollers and plates
each other were used for each test. These were held in the
retainers shown in Fig. 7.
The lever shown in Fig. 8, used for rotating the bearings under
load, was 41 inches from the center of rotation to the point of
application of the force. This lever was counterbalanced by one
of equal length extending in the opposite direction. The force wasapplied through a spring balance, the smallest graduation of
which represented 0.5 pound. Care was taken that the action
line of the force was perpendicular to the lever arm. The observed
force was used to compute the equivalent frictional force required
to cause rotation if applied at the surface of the inner race.
(b) Results.—The results for these tests are given in Tables 6
and 7 and in Figs. 12 and 30. The values given for the friction
are the averages of at least five determinations for each load, as
it was found that the friction fluctuated considerably, depending
on the position of the rollers with respect to the plane through the

Ball and Roller Bearings 13
axis of the bearing. This was particularly true with the smaller
bearing for which it was very difficult to secure satisfactory
readings. This was due probably to the condition of unstable
equilibrium of the whole system which existed during these tests
and which was beyond the control of the experimenter.
This is the only explanation of the unexpected character of the
curve for the smaller bearing in Fig. 30. Several other conditions
such as inaccuracies in or nonuniform hardness of the bearing
surfaces also affected the friction.
Comparison of the scleroscope hardness values for these bear-
ings as given in Table 2 shows that the smaller bearing averaged
about 78, while the larger bearing averaged about 94. It seems
very probable that the low hardness values for the small bearing
had an important influence on the friction of this bearing.
The coefficient of friction in Table 7 was computed by the
formula given above.
TABLE 6.—Static Friction of Roller (1.25 Inches Diameter Between Plates)
Load on roller, poundsFriction,
Ratio of friction to theload
pounds Observedvalue
Graphvalue
0.09 0.00036 0.000400
.20 .00040 .000405
.31 .00041 .000410
.42 .00042 .000415
.54 .00043 .000420
.65 .00043 .000425
.75 .00043 .000430
.85 .00042 .000435
1.01 .00045 .000440
1.14 .00046 .000445
Coefficientof rolling
friction
250
500
750
1000
1250
1500
1750
2000
2250
2500
0.000250
.000253
.000256
.000259
.000262
. 000265
.000268
.000271
.000274
.000277
TABLE 7.—Static Friction of Roller (1.25 Inches Diameter)
Radius of inner race 3.5 inches ' Radius of inner race 10.0 inches
Load on roller, poundsFriction,
pounds
Coefficient of rolling
frictionFriction,
Coefficient of rollingfriction
Observedvalue
Graphvalue
pounds Observedvalue
Graphvalue
5000 8.8
29.3
58.5
87.8
120.0
170.0
234.4
316.5
0.00110
.00183
.00244
.00275
.00300
.00354
.00366
. 00396
0.00110
.00190
.00245
.00275
.00305
. 00330
.00378
. 00420
6.1
12.3
19.5
26.6
34.8
53.3
92.3
153.7
0.00076
.00077
.00081
.00083
.00087
.00110
.00144
.00192
0.00075
10 000 .00077
15 000 .00080
20 000 . 00083
25 000 . 00091
30000 .00105
40 000 .00145
50000 00192
14 Technologic Papers of the Bureau of Standards
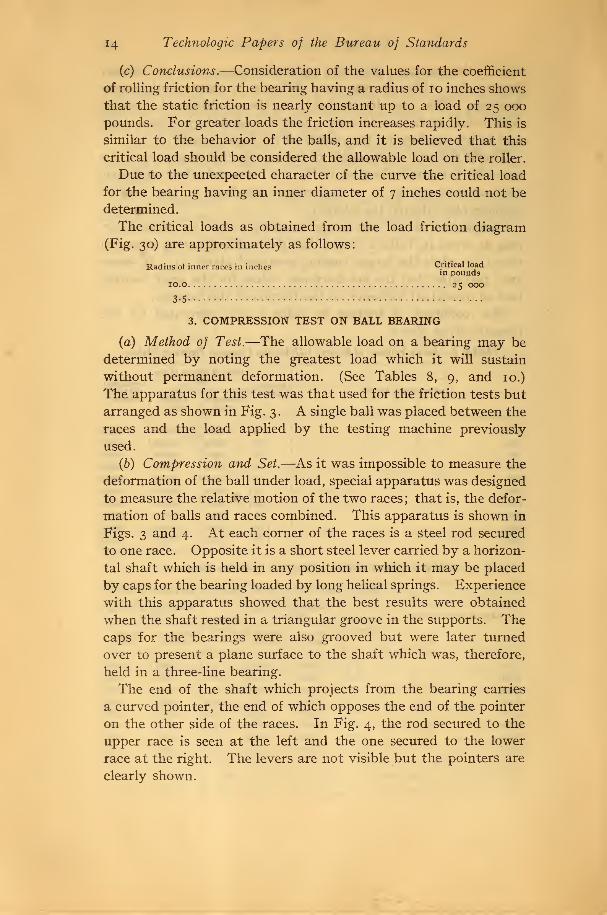
(c) Conclusions.—Consideration of the values for the coefficient
of rolling friction for the bearing having a radius of 10 inches shows
that the static friction is nearly constant up to a load of 25 000
pounds. For greater loads the friction increases rapidly. This is
similar to the behavior of the balls, and it is believed that this
critical load should be considered the allowable load on the roller.
Due to the unexpected character cf the curve the critical load
for the bearing having an inner diameter of 7 inches could not be
determined.
The critical loads as obtained from the load friction diagram
(Fig. 30) are approximately as follows:
Radius ot inner races in inches Critical loadin pounds
IO.0 25 OOO
3-5
3. COMPRESSION TEST ON BALL BEARING
(a) Method of Test.—The allowable load on a bearing may be
determined by noting the greatest load which it will sustain
without permanent deformation. (See Tables 8, 9, and 10.)
The apparatus for this test was that used for the friction tests but
arranged as shown in Fig. 3 . A single ball was placed between the
races and the load applied by the testing machine previously
used.
(b) Compression and Set.—As it was impossible to measure the
deformation of the ball under load, special apparatus was designed
to measure the relative motion of the two races ; that is, the defor-
mation of balls and races combined. This apparatus is shown in
Figs. 3 and 4. At each corner of the races is a steel rod secured
to one race. Opposite it is a short steel lever carried by a horizon-
tal shaft which is held in any position in which it may be placed
by caps for the bearing loaded by long helical springs. Experience
with this apparatus showed that the best results were obtained
when the shaft rested in a triangular groove in the supports. The
caps for the bearings were also grooved but were later turned
over to present a plane surface to the shaft which was, therefore,
held in a three-line bearing.
The end of the shaft which projects from the bearing carries
a curved pointer, the end of which opposes the end of the pointer
on the other side of the races. In Fig. 4, the rod secured to the
upper race is seen at the left and the one secured to the lower
race at the right. The levers are not visible but the pointers are
clearly shown.

Ball and Roller Bearings 15
In use, the pointers are turned away from each other, the
desired load is applied to the bearing, then the pointers are turned
toward each other by hand so that each lever comes in contact
with the corresponding rod. The distance between the two
pointers is then measured by the micrometer microscope shown
in Fig. 3. The arrangement of this apparatus is such as to give
correct values, even if the races are slightly tilted during the test.
The total deformation of ball and race combined under load maybe obtained as well as the permanent deformation after removing
the load. The pointers multiplied the movement of the levers
10 times. The arrangement of the pointers, in pairs, made the
change in distance between pointers 20 times the change in the
distance between the races.
TABLE 8.—Compression Test of Ball (1 Inch Diameter)
Load in Radius
Total deformation of balland races
Permanent set
of ball andraces
Contact area
pounds of racesOb-
servedvalue
Graphvalue
Hertzvalue
Ob-servedvalue
Graphvalue
2a 2b2b
(Hertzvalue)
Area
500
Inch
0.515
.550
.779
.515
.550
.779
CO
.515
Inch
0.00079
.00097
Inch
0.00088
.00099
Inch
0.00112
.00112
Inch
0. 00003
.00003
Inch
0. 00002
.00003
Inch Inch Inch Inch2
1000 .00140
.00170
.00156
.00172
.00179
.00177
.00006
.00007
.00006
.00007
0.292
.188
.098
.056
0.038
.043
.051
.056
0.040
.040
0.0087
.0058
• 0039
.056
1500 .00212 .00213
.00233
.00234
.00232
.00013
.00014
.00012
. 00014. 550 • 00231
.779
.515
.550
.779
00
.515
.550
.779
.515
.550
.779
00
.515
.550
.779
.515
.550
.779
CO
2000 . 00265
. 00283
.00264
.00287
.00283
.00282
.00021
.00023
00021
.00024
.360
.245
.122
.073
.050
.058
.070
.073
.050
.052
• 0141
.0112
0067
.072 0042
2500 .00314
.00336
.00310
.00336
.00329
.00327
. 00033 . 00032
. 00038 . 00037
3000 .00355
. 00382
.00352
.00382
.00371
.00369
.00048
.00054
.00047
.00053
.397
.273
.134
.083
.057
.067
.080
.083
.058
.058
.0178
.0143
.0084
.082 0054
3500 .00397
.00425
.00393
.00425
.00412
.00409
.00067
.00075
.00067
.00077
4000 .423
.288
.141
.089
.062
.073
.084
.089
.064
.06-1
.0206
.0165
• 0093
.090 .0062
1
-~
i6 Technologic Papers of the Bureau of Standards
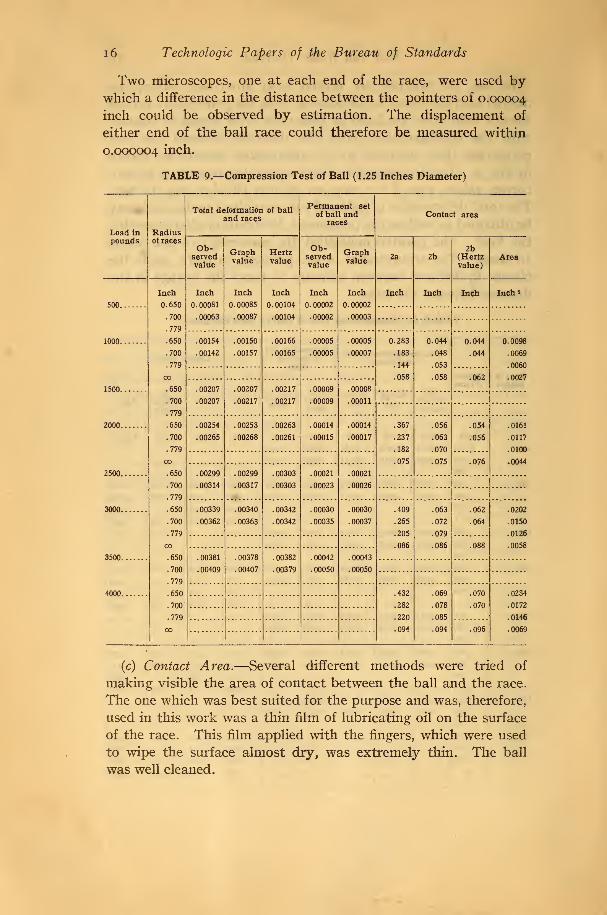
Two microscopes, one at each end of the race, were used bywhich a difference in the distance between the pointers of 0.00004
inch could be observed by estimation. The displacement of
either end of the ball race could therefore be measured within
0.000004 inch.
TABLE 9.—Compression Test of Ball (1.25 Inches Diameter)
Load in Radiusof races
Total deformation of ball
and races
Permanent set
of ball andraces
Contact area
poundsOb-
servedvalue
Graphvalue
Hertzvalue
Ob-servedvalue
Graphvalue
2a 2b2b
(Hertzvalue)
Area
500
Inch
0.650
.700
.779
.650
.700
.779
00
.650
.700
Inch
0. 00081
.00063
Inch
0. 00085
.00087
Inch
0.00104
.00104
Inch
0. 00002
.00002
Inch
0. 00002
.00003
Inch Inch Inch Inch*
1000 .00154
.00142
.00150
.00157
.00166
.00165
.00005
.00005
.00005
.00007
0.283
.183
.144
.058
0.044
.048
.053
.058
0.044
.044
0.0098
.0069
.0060
.062 .0027
1500 .00207
. 00207
.00207
.00217
.00217
.00217
.00009
.00009
. 00008
.00011
.779
2000 .650
.700
.779
00
.650
.700
.779
.650
.700
.779
00
.650
.700
.779
.650
.700
.779
00
.00254
.00265
.00253
.00268
.00263
.00261
.00014
.00015
.00014
.00017
.367
.237
.182
.075
.056
.063
.070
.075
.054
.056
.0161
.0117
.0100
.076 .0044
2500 .00299
.00314
.00299
.00317
.00303
.00303
.00021
. 00023
.00021
.00026
3000 .00339
.00362
.00340
.00363
.00342
.00342
.00030
. 00035
. 00030
.00037
.409
.265
.205
.086
.063
.072
.079
.086
.062
.064
.0202
.0150
.0126
.088 .0058
3500 .00381
.00409
.00378
.00407
. 00382
.00379
.00042
.00050
. 00043
.00050
4000 .432
.282
.220
.094
.069
.078
.085
.094
.070
.070
.0234
.0172
.0146
.096 .00691
(c) Contact Area.—Several different methods were tried of
making visible the area of contact between the ball and the race.
The one which was best suited for the purpose and was, therefore,
used in this work was a thin film of lubricating oil on the surface
of the race. This film applied with the fingers, which were used
to wipe the surface almost dry, was extremely thin. The ball
was well cleaned.

Ball and Roller Bearings
TABLE 10.—Compression Test of Ball (1.5 Inches Diameter)
17
Load in Radiusof races
Total deformation of ball
and races
Permanent set
of ball andraces
Contact area
poundsOb-
servedvalue
Graphvalue
Hertzvalue
Ob-servedvalue
Graphvalue
2a 2b2b
(Hertzvalue)
Area
Inch
500 ' 0.779
Inch
0.00071
.00078
.00126
.00149
Inch
0.00072
.00082
.00131
.00147
Inch
0.00098
Inch
0.00002
Inch
0.00002
Inch Inch Inch Inch J
.841 . 00098 - 00003 . 00003 L1000 .779
.841
.00156
.00155
. 00005 . 00005
.00005\
.00006
0.270
.189
.059
0.045
.049
.059
0.046 0.0096
.0075
.0027.064
1500j
.779 .00177
.00203
.00225
.00256
.00182j
.00204
.00205j
.00203
.00228j
.00247
.00257|
.00246
.00007;
.00007
.00009 ' .0000Q.841
2000 ' .779
.841
.00011
.00014
.00012
.00014
.373
.249
.058
.065
.058 .0170
.0127
.080 : .080
I
.082 .0050
2500 1 .779 .00272
.00305
.00311
•0034S
.00271 .00287 .00016
.00021
.00022
.00028
.00016
.00020
.00022
.00028
.841 00303
.00311
.00349
.00285
.00324
.00322
30001
.779
.841
.427
.285
.094
.065
.075
.094
.066 .0218
.0168
.094 .0069
3500 ! .779 .00349
.00395
.00348 .00359
.00393|
.00357
.00030 .00029
.00038 .00038.841
4000|
.779 .458
.309
.103
.072
.083
.103
.074 .0258
.841I
.0201
er> .104 .0083
! 1 1
TABLE 11.—Compression Test of Balls
Total deformation of ball and races
Load on ball, In pounds
Ball, 1 inch diam-eter; radius of
races, 0.550 inch
Ball, 1.25 inch di-ameter; radius of
races, 0.700 inch
Ball, 1.5 inch di-ameter; radius ofraces, 0.841 inch
Observedvalue
Graphvalue
Observed 1 Graphvalue ' value
Observedvalue
Graphvalue
500
Inch Inch
0.00080
.00445
.00753
. 01040
.01320
.01600
.01870
.02145
Inch Inch
0.00080
.00430
Inch Inch
0.00080
4 000 0.00376
.00671
.00950
.01231
.01528
.01790
.02087
0. 00389 0. 00348
.00618
.00844
.01066
.01277
. 01482
.01698
.01806
00420
8 000 .00679|
.00740
.00932 .01010
.01167 0125D
00690
12 000 .00930
16 000 .01150
20 000 .01367
.01598
.01834
. 02070
. 01475
.01695
.01915
.02125
01360
24 000 01570
28 000 01775
32 000 01875
The area of contact between the race and the ball was dis-
tinctly visible, as it appeared darker than the surrounding surface.
57715°—21 3
1
8
Technologic Papers of the Bureau of Standards
The edges of this area were sharply defined. The thickness of
the oil film was estimated by drawing a ball lightly across an
oiled plate and measuring the width of the dark band. Knowingthe diameter of the ball, the angle subtended by the band at the
center of the ball was easily computed, and from this the versine
of half this angle. This, multiplied by the radius of the ball, wasassumed to be the thickness of the oil film. The area of contact
was measured by means of a microscope reading (by estimation)
to 0.0004 inch.
After applying the load to the ball resting on the oiled surface,
the ball was removed and the total area of contact was computed.
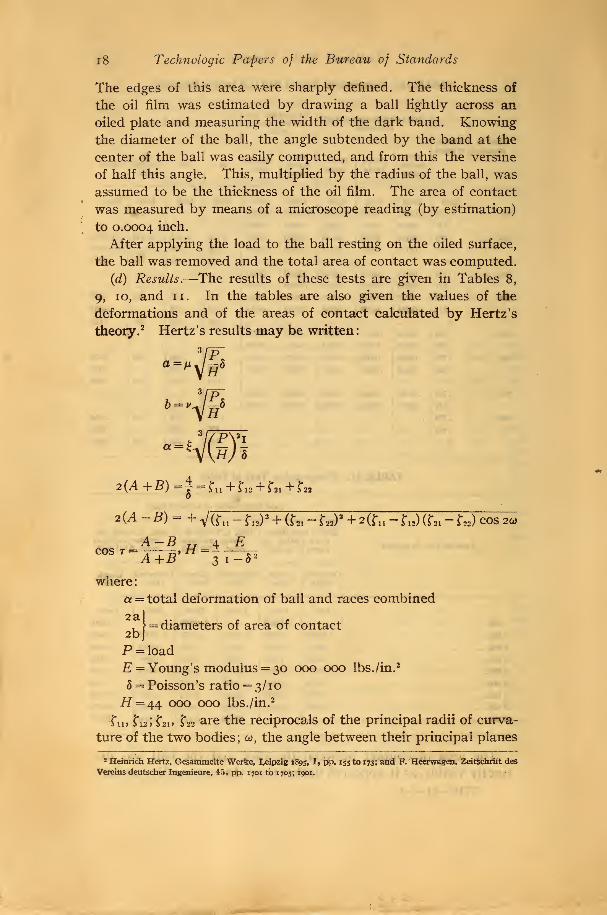
(d) Results.—The results of these tests are given in Tables 8,
9, 10, and 11. In the tables are also given the values of the
deformations and of the areas of contact calculated by Hertz's
theory.2 Hertz's results may be written:
a =M^J
•*-./£*H
a=H/(0J
2(A+B)=|==ru+f12 +r21 +f2
A-B .„ 4 Ecos t = A , ,.,> H = ^
— diameters of area of contact
2(A-5)=+V(ril -f12)3H-(f21 ^f22)3 + 2 (fll
--ri2)(r21
-r22)cos2a,
A-B H ^4 EA+B 3i-5 2
where:
a = total deformation of ball and races combined
2a
2b
P = load
E = Young's modulus = 30 000 000 lbs./in. 2
5 = Poisson's ratio = 3/10
H = 44 000 000 lbs./in. 2
?n> tnit211 J*22 are the reciprocals of the principal radii of curva-
ture of the two bodies; 03, the angle between their principal planes
2 Heinrich Hertz, Gesammelte Werke, l^eipzig 1895, 1, pp. 155 to 173; and F. Heerwagen, ZeitSchrift des
Vereins deutscher Ingenieure, 45, pp. 1701 to 1705; 1901.

Ball and Roller Bearings 19
of curvature and n, v and £, transcendental functions of the auxil-
iary angle r, expressed in terms of elliptic integrals, m, v and £
have been taken from the tables of Hertz and Heerwagen and are
given below in Table 12 which was prepared by Dr. L. B.
Tuckerman.
TABLE 12.—Coefficients for Hertz's Theory
T M V i
2.731
2.397
2.136
1.926
1.754
1.611
1.486
1.378
0.493
.530
.567
.604
.641
.678
.717
.759
1.453
1.550
1.637
1.709
1.772
1.828
1.875
1.912
50 degrees
70 degrees.
75 degrees.
80 degrees.
85 degrees.
90 degrees.
95 degrees.
100 degrees
M f
1.284 0.802
1.202 .846
1.128 .893
1.061 .944
1.000 1.000
.944 1.061
.893 1.128
1.944
1.967
1.985
1.9%
2.000
1.996
1.985
The values of total deformation approach closely those given
by theory as shown in Figs. 20, 21, and 22. The existing differ-
ences may be explained by the nonuniform hardness, the differ-
ence between the actual and the assumed elastic properties of the
material, and in addition by the fact that the major diameter of
the area of contact is not as assumed by the theory, very small
in comparison with the diameter of the ball. The same is true
for the area of contact.
These tests show that the radii of the races influence the amountof the total deformation and of the permanent set more than the
theory would indicate and in the opposite direction, that is, the
larger the radii of races, the greater the deformation.
The total deformation of the ball was not measured separately
but the direct measurements of the set of the races and the ball
showed that the permanent set of a ball even for a load of 30 000
pounds does not exceed 0.00020 inch for i>£-inch diameter ball nor
0.00015 inch for a i-inch diameter ball. Thus the permanent set
observed is due almost exclusively to the races. The carrying
capacity of balls with races given in Tables 13 and 14 are therefore
limited by the deformation of the races. If the races had been
harder, the values would have been higher. The theoretical value
of 2a (the major diameter of contact area) is not given in the
tables since it is so large that even approximate agreement could
not be expected.

20 Technologic Papers of the Bureau of Standards
The values for the area of contact are plotted in Figs. 13, 14,
15, 16, and 17. Those for the deformation are shown in Figs.
20, 21, 22, and 23. The tests showed that even up to very high
loads, far beyond those actually used in practice, the law of
strains does not undergo any sharp change. The total deforma-
tion of ball and races follows pretty closely the law of a straight
line with only a slight tendency to decrease gradually with an
increase of load. The permanent set follows, also, the law of a
Q40L
Q300
O.ZOL
awo
a/a?
Fig. 13.
£oad //? pounds
-Area oj contact of I-inch ball and races (r1=o.jlj inch, r2—0.550 inch,
r3=o,770 inch, r4=oo)
straight line but tends to increase gradually with an increase of
load.
(e) Conclusions.—The allowable load on balls, as far as the
permanent set is concerned, is limited to the load, which if in-
creased, will produce a permanent set of either the balls or races,
which would cause the bearing to fail to function properly. The
permanent set will, in practice, first occur, probably, in the races.
As the permanent set of the races grows very gradually, there is
no definite indication of this load limit so that any limit selected
is more or less arbitrary.

Ball and Roller Bearings 21
If we select o.oooi inch 3 as the allowable permanent set of a
race, we have from these tests the values of Table 13 for the
carrying capacities of balls.
FlG. 14.
—
Area of contact of1%-inch ball and races (r1=o.6jO inch, r.,=o.yoo inch, r3
=o.yyginch, rA —<x>)
TABLE 13.—Carrying Capacities of Balls with Races
Diameter of ball
Radius of race Allowable load
ri tz ri ra
100 inch
Inch
0.515
.650
.779
Inch
0.550
.700
.841
Pounds
2000
2500
2800
Pounds
1800
1. 25 inches 2300
2500
A comparison of these values, with those given by the static
friction test, shows that they are about 30 per cent larger. Theallowable load on a ball may also be computed from the formula,
P=cd 2, derived by Prof. Stribeck, 4 in which P is the load on the
ball in kilograms; d is the diameter of the ball in centimeters,
3 This value is often used as the allowable variation in the diameter of balls for bearings.
4 Zeitschrift des Vereines deutscher Ingenieure, 45, p. 79; 1901.

22 Technologic Papers of the Bureau of Standards
Fig. 15.
—
Area ofcontact ofi%-inch ball with races {rx—o.y
f/ginch, r2=o.84i inch, rs— 00
)
1000 2ffl? 3OO0 4QMLazcJ //? pounds
Fig. 16.
—
Area ofcontact of ball and plates {a—l-inch, b=l}i-inch, c=i%-inch diameter)

Ball and Roller Bearings 23
!$ 0.4a
o.jw
\ aza\
C$ o./ao
Q/OALoad //? /?a>e//?ds
Fig. 17.
—
Area ofcontact of ball and races ofradius o.yyg inch
Curve 1 for iM-inch ball, curve 2 for iK-iuch ball, and curve 3 for i-inch ball
Fig. 18.—A
100a? x>cco soav 7oax? 900a?
L Ood //? pot/rtds
rea of contact of a 1%-inch roller between races of 3.3 inches and of 4.75 inches
Curve 1, outer race; curve 2, inner race
24 Technologic Papers of the Bureau of Standards
]
1̂0.030
\\ o.ox
a o/o I
/oooc? soon?3000V 50C&? 7000&
Lead'//?pau/rtfy
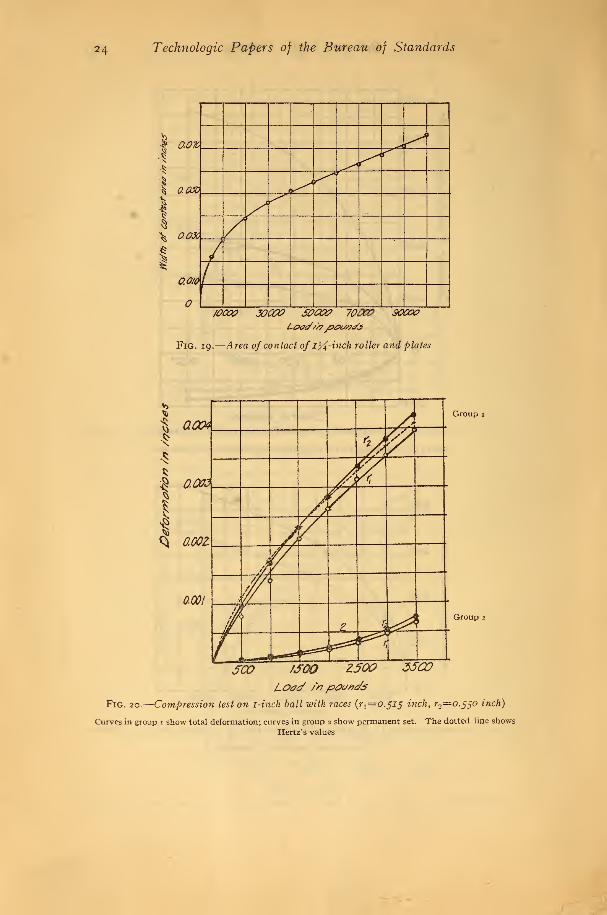
FlG. 19.
—
Area of contact of' 1%-inch roller and plates
aax
0.003
Q 0.001
0,001
Group 1
Group 2
SCO fSOO Z50O
Loed topounds
35CD
Fig. 20.
—
Compression test on i-inch ball with races (^=0.515 inch, ^—0.550 inch)
Curves in group 1 show total deformation; curves in group 2 show permanent set. The dotted line shows
Hertz's values

Ball and Roller Bearings 25
aax / 1
1 JK>5 aw AV
ft;
1 V1
^ QCOZ
% 4
oa?/ f1 2 •/£,
*|/COP 2GO? 3GC0 400?
Fig. 2i.
—
Compression test on i%-inch ball with races (rx—0.650 inch, r2=o.yoo inch)
Curves in group 1 show total deformation; curves in group 2 show permanent set. The dotted line shows
Hertz's values
/ax? zoa? 3000 40Z>
Fig. 22.
—
Compression test on 1%-inch ball and races {rx —0.yjg inch, r2=o.84i inch)
Curves in group 1 show total deformation; curves in group 2 show permanent set. The dotted line shows
Hertz's values

26 Technologic Papers of the Bureau of Standards
and c is a constant depending on the material. This formula
gives the following approximate values:
Diameter of ballC= 100
AllowableloadP
C= 150AllowableloadP
1.00 inch
Pounds
1400
2200
3200
Pounds
2100
3300
4800
The values for P have been converted into English units.
In Table 14 are given, for comparison, the values of allowable
load, as found from the friction test, compression test, and those
found by Stribeck's formula. It will be seen that the lowest
values of the load are obtained from the friction test. These
values should, probably, be used in design if the efficiency of the
bearing is of importance. The larger values obtained from the
compression tests may be, however, used before rapid deteriora-
tion of the bearings will result.
TABLE 14.—Carrying Capacities of Ball Bearings
Radius of
races
Allowable load, ball with races
Diameter of ballFriction
test
Compres-sion test
Stribeckformula(c=100)
1 inch
Inch
0.515
.550
.650
.700
.779
.841
Pounds
}1300
} 1700
J2200
Pounds
f 2000
{ 1800
f 2500
1 2300
J2800
1 2500
Pounds
}1400
f2200
J3200
1. 25 inches
4. COMPRESSION TEST ON ROLLER BEARING
(a) Method of Test.—These tests were made in the same manner
as the compression tests for balls. The arrangement of the appa-
ratus for the compression tests with the bearing having the smaller
diameter is shown in Fig. 5. The two opposed pointers attached
to the outer and inner race, respectively, were used to measure
the deformation of the roller and races combined. A micrometer
microscope was used at both ends of the roller to measure the dis-
tance between the ends of the pointers. The load was applied
with a testing machine having a capacity of 100 000 pounds.

Ball and Roller Bearings 27
The compression tests with the bearings having the larger
radius were made in a hydraulic testing machine having a capacity
of 2 300 000 pounds in compression. The apparatus is shownin Fig. 6. Two dial micrometers were used to measure the defor-
mation. The smallest division of these micrometers is 0.00
1
inch and fifths of a division could be estimated . A similar arrange-
ment was used in testing the rollers between plates and the sametesting machine and measuring apparatus were used. With this
apparatus some compression tests were carried beyond the elastic
limit of the rollers and, from the stress diagrams, the proportional
limit was obtained.
(6) Results.—The data for the compression tests of rollers are
given in Tables 15, 16, 17, and 18. The deformations are in each
case the values for both roller and race. The theoretical values
given in the tables are computed according to the formula of
Hertz given above. The results are plotted in Figs. 24, 25, and
26, which show the relation of the deformation to the load. Figs.
18, 19, and 27 show the relation of area of contact to the load.
The stress diagrams are shown in Figs. 28 and 29.
Inspection of the rollers and races showed that unlike the results
with ball bearings the permanent set of the races was quite negligi-
ble compared with the permanent set of the rollers. Measurements
of the diameters of a roller which had been broken under compres-
sive loading show that the diameter at the middle of the length
of the roller parallel to the line of application of the force was
reduced, that perpendicular to the action line of the force it was
increased. This was to be expected. Both these diameters at
the ends of the rollers were reduced. This behavior seems to
show that the ends of the rollers twist under load so as to decrease
the diameter. It follows that the ends of a " flexible " roller carry
less load than the middle portion.
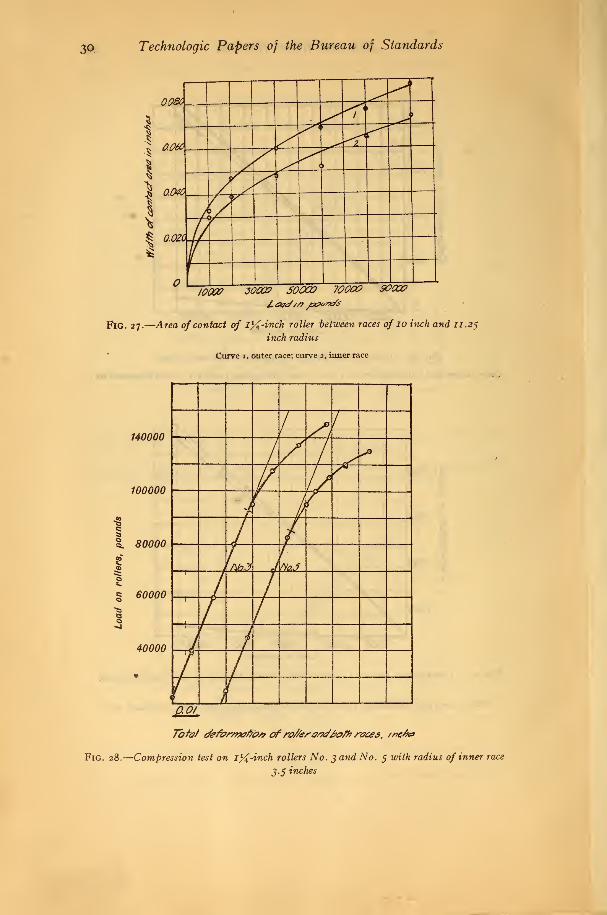
(c) Conclusions.—The maximum load for a flexible roller (1.25
inches diameter and 5.25 inches long) is 135 000 pounds. This
is the proportional limit for these rollers. It is believed that this
value tends to become smaller as the radius of the races increases.
It should be noted that the critical load found from the friction
tests was only 25 000 pounds, a much lower value.

28 Technologic Papers of the Bureau of Standards
Q0& * <*
i
k*i
%% QO/6
\/ /«|
5;
£ aotz
%4*
/.,
0.0C4 4 #:M<2 ,--
i^ W>'\
40CO I20CX? 20CC& 26GCOLoad//?f?av/?d£
Fig. 23.—Heavy compression test on i-inch, 1%-inch, and lyi-inch balls and races of
0.550-inch, o.ioo-inch, and 0.841-inch radius
Curves tn group 1 show total deformation; curves in group 2 show permanent set; curve o is the test on the
i-inch ball, curve b is on the 154-inch ball, curve c on the iK-inch ball
A>
QO/A -> ///
/*//t
nnin '/r/>yz
nnott
jii/ymi. 11 1 —30000 & 70ax? sciO(Z>
Fig. 24.
—
Compression test on 1%-inch roller between races 0/3.5 incn and 4-75inch radius
Curve 1 shows total deformation, curve 2 shows elastic deformation, and curve 3 shows the permanent set
Ball and Roller Bearings
0.0/6 /
f0.0/2
\j
0003
Vz
a004
o3—
—
*—
-
/aW 3&W SOOZ? 70O& SOCC&L c?ad/>7pounds
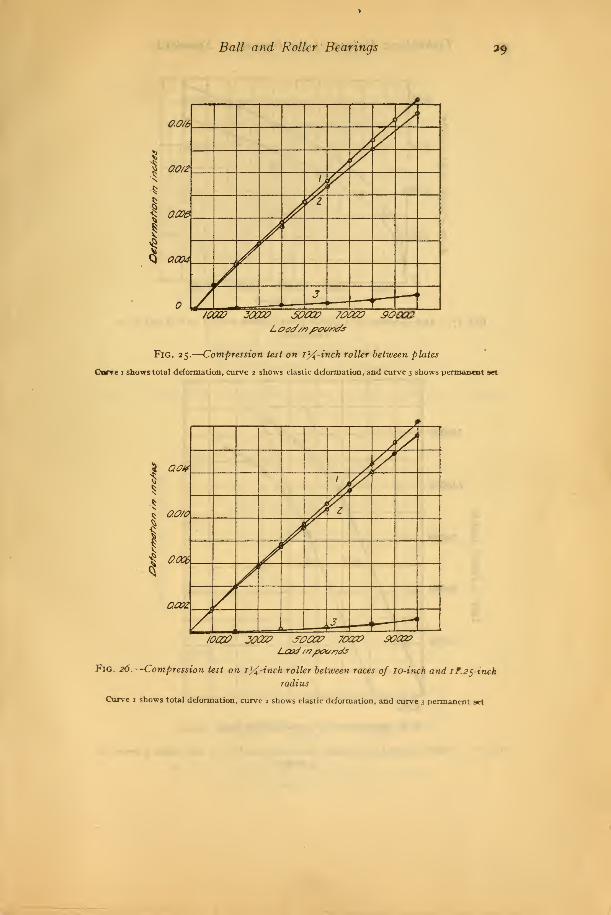
Fig. 25.
—
Compression test on 1%-inch roller between plates
Curve 1 shows total deformation, curve 2 shows elastic deformation, and curve 3 shows permanent set
/<?
J GO¥
1/
^ O.O/O 'Z
\
i
t 0.0&
\
QCVZ
—
.
I.
L^—/OCCV 30QZ> SOOOP 70QZ? 30CC&
Lead//7/xx/nJj
Fig. 26.—Compression test on i^-inch roller between races of 10-inch and if. 25-inch
radius
Curve 1 shows total deformation, curve 2 shows elastic deformation, and curve 3 permanent set
3Q Technologic Papers of the Bureau of Standards
"JqqW 3QO& 500CO 700CX? 90QZ?
Fig. 27.
—
Area of contact of 1%-inch roller between races of 10 inch and 11.2$
inch radius
Curve 1, outer race; curve 2, inner race
140000
100000
§ 60000
40000
0.0/
Tofa/ efef&m&fri?/? of ro//erar^^o/h races, /*cfa»
Fig. 28.
—
Compression test on 1%-inch rollers No. 3 and No. 5 with radius of inner race
3.5 inches

Ball and Roller Bearings 3i
ZOOGZ
X\ Moat
l\
I\j20az
V
\^ socco
i
fib6A
//Vol t
J1 f
40000 / /
/ /\
(•
if
ao/i
7bto/ defor/7?0f7£"? afra//er0/vfJ&7'/7 /trees,/>&/?£*
Fig. 29.
—
Compression tests on 1%-inch rollers No. 6 and No. J with radius of inner race
10 inches
0,004
!v 0,003
\ O.OOZ
0.001
Xc
/ A"jr. \
>-1
1 z
6
/OOOO 3oaz> 50000
Fig. 30.
—
Staticfriction test on i^-inch roller and races
Curve 1, r=3.s inches; curve 2, r=io.o inches

32 Technologic Papers of the Bureau of Standards
I
:i
-a®«— 5
§iJ«J
© B oPi
Sly
HIS
5«5SotJ
-6-SaJt
0>
• "2s
5*5
*5l
m.2
a «
Ofc«M *
O O W!
O 1-H
mom O 00 vo o> cmcm co m t-- a\cm cm cm cm cm
« CM O © CM *3- t— lO CO t-4 Ot
•JStHCMCMCMCOCOCOCOCO-*
o © © © © to ol-H »-« CM CM CM CM
« o o io*-< t-( CM O© CM Tj- lONNNNNN(0(0
oooooooooo
v©Ot00tO©tOOtCOC>«T-4coM-totor^r>.r-oocootJ30000000000
© oo •*_ CM CO COJ3 O O ©
o * w n * a n*• •« <* to to to voo © o © o © ©
N » V> Ol * N_ cm co t»- •«• to to& © © © © © ©
co »-i
s s
© CO 00
•g88§88888§0©O©O©©O©©«t a\ \o •&O rt H N «
vo _ o\
©s
©s i© 8o
o
3\3
05
••2
oof»co.-ioooot^ooo_o\cof-»ncoTHoovo-<i-co.CJgCOtOt^OVi-ICM^VOCO
CM © r-l O * Ooo r- to co © ooCO lO t-» 0\ ^H CMO O O O »-i »-lo o o © © ©
o o o o © © ©o © © © © o o© © © © o o o»-! CM CO •* to VO t>» S 2

Ball and Roller Bearings 33
c*
O © vO t- U1 m
1°
© o oOi m eg _Oicovoo0t-icou->r~Oi-Hi-i»-«CJ<M«MfVl
(Up O
lip
alls
«J2
*iss
0?
8S2n io n oCMCOCJCOCOCOCOCOc^ cti r^
© co O© vO COOl N VIO <-H —
<
C-» © m vO
.d ~ ^ x;
t-- © © O © m ©O CO ^H Ol t- o *N * lO N Ol H NN N N N N « n
PJ O vO cq_ CM CO CO «•,rj © o o o "3- VO m lO lO vOo o o o o o
•^vo^-ovo^Hioo«r»co *i- m o io t> * r-» oo oo oooooooooooo
s I o o o o o o
Ol * OO N * Ol N«j- m vr> vo vo v© r--o o o o o o o
*2l
— c *>
Pi
0?
0!5«
CO 00 CO O O CO
3 8n n * m n oo h- o o -*
g § §8 S 8
§??N * Ul N Ol
00 W> CO -f UO<M © 00 VO
8 8 oooooooo
co to
8 8
O Cl 00 ^ CO o ^r» •* co o oo r-» vnt-» Ol *-l CO *• \o 00O ©«-»-< »H «-( »-lo o o o © o o
©ooooooooooooooooo©ooooooooooooooooHNK<tmiOC>C0 B 2
34 Technologic Papers of the Bureau of Standards
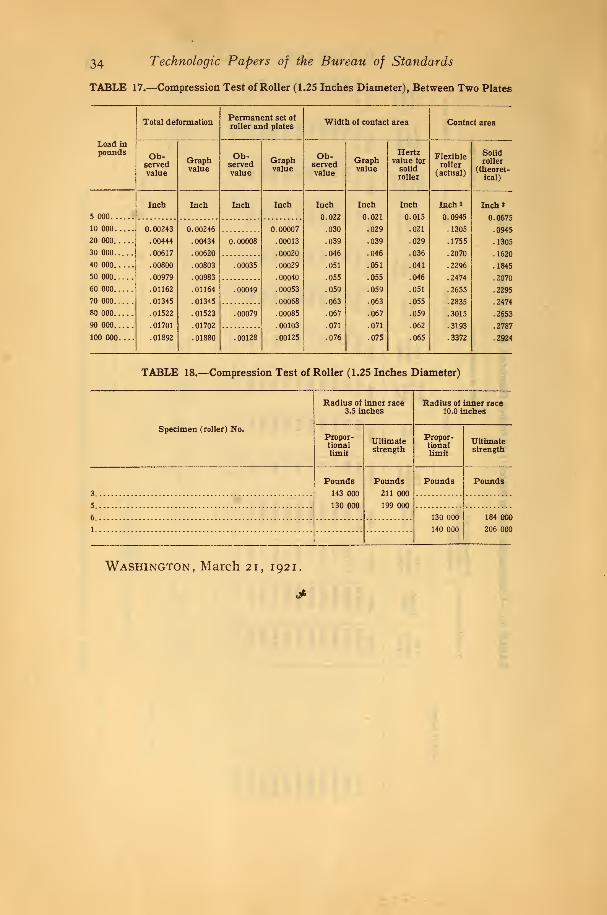
TABLE 17.—Compression Test of Roller (1.25 Inches Diameter), Between Two Plates
Total deformationPermanent set of
roller and platesWidth of contact area Contact area
Load inpounds Ob-
servedvalue
Graphvalue
Ob-servedvalue
Graphvalue
Ob-servedvalue
Graphvalue
Hertzvalue for
solid
roller
Flexibleroller
(actual)
Solidroller
(theoret-
ical)
5 000
Inch Inch Inch Inch Inch
0.022
.030
.039
.046
.051
.055
.059
.063
.067
.071
.076
Inch
0.021
.029
.039
.046
.051
.055
.059
.063
.067
.071
.075
Inch
0.015
.021
.029
.036
.041
.046
.051
.055
.059
.062
.065
Inch a
0.0945
.1305
.1755
.2070
.2296
.2474
.2655
.2835
.3015
.3193
.3372
Inch>
0.0675
094510 000 0.00243
.00444
.00617
.00800
.00979
.01162
.01345
.01522
.01701
.01892
0.00246
.00434
.00620
.00803
. 00983
.01164
.01345
.01523
.01702
.01880
0.00007
.00013
.00020
. 00029
.00040
.00053
. 00068
. 00085
.00103
.00125
20 000
30 000
0.00008 .1305
1620
40 000
50 000
.00035 .1845
2070
60 000
70 000
.00049 .2295
2474
80 000
90 000
.00079 .2653
.2787
100 000.... .00128 .2924
TABLE 18.—Compression Test of Roller (1.25 Inches Diameter)
Radius of inner race3.5 inches
Radius of inner race10.0 inches
Specimen (roller) No.Propor-tional
limit
Ultimatestrength
Propor-tionallimit
Ultimatestrength
3
Pounds
143 000
130 000
Pounds
211 000
199 000
Pounds Pounds
5
6 130 000
140 000
184 000
1 206 000
Washington , March 21, 1 92
1