department of economics crops and climate change northwest iowa agronomy group holstein, iowa...
TRANSCRIPT

Department of Economics
Crops and Climate Change
Northwest Iowa Agronomy GroupHolstein, Iowa
December 15, 2009
Chad HartAssistant Professor/Grain Markets Specialist

Department of Economics
U.S. Corn Supply and Use
Source: USDA
2007 2008 2009
Area Planted (mil. acres) 93.5 86.0 86.4
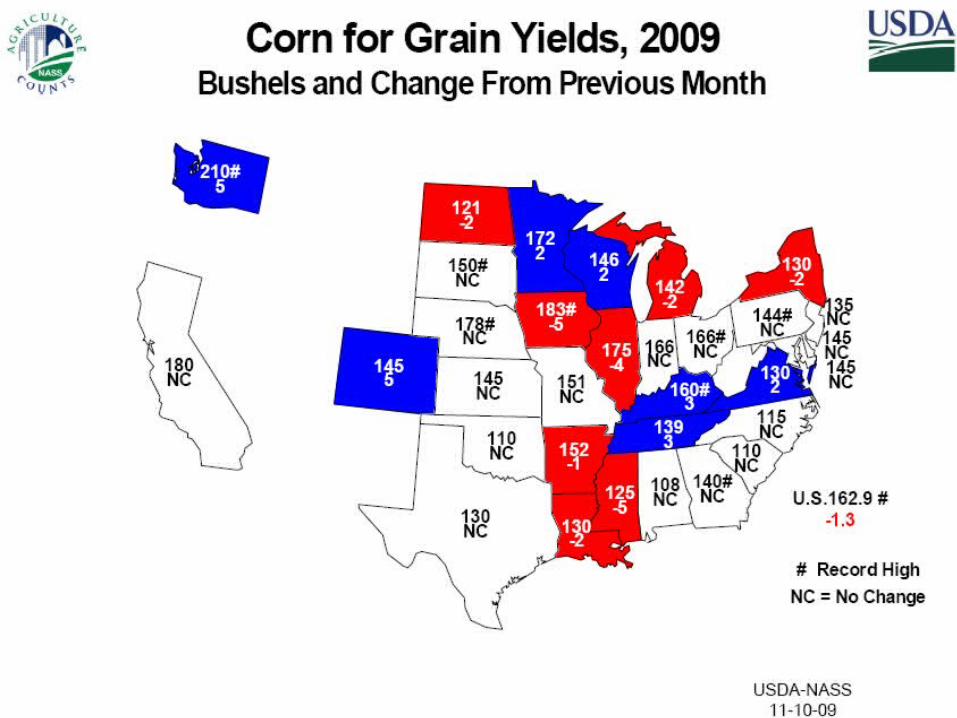
Yield (bu./acre) 150.7 153.9 162.9
Production (mil. bu.) 13,038 12,101 12,921
Beg. Stocks (mil. bu.) 1,304 1,624 1,674
Imports (mil. bu.) 20 14 10
Total Supply (mil. bu.) 14,362 13,739 14,605
Feed & Residual (mil. bu.) 5,913 5,254 5,400
Ethanol (mil. bu.) 3,049 3,677 4,200
Food, Seed, & Other (mil. bu.) 1,338 1,276 1,280
Exports (mil. bu.) 2,437 1,858 2,050
Total Use (mil. bu.) 12,737 12,065 12,930
Ending Stocks (mil. bu.) 1,624 1,674 1,675
Season-Average Price ($/bu.) 4.20 4.06 3.55

Department of Economics
Department of EconomicsSource: USDA

Department of Economics
U.S. Corn Harvest Progress
Source: USDA
0
20
40
60
80
100
% H
arv
est
ed
5-Year Average 2009 1992

Department of Economics
U.S. Soybean Supply and Use
Source: USDA
2007 2008 2009
Area Planted (mil. acres) 64.7 75.7 77.5
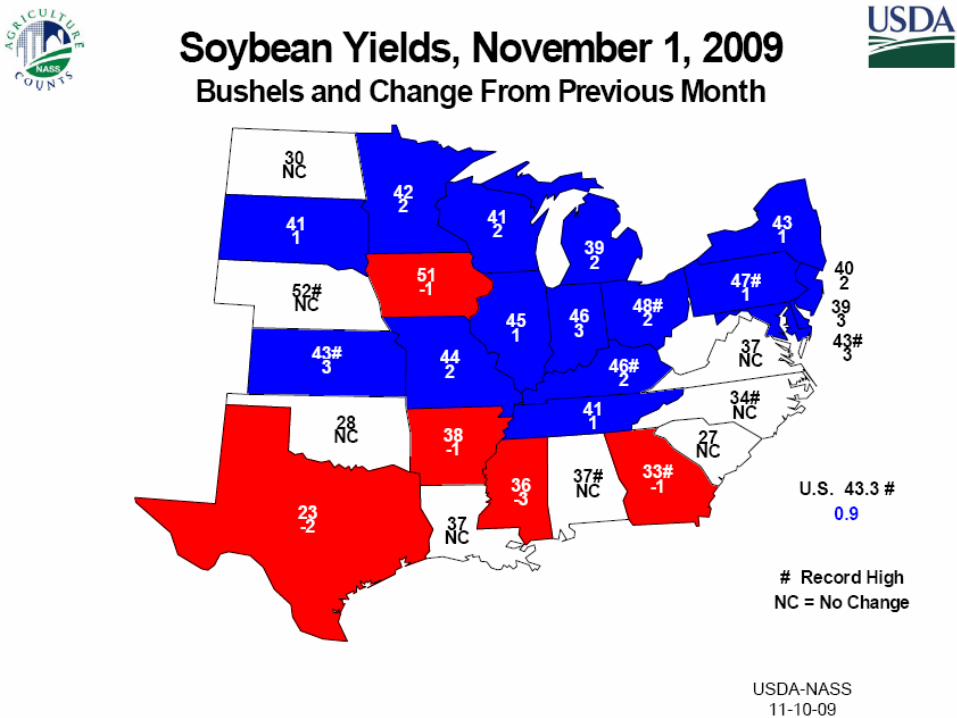
Yield (bu./acre) 41.7 39.7 43.3
Production (mil. bu.) 2,677 2,967 3,319
Beg. Stocks (mil. bu.) 574 205 138
Imports (mil. bu.) 10 13 8
Total Supply (mil. bu.) 3,261 3,185 3,465
Crush (mil. bu.) 1,803 1,662 1,695
Seed & Residual (mil. bu.) 93 101 175
Exports (mil. bu.) 1,159 1,283 1,340
Total Use (mil. bu.) 3,056 3,047 3,210
Ending Stocks (mil. bu.) 205 138 255
Season-Average Price ($/bu.) 10.10 9.97 9.50
Department of EconomicsSource: USDA

Department of Economics
U.S. Soybean Harvest Progress
Source: USDA
0
20
40
60
80
100
% H
arv
est
ed
5-Year Average 2009 1985
Department of Economics
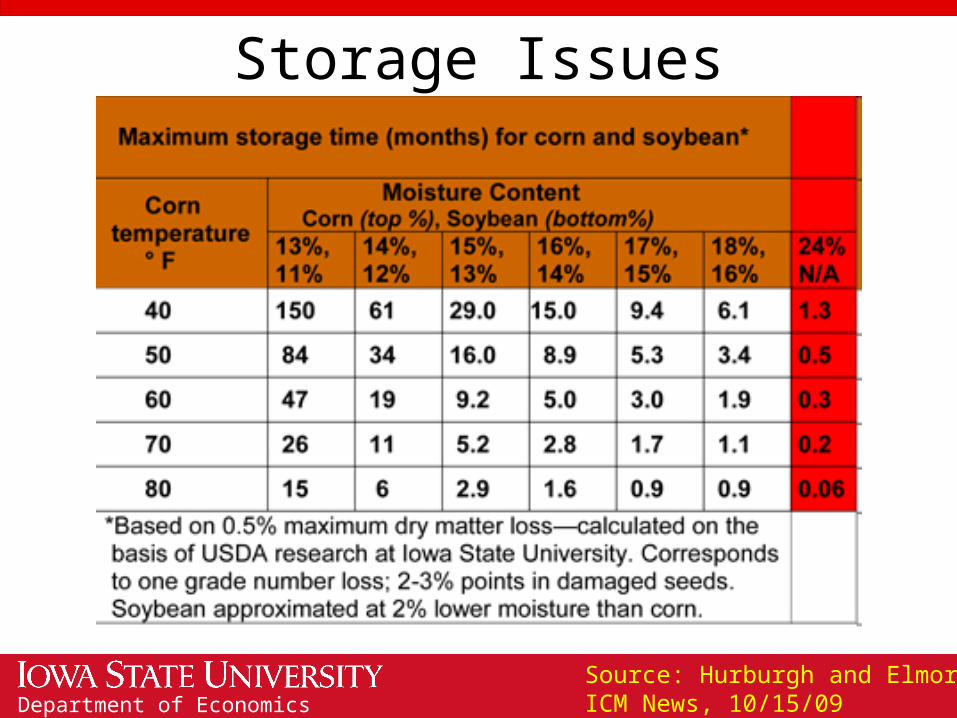
Storage Issues
Source: Hurburgh and Elmore,ICM News, 10/15/09

Department of Economics
World Corn Production
Source: USDA

Department of Economics
Corn – Argentina & Brazil
Source: USDA
35
38
41
44
47
50M
illio
n a
cres
1800
2100
2400
2700
3000
3300
Mill
ion b
ush
els
Area Harvested Production

Department of Economics
World Soybean Production
Source: USDA

Department of Economics
Soybeans – Argentina & Brazil
Source: USDA
65
75
85
95
105
Mill
ion a
cre
s
2700
3150
3600
4050
4500
Mill
ion b
ush
els
Area Harvested Production

Department of Economics
Exchange Rates (Jan. 2003 = 1)
Source: USDA, ERS
0.4
0.6
0.8
1.0
1.2
1.4
Canada Mexico Brazil EU China South KoreaJapan Australia

Department of Economics
0
200
400
600
800
1,000
1,200
1,400
1,600
1999 2000 2001 2002 2003 2004 2005 2006 2007 2008 2009
Mill
ion b
ush
els
Corn Soybeans
Exports & Advance Sales(1st 14 weeks of marketing year)
Source: USDA, FAS
Department of Economics
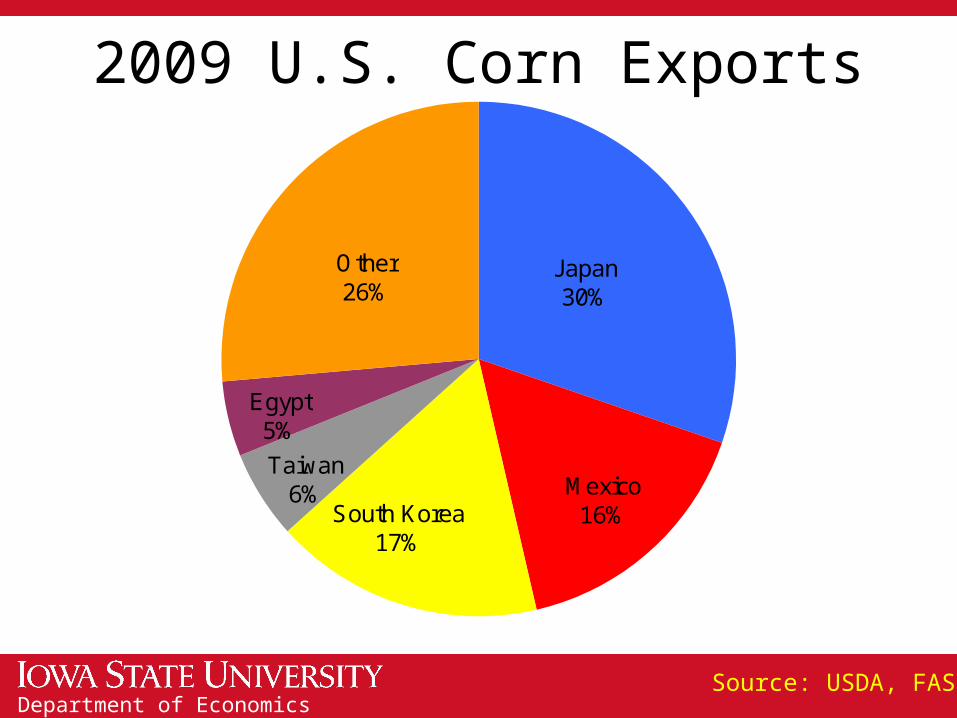
2009 U.S. Corn Exports
Source: USDA, FAS
Other26%
Taiwan6%
South Korea17%
Egypt5%
Mexico16%
Japan30%

Department of Economics
2009 U.S. Soybean Exports
Source: USDA, FAS
Mexico6%
Japan4%
Other19%
EU5%
China66%

Department of Economics
0
5
10
15
20
25
30
35
40
200
9
201
0
201
1
201
2
201
3
201
4
201
5
201
6
201
7
201
8
201
9
202
0
202
1
202
2
Bill
ion G
allo
ns
Conventional Biofuels Cellulosic Biofuels
Biodiesel Additional Advanced Biofuels
Renewable Fuels Standard (RFS)
60% GHG Emission Reduction
50% GHG Emission Reduction
20% GHG Emission ReductionIf construction started after Dec. 2007

Department of Economics
Renewable Fuels Standard (RFS)
0
2
4
6
8
10
12
14
16
2009 2010 2011
Bill
ion g
allo
ns
Additional Advanced Biofuels Biodiesel
Cellulosic Biofuels Conventional Biofuels
CropYear
Billion Bushels
2008 3.57
2009 4.11
2010 4.43
2011 4.64

Department of Economics
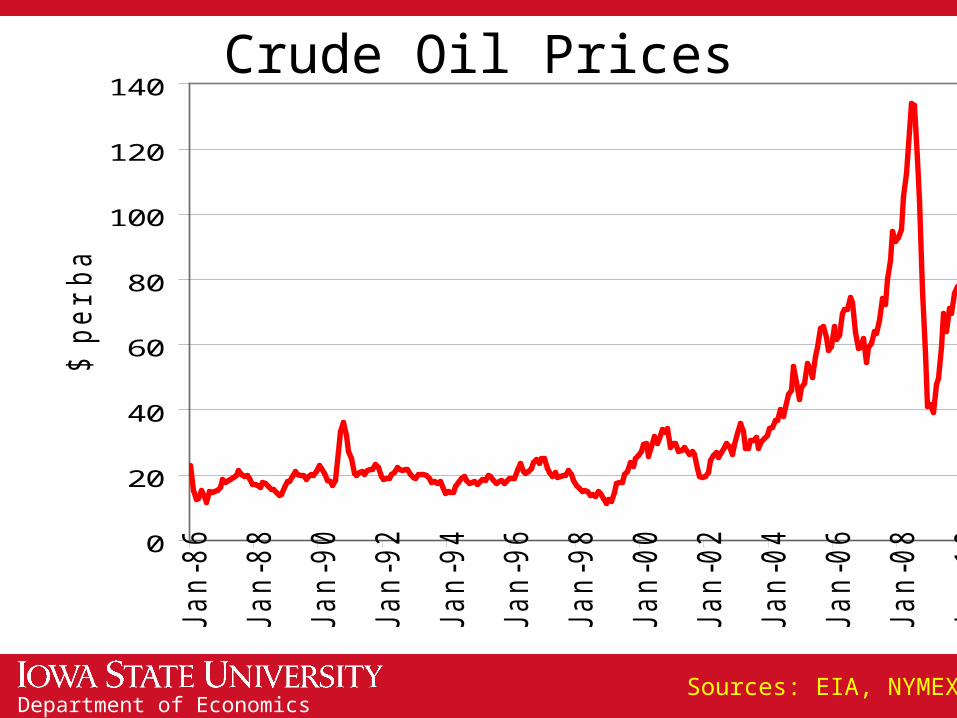
Ethanol Margins
Source: ISU, CARD
Department of Economics
0
20
40
60
80
100
120
140
Jan-8
6
Jan-8
8
Jan-9
0
Jan-9
2
Jan-9
4
Jan-9
6
Jan-9
8
Jan-0
0
Jan-0
2
Jan-0
4
Jan-0
6
Jan-0
8
Jan-1
0
Jan-1
2
Jan-1
4
Jan-1
6
Jan-1
8
$ p
er
barr
el
Crude Oil Prices
Sources: EIA, NYMEX
Department of Economics
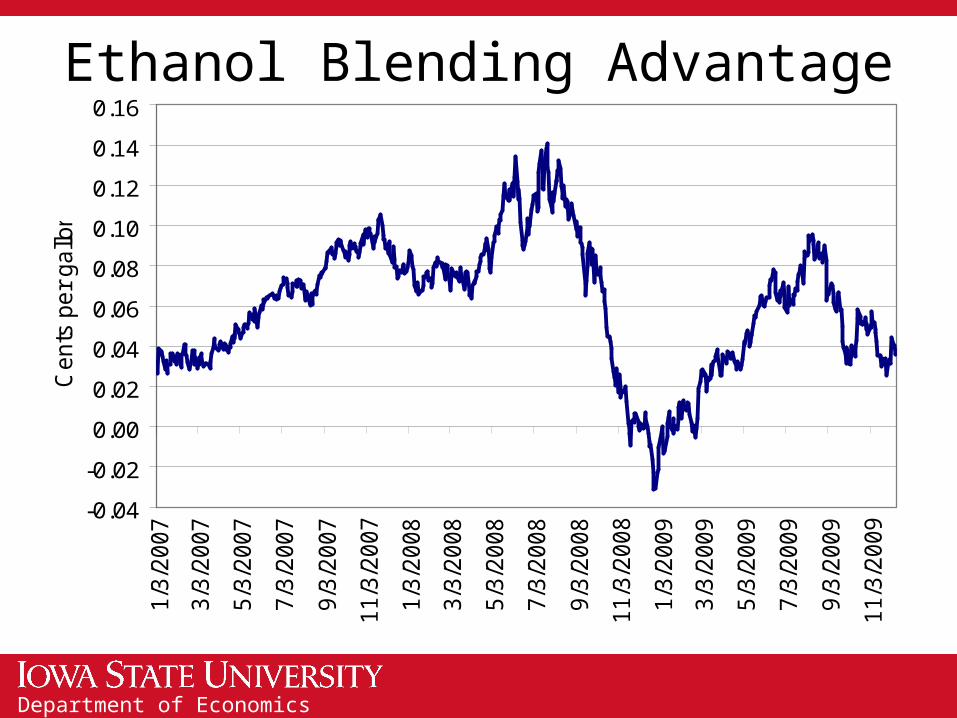
Ethanol Blending Advantage
-0.04
-0.02
0.00
0.02
0.04
0.06
0.08
0.10
0.12
0.14
0.16
1/3
/2007
3/3
/2007
5/3
/2007
7/3
/2007
9/3
/2007
11/3
/2007
1/3
/2008
3/3
/2008
5/3
/2008
7/3
/2008
9/3
/2008
11/3
/2008
1/3
/2009
3/3
/2009
5/3
/2009
7/3
/2009
9/3
/2009
11/3
/2009
Cents
per
ga
llon

Department of Economics
Dept. of Energy Projections
Source: Energy Information Administration,Annual Energy Outlook 2009

Department of Economics
Draft Lifecycle GHG Reductions
Source: EPA, May 2009

Department of Economics
Iowa Crop Basis
-70
-60
-50
-40
-30
-20
-10
0
10
20
30
Cen
ts p
er b
ushe
l
Average 2000-05 - Corn Average 2000-05 - Soy 2009 - Corn 2009 - Soy

Department of Economics
GHG Emission Rules
• Greenhouse gas rules are coming– Whether through legislation or regulation
• EPA has the authority to regulate GHGs– Via Clean Air Act
• However, Congress would like to set the rules– H.R. 2454, American Clean Energy and Security Act
of 2009, • Passed in U.S. House of Rep. on 6/26/09, 219-212
– S. 1733, Clean Energy Jobs and American Power Act
• Introduced 9/30/09, In committee (actually, six committees)

Department of Economics
CO2 Emissions
Source: EPA, Inventory of U.S. Greenhouse Gas Emissions and Sinks: 1990-2007

Department of Economics
CH4 Emissions
Source: EPA, Inventory of U.S. Greenhouse Gas Emissions and Sinks: 1990-2007

Department of Economics
N2O Emissions
Source: EPA, Inventory of U.S. Greenhouse Gas Emissions and Sinks: 1990-2007

Department of Economics
Agricultural GHG Emissions
Source: EPA, Inventory of U.S. Greenhouse Gas Emissions and Sinks: 1990-2007

Department of Economics
GHG Emission Statistics
Source: EPA, Inventory of U.S. Greenhouse Gas Emissions and Sinks: 1990-2007

Department of Economics
Climate Change Legislation
Source: Congressional Research Service
American Clean Energy and Security Act of 2009 (H.R. 2454)• Requires utilities to supply an increasing percentage of their demand
from a combination of energy efficiency savings and renewable energy (6% in 2012, 9.5% in 2014, 13% in 2016, 16.5% in 2018, and 20% in 2021-2039).
• Provides for issuing, trading, banking, retiring, and verifying renewable electricity credits.
• Establishes targets to cap and reduce greenhouse gas (GHG) emissions, annually, so that GHG emissions from capped sources are reduced to 97% of 2005 levels by 2012, 83% by 2020, 58% by 2030, and 17% by 2050; and establish a federal GHG registry.
• Provides for trading, banking and borrowing, auctioning, selling, exchanging, transferring, holding, or retiring emission allowances.

Department of Economics
Climate Change Legislation
Source: Craig Raysor, Gillon & Associates, PLLC
Agriculture provisions in H.R. 2454• Provides some exemptions from the GHG emission reduction
requirements for agriculture and forestry
• Provides incentive-based approach to GHG emission reduction/capture
• Allows USDA to help establish eligible GHG offset practices and review of those practices
• Shifts question on indirect-land-use to an independent panel for study with EPA and USDA to review in the future
• Allows for a specific exemption for livestock (enteric fermentation from ruminant animals) from uncapped emissions guidelines

Department of Economics
Lots of Analysis
• The EPA has funded the development of several models that are capable of examining the impact of this bill and other similar bills
• The environmental economists who worked on these models are very well respected and the work is sound
• However, the only certainty in the bill is the limit on carbon, everything else is assumption driven
Source: ISU, Dermot Hayes presentation, Oct. 2009

Department of Economics
Key Assumptions• The US economy was already on a slow growth
path for energy consumption, the analysis assumes that this continues
• Coal fired plants largely shut down and are replaced by nuclear
• Enormous reliance on international and domestic offsets
• If we cannot build the large number of nuclear plants or find the international offsets, then the price of carbon will increase at about twice the reported rate
Source: ISU, Dermot Hayes presentation, Oct. 2009

Department of Economics
Energy Sources
Source: EPA Analysis of H.R. 2454, June 23, 2009

Department of Economics
GHG Emissions & Abatements
Source: EPA Analysis of H.R. 2454, June 23, 2009

Department of Economics
Domestic Offsets
• Implementing regulations not yet written
• Uncertainty about how the offsets would work in agriculture, particularly for conservation tillage, but the intention is clearly to use these offsets as a way to stimulate agricultural incomes
• Consideration of leakage is prohibited pending a study
• Heavy reliance on the growth of trees on pasture and crop land
Source: ISU, Dermot Hayes presentation, Oct. 2009

Department of Economics
Domestic Offsets
Source: EPA Analysis of Waxman-Markey, April 20, 2009

Department of Economics
Domestic Offsets
Table 1. Rental values ($/acre) for U.S. cropland used to grow trees
Carbon Price ($/ton) Region 20.00 30.00 40.00 50.00 60.00 90.00 Corn Belt 81 121 161 202 242 363 Delta States 127 190 253 316 380 569 Lake States 98 147 195 244 293 440 Southeast 115 173 231 288 346 519
Source: ISU, Dermot Hayes presentation, Oct. 2009

Department of Economics
Shifting Land Patterns
Source: EPA, “Greenhouse Gas Mitigation Potential in U.S. Forestry and Agriculture”, Nov. 2005

Department of Economics
International Offsets• Must be a developing country that is a member of a
unilateral or multilateral emissions reduction agreement with the United States
• Must have the technical capacity to monitor, measure, report and verify forest carbon fluxes resulting from deforestation
• Must have the capacity to reduce emissions from deforestation, including strong forest governance
• The international offset project itself must be shown to result in permanent verifiable reductions that are net of any leakage measures
Source: ISU, Dermot Hayes presentation, Oct. 2009

Department of Economics
Carbon Prices Increase Over Time
Source: EPA Analysis of H.R. 2454, June 23, 2009

Department of Economics
Prices Are Sensitive to Offsets
Source: EPA Analysis of H.R. 2454, June 23, 2009
Department of Economics
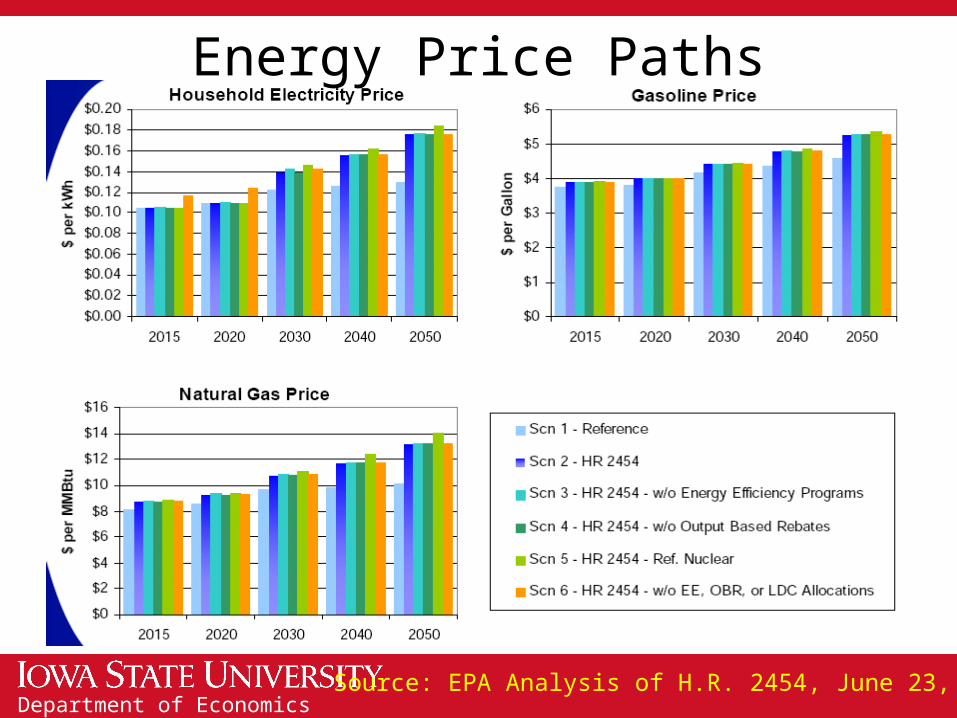
Energy Price Paths
Source: EPA Analysis of H.R. 2454, June 23, 2009

Department of Economics
Impacts on an Average Household
Source: EPA Analysis of H.R. 2454, June 23, 2009

Department of Economics
USDA Estimates
Source: USDA, Office of Chief Economist Statement of Joseph Glauber, before House Ag Committee, 12/2/09
2012-2018 Production Costs Changes

Department of Economics
Land Use Changes
Source: USDA, Office of Chief Economist Statement of Joseph Glauber, before House Ag Committee, 12/3/09
Allowance Prices

Department of Economics
Land Use Changes by 2050
Source: USDA, Office of Chief Economist Statement of Joseph Glauber, before House Ag Committee, 12/3/09
Forest Cropland Pasture
(million acres)
Corn Belt 22.5 -20.6 -1.8
Great Plains -- 1.7 -3.8
Lake States 15.1 -12.1 -2.2
Northeast 2.4 -1.9 -0.5
Rocky Mts. 7.7 -5.3 -1.7
Pacific SW 0.0 0.0 0.0
Pacific NW 0.2 0.2 -0.2
South Central 10.0 -6.4 -3.6
Southeast 1.1 1.2 -1.9
Southwest -- 8.2 -8.2

Department of Economics
Offset Revenues
Source: USDA, Office of Chief Economist Statement of Joseph Glauber, before House Ag Committee, 12/3/09

Department of Economics
Crop Production Changes
Source: USDA, Office of Chief Economist Statement of Joseph Glauber, before House Ag Committee, 12/3/09

Department of Economics
Livestock Production Changes
Source: USDA, Office of Chief Economist Statement of Joseph Glauber, before House Ag Committee, 12/3/09
Department of Economics
Thank you for your time!
Any questions?
My web site:http://www.econ.iastate.edu/faculty/hart/
Iowa Farm Outlook:http://www.econ.iastate.edu/outreach/agriculture/periodicals/ifo/
Ag Decision Maker:http://www.extension.iastate.edu/agdm/