department of education and trainingeducation.qld.gov.au/everydaycounts/docs/performance... · web...
TRANSCRIPT

Performance Insights:
School Attendance

Performance Insights: School Attendance
October 2013Page: 2
This paper was prepared by the Department of Education, Training and Employment to provide a comprehensive background paper for departmental staff regarding trends and issues in student attendance in Queensland state schools.

Performance Insights: School Attendance
October 2013
Contents
1. WHY IS SCHOOL ATTENDANCE SO IMPORTANT? 5
2. PATTERNS OF SCHOOL ATTENDANCE 7
3. ATTENDANCE RELATED TO STUDENT FACTORS 18
4. ATTENDANCE AND STUDENT OUTCOMES22
5. IMPROVING ATTENDANCE — WHAT THE RESEARCH REVEALS 29
6. QUEENSLAND STATE SCHOOLS CONTEXT 36
7. PROMISING PRACTICES IN QUEENSLAND STATE SCHOOLS 37
8. CONCLUSION 40
APPENDIX 1: CALCULATING STUDENT ATTENDANCE 48
APPENDIX 2: SCAN OF SELECTED ATTENDANCE PROGRAMS 53
APPENDIX 3: CASE STUDY QUESTIONS FOR PRINCIPALS AND SCHOOL COMMUNITIES 56
Page: 3

Performance Insights: School Attendance
October 2013
List of tablesTable 1: Categorising student attendance ratesTable 2: Prep cohort sample with less than 95% and less than 85% attendance rates over timeTable 3: Year 5 cohort sample with less than 95% and less than 85% attendance rates over timeTable 4: The attendance rates for a sample of students with SDAsTable 5: Reasons for student absences from schoolTable 6: Overview of evidence for attendance strategies Table 7: Categories of school attendance strategies (not all evidence based) Adapted from Reardon
(2008) and others Table 8: Schools (with more than 100 students) with largest attendance gain
List of figures Figure 1: Queensland state school students (%) by attendance rate rangeFigure 2: Proportion of attendance less than 85% by regionFigure 3: Absences by reason by day Figure 4: Absences by week by reason Figure 5: Attendance rates by year level for all students and Indigenous studentsFigure 6: Australian states school attendance rates Figure 7: Queensland state school attendance rate and school band Figure 8: Staff morale and student attendance rate Figure 9: Queensland state school attendance rate and student mobility Figure 10: Persisting relationship between SES and attendance over timeFigure 11: SES and reasons for non-attendanceFigure 12: Student satisfaction and attendance rates Figure 13: Queensland state school attendance rates by NAPLAN Year 5 mean scale scoresFigure 14: Indigenous and non-Indigenous Queensland state school attendance rate by NAPLAN
Reading mean scale score Figure 15: Attendance rate less than 85% (unauthorised and unexplained) and subsequent school
disciplinary absences for a Year 7 Sample
Page: 4
Performance Insights: School Attendance
October 2013
1. Why is school attendance so important?Since the introduction of the State Education Act of 1875, the Queensland Government has required parents to ensure their children attend school. Under current legislation, Queensland parents have a legal obligation to ensure their children attend school between the ages of 6.5 and 16 years (or the end of Year 10). Parents also have an obligation to ensure their children are participating in school, training or employment until they turn 17 or achieve a prescribed qualification.1
Queensland state schools operate for approximately 200 days each year. Students are expected to attend school on every one of those days unless there is a reasonable excuse. Although individual school and student attendance rates vary considerably, over recent years, on any day, an average of 9% of Queensland’s 480,000 state school students in 2010 were absent from school. Based on 2007–2010 data, approximately 30% of Queensland state school students were absent for 20 or more days per year.
Attendance and student outcomesResearch confirms a strong link between attendance and student outcomes. While some student absences are unavoidable and understandable due to illness and the like, or enforced through school disciplinary absences, many are not. These could be unexplained or unauthorised absences.
Poor school attendance can be linked to a number of related short and long-term adverse outcomes for students including lower academic outcomes, early school leaving, substance use, poverty, unemployment and negative health outcomes. However these factors may be interrelated in complex ways and factors that lead to low levels of attendance may also independently lead to some of these adverse outcomes.
A student’s regular absence from school may be a critical indicator in disengagement, leading directly to some of these adverse outcomes. Regardless of the nature of the relationship, poor school attendance, particularly with a high number of unexplained or unauthorised absences, is a readily observable warning sign for potential longer-term adverse outcomes.
Poor school attendance can be an early warning sign for future adverse outcomes
The cost of non-attendanceAny absence from school constitutes a loss of educational opportunity because students miss out on learning. When a student is absent, the investment in their education is still made by governments but the benefits are not received by the student or the wider community. The 2010 state attendance rate was 91% and, at an estimated cost of $63.662 per student per day, the missed educational opportunities represented a total notional investment of just over $550 million.
1 A child attends a State school or non-State school only if the child complies with the school’s requirements about physically attending, at particular times, its premises or another place. A child enrolled in a program of distance education is taken to attend the school of distance education offering the program by completing and returning the assigned work for the program and a child enrolled in an external program is taken to attend the State school or non-State school offering the program by complying with its requirements about communicating with or contacting the school for the purpose of participating in the program.2 Based on an annual average cost per student derived from the DET Annual Report 2010-2011, page 49.
Page: 5
Performance Insights: School Attendance
October 2013
Persistent non-attendance may require additional resources to re-engage students in schooling and to help them catch up on missed learning. This can involve learning and personal student support staff, and interagency collaborations.
Poor attendance represents a loss of educational opportunity and a cost to the community
Schools’ influence on student attendanceSchool personnel understand the importance of student attendance. While Queensland state schools work hard to identify and mitigate the school factors that impact on student engagement and attendance, they have limited influence over numerous additional student and family factors related to attendance. Although the primary responsibility for a student’s attendance at school rests with the parents/caregivers and student, schools can have a positive influence on student attendance. Promoting the value of school attendance and supporting students and families to deal with barriers to school attendance where possible are key elements in helping to improve student attendance.
Given this, school strategies to improve attendance need to be based on a clear understanding of the range of factors that may be impacting on their own students’ non-attendance and an appreciation of which factors can be changed. Schools must base their approaches to improving student attendance within an understanding of the needs of their students.
Parents/caregivers and schools can positively influence factors related to student attendance
Overview of this paperThis paper combines information from a range of sources including State school data to inform responses to non-attendance of students. It covers:
patterns and trends in attendance in Queensland state schools
relationships between student attendance and various student and school factors
relationships between student attendance and literacy and numeracy outcomes and student behaviour
effective strategies identified in research literature
case studies from Queensland state schools with significantly improved attendance between 2007 and 2011.
Page: 6

Performance Insights: School Attendance
October 2013
2. Patterns of school attendanceThis section presents data on patterns of attendance in Queensland state schools. Over 400,000 student records annually can be analysed using unique student identifiers and linked to information on demographics, student behaviour and student achievement.
Classifying absence typesStudent attendance is monitored via roll marking (according to procedure Roll Marking in State Schools) with the data being recorded using the department’s OneSchool platform.
Queensland state schools are guided by nationally-agreed standards for reporting student absence (see Appendix 1). Student absence is categorised as:
authorised for example, illness, undertaking a medical procedure or attending a funeral
unauthorised for example, shopping, visiting friends and relatives, fishing or camping, or
unexplained when no information has been provided by parents/carers or students and the absence is pending the school’s own investigations.
Categorising attendance ratesTable 1 presents the standard range of attendance rates used for describing student attendance.
Table 1: Categorising student attendance rates
Attendance Rate Approximate school days missed per year99% – 100% 0-295% – <99% 3-1090% – <95% 11-2085% – <90% 21-30<85% >30
The report uses a school attendance rate which allows important patterns across schools to be identified. A school's attendance rate is generated by totalling the number of days attended for all students and comparing this to the total number of days possible for all students, expressed as a percentage (see Appendix 1).
Attendance in Queensland state schools The overall reported attendance rate in Queensland state schools decreased between 2006 and 2009 from 92.2% to 90.7%, and increased slightly in 2010 to 91.0%.
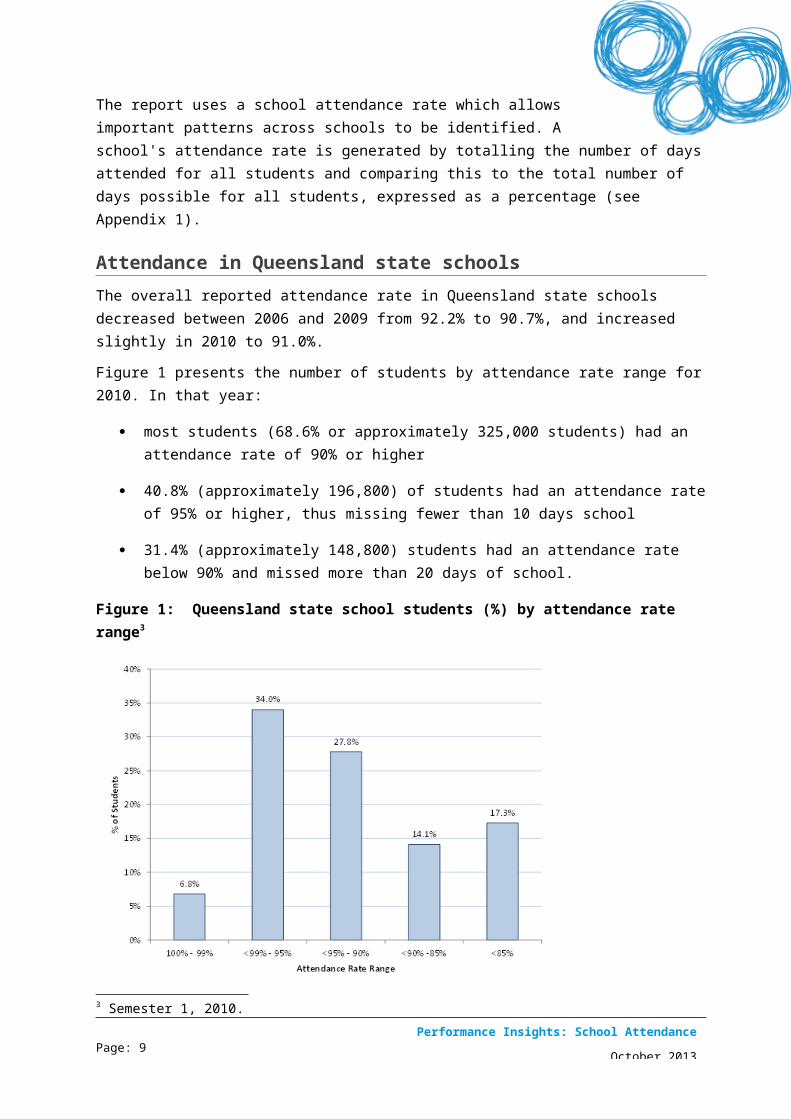
Figure 1 presents the number of students by attendance rate range for 2010. In that year:
most students (68.6% or approximately 325,000 students) had an attendance rate of 90% or higher
Page: 7

Performance Insights: School Attendance
October 2013
40.8% (approximately 196,800) of students had an attendance rate of 95% or higher, thus missing fewer than 10 days school
31.4% (approximately 148,800) students had an attendance rate below 90% and missed more than 20 days of school.
Figure 1: Queensland state school students (%) by attendance rate range3
Approximately 70% of students attend school at least 90% of the time
Approximately 41% of students have attendance rates of 95% or above
Approximately 30% of students had attendance rates below 90% which means they missed more than 20 days of school in the year
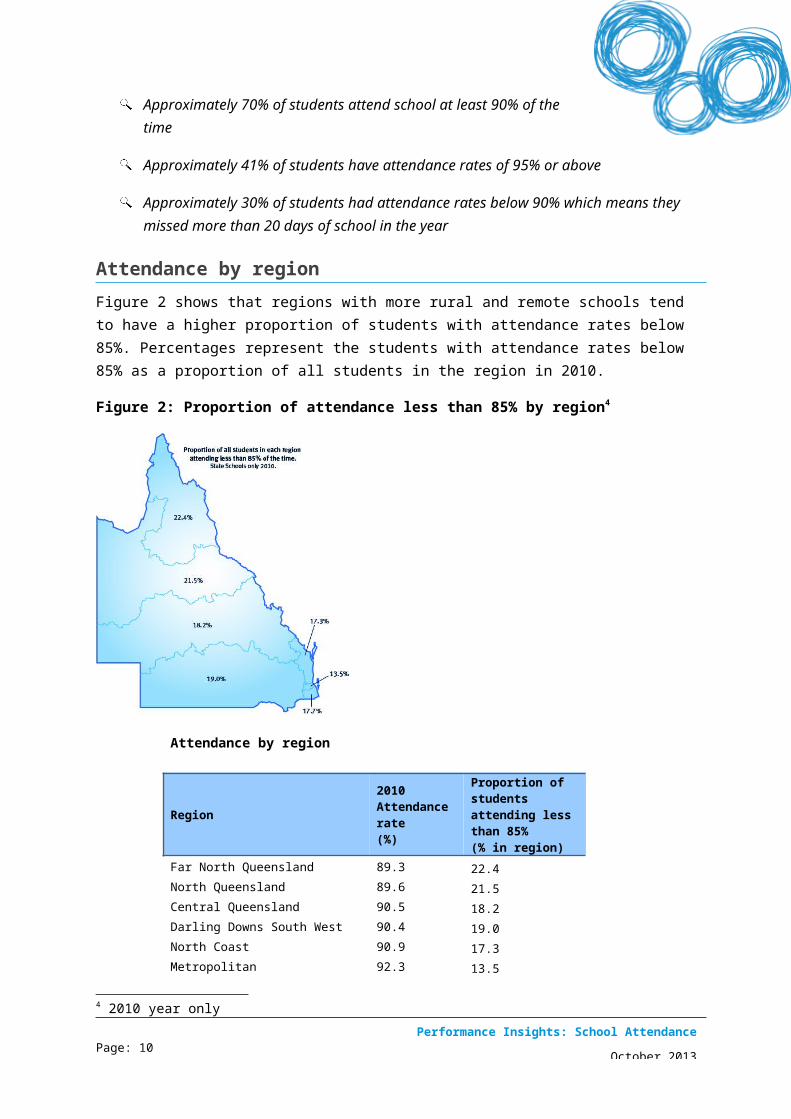
Attendance by regionFigure 2 shows that regions with more rural and remote schools tend to have a higher proportion of students with attendance rates below 85%. Percentages represent the students with attendance rates below 85% as a proportion of all students in the region in 2010.
Figure 2: Proportion of attendance less than 85% by region4
3 Semester 1, 2010.
4 2010 year only
Page: 8
Performance Insights: School Attendance
October 2013
Attendance by region
Region2010Attendance rate(%)
Proportion of students attending less than 85%(% in region)
Far North Queensland 89.3 22.4North Queensland 89.6 21.5Central Queensland 90.5 18.2Darling Downs South West 90.4 19.0North Coast 90.9 17.3Metropolitan 92.3 13.5South East 91.0 17.7
Source: Statistics and Information (http://education.qld.gov.au/schools/statistics/index.html)
Regions with more rural and remote schools have a higher proportion of students with attendance rates below 85%
Page: 9
Performance Insights: School Attendance
October 2013
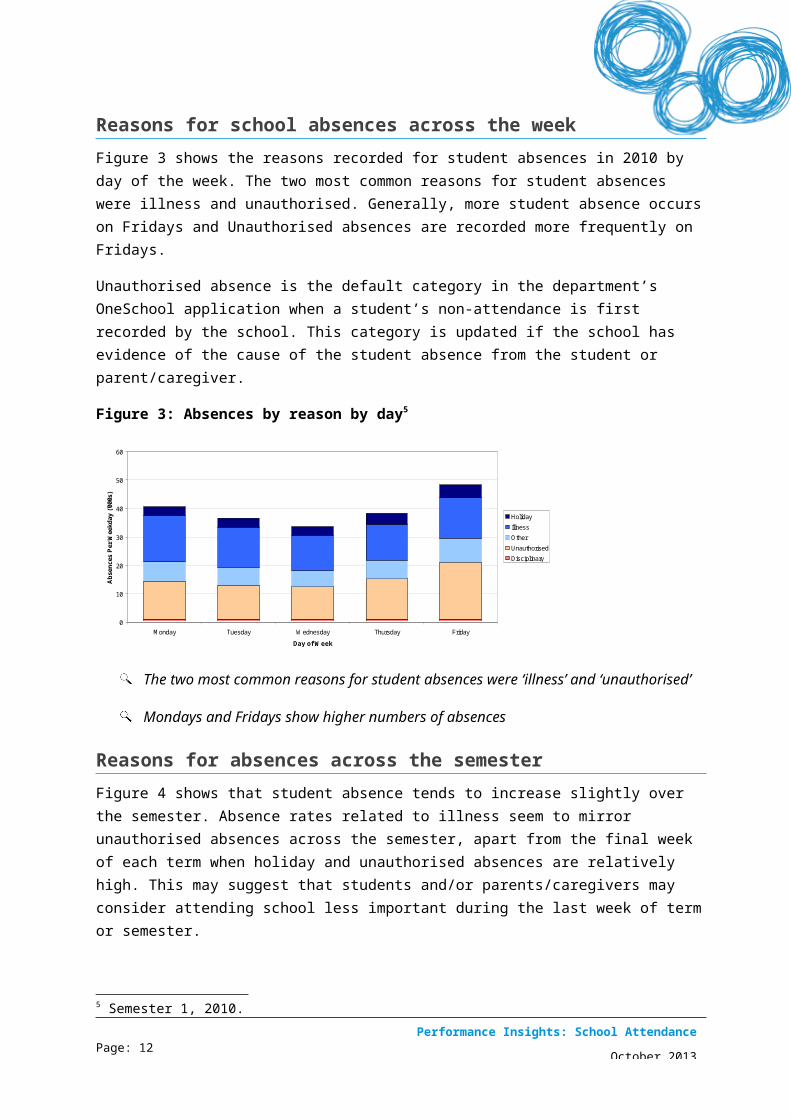
Reasons for school absences across the weekFigure 3 shows the reasons recorded for student absences in 2010 by day of the week. The two most common reasons for student absences were illness and unauthorised. Generally, more student absence occurs on Fridays and Unauthorised absences are recorded more frequently on Fridays.
Unauthorised absence is the default category in the department’s OneSchool application when a student’s non-attendance is first recorded by the school. This category is updated if the school has evidence of the cause of the student absence from the student or parent/caregiver.
Figure 3: Absences by reason by day5
0
10
20
30
40
50
60
Monday Tuesday Wednesday Thursday Friday
Day of Week
Abse
nces
Per
Wee
kday
('00
0s)
HolidayIllness
OtherUnauthorised
Disciplinary
The two most common reasons for student absences were ‘illness’ and ‘unauthorised’
Mondays and Fridays show higher numbers of absences
Reasons for absences across the semesterFigure 4 shows that student absence tends to increase slightly over the semester. Absence rates related to illness seem to mirror unauthorised absences across the semester, apart from the final week of each term when holiday and unauthorised absences are relatively high. This may suggest that students and/or parents/caregivers may consider attending school less important during the last week of term or semester.
5 Semester 1, 2010.
Page: 10

Performance Insights: School Attendance
October 2013
Figure 4: Absences by week by reason6
0
50
100
150
200
250
300
350
400
450
1 2 3 4 5 6 7 8 9 10 11 12 13 14 15 16 17 18 19 20 21
School Week
Abse
nces
Per
Wee
k ('0
00s)
HolidayIllness
Other
UnauthorisedDisciplinary
The final week of term or semester feature lower attendance, largely due to a greater proportion of holiday related and unauthorised non-attendance
Attendance over the yearsFigure 5 illustrates that attendance declines as students progress through school. By Year 10, the attendance rate is lowest and below 90%. Indigenous students in Queensland state schools tend to have lower attendance rates throughout their schooling and a sharper decline in attendance in high school. This pattern was consistent regardless of socio-economic status. The 2010 results showed improved rates of attendance across the secondary years compared to 2008 and 2009, as well as an improvement in attendance rates for Indigenous students across all years compared to 2008 and 2009.
Figure 5: Attendance rates by year levelfor all students and Indigenous students7
Average student attendance declines in Years 8, 9 and 10, with a sharper decline for Indigenous students
Year 10 student attendance is the lowest of all year levels and below 90%
6 Semester 1, 2010.
7 2008 to 2010.
Page: 11
Performance Insights: School Attendance
October 2013
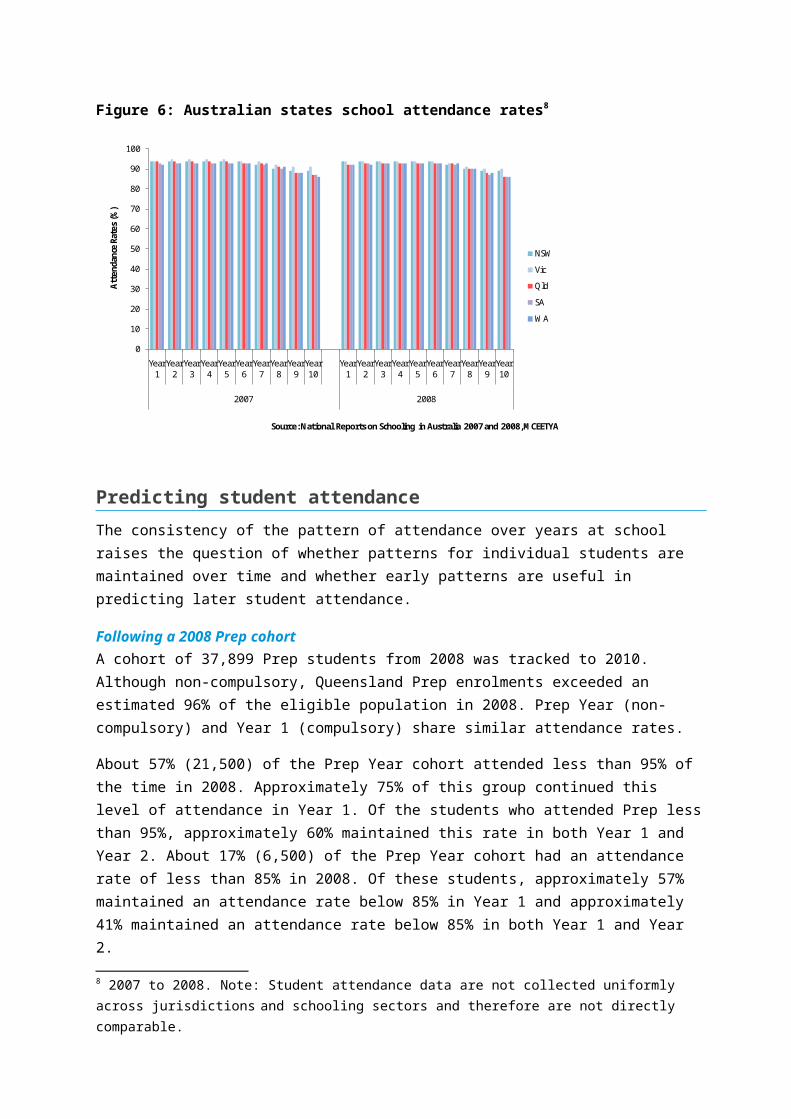
Attendance over school years – comparison with other statesDespite differences in legislation, recording systems and categorisation across states and territories, Queensland school attendance rates display similar patterns to other Australian jurisdictions.
Figure 6 shows that student attendance across jurisdictions declines marginally through the primary schooling years and then more markedly declines in the secondary schooling years. Although not directly comparable, Queensland’s reported attendance rates tend to be closer to those of Western Australia and South Australia than New South Wales or Victoria.
Page: 12

Figure 6: Australian states school attendance rates8
0
10
20
30
40
50
60
70
80
90
100
Year 1
Year 2
Year 3
Year 4
Year 5
Year 6
Year 7
Year 8
Year 9
Year 10
Year 1
Year 2
Year 3
Year 4
Year 5
Year 6
Year 7
Year 8
Year 9
Year 10
2007 2008
Atten
danc
e Ra
tes
(%)
Source: National Reports on Schooling in Australia 2007 and 2008, MCEETYA
NSW
Vic
Qld
SA
WA
Predicting student attendanceThe consistency of the pattern of attendance over years at school raises the question of whether patterns for individual students are maintained over time and whether early patterns are useful in predicting later student attendance.
Following a 2008 Prep cohortA cohort of 37,899 Prep students from 2008 was tracked to 2010. Although non-compulsory, Queensland Prep enrolments exceeded an estimated 96% of the eligible population in 2008. Prep Year (non-compulsory) and Year 1 (compulsory) share similar attendance rates.
About 57% (21,500) of the Prep Year cohort attended less than 95% of the time in 2008. Approximately 75% of this group continued this level of attendance in Year 1. Of the students who attended Prep less than 95%, approximately 60% maintained this rate in both Year 1 and Year 2. About 17% (6,500) of the Prep Year cohort had an attendance rate of less than 85% in 2008. Of these students, approximately 57% maintained an attendance rate below 85% in Year 1 and approximately 41% maintained an attendance rate below 85% in both Year 1 and Year 2.
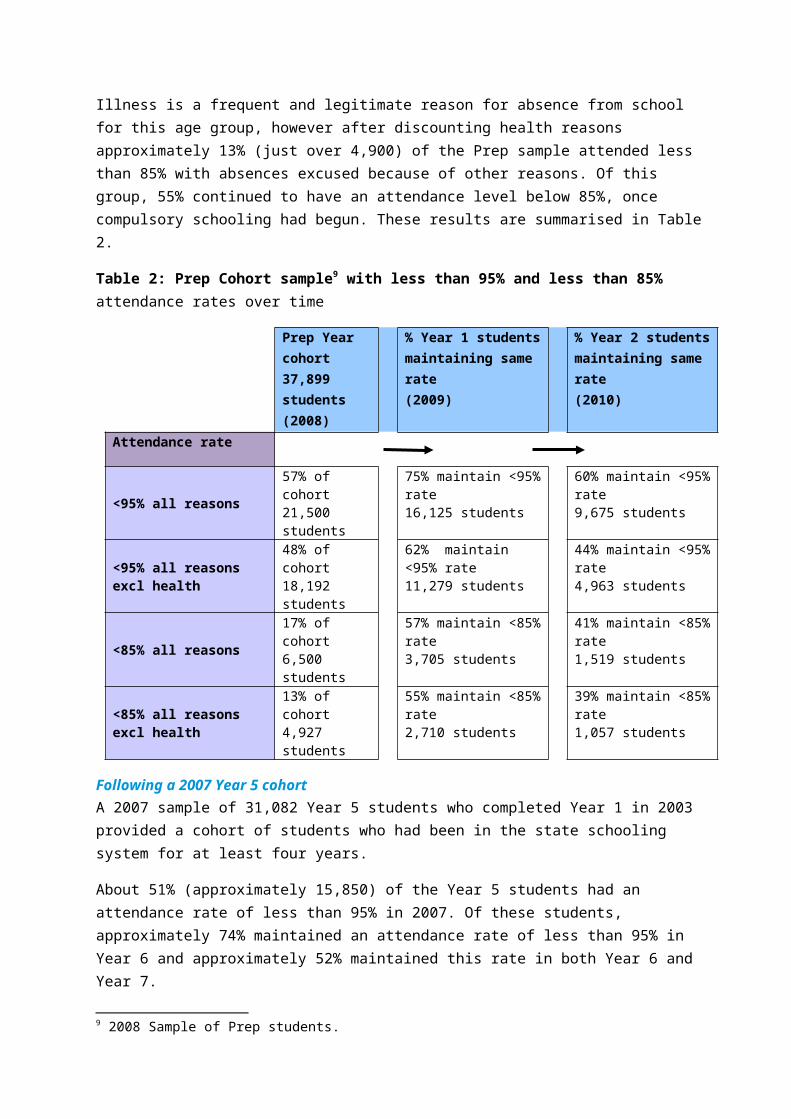
Illness is a frequent and legitimate reason for absence from school for this age group, however after discounting health reasons approximately 13% (just over 4,900) of the Prep sample attended less than 85% with absences excused because of other reasons. Of this group, 55% continued to have an attendance level below 85%, once compulsory schooling had begun. These results are summarised in Table 2.
Table 2: Prep Cohort sample9 with less than 95% and less than 85% attendance rates over time
8 2007 to 2008. Note: Student attendance data are not collected uniformly across jurisdictions and schooling sectors and therefore are not directly comparable.
9 2008 Sample of Prep students.

Prep Year cohort 37,899 students (2008)
% Year 1 students maintaining same rate(2009)
% Year 2 students maintaining same rate(2010)
Attendance rate
<95% all reasons 57% of cohort21,500 students
75% maintain <95% rate16,125 students
60% maintain <95% rate9,675 students
<95% all reasons excl health 48% of cohort18,192 students
62% maintain <95% rate11,279 students
44% maintain <95% rate4,963 students
<85% all reasons 17% of cohort6,500 students
57% maintain <85% rate3,705 students
41% maintain <85% rate1,519 students
<85% all reasons excl health 13% of cohort4,927 students
55% maintain <85% rate2,710 students
39% maintain <85% rate1,057 students
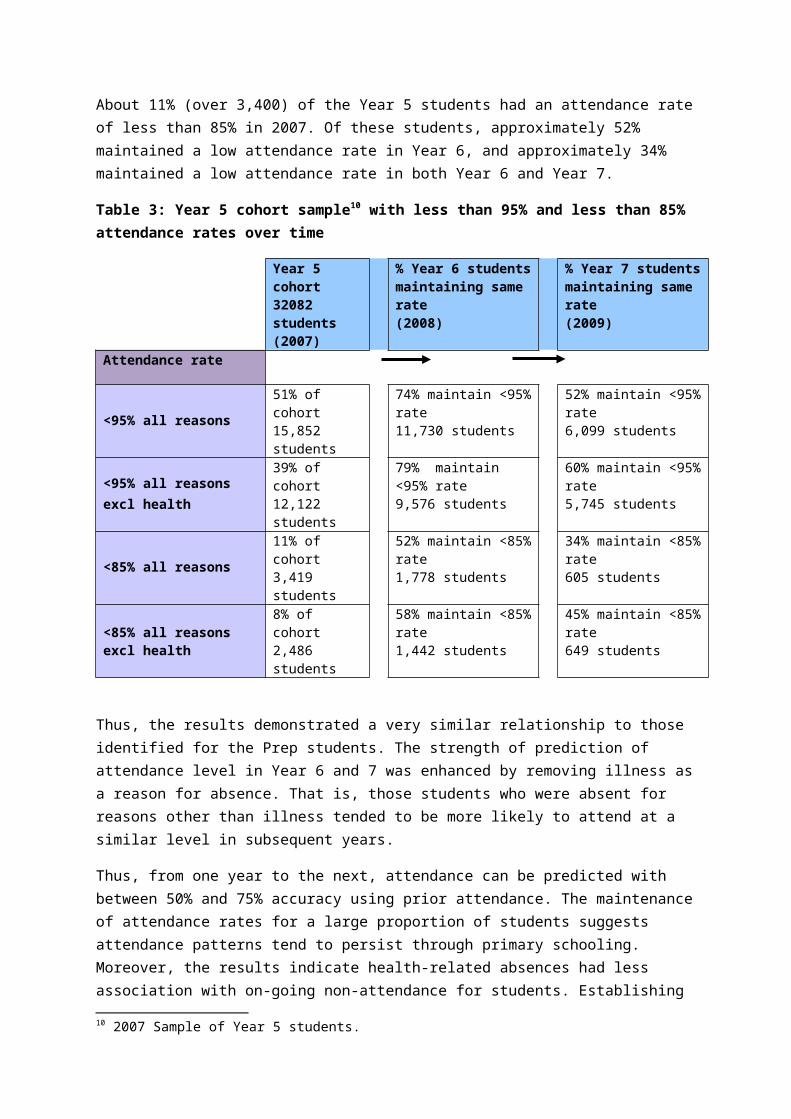
Following a 2007 Year 5 cohortA 2007 sample of 31,082 Year 5 students who completed Year 1 in 2003 provided a cohort of students who had been in the state schooling system for at least four years.
About 51% (approximately 15,850) of the Year 5 students had an attendance rate of less than 95% in 2007. Of these students, approximately 74% maintained an attendance rate of less than 95% in Year 6 and approximately 52% maintained this rate in both Year 6 and Year 7.
About 11% (over 3,400) of the Year 5 students had an attendance rate of less than 85% in 2007. Of these students, approximately 52% maintained a low attendance rate in Year 6, and approximately 34% maintained a low attendance rate in both Year 6 and Year 7.
Table 3: Year 5 cohort sample10 with less than 95% and less than 85% attendance rates over time
Year 5 cohort 32082 students(2007)
% Year 6 students maintaining same rate(2008)
% Year 7 students maintaining same rate(2009)
Attendance rate
<95% all reasons 51% of cohort15,852 students
74% maintain <95% rate11,730 students
52% maintain <95% rate6,099 students
<95% all reasons excl health 39% of cohort12,122 students
79% maintain <95% rate9,576 students
60% maintain <95% rate5,745 students
<85% all reasons 11% of cohort3,419 students
52% maintain <85% rate1,778 students
34% maintain <85% rate605 students
<85% all reasons excl health 8% of cohort2,486 students
58% maintain <85% rate1,442 students
45% maintain <85% rate649 students
Thus, the results demonstrated a very similar relationship to those identified for the Prep students. The strength of prediction of attendance level in Year 6 and 7 was enhanced by removing illness as a reason for absence. That is, those students who were absent for reasons other than illness tended to be more likely to attend at a similar level in subsequent years.
Thus, from one year to the next, attendance can be predicted with between 50% and 75% accuracy using prior attendance. The maintenance of attendance rates for a large proportion of students suggests attendance patterns tend to persist through primary schooling. Moreover, the results
10 2007 Sample of Year 5 students.
indicate health-related absences had less association with on-going non-attendance for students. Establishing strong attendance patterns at an early age may be a key factor influencing latter attendance patterns
There is a strong relationship between early schooling attendance patterns and higher attendance throughout schooling
Attendance can be predicted with some confidence based on prior attendance
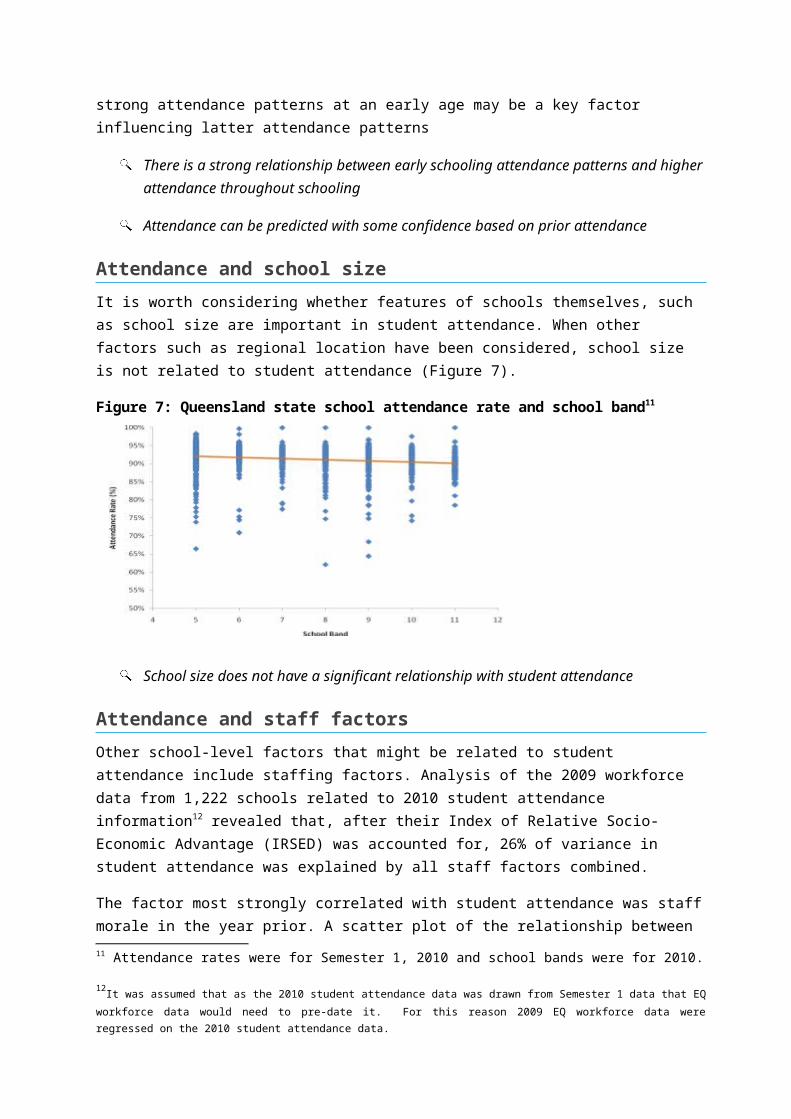
Attendance and school sizeIt is worth considering whether features of schools themselves, such as school size are important in student attendance. When other factors such as regional location have been considered, school size is not related to student attendance (Figure 7).
Figure 7: Queensland state school attendance rate and school band11
School size does not have a significant relationship with student attendance
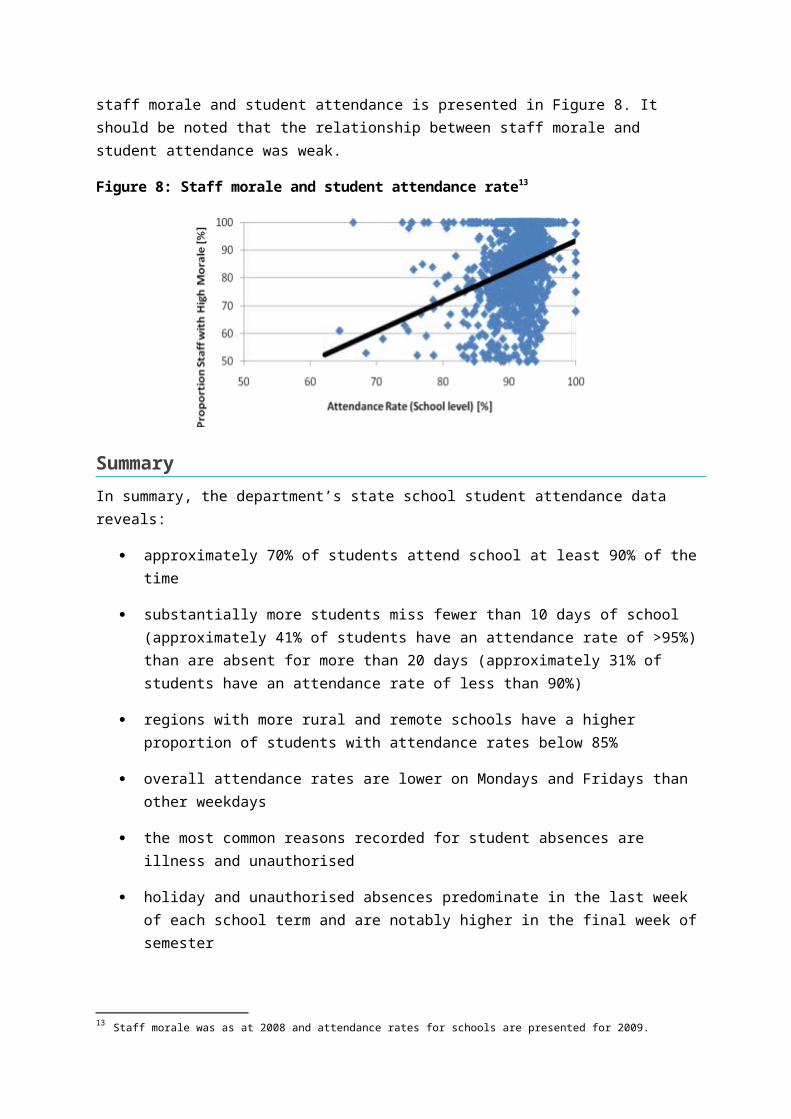
Attendance and staff factorsOther school-level factors that might be related to student attendance include staffing factors. Analysis of the 2009 workforce data from 1,222 schools related to 2010 student attendance information12 revealed that, after their Index of Relative Socio-Economic Advantage (IRSED) was accounted for, 26% of variance in student attendance was explained by all staff factors combined.
The factor most strongly correlated with student attendance was staff morale in the year prior. A scatter plot of the relationship between staff morale and student attendance is presented in Figure 8. It should be noted that the relationship between staff morale and student attendance was weak.
Figure 8: Staff morale and student attendance rate13
11 Attendance rates were for Semester 1, 2010 and school bands were for 2010.
12It was assumed that as the 2010 student attendance data was drawn from Semester 1 data that EQ workforce data would need to pre-date it. For this reason 2009 EQ workforce data were regressed on the 2010 student attendance data.
13 Staff morale was as at 2008 and attendance rates for schools are presented for 2009.
Summary In summary, the department’s state school student attendance data reveals:
approximately 70% of students attend school at least 90% of the time
substantially more students miss fewer than 10 days of school (approximately 41% of students have an attendance rate of >95%) than are absent for more than 20 days (approximately 31% of students have an attendance rate of less than 90%)
regions with more rural and remote schools have a higher proportion of students with attendance rates below 85%
overall attendance rates are lower on Mondays and Fridays than other weekdays
the most common reasons recorded for student absences are illness and unauthorised
holiday and unauthorised absences predominate in the last week of each school term and are notably higher in the final week of semester
average student attendance declines over Years 8, 9 and 10 with a sharper decline for Indigenous students.
the lowest attendance rate is recorded in Year 10 and is below 90% which is consistent with patterns in other states
attendance rates tend to ‘persist’ over time, that is, early school attendance is a reasonable predictor of likely later attendance
school size is not related to attendance rates
staff morale appears to be the staff factor most strongly correlated with student attendance.
These analyses show the trends and patterns in attendance across the State, across the school year, and across student years at school. These patterns do not imply this is the situation for every student or every school. The data provide useful information for helping to develop and implement system-wide and local initiatives to improve attendance. The patterns of attendance over days of the week, weeks of the term and years of schooling suggest that strategies targeting attendance at these times could be effective in lifting overall attendance rates. The finding that attendance rates tend to be
maintained over time appears to support consideration of approaches that explore early and concerted intervention with students who have lower attendance.
3. Attendance related to student factorsThis section looks at relationships between student attendance and student:
mobility socio-economic status satisfaction ratings.
Although some of these factors may be beyond the school’s direct influence, strategies at school can serve to positively influence student attendance.
Attendance and student mobility Most students experience at least one move between schools as they leave primary school and enter secondary schooling. Some students move considerably more often during their schooling years.
According to the 2010 data, the number of moves a student made (in the two years prior) was associated with attendance rates, with most effect for Year 9 students (indicated by the green line in Figure 9). Figure 9 indicates that on average each move is associated with a 2 percentage point decline in attendance rate.
This relationship between mobility and attendance remained after controlling for socio-economic status. Lower attendance may result from the very nature of relocation of families but it is clear that each move reduces the time in school.
Figure 9: Queensland state school attendance rateand student mobility14
50%
55%
60%
65%
70%
75%
80%
85%
90%
95%
100%
no moves 1 move 2 moves 3+ moves
Aver
age
Stud
ent A
tten
danc
e Ra
te (%
)
Number of School Moves
Yrs 3 to 5
Yrs 5 to 7
Yrs 7 to 9
Students who move between schools more often tend to have lower attendance rates
14 Attendance rates are for Semester 1, 2010 and student mobility is presented for 2008 to 2010.
Attendance and student socio-economic status Data from two student groups was examined to determine if there is a relationship between socio-economic status (SES) and student attendance.
A sample of state school Prep students in 2008 (37,899) tracked to 2010 demonstrated slight but consistent correlations between their 2006 Index of Relative Socio-Economic Disadvantage (IRSED) and their attendance in Prep and subsequent attendance in Years 1 and 2. The correlations were slightly stronger using IRSED calculated based on student address rather than school address.
A sample of state school Year 7 students in 2009 (31,753) also showed the same slight, but very consistent, correlations between their IRSED and their attendance.
Figure 10 shows the relationship between SES for both the 2008 Prep sample and the 2009 Year 7 sample of students.
Figure 10: Persisting relationship between SES and attendance over time15
* All correlations significant at p<.001
These findings suggest that the lower the schools’ or students’ SES, the lower the students’ attendance, irrespective of the method for calculating SES. SES is correlated with student attendance as early as in the Prep Year and the relationship is still present many years later. Similar patterns of results were identified for every year level of schooling.
On average, students from lower SES areas exhibit lower attendance rates
It is likely that SES, student attendance and outcomes are interrelated.
The SES of students in Prep in 2008 was considered in relation to their reasons for non-attendance. Unauthorised and unexplained absences were more substantially related to IRSED than other types of
15 Results are presented tracking 2006 IRSED information and 2007 to 2010 attendance information, as indicated.
2006 School IRSED
2008 Prep
Attendance
r = .16
2009 Year 1
Attendance
r = .16
2010 Year 2
Attendance
r = .13
Associated with
2006 School IRSED
2007 Year 5
Attendance
r = .18
2008 Year 6
Attendance
r = .17
2009 Year 7
Attendance
r = .16
Associated with
2006 Student IRSED
2008 Prep
Attendance
r = .21
2009 Year 1
Attendance
r = .22
2010 Year 2
Attendance
r = .19
Associated with
2006 Student IRSED
2008 Year 5
Attendance
r = .18
2009 Year 1
Attendance
r = .19
2010 Year 2
Attendance
r = .20
Associated with

absences. The findings were consistent regardless of whether school or individual measures of IRSED are used as illustrated in Figure 11.
Figure 11: SES and reasons for non-attendance
Investigation of sampled students in Year 1 in 2009 and in Year 2 in 2010 confirm the notion that lower SES is associated with lower levels of attendance. Lower SES was associated with more unexplained and unauthorised absences, but not with more illness-related absences.
Students from lower SES backgrounds tend to exhibit higher levels of unauthorised and unexplained attendance
Attendance and student satisfaction with the school Every year, Queensland state schools undertake opinion surveys with students, parents and school staff. Student satisfaction from the 2010 School Opinion Survey (SOS) was analysed in relation to average student attendance for the same school in 2010.
The SOS is given to a random sample and students complete it on an optional basis. This means the sample might not be representative of students with low attendance rates. Recognising the limitations of available data, the results indicate only a small correlation between higher student satisfaction with the school and higher attendance rates (see Figure 12).
Figure 12: Student Satisfaction and Attendance Rates16
50%
55%
60%
65%
70%
75%
80%
85%
90%
95%
100%
0% 10% 20% 30% 40% 50% 60% 70% 80% 90% 100%
Atten
danc
e Ra
te (%
)
Satisfied Students (%)
2010 Student Satisfaction versus Attendance RatesSatisfied that this is a good school
Likewise, similar patterns based on data from the annual parent SOS in 2010 suggest only a very weak relationship exists between the 2010 parent satisfaction rating and student attendance rates.
Only a slight relationship exists between student satisfaction/parent satisfaction and student attendance
16 2010 data.
Lower Socio-Economic Status
More unexplained and unauthorised absences
SummaryA consideration of factors related to student attendance reveals:
students who move schools are more likely to have lower attendance rates
lower SES is associated with more unexplained and unauthorised absences, but not with more illness-related absences
student and parent satisfaction are only slightly related to attendance.
While these analyses can illustrate the relationships for a range of factors with attendance, they do not suggest this is the reality for each individual student.
Many of these factors are outside of the direct control of the school, but schools may be able to implement strategies to mitigate their impact.

4. Attendance and student outcomesThis section considers the relationship between student attendance and student outcomes. It uses data available from the National Assessment Program Literacy and Numeracy (NAPLAN) results and data on students’ disciplinary absences.
Attendance and student performanceThere is a correlation between students’ attendance rates at school and academic performance. Figure 13 shows higher attendance is associated with higher student performance in all Year 5 NAPLAN areas of numeracy, reading, spelling, writing and grammar & punctuation (using 2009 data).
Figure 13: Queensland state school attendance rateby NAPLAN Year 5 mean scale scores17
300
350
400
450
500
550
600
0.70.750.80.850.90.951
Scal
e Sc
ore Numeracy
Reading
Writing
Spelling
Grammar & Punctuation
School attendance rate
The relationship between attendance and NAPLAN scores shows that each 1 percentage point increase in attendance for Year 5 students is related to higher student outcomes by an average of 2-3 NAPLAN scale score points in numeracy, reading, spelling, writing and grammar & punctuation. While there is a consistent relationship, this does not suggest a causal relationship between attendance rates and academic performance; the relationship is likely to be complex and impacted upon by the range of other factors not available for analysis in these data.
Every day absent may be impacting on student performance—thus, for school attendance, every day counts
Attendance and student performance on NAPLAN are related
17 Attendance rates are for Semester 1, 2009 and NAPLAN Year 5 data for 2009 are shown.
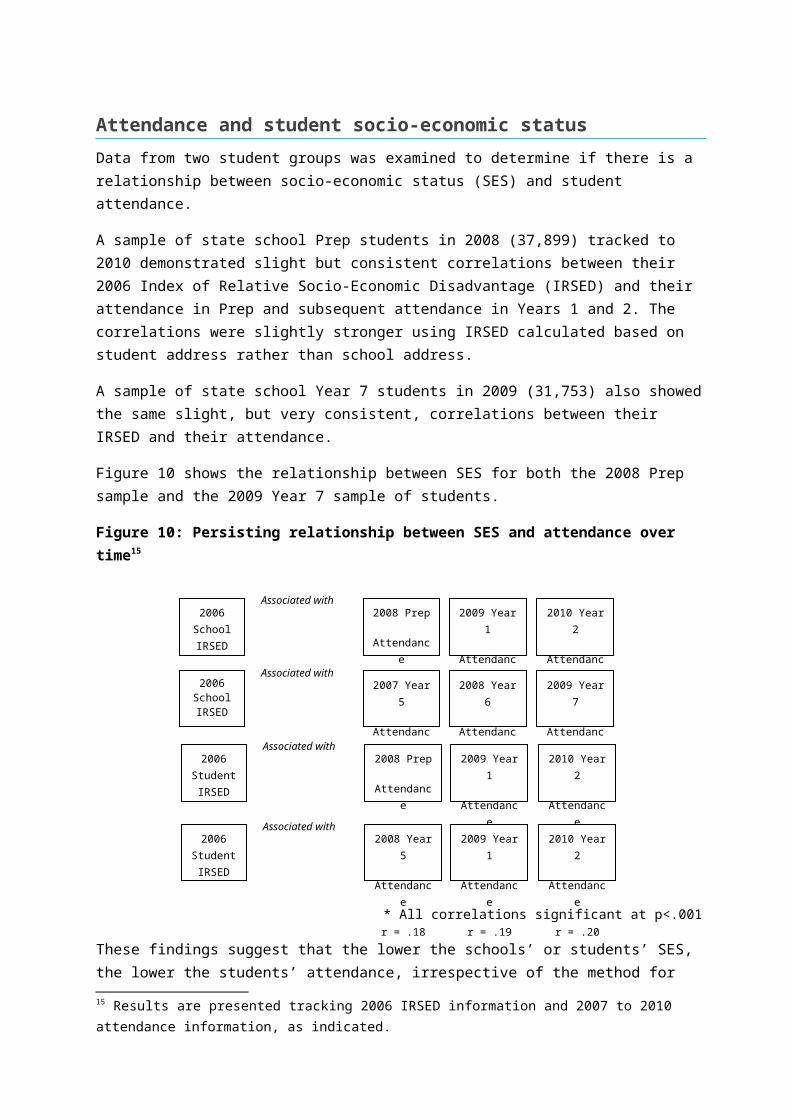
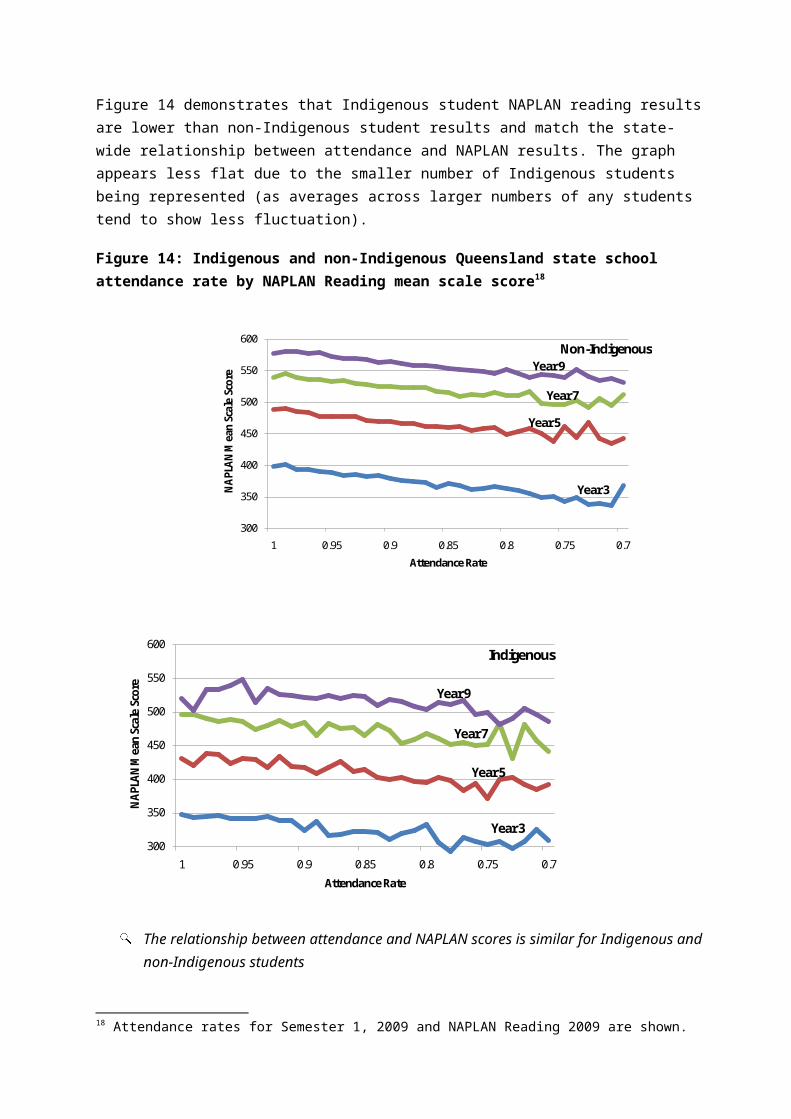
Figure 14 demonstrates that Indigenous student NAPLAN reading results are lower than non-Indigenous student results and match the state-wide relationship between attendance and NAPLAN results. The graph appears less flat due to the smaller number of Indigenous students being represented (as averages across larger numbers of any students tend to show less fluctuation).
Figure 14: Indigenous and non-Indigenous Queensland state school attendance rate by NAPLAN Reading mean scale score18
300
350
400
450
500
550
600
1 0.95 0.9 0.85 0.8 0.75 0.7
NAP
LAN
Mea
n Sc
ale
Scor
e
Attendance Rate
Non-IndigenousYear 9
Year 7
Year 5
Year 3
300
350
400
450
500
550
600
1 0.95 0.9 0.85 0.8 0.75 0.7
NAP
LAN
Mea
n Sc
ale
Scor
e
Attendance Rate
Indigenous
Year 9
Year 7
Year 5
Year 3
The relationship between attendance and NAPLAN scores is similar for Indigenous and non-Indigenous students
Relative effect of attendance in various years on reading and numeracyAlthough student attendance tends to be higher in the early years of schooling, the effect of each day absent in the early years may be greater than in the later years. Each day absent in the earlier years
18 Attendance rates for Semester 1, 2009 and NAPLAN Reading 2009 are shown.
appears to have a more deleterious effect on student performance than a day in later years, and the effects appear greater for some areas of NAPLAN than others.
Analysis based on 2009 NAPLAN Reading Scale Scores and attendance rates shows that the relative impact of less than 95% attendance (more than 10 days absent) at Year 3 is 2.1 times the effect of the same rate of attendance in Year 9. At less than 85% attendance (more than 30 days absent) the relative effect at Year 3 is approximately 1.2 times that at Year 9.
Extrapolating this trend suggests that less than 95% attendance in Year 1 may have as high as three times the effect at Year 10 and 7 times at Year 12. Similar estimations for the effect of less than 85% attendance at Year 1 suggest that the effect may be 1.4 times at Year 10 and 1.5 times at Year 12. The relationships presented here suggest that lower attendance results in lower performance but we cannot establish causality with the available data.
Each day absent in the early years has a greater effect on reading performance in the later years
In contrast to the higher relative impact of early attendance on reading, the attendance in later years has a greater impact on numeracy (2009 NAPLAN scale scores). The relative effect of 95% attendance (10 missed days of school) at Year 9 is 1.2 times higher than the effect at Year 3. For students with 85% attendance, the relative effect at Year 9 is 1.1 times higher than the effect at Year 3.
Extrapolating this trend suggests that less than 95% attendance (more than 10 day absent) in Year 12 may have 1.3 times the effect at Year 1. Similar estimations for the effect of 85% attendance at Year 12 suggest that the effect may be 1.4 times higher than the effect at Year 1.
Each day absent in the later years of schooling has a greater effect on numeracy in the later years
These findings do not imply causality, but reveal a complex and interesting relationship between attendance and achievement. One aspect of this complexity is that the differential impact of attendance on student outcomes over time may be less apparent when using school attendance rates.
More students are absent from school more often in later years, which tends to focus school initiatives on non-attendance in later years. However, these data suggest the effect of non-attendance on student development may be just as large or larger in earlier years.
A focus on school attendance rates or the absolute number of days absent may disguise the relatively higher impact of non-attendance in the early years

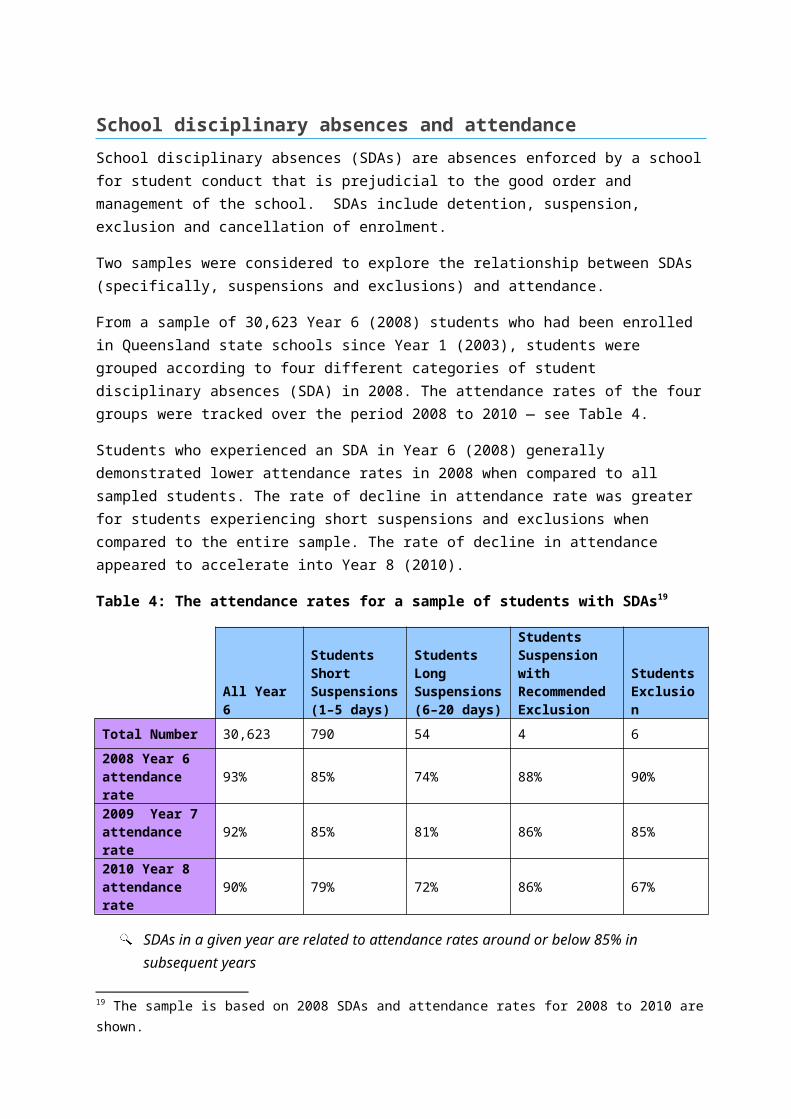
School disciplinary absences and attendanceSchool disciplinary absences (SDAs) are absences enforced by a school for student conduct that is prejudicial to the good order and management of the school. SDAs include detention, suspension, exclusion and cancellation of enrolment.
Two samples were considered to explore the relationship between SDAs (specifically, suspensions and exclusions) and attendance.
From a sample of 30,623 Year 6 (2008) students who had been enrolled in Queensland state schools since Year 1 (2003), students were grouped according to four different categories of student disciplinary absences (SDA) in 2008. The attendance rates of the four groups were tracked over the period 2008 to 2010 — see Table 4.
Students who experienced an SDA in Year 6 (2008) generally demonstrated lower attendance rates in 2008 when compared to all sampled students. The rate of decline in attendance rate was greater for students experiencing short suspensions and exclusions when compared to the entire sample. The rate of decline in attendance appeared to accelerate into Year 8 (2010).
Table 4: The attendance rates for a sample of students with SDAs19
All Year 6
Students Short Suspensions(1–5 days)
Students Long Suspensions(6–20 days)
Students Suspension with Recommended Exclusion
Students Exclusion
Total Number 30,623 790 54 4 6
2008 Year 6 attendance rate 93% 85% 74% 88% 90%
2009 Year 7 attendance rate 92% 85% 81% 86% 85%
2010 Year 8 attendance rate 90% 79% 72% 86% 67%
SDAs in a given year are related to attendance rates around or below 85% in subsequent years
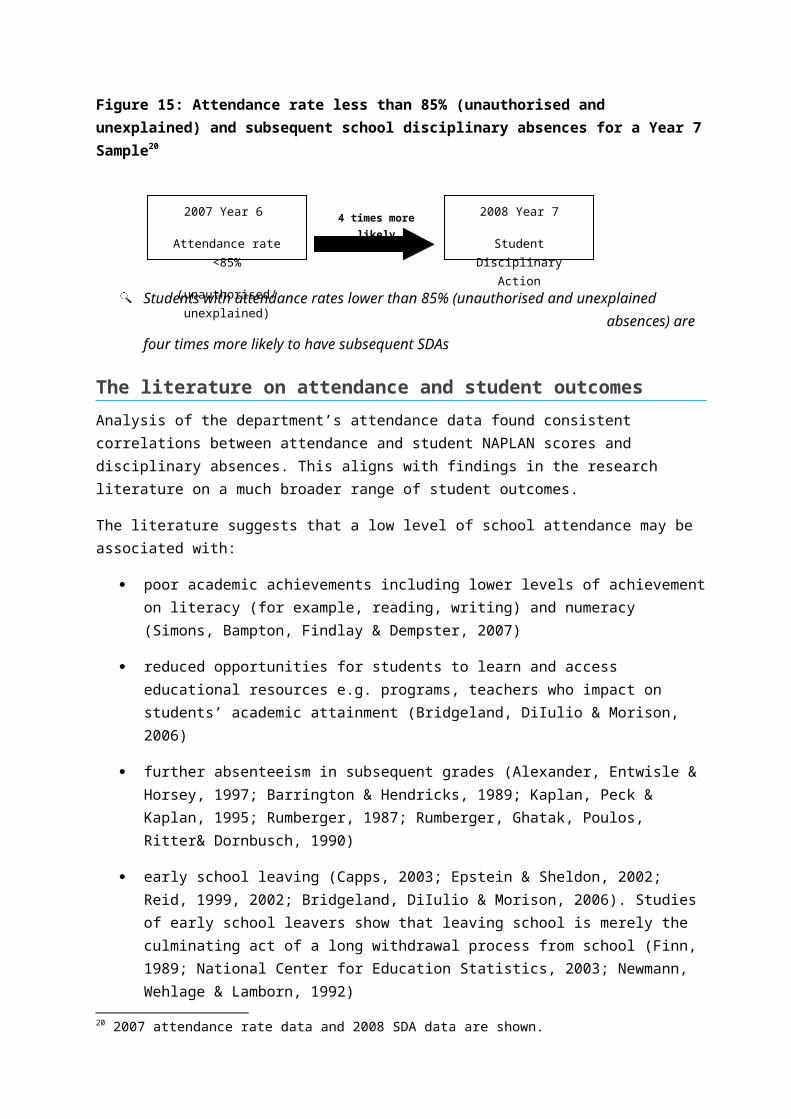
A different sample of 33,402 Year 7 students (2008) revealed that attendance patterns statistically predict subsequent school disciplinary absences. A previous attendance rate of less than 85% in 2007 comprised only of unauthorised or unexplained absences was strongly related to students having an SDA in the subsequent year. Students with profiles of high levels of unauthorised or unexplained absences (for example, more than 20 days) were over four times more likely to experience student disciplinary absences in the subsequent year when compared to those with higher attendance (Figure 15).
19 The sample is based on 2008 SDAs and attendance rates for 2008 to 2010 are shown.
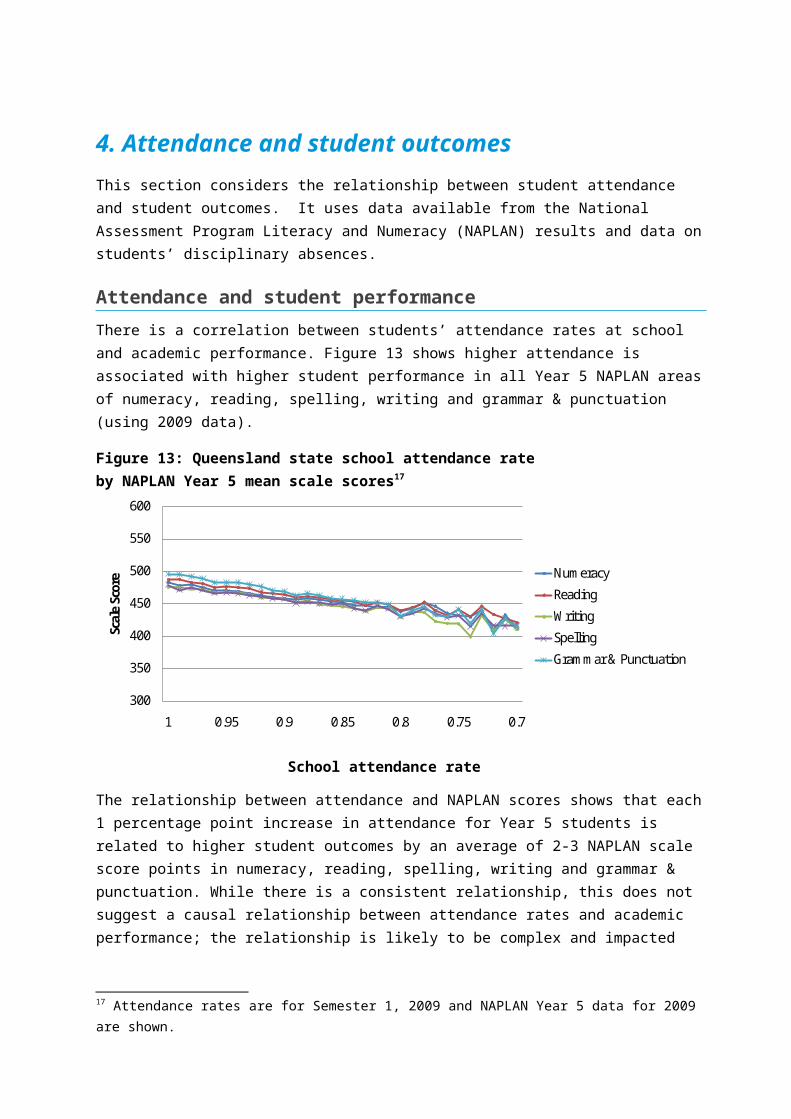
Figure 15: Attendance rate less than 85% (unauthorised and unexplained) and subsequent school disciplinary absences for a Year 7 Sample20
Students with attendance rates lower than 85% (unauthorised and unexplained absences) are four times more likely to have subsequent SDAs
The literature on attendance and student outcomesAnalysis of the department’s attendance data found consistent correlations between attendance and student NAPLAN scores and disciplinary absences. This aligns with findings in the research literature on a much broader range of student outcomes.
The literature suggests that a low level of school attendance may be associated with:
poor academic achievements including lower levels of achievement on literacy (for example, reading, writing) and numeracy (Simons, Bampton, Findlay & Dempster, 2007)
reduced opportunities for students to learn and access educational resources e.g. programs, teachers who impact on students’ academic attainment (Bridgeland, DiIulio & Morison, 2006)
further absenteeism in subsequent grades (Alexander, Entwisle & Horsey, 1997; Barrington & Hendricks, 1989; Kaplan, Peck & Kaplan, 1995; Rumberger, 1987; Rumberger, Ghatak, Poulos, Ritter& Dornbusch, 1990)
early school leaving (Capps, 2003; Epstein & Sheldon, 2002; Reid, 1999, 2002; Bridgeland, DiIulio & Morison, 2006). Studies of early school leavers show that leaving school is merely the culminating act of a long withdrawal process from school (Finn, 1989; National Center for Education Statistics, 2003; Newmann, Wehlage & Lamborn, 1992)
leaving school with fewer qualifications (National Audit Office, UK, 2005)
alcohol, tobacco, and substance use in adolescents (Hallfors, Vevea, Iritani, Cho, Khatapoush & Saxe, 2002); attendance is a stronger predictor of youth substance use than academic achievement (Hallfors, et al, 2002; Hendricks et al, 2010)
unemployment and long-term unemployment (Rumberger, 1987)
labour force status (Rumberger, 1987)
increased likelihood of poverty (Bell, Rimmer & Rimmer, 1992)
criminal activity (Harlow, 2003)
lower level of health/life expectancy (Cohen & Soto, 2002).
20 2007 attendance rate data and 2008 SDA data are shown.
2007 Year 6
Attendance rate <85%
(unauthorised/unexplained)
2008 Year 7
Student Disciplinary Action
4 times more likely

Gottfried (2009) found that distinguishing between authorised or unauthorised absences is important for isolating the impact of low attendance. A higher proportion of authorised absences to total absences is linked to a positive relationship between reading and math test scores. Conversely, students with a higher proportion of unauthorised absences display lower achievement.
It is plausible for some factors that contribute to low levels of attendance also independently lead to some of these outcomes. On the other hand, it may be that a student’s attendance itself is a critical factor in a disengagement process, which leads directly to some of these adverse outcomes. At a minimum, it can be asserted that poor attendance at school, particularly with a high number of unexplained absences, is a readily observable warning flag for potential future adverse outcomes.
Poor attendance can be an early warning flag for potential future adverse outcomes
SummaryIn terms of student attendance and student outcomes:
attendance has a strong and persisting relationship with student outcomes as measured by NAPLAN scores
each day absent in the early years has a stronger relationship with lower performance reading in later years
each day absent in the later years has a stronger relationship with lower performance numeracy in the later years
a focus only on the number of days absent in the later years as a school trigger for intervention may obscure the relatively higher impact of non-attendance in the early years on later outcomes
unauthorised and unexplained absences have the strongest correlations with lower student outcomes
Student Disciplinary Absences (SDAs) in a given year are related to attendance rates below 85% in subsequent years
an attendance rate of lower than 85% (unauthorised absences) is related to subsequent SDAs
research literature suggests a number of adverse outcomes are related to lower student attendance levels.
It is important to note that a statistical correlation does not establish a causal relationship between two factors and it is not asserted that attendance has a simple causal relationship with student outcomes. In addition, although the patterns indicate probability, they do not predict the experience of each or every student. This information may prove useful in informing responses to student attendance at the system, school, community, family and/or student levels.
These findings suggest that students, parents and school staff need to find ways to ensure all students maximise their attendance at school. Knowledge about how schools function and what underpins human behaviour and motivation must also be considered in using these findings.
The evidence suggests that developing and nurturing high levels of school attendance throughout schooling is likely to support improved learning outcomes and improved future attendance patterns.
5. Improving attendance — what the research revealsThis section provides an overview of the national and international research on the reasons for student absence as well as the effectiveness of strategies to improve school attendance. Schools have only limited influence over some factors, but a clear picture of all factors is important to developing locally responsive initiatives for students.
Factors influencing student absencesStudents are absent from school for different reasons, depending on the age and circumstances of each student.
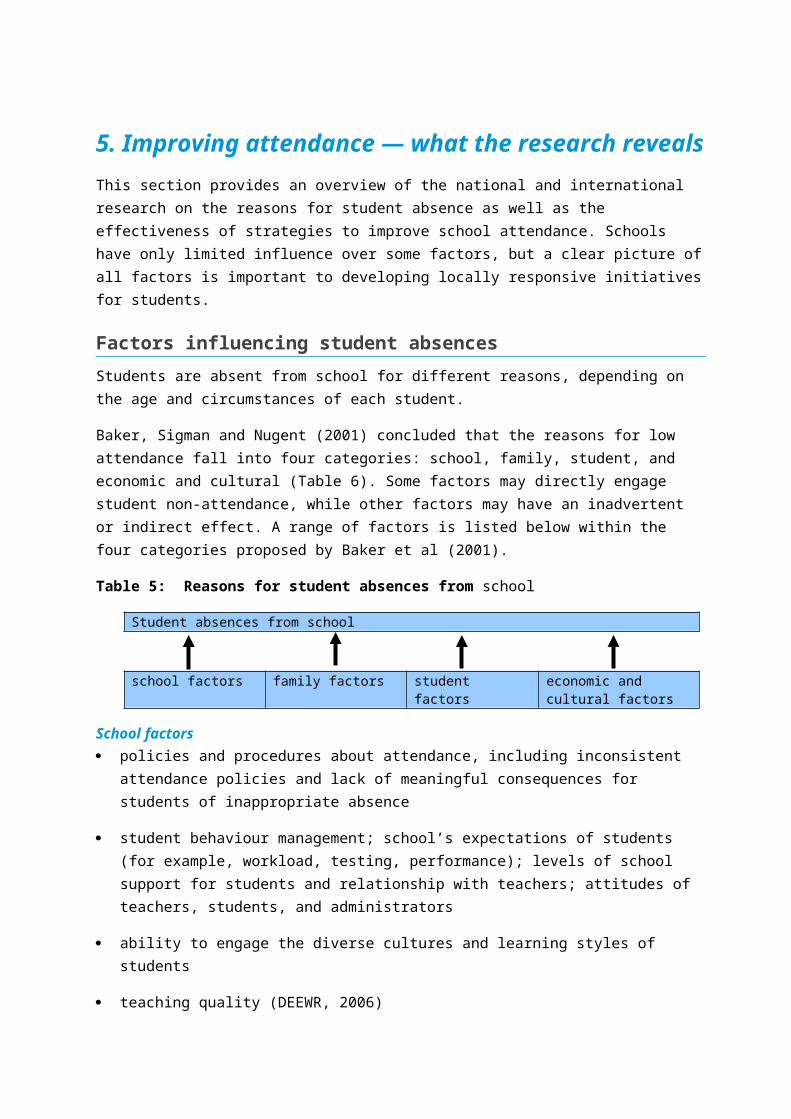
Baker, Sigman and Nugent (2001) concluded that the reasons for low attendance fall into four categories: school, family, student, and economic and cultural (Table 6). Some factors may directly engage student non-attendance, while other factors may have an inadvertent or indirect effect. A range of factors is listed below within the four categories proposed by Baker et al (2001).
Table 5: Reasons for student absences from school
Student absences from school
school factors family factors student factors economic and cultural factors
School factors policies and procedures about attendance, including inconsistent attendance policies and lack of
meaningful consequences for students of inappropriate absence
student behaviour management; school’s expectations of students (for example, workload, testing, performance); levels of school support for students and relationship with teachers; attitudes of teachers, students, and administrators
ability to engage the diverse cultures and learning styles of students
teaching quality (DEEWR, 2006)
the response by schools to monitoring attendance and intervening when issues arise for a student is critical to ensuring attendance rates remain high
Family or home factors specific parental behaviours such as limited monitoring of student whereabouts
parents not being aware of attendance laws and obligations
lack of parental insistence that children go to school in the morning (DEEWR, 2006)
differing views about education (Baker et al 2001) or lack of value for education

competing family priorities; for example, conflicts, getting organised, preparation of lunches, babysitting, transport, holidays or students caring for other family members
domestic violence, child abuse or neglect, drug or alcohol issues
employment obligations of parents and carers and inflexible employers
Student factors past negative school experiences, lack of interest in school and education and levels of self-insight
and knowledge about future pathways and the links between school attendance, educational outcomes and work, personal occupational goals and school completion
habituated school absence or misunderstanding or ignorance of attendance laws and incentives (Baker et al., 2001; Rohrman, 1993)
conflict with other students and teachers or lack of school-engaged friends (DEEWR 2006)
being bullied (Gastic, 2009)
need to demonstrate ‘adult’ behaviour, rejection of authority (Moffit, 1993)
levels of attention in classes, lower levels of literacy and numeracy achievement
students’ health and wellbeing; for example, low self-esteem, physical health (for example, long-term illness) including asthma (Moonie et al, 2008) or high levels of anxiety (Baker et al, 2001)
drug and alcohol use (Reid 2010)
Economic and cultural factors low socio-economic status (Attwood & Croll, 2006)
single parent families
parents with multiple jobs
the need for student employment to supplement family incomes
a lack of affordable transportation to school
the lack of affordable child care for students with parenting responsibilities
higher family mobility rates
cultural obligations; for example, Sorry Business or commitments by families to significant cultural celebrations, such as Chinese New Year.
Attendance may relate directly or indirectly by a range of school, family/home, individual student, economic and cultural factors
Reasons for absence from school may be complex and inter-related
Schools have limited influence over some factors which may impact on attendance
Student views on reasons for their non-attendanceGiven that poor attendance, particularly unauthorised absences, may indicate a trend in disengagement from school, students’ views on attendance can potentially give unique insights into ways to improve school attendance. Students with low attendance rates report a range of reasons for this, including:
poor relationships with teachers, including teaching that doesn’t match their expectations (White 2009)
student perception of the classroom or teacher as disorganised or uncaring (Duckworth & DeJong, 1989; Roderick et al, 1997)
a general dislike of the atmosphere of the school or a dislike of schoolwork (Reid, 2010)
school programs seen by students as irrelevant, too difficult or too easy (Clement, Gwynne, and Younkin, 2001)
preferring to be truant and deal with the consequences rather than attending school (Reid, 2010)
suspensions (Clement, Gwynne, and Younkin, 2001)
feeling unsafe (Clement, Gwynne, and Younkin, 2001)
issues such as anxiety.
It is interesting that these studies found young people’s perceptions are related most to characteristics of the school, rather than the other types of factors identified by Baker et al (2001).
Students’ views on their reasons for non-attendance are important for determining successful strategies to promote attendance
Evidence base on strategies to increase student attendanceInternational literature shows that strategies to encourage students to attend school range from the use of recognition and reward enticements, such as prizes, to fines or threats of imprisonment for parents or guardians of chronically truant students (Henderson, 1999). Collaborations with families to reduce absenteeism through home–school connections are also recognised as an important strategy to increase student attendance (Cimmarusti, James, Simpson, & Wright, 1984; Corville-Smith, Ryan, Adams, & Dalicandro, 1998; Epstein & Sheldon, 2002; Weinberg & Weinberg, 1992; Ziesemer, 1984).
Strategies to improve student attendance are often used in combination with, or overlap, strategies to enhance behaviour, wellbeing or learning. While this combination of strategies reflects the reality of working with students, it does mean it can be difficult to measure the specific factors that are impacting directly on attendance rates, or determine exactly how much each factor is contributing to changes in attendance.
A search of ‘school attendance’ on the Educational Resources Information Centre (ERIC) website found almost 10,000 related publications. However, only a few measured and reported on school programs (Corville-Smith, 1995; Epstein & Sheldon, 2002; Hendrickson 2010). The evidence base of successful programs for Indigenous students in Australia is also not strong (Purdie & Buckley 2010).

Gerrard, Burhans and Fair (2003) found only 28 articles that contained some research evidence of program effects although many of these were not peer-reviewed. They explored findings on studies with commonly used strategies to increase student attendance (see Table 7) and concluded that some evidence existed for certain strategies, but that overall it did not constitute a substantial body of evidence.
Table 6: Overview of the evidence for attendance strategies
Some evidence Inconclusive results No Evidence Not tested Relationship-building Contacting parents
regarding absenteeism
Incentives for parental responsibility
Including parents in truancy prevention activities
Strong and clear attendance policies
Family counselling Intensive school
interventions Ongoing truancy
prevention programs School staff trained,
committed, and supported
Rewards and/or incentives for attendance
Peer group counselling
Probation officers devoted to truancy cases
Financial sanctions against families
Wearing school uniforms decreases absenteeism
Publicising good attendance Make-up work for absentees Involving truants in
extracurricular activities Creating a pleasant
classroom environment, classroom attendance reward system, and individualising student work
Letters from the principal to the parents
Alternative scheduling Attendance contracts Individual, group and family
counselling Testing for learning problems Home visits by school or
community staff Police sweeps of frequent
neighbourhood hangouts Media campaigns
(Gerrard et al, 2003)
More recently Maynard, Tyson-McCrea, Pigott and Kelly (2011) reiterated concern about the lack of a strong evidence base related to attendance strategies. Of the extensive body of research literature on attendance, Maynard et al (2011) found only 62 studies that looked at program effectiveness, of which 33 met their required criteria for inclusion in a meta-analysis of intervention effects.
Maynard et al (2011) found some positive findings in their meta-analysis with an overall effect size of interventions of 0.47, that is, a moderate effect. Although some interventions demonstrated a moderate average effectiveness, the average absence rates after intervention for the majority of studies remained above 10%. Thus the improvement was still less than that required for schools to reach levels of regular attendance above 90%. This is sobering in terms of what schools are aiming to achieve and reflects the fact that school attendance is a marker for a range of complex social issues that students experience.
A wide variety of strategies to increase student attendance have been tried, however the evidence base for effective strategies is not strong
School attendance is a marker for a range of complex social issues
Strategies to increase student attendance
Walls (2003) noted that no one program or strategy will be suitable for every student and every school. Locally appropriate strategies, and possibly a combination of strategies, will be necessary to address the range of contributing factors in student attendance. Reardon (2008) categorised strategies to increase attendance as:
connective or affective approaches: relational approaches that offer services (opportunities) to families and/or students or strengthen family–school relationships
incentives or reward-based approaches: approaches that provide incentives or rewards for students to attend school
sanctions or punitive approaches: approaches that punish the student/parent for school absences.
Schools often adopt mixed connective and incentive approaches for all students as a universal approach to attendance. Schools may also use other strategies less frequently, including integrated family support, prosecution of parents for non-attendance or providing alternative education programs for students with on-going non-attendance patterns. Strategies commonly used in schools to increase student attendance are listed in Table 7.

Table 7: Categories of school attendance strategies
Connective Incentives Sanctions
Integration and coordination of services available to students and families
Individual or family counselling , mentoring or case management21,22
Individualised contracts that enable the student to express reasons for non-attendance
Social marketing campaigns that promote the benefits of school attendance or raising awareness of the importance of attendance
Using technology to alert parents to student non-attendance
Data taxonomies to better understand attendance patterns23
School attendance Improvement plans24 or attendance audits
Computerised attendance registration systems
Support to families such as referral to community services for families to receive financial, social and occupational support
Increasing parental involvement in education by improving parent-teacher communication, use of translators, parental participation in classroom activities, home visits
Assigning part grades based on attendance
Exemption for final exams based on good attendance record
Prizes for good attendance (for example, vouchers, pizza days)
Privileges of a child’s choice No school no pool policy –
reward access to local swimming pool based on school attendance
Withholding grades or credit points
Assigning a fail for assignments or tests held on a day a student is absent
A student not being able to make up work/grades for being absent
A student not being able to attend a school function or sport activity (for example, no school no play declarations administered by sporting organisations)
On the spot fines for parents25
Liaison with police to enforce truancy laws
Policy action including prosecutions of parents for their child’s non-attendance
Sanctions on parents (for example, withholding income support payments) 26,27
No school no pool policy – students not allowed to swim during or after school based on attending28
Adapted from Reardon (2008)
21Youth Connections 22UK Fast Track to Attendance Strategy 23
US Every School Day Counts 24Every Day Counts 25Antisocial Behaviour Act2003 (United Kingdom)26The Improving School Enrolment and Attendance through Welfare Reform Measure (SEAM) 27Family Responsibilities Commission Act 2008 28 http://www.health.gov.au/internet/main/publishing.nsf/Content/ohp-ieh-conf2004.htm~ohp-ieh-conf2004-story.htm~ohp-ieh-conf2004-story-03.htm

The National Centre for School Engagement (NCSE, 2007), found successful programs in improving school attendance are more likely to:
be family focused have intensive case management consist of both sanctions for continued truancy and reward for improved attendance.
DeSocio et al (2007) suggested that family engagement was enabled by: inviting parents to participate in developing a re-entry plan that addresses practical issues
such as getting alarm clocks, accessing school transport or changing family routines providing transport support for attending school meetings.
Students with persistent low attendance and their families often experience a myriad of barriers to school attendance, including poverty, lack of parental aspiration, lack of transport, poor physical health, and a lack of peer relationships with higher attending students (Baker et al., 2001). Hendricks et al (2010) suggest a collaborative, comprehensive intervention that involves the school, social service agencies, justice system and family can have a substantial positive impact on attendance, particularly for chronic non-attendance. Further information on selected attendance programs are described in Appendix 2.
SummaryThe evidence base for identifying strategies effective in improving student attendance is not particularly strong, although the evidence is building gradually. Given the demonstrated relationship between attendance and student outcomes, this is a concerning gap in the research literature. Much remains to be done to build this evidence base to support schools to choose and implement effective, sustainable strategies.
When schools develop programs of school, family, and community partnerships, they have higher levels of parent involvement, higher student attendance rates, higher percentages of students pass standardised achievement tests, and schools take fewer disciplinary actions with students (Desimone, Finn-Stevenson, & Henrich, 2000; Epstein, 2001; Sheldon, 2003a; Sheldon, 2003b; Sheldon & Epstein, 2002; Sheldon & Van Voorhis, 2004).
As numerous authors have commented, no single program will accommodate the needs of every student, school and community. Schools and communities need to work together to select an approach suitable to their own context. Successful schools have implemented a range of strategies, including connective and reward approaches for all students, and specific individualised responses for some students.
6. Queensland state schools contextEvery Day Counts is a state-wide initiative addressing student attendance at school. The initiative is designed to change parent, community and student attitudes to school attendance. It requires the support of parents and the community to maximise student attendance.
Every Day Counts promotes four key messages:
all children should be enrolled at school and attend on every school day schools should monitor, communicate and implement strategies to improve regular school
attendance truanting can place a student in unsafe situations and impact on their future employability and
life choices attendance at school is the responsibility of everyone in the community.
Materials for schools including fact sheets for parents and case studies are available at http://education.qld.gov.au/everydaycounts/.
The following section provides an overview of promising practices in Queensland state schools with impressive improvements in student attendance.

7. PROMISING PRACTICES IN QUEENSLAND STATE SCHOOLSMaximising student attendance is a key aim for all schools. Various strategies have been adopted at the state and school levels and examining the strategies of schools that have improved student attendance can highlight important insights for others. This section reports on strategies and experiences of schools in Queensland.
Identifying schools with improvements in attendanceThe ten Queensland state schools with the largest attendance gains between 2007 and 2011 were identified to examine approaches employed by those schools. These schools are listed in Table 8 and provided the basis of case study work.
Table 8: Schools (with more than 100 students) with largest attendance gain29
Host centre name Attendance rate gain2007-2011(percentage points)
Spinifex State College – Mt Isa Education and Training Precinct
9.2
Woodridge State High School 6.7Mabel Park State High School 6.1Kingston College 5.9Cunnamulla State School 5.2Western Cape College 4.7Glenala State High School 4.0Mornington Island State School 4.0Merrimac State High School 3.7Charters Towers State High School 3.4
Investigating school-based practices and programsOn-site interviews were conducted with principals and staff to help identify reasons their school’s attendance rates had improved. The interviews collected information on successful innovations or interventions the schools had put in place to improve student attendance.
Schools were asked to provide information on the sorts of strategies in place to increase student attendance, particularly strategies they had also found successful in improving learning outcomes. The semi-structured interview schedule used is at Appendix 3.
Case Study 1: Woodridge State High School
29Gain is calculated by comparing 2011 to 2007 attendance rates. Excluding Youth Education and Training Centres and Schools of Distance Education
Student attendance at Woodridge State High School improved by 4.8 percentage points between 2007 and 2010, with an improvement in the attendance rate of over seven percentage points between 2008 and 2010.
A dedicated Student Attendance Team (the ‘A Team’) is central to Woodridge State High School’s improvement. The ‘A Team’ developed protocols for intervention when students are absent including:
parents of students with two days unexplained absence from school receive a telephone call from the ‘A Team’ Leader
parents of students with four days unexplained absence from school receive a home visit from the ‘A Team’ Leader
action planning and weekly reviews for every student with low attendance rates.
Students with persistent low attendance are monitored at a weekly ‘A Team’ meeting and strategies considered to increase their attendance and/or engage them in a suitable continuing education program. Wireless internet in the school has enabled teachers to efficiently record student attendance in real time. Daily reports on student attendance and weekly ‘A Team’ meetings mean proactive follow-up of student absences.
Central to the success of Woodridge State High School has been the Logan Community Attendance Team. This initiative involves strong partnerships with local business that refuse to serve children of school age during school hours and local residents who telephone the school if they see students truanting. Community Elders and the Queensland Police Service (QPS) are also involved.
The ‘A Team’ works with parents to help raise expectations, create routines and provide basic needs. Support provided to families includes referrals to employment assistance, welfare or mental health services.
Woodridge State High School utilises an incentive scheme by rewarding students with high attendance rates with certificates presented at school assemblies. Other strategies employed by the school include:
lunchtime programs one on one sessions for students requiring more intensive support ‘Knowing Your Student’ is a central theme to the Woodridge State High School approach to
personalised learning professional development including coaching and mentoring for all leadership staff in 2010
and all teaching staff in 2010.
Principal John Norfolk said: ‘Having the students attend school regularly is the beginning of a partnership and commitment from the school to ultimately deliver further education, training or employment.’

Case Study 2: Mabel Park State High SchoolThe Mabel Park State High School student attendance rate improved by 5.6 percentage points between 2007 and 2010 and by 11.2 percentage points between 2009 and 2010. The school’s success was grounded on a systematic approach to attendance combined with a focus on pedagogy.
Systems accurate and timely recording of student absences training scenarios for staff on coding the reasons for student absences more accurately clarification of roles and responsibilities for attendance between students, staff and parents use of SMS and email to notify parents of student absences weekly reports to all school staff on the attendance rates for all year levels and classes monitoring and review of attendance patterns (especially unexplained and unauthorised
absences) the attendance officer and deputy principal meet regularly to discuss the coordination of
responses to student absences.
Spotlighting attendance – making student attendance a ‘big deal’ consistent messages to the whole school community at school assemblies, in school
newsletters and at staff meetings that missing school is a ‘big deal’ setting a public attendance target of 95% for all students taking a ‘no-tolerance’ approach to unexplained absence by setting a zero unexplained
absence target for every student educating parents and carers to understand their legal obligation to ensure their child attends
school encouraging parents not to condone absences for reasons such as shopping, birthdays or to
look after siblings offering support to parents if their child refuses to attend school involving students in calculating their own attendance rate every month using rewards for students including “Excellent Attendance” certificates and letters to parents
about student effort and achievement introducing an incentive program where students achieving at least 95% attendance are
eligible to enter a draw for vouchers.
Improving pedagogy across the whole schoolMabel Park State High School has adopted an instructional model that focuses on high-quality teaching and learning, reviewing performance targets every five weeks and a staff coaching model. These seem to have contributed to improved behaviour and contributed to better attendance. The school no longer uses a ‘withdrawal room’ to manage student behaviour.
During the interview, Principal Mike O’Connor summed up the importance of good student attendance: “We can’t improve student learning outcomes if our students don’t attend.”

8. ConclusionThis paper has explored the department’s data, research literature and practical experience of schools as sources of evidence that can inform departmental initiatives and school-based decision making.
Schools are well aware of the importance of student attendance but, as the research indicates, schools alone have a limited capacity to influence external factors contributing to student attendance rates. These external factors can include student and family influences, but schools can take steps and implement strategies to mitigate the impact of such factors. The key strategies for schools are: communicating regularly to students and parents about the value of school attendance (and the long term cost of non-attendance), engaging with students and families about factors that can be influenced, and addressing factors at school that impact on student engagement.
The research points to the importance of a school culture that focuses on valuing and rewarding attendance and providing consequences (not punishment alone) for non-attendance. Reasons for student absences are varied, and necessitate responses that take individual students’ and their family situations into account. Some evidence exists for effective strategies for improving attendance, however, the research evidence base does not provide guaranteed strategies for schools.
Finally, the case studies from Queensland schools that have improved attendance rates highlight that communicating the value of attendance, responding rapidly to non-attendance and assisting parents/caregivers are features in improving student attendance rates.
The key findings of this report are listed below:
Why attendance is important
Low student attendance could be an early warning sign for future adverse outcomes including low educational achievement
Poor attendance represents a substantial loss of educational opportunity
Parents/caregivers and schools can positively influence factors related to student attendance
Patterns of student attendance
Approximately 70% of students attend school at least 90% of the time Approximately 30% of students had attendance rates below 90%, which means they were
absent for more than 20 days of school in the year Regions with more rural and remote schools have a higher proportion of students with
attendance rates below 85% Average student attendance declines in Years 8, 9 and 10, with a sharper decline for
Indigenous students Attendance can be predicted with some confidence based on prior attendance
Attendance related student factors
Students who move between schools more often tend to have lower attendance rates On average, students with lower SES exhibit lower attendance rates
Attendance and student outcomes
Attendance and student performance on NAPLAN are related The relationship between attendance and NAPLAN scores is similar for Indigenous and non-
Indigenous students Each day absent in the early years appears to have a greater effect on reading performance in
later years while each day absent in the later years of schooling has a greater effect on numeracy performance in the later years
SDAs in a given year are related to attendance rates around or below 85% in subsequent years Students with attendance rates lower than 85% (due to unauthorised absences) are four times
more likely to have subsequent SDAs
Improving attendance — what the research reveals
Low attendance may be impacted directly or indirectly by a range of school, family/home, individual student, economic and cultural factors and the reasons for non-attendance may be complex and inter-related
Schools have limited influence over many factors which impact on attendance but some Queensland state schools have demonstrated they can increase student attendance in powerful ways
Students’ views on their reasons for non-attendance are important for understanding influences and strategies
A wide variety of strategies to increase student attendance have been tried, however the evidence base for effective strategies is not strong

References/BibliographyALEXANDER, K. L., ENTWISLE, D. R., & HORSEY, C. S. (1997). From first grade forward: Early foundations of high school dropout. Sociology of Education, 20, 87-107.
ALMEIDA, M. C., AQUINO, E. M. & DE BARROS, A. P. (2006). School trajectory and teenage pregnancy in three Brazilian state capitals. Cadernos de Saude Publica, 22: 1397-1409.
ATKINSON, M., HALSEY, K., WILKIN, A. & KINDER, K. (2000).Raising Attendance 1: Working Practices and Current Initiatives with the Education Welfare Service. Slough: National Foundation for Educational Research.
ATTWOOD, G. & CROLL, P. (2006).Truancy in secondary school pupils: prevalence, trajectories and pupil perspectives. Research Papers in Education, 21,4: 467-484.
BAKER, M.L., SIGMAN, J.N.&NUGENT, M.E. (2001). Truancy reduction: Keeping students in school. Washington, D.C.: U.S. Department of Justice, Office of Juvenile Justice and Delinquency Prevention.
BARDSLEY, K., COSTA, P. & WALTON, J. (1999). The essential elements of an effective attendance policy. In E. Blyth and J. Milner (eds), Improving School Attendance, pp. 95-112. London: Routledge.
BARRINGTON, B.L. &HENDRICKS, B. (1989). Differentiating characteristics of high school graduates, dropouts, and non-graduates. Journal of Educational Research, 82,309-319.
BARNET, B., ARROYO, C., DEVOE, M.& DUGGAN, A. K. (2004). Reduced school dropout rates among adolescent mothers receiving school-based prenatal care. Archives of Pediatric and Adolescent Medicine, 158: 262-268.
BARTH, R. P., GREESON, J. K. P., GUO, S., GREEN, R. L., HURLEY, S.& SISSON, J. (2007). Changes in family functioning and child behavior following intensive in-home therapy. Children and Youth Services Review, 29: 988-1009.
BAZEMORE, G.,STINCHCOMB, J and LEIP, L. (2004). Scared smart or bored straight? Testing a deterrence logic in an evaluation of police-led truancy intervention. Justice Quarterly 21(2): 269–98
BIDDLE, N. (2007). Indigenous Australians and preschool education: who is attending? Australian Journal of Early Childhood, 32,3: 9-16.
BELL, A. J., ROSEN, L. A., & DYNLACHT, D. (1994). Truancy intervention. Journal of Research and Development in Education, 27: 203-211.
BELL, D.N.F., RIMMER, R.J. & RIMMER, S.M. (1992). Poverty among young Australians. The Australian Economic Review,5-18.
BLACKTROP, J. & BLYTH, E. (1999). School attendance and the role of law in England and Wales. In E. Blyth and J. Milner (eds), Improving School Attendance, pp. 35-54. London: Routledge.
BOWEN, G. L. &RICHMAN, J. M. (2002). Schools in the context of communities. Children and Schools, 24: 67-71.

BRIDGELAND, J., DIIULIO, J. & MORISON, K. (2006). The silent epidemic: Perspectives of high school dropouts. Washington, DC: Civic Enterprises.
BROOKES, M., GOODALL, E. & HEADY, L. (2007). Misspent Youth: The costs of truancy and exclusion. A guide for donors and funders. New Philanthropy Capital.
BROUSSARD, C. A. (2003). Facilitating home-school partnerships for multiethnic families: School social workers collaborating for success. Children and Schools, 25: 211-222.
BYER, J. J. L.& KUHN, J. (2003). A model response to truancy prevention: The Louisville truancy court diversion project. Juvenile and Family Court Journal, 54: 59-67.
CAPPS, W.R. (2003). The new face of truancy. School Administration, 60, 34.
COHEN, D. & SOTO, M. (2002). Technical Paper No. 197: Why are some countries so poor? Another look at the evidence and a message of hope. Paris: OECD Development Centre.
COUNCIL OF AUSTRALIAN GOVERNMENT (COAG, 2006). Human Capital Reform, Report by the COAG National Reform Initiative Working Group.
CHOU, L.-C., HO, C.-Y., CHEN, C.-Y. & CHEN, W. J. (2006). Truancy and illicit drug use among adolescents surveyed via street outreach. Addictive Behaviors, 31: 149-154.
DEERE, D.R. & VESOVIC, J. (2006). Educational wage premiums and the U.S. income distribution: A survey. In Hanushek, E. and Welch, F. (Eds.) Handbook of the Economics of Education, Volume 1, pp.255-306. Oxford, UK: Elsevier B. V.
DENNY, S. J., CLARK, T. C. & WATSON, P. D. (2003). Comparison of health-risk behaviours among students in alternative high schools from New Zealand and the USA. Journal of Paediatrics and Child Health, 39: 33-39.
DEEWR – Department of Employment and Workplace Relations. (2006).Halls Creek Engaging Families Trial February–July 2006 — Evaluation Report, Australian Government, Canberra.
DESOCIO, J., VANCURA, M., NELSON, L.A., HEWITT, G., KITZMAN, H. & COLE, R. (2007). Engaging truant adolescents: Results from a multifaceted intervention pilot. Preventing School Failure, 51, 3: 3-11.
DOBSON, J., HENTHORNE, K. & LYNAS, Z. (2000).Pupil mobility in schools: Final Report. Migration Research Unit, University College.
DUCKWORTH, K. & DEJUNG, J. (1989). Inhibiting class cutting among high school students. The High School Journal, 72: 188-195.
EPSTEIN, J. L.&SHELDON, S. B. (2002). Present and accounted for: Improving student attendance through family and community involvement. Journal of Educational Research, 95,308-318.
FANTUZZO, J., GRIM, S. & HAZAN, H. (2005). Project start: An evaluation of a community-wide school-based intervention to reduce truancy. Psychology in the Schools, 42: 657-667.
FINN, J.D. (1989). Withdrawing from school. Review of Educational Research, 59,117-142.

GASTIC, B. (2008). School truancy and the disciplinary problems of bullying victims. Educational Review, 60,4: 391-404.
GERRARD, M., BURHANS, A. & FAIR, J. (2003). Effective truancy prevention and intervention: A review of relevant research for the Hennepin County school success project. Wilder Research Center, 1.18.
GOTTFRIED, M. (2009).Excused versus Unexcused: How student absences in elementary school affect Academic achievement. Educational Evaluation and Policy Analysis, 31,4: 392-415 2009.
GRUNBAUM, J. A., KANN, L., KINCHEN, S., ROSS, J., HAWKINS, J.&LOWRY, R., et al. (2004). Youth risk behaviour surveillance – United States, 2003. MMWR Surveillance Summaries, 53: 1-96.
GUTTMACHER, S., WEITZMAN, B. C., KAPADIA, F. & WEINBERG, S. L. (2002). Classroom-based surveys of adolescent risk-taking behaviors: Reducing the bias of absenteeism. American Journal of Public Health, 92: 235-237.
HALLFORS, D., VEVEA, J. L., IRITANI, B., CHO, H., KHATAPOUSH, S. & SAXE, L. (2002). Truancy, grade point average, and sexual activity: A meta-analysis of risk indicators for youth substance use. Journal of School Health, 72: 205-211.
HALLAM, S. & ROGERS, L. (2008).Improving Behaviour and Attendance at School. Berkshire: Open University Press.
HARLOW, C. (2003). Education and correctional populations. Bureau of Justice Statistics Special Report. Washington, DC: U.S. Department of Justice.
HENRY, K. L. & HUIZINGA, D. H. (2007). Truancy’s effect on the onset of drug use among urban adolescents placed at risk. Journal of Adolescent Health, 40: 358.e9-358.e17.
HENDRICKS, M., SALE, E., EVANS, C., MCKINLEY, L.& CARTER, S.(2010). Evaluation of a Truancy Court Intervention in Four Middle Schools. Psychology in the Schools, 47, 2: 173-183.
HOYLE, D. (1998). Constructions of pupil absence in the British education service. Child and Family Social Work, 3, 2: 99-111.
HUIZINGA, D., LOEBER, R., THORNBERRY, T. P. & COTHERN, L. (2000). Co-occurrence of delinquency and other problem behaviors. Juvenile Justice Bulletin, OJJDP.
HUIZINGA, D., LOEBER, R. & THORNBERRY, T. P. (1994). Urban delinquency and substance abuse: Initial findings. Juvenile Justice Bulletin, OJJDP
KEARNY, C. (2008). An interdisciplinary model of school absenteeism in youth to inform professional practice and public policy. Education Psychology Review, 20:257-282.
KENDALL, S., WHITE, R., KINDER, K., HALSEY, K. & BEDFORD, N. (2004).School Attendance and the Prosecution of Parents: Effects and Effectiveness: Final Report. Slough: National Foundation for Educational Research.
LAUCHLAN, F. (2003). Responding to chronic non-attendance: A review of intervention approaches. Educational Psychology in Practice, 19: 133-146.

LEVER, N., SANDER, M. A., LOMBARDO, S., RANDALL, C., AXELROD, J. & RUBENSTEIN, M., et al (2004). A drop-out prevention program for high-risk inner-city youth. Behavior Modification, 28: 513-527.
LOCHNER, L & MORETTI, E. (2001). The effect of education on crime: Evidence from prison inmates, arrests, and self-reports. National Bureau of Economic Research Working Papers 8605. US: National Bureau of Economic Research, Inc.
LOCHNER, L., & MORETTI, E. (2004). The effect of education on crime: Evidence from prison inmates, arrests and self-reports. American Economic Review, 94, 1: 155-189.
MACILDOWIE, D. (1999). Strategies for improving school attendance. In E. Blyth and J. Milner (eds), Improving School Attendance, pp. 113– 125. London: Routledge.
MAYNARD, B.R., TYSON-McCREA, K.& PIGOTT, T. (2011). A Systematic Review and meta-Analysis of Indicated Interventions to Increase Schools Attendance. Society for Research on Educational Effectiveness (ED519165).
MOFFIT, T. (1993).Adolescence-Limited and Life-Course-Persistent Antisocial Behaviour: A developmental taxonomy. Psychological Review, 100: 674-701.
MOGULESCU, S.& SEGAL, H. J. (2002). Approaches to Truancy Prevention. The Vera Institute of Justice. Retrieved August 22, 2006, From Http://Vera.Org/Publication Pdf/197 377.Pdf
MOONIE, S., STERLING, D.A.&FIGGS, L.W.(2008). The Relationship between School Absence, Academic Performance and Asthma Status. Journal of School Health, 78, 3: 140-148.
MORRIS, J. D., EHREN, B. J.& LENZ, B. K. (1991). Building a model to predict which fourth through eighth graders will drop out in high school. Journal of Experimental Education, 59, 3: 286-292.
NATIONAL AUDIT OFFICE (NAO). (2005).Improving School Attendance in London. http://www.nao.org.uk/publications/0405/ improving_school_attendance.aspx Retrieved December 2010.
NATIONAL CENTER FOR SCHOOL ENGAGEMENT. (2007). Pieces of the Truancy Jigsaw: A literature review. An initiative of the Colorado Foundation for Families and Children. Accessed via www.schoolengagement.orgDecember 2010.
NEWMAN-FORD, L., FITZGIBBON, K., LLOYD, S. &THOMAS, S. (2008). A large scale investigation into the relationship between attendance and attainment: a study using innovative, electronic attendance monitoring system. Studies in Higher Education, 33, 6: 699-717.
NEWMANN, F. M., WEHLAGE, G. G., &LAMBORN, S. D. (1992). The significance and sources of student engagement. In F. M. Newmann (Ed.), Student engagement and achievement in American secondary schools, (pp.11-39). New York: Teachers College Press.
PELLEGRINI, D.W. (2007). School non-attendance: Definitions, meanings, responses, interventions. Educational Psychology in Practice, 23, 1:63-77.

PETERSON, C. A., LUZE, G. J., ESHBAUGH, E. M., JEON, H.J.& KANTZ, K. R. (2007). Enhancing parent-child interactions through home visiting: Promising practice or unfulfilled promise? Journal of Early Intervention, 29: 119-140.
PURDIE, N.& BUCKLEY, S. (2010).School attendance and retention of Indigenous Australian students Issues Paper No 1 produced for the Closing the Gap Clearinghouse, September 2010.
REARDON, R. T. (2008). An analysis of Florida’s school districts attendance policies and their relationship to high school attendance rates. www.proquest.com
REID, K. (1999) Truancy and Schools. London: Routledge.
REID, K. (2000). Tackling Truancy in Schools. London: Routledge.
REID, K. (2004). The views of head teachers and teachers on attendance issues in primary schools. Research in Education, 72:60-76.
REID, K. (2007). The views of learning mentors on the management of school attendance. Mentoring and Tutoring, 15: 39-55.
REID, K. (2008). The causes of non-attendance: an empirical study. Educational Review, 60, 4: 345-357.
REID, K. (2010). Finding Strategic Solutions to Reduce Truancy. Research in Education, 84, 1: 1-18.
REYNOLDS, A. J., TEMPLE, J. A., ROBERTSON, D. L. & MANN, E. A. (2001). Long-term effects of an early childhood intervention on educational achievement and juvenile arrest: A 15-year follow-up of low income children in public schools. Journal of the American Medical Association, 285: 2339-2346.
RICHTMAN, K. S. (2007). The truancy intervention program of the Ramsey County Attorney’s Office: A collaborative approach to school success. Family Court Review, 45: 421-437.
RODERICK, M., ARNEY, M., AXELMAN, M., DACOSTA, K., STEIGER, C., STONE, S., VILLEARREAL-SOSA, L.& WAXMAN, E.(1997). Habits hard to break: A new look at truancy in Chicago’s public high schools. Chicago: School of Social Service Administration, University of Chicago.
RUMBERGER, R.W. (1987). High school dropouts: a review of issues and evidence. Review of Educational Research, 57: 101-121.
RUMBERGER, R.W. (1995). Dropping out of middle school: A multilevel analysis of students and schools. American Educational Research Journal, 3, 3: 583-625.
BUMBERGER, R.W., GHATAK, R., ROULOS, G., RITTER, P.L., &DORNBUSCH, S.M. (1990). Family influences on dropout behavior in one California high school. Sociology of Education, 63,283-299.
SHELDON, S.& EPSTEIN, J. (2002).Getting Students to School: Using Family and Community Involvement to Reduce Chronic Absenteeism. School Community Journal.
SHEPPARD, A. (2007). An approach to understanding school attendance difficulties: pupils’ perceptions of parental behaviour in response to their requests to be absent from school. Emotional and Behavioural Difficulties, 12, 4:349-363.

SHOENFELT, E. L. & HUDDLESTON, M. R. (2006). The Truancy Court Diversion Program of the Family Court, Warren Circuit Court Division III, Bowling Green, Kentucky: An evaluation of impact on attendance and academic performance. Family Court Review, 44: 683-695.
SIMONS, R., BAMPTON, M., FINDLAY, A. & DEMPSTER, A. (2007). Student Mobility, Attendance, and Student Achievement: The Power of Implementing a Unique Student Identifier. Paper for the Annual Conference of the Australian Association for Research in Education. Available at: http://www.aare.edu.au/07pap/sim07568.pdf
STRAND, S. (2002). Pupil mobility, attainment and progress during key stage 1: a study in cautious interpretation. British Education Research Journal, 25, 1: 63-78.
TARAS, H. & POTTS-DETMA, W. (2005). Chronic health conditions and student performance at school. Journal of School Health, 75, 7:255-266.
TEASLEY, M. L. (2004). Absenteeism and truancy: Risk, protection, and best practice implications for school social workers. Children and Schools, 26: 117–128.
TOWNSEND, L., FLISHER & KING. (2007). A systematic review of the relationship between high school dropout and substance use. Clinical Child and Family Psychological Review, 10, 4: 295-317.
WALLS, C. (2003). New approaches to truancy prevention in urban schools. ERIC Digest. http://www.ericdigests.org/2004-2/truancy.html
WEI, H. (2007). Measuring option values and the economic benefits of completing secondary education. Canberra: Australian Bureau of statistics.
WESTERN AUSTRALIAN AUDITOR GENERAL (2009).Every Day Counts: Managing Student Attendance in Western Australian Public Schools. http://www.audit.wa.gov.au/reports/pdfreports/report2009_09.pdf Accessed 5 February 2011.
WHITNEY, B. (1998).The Complete Guide to Attendance and Absence. London: Croner Publications Ltd.
WILLMS, J.D. (2003). Student engagement at school: A sense of belonging and participation results from PISA 2000. Organisation for Economic Co-operation and Development.
ZHANG, M. (2007). School absenteeism and the implementation of truancy-related penalty notices. Pastoral Care,25-34.
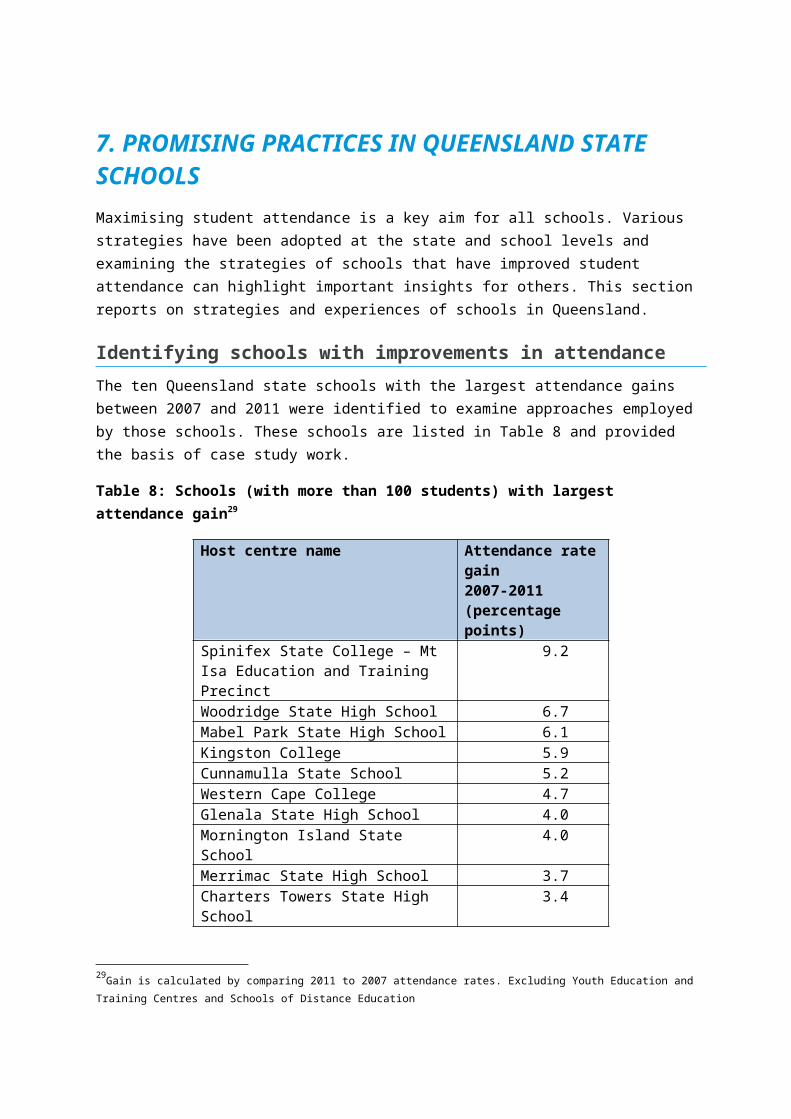
Appendix 1: Calculating student attendanceThe attendance rate presented is calculated by applying the nationally agreed definition for determining student attendance. This definition has been applied to the student attendance data recorded at each school. It is important that schools use these data when publishing school attendance rates to ensure that there is consistency in reporting student attendance.
The recording of all full and part day student attendance is a requirement of all schools to ensure that Education Queensland can meet its obligations to the Australian Government under the Schools Assistance Act (Learning Through Choice and Opportunity) 2004.
The student attendance rate presented is based on student attendance information recorded by a school to generate the number of days of actual attendance. If a school has not fully recorded absence information then meaningful attendance figures cannot be provided.
Calculation of student attendance rateAn individual student's attendance is based on the calculation of the number of full and part days attended during Semester 1 at each school compared to the number of days the student could have attended each school.
The total number of days a student could have attended the school (Total Number of Days Possible) is generated by comparing a students' enrolment date against the date range for Semester 1 and the school's calendar of school days. Only school days are counted. Local holidays, public holidays, weekends, etc are not included.
Each student's number of days attended (Total Number of Days Attended) is calculated by subtracting the number of full-day (1.0) and part-day (0.5) absences from the student’s Days Possible. To be included, an absence must be on a school day and be between the date range of Semester 1. Absence types included are Unexplained, Illness, Late Arrival, Early Departure, Holiday, Suspensions, Exclusions, Unauthorised and Other.
Each school's student attendance rate is generated by totalling the number of total number of days attended for all students and comparing this to the total of all students total number of days possible, expressed as a percentage.
Calculation of the school student attendance rateSchool student attendance rate is the student attendance rate for each school for all full-time students in all year levels. The school's student attendance rate is generated summing the total number of days attended for all students and comparing this to the sum of all student total number of days possible. The figure returned is expressed as a percentage.
Attendance rate calculations are reliant on the entry of accurate absence data. If no absence data are entered for a student, the resultant attendance rate is 100%. The increased focus on attendance in

recent years may have resulted in improved data entry at schools. This may be a factor in any trends in the Queensland student attendance rate for state schools.
Guidelines for 'reasonable excuses' In Queensland state schools, a student who is participating in one of the following activities must be recorded as not physically present at the school site but will not be considered absent from school, for the calculation of the student attendance rate:
School activity (absence reason code A) – A student will not be considered absent when they are participating in an authorised activity for school purposes. The activity may be off school grounds. Activities may include students performing in the school choir, band or dance group, students participating in a youth parliament or council or a student undertaking community service.
Excursion (absence reason code C) – A student will not be considered absent when they are participating in an excursion which occurs outside the school grounds and is conducted, organised and/or approved by the school. Excursions could include part-day, day or multi-day class visits to venues outside the school or school camps.
Off campus activity (absence reason code F) – A student will not be considered absent if they are participating in an authorised activity that is away from the school campus. These activities may include flexible arrangements, attendance at a TAFE or other training provider course, or participation in a school-based apprenticeship or traineeship. These activities will be regular and ongoing in nature.
Natural Disaster (Absence Reason Code N) – A student will not be considered absent if they are unable to attend school due to an extreme weather event or other natural disaster. This code may be used whether or not the student is continuing with school work while absent from school, and may be used for full or part-day absences.
Sport (absence reason code S) – A student will not be considered absent when they are representing their school, district, region, state or country at a sporting event approved by the school.
Work experience (absence reason code W) – A student will not be considered absent when they are participating in a work experience program approved and organised by the school. Work experience programs are available for students 14 years or older. Schools must ensure the appropriate work experience agreements have been completed before students undertake work experience.
The following circumstances will be considered absences for which a reasonable excuse has been given:
Illness (absence reason code I) – It is reasonable that a child may be absent from school when they are genuinely too ill to attend. On any single day of absence due to illness, or within two days of the student's return to school, a parent should provide the school with an explanation

for the absence, in line with the schools agreed processes for notifying of student absence. This may take the form of a written explanation note containing the student's name, date/s of absences and reason for absence, a verbal explanation through either a phone call or visit to the school, or a medical certificate.
Pursuant to s.201 of the Education General Provisions Act 2006, the compulsory schooling requirement does not apply to a child where the child is too ill to attend school for a period of not more than 10 consecutive school days. If a child who is prevented by illness from attending school for a period longer than 10 consecutive school days, the chief executive (or delegate) has the power to grant an exemption from compliance with the requirements of compulsory schooling or compulsory participation. Principals have the delegated power to grant an exemption from the requirement of attendance at a state school where the exemption will apply for less than one school year.
Infectious or contagious disease(absence reason code I) – It is a reasonable excuse for a child to be absent from school if the child is, or is a member of a class of persons, that is subject to a direction or order given about an infectious or contagious disease or condition.
Medical or dental treatments or procedures (absence reason code O) – It is reasonable for a student to be absent to attend a medical or dental appointment. This should be documented through the provision of a written or verbal explanation from a parent.
Sport (absence reason code S) – Principals should use their professional judgement to determine if it is reasonable for a student to be absent from school to participate in a sporting event where they are not representing their school, district, region, state or nation, taking into consideration the type of event and the organising sporting body.
Suspension – For a state school student a suspension is a reasonable excuse for absence and the following applies: if a student is suspended for five days or less (absence reason code P) the school's
principal must take reasonable steps to ensure the student is given school work to complete during the suspension
if a student is suspended for six to 20 (absence reason code Q) days, the school principal must arrange for the student's access to an educational program that allows the student to continue with their educational program during the suspension
if the student is suspended with a recommendation for exclusion (absence reason code R) the school principal must arrange for the student's access to an educational program that allows the student to continue with their educational program during the suspension.
Exemption (absence reason code O) – An exemption from compulsory schooling is a reasonable excuse for absence, where the exemption has been granted by the chief executive (or delegate) of the Department of Education, Training and Employment.
Apprentice or trainee under the Vocational Education, Training and Employment Act 2000 (VETE) (absence reason code O) – It is a reasonable excuse for a child to be absent from school

if an arrangement has been made for the child to become an apprentice or trainee under the VETE Act.
Law of the Commonwealth (absence reason code O) – It is a reasonable excuse for a child to be absent from school if a Law of the Commonwealth allows a child to carry on an activity other than attending school.
Funeral (absence reason code O) – Attendance at a funeral or to attend to Sorry Business or Sorry meetings may be considered as a reasonable excuse for absence. Parents should be encouraged to ensure their child misses as little school as possible.
There may also be circumstances where a child is kept out of school due to grief of a close family member. In such circumstances, the school should work with families to encourage them to have the child attend school to maintain a sense of normalcy. These situations should be handled with respect and sensitivity and should be underpinned by the interests of the child.
Legal (absence reason code O) – It is a reasonable excuse for a child to be absent from school where the child is required to attend court or fulfil other legal requirements.
Holiday (absence reason code H) – Parents should be encouraged to plan holidays for students during gazetted school holiday periods and pupil free days. Principals should use their professional judgement in determining whether a holiday is a reasonable excuse for a student absence, taking into consideration family circumstances, distance to be travelled, length and frequency of holidays. Pursuant to s.189 of the EGPA, if a child cannot attend school (or participate in any eligible option), or it would be unreasonable in all the circumstances to require the child to attend school (or participate in any eligible option), the chief executive (or delegate) has the power to grant an exemption from compliance with the requirements of compulsory schooling or compulsory participation. A principal has the delegated power to grant an exemption from the requirement of attendance at a state school where the exemption will apply for less than one school year.
The following circumstances will be considered absences for which there is NOT a reasonable excuse given:
Unexplained absence (absence reason code U) – When no explanation for a student absence has been offered to the school by the parent, or the student if they are living independently, unexplained absence should be recorded in OneSchool with the code U.
Leisure activities (absence reason code J) – Undertaking a leisure activity such as shopping, visiting friends and relatives, fishing or camping, is not considered a reasonable explanation for an absence from school. These absences should be recorded in OneSchool with the code J.
Any other reason for absence (absence reason code J) – The principal should use their professional judgement in determining whether other reasons not contained in this document given by the parent, or the student is they are living independently, are reasonable explanations

for a student's absence. If the reason given is not a reasonable excuse the principal should document the decision and record the absence with the code J.
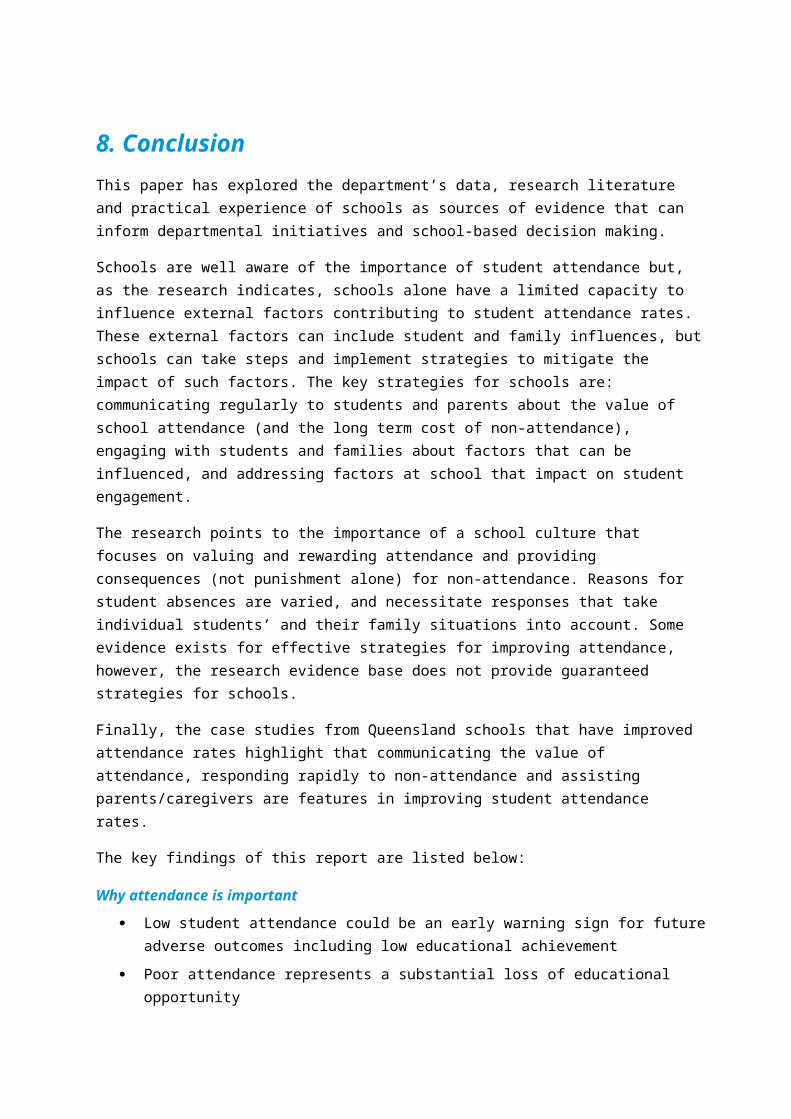
Appendix 2: Scan of selected attendance programsYouth Out of the Education Mainstream (YOEM) A qualitative evaluation of the Youth Out of the Education Mainstream (YOEM) initiative in the USA concluded that communities with the most success in deterring truancy not only had concentrated on improving procedures, but also had implemented a comprehensive strategy that emphasizes incentives for those attending and sanctions for truants and their parents (Baker et al, 2001). They identify five primary elements of a comprehensive community and educational strategy to combat truancy and increase attendance:
1. Involve parents in all truancy prevention activities2. Ensure that students face firm sanctions for truancy3. Create meaningful incentives for parental responsibility to ensure that children go to school4. Establish ongoing truancy prevention programs in school by addressing the needs of individual
children and developing initiatives to combat the root causes of truancy and 5. Involve local law enforcement in truancy reduction efforts.
UK Fast Track to Attendance FrameworkThe UK Fast Track to Attendance Framework achieved an average of 11% increase in attendance upon a child entering the “fast track” as an early intervention. This includes:
early identification and follow up of absence analysis of absence patterns identification of any underlying causes of absence or mitigating circumstances and taking
action to address these engaging the parent and child and specifying what improvements need to be made over a set
time-frame (usually 12 weeks) ensuring that, where appropriate, parents are prompted to focus on their responsibilities to
ensure their children’s regular attendance at school application of sanctions and compulsory measures where the parent fails to take their
responsibilities seriously and the required improvements are not made within the specified time-frame
appropriate reintegration arrangements when the pupil returns to school regular monitoring of absence by the school after cases have exited the Fast-Track process
and taking action as appropriate. 30
Truancy SweepsTruancy sweeps have been identified as strategies for reducing non-attendance (Bardsley et al., 1999). A UK study found a police-run truancy sweep that collected truants on streets and took them to a truancy centre, in which they were required to “sit still and be quiet (with head on desk) for up to six hours before they are released to parents or the school” had little positive effects on the truants’ subsequent school attendance or delinquency (Bazemore, Stinchcomb & Leip, 2004). The result of this study indicates that one-time interventions that involve punishments without student and family support are not effective in addressing non-attendance (NCSE, 2007).
Gerrard et al (2003) report that the effect of assigning probation officers to truancy cases is ‘unproven’, and the effect of police sweeps of frequent neighbourhood hangouts remains ‘empirically
30 http://www.teachernet.gov.uk/_doc/13736/fasttrack.pdf
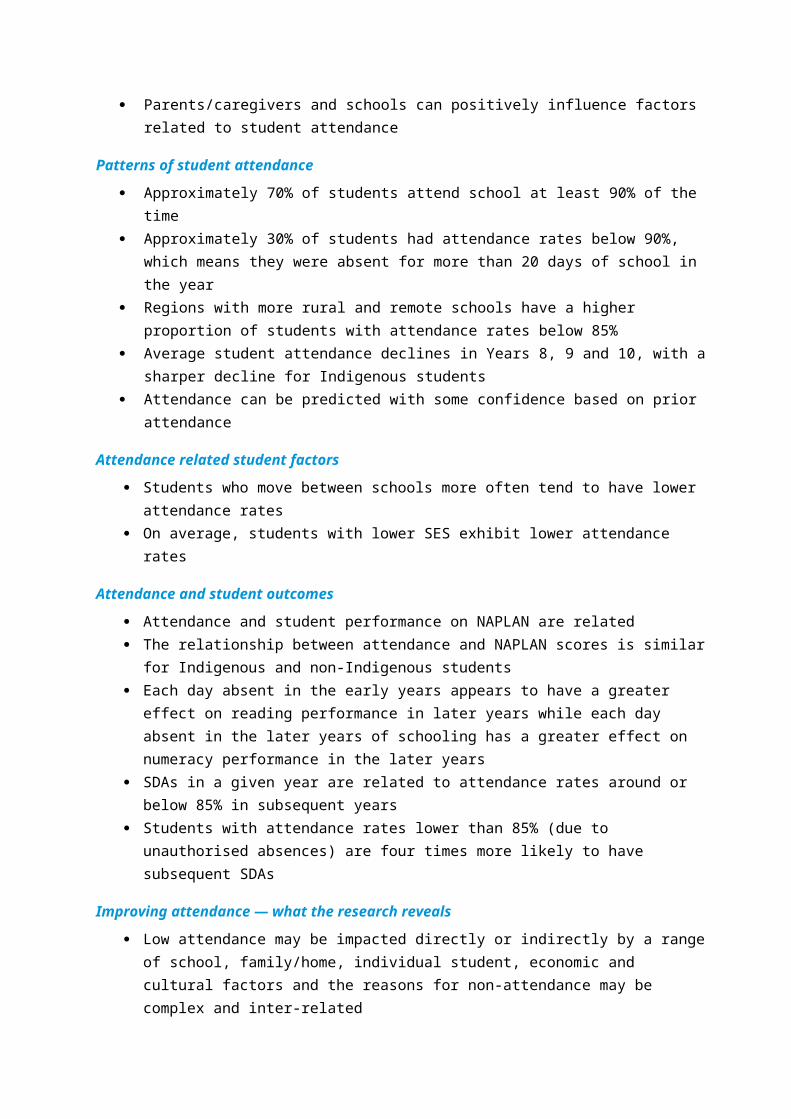
untested’. Although they formed no conclusions regarding the appropriation of firm sanctions for truancy, they also found that ‘financial sanctions toward families of truant students were not effective’ (p 3)for families on welfare.
Truancy courts Truancy courts had been established in Kentucky, USA (described as addressing truancy through “court appearances, cajoling and threats” and scant attention paid to the whole child and his or her family system) with little or no change in school attendance (Byer & Kuhn, 2003; p. 62).
Hendricks et al (2010) presented evidence on the effectiveness of the school-based truancy court intervention with aftercare in four middle schools in mid-sized school districts. Data from 185 students attending the truancy court from 2004 through 2008 indicated a differential impact of the truancy court intervention depending on truancy severity. The intervention was most successful in increasing attendance for students with severe truancy, but had limited impact on students with moderate truancy, and no impact on mild truancy. The intervention did not result in improved school attachment or grade point averages, nor did it significantly reduce discipline offences.
Aftercare intervention, consisting of regular meetings with an authority figure (for example, a Juvenile Officer), was only effective at maintaining truancy court attendance gains for students with severe truancy at baseline, although it was associated with a substantial decrease in discipline offences for all groups. These results suggest that truancy courts may have an impact on truancy for severely truant students, but may have a limited effect on students with mild or moderate truancy (Hendricks et al, 2010).
ProsecutionsMost jurisdictions with compulsory schooling obligations undertake prosecution of parents when their children do not attend school frequently without a valid reason. Some have found early prosecution of parents to be effective not only in relation to the individual, but also as a signal to other parents that such conduct will not be accepted (Blacktrop and Blyth, 1999) whereas Hoyle (1999), in a study that tracked student attendance post prosecution, found only three cases where student attendance improved post prosecution. Hoyle noted that “‘Unwaged, socially isolated, lone parents, who experience health-related difficulties again appear over-represented amongst the individuals who become subjects of legal action by the Local Authority” (1998:104).
Wright (2009), in following up 16 prosecutions, found 13 students had increased attendance including three who were taken into care. Wright also found children from lower socio-economic single parent families are ‘significantly over-represented’ (2009).
Critics of prosecutions claim: “Threats of court action and even prosecution itself will not improve the situation if students and/or parents feel alienated and disaffected from the school or if there are major problems within the family which are seen as more pressing. Courts are only appropriate in a tiny minority of cases —there will nearly always be an alternative which is more likely to succeed in motivating the pupil or parents to improve” (Whitney, 1998,p51).

Appendix 3: Case study questions for prinicpals and school communitiesCase Study Outcomes
1. A better understanding of factors influencing student attendance in Queensland state schools demonstrating significant improvements
2. Identification of school-based approaches resulting in improvements in student attendance3. Shared knowledge of the principles, protocols, elements and strategies for improving school
attendance.
Deliverables
1. Case studies from selected schools with the highest student attendance rates improvement between 2007–11
2. A description of the practices, principles, resources and strategies employed in those schools3. A resource providing an analysis of improved student attendance drawn from promising
increases in school attendance rates between 2007–11.
Methodology
Semi-structured interviews with principals of Queensland state schools, staff and community members demonstrating high attendance rate improvements.
Questions (prompts in italics)
Theme 1: School-based attendance and strategies
1. In your experience, what are the main factors behind student attendance and student non-attendance?
2. Why have you had such an increase in student attendance since 2007 in your school? a. What are you doing to influence attendance?b. Did you use rewards or incentives? What about compliance or sanctions?c. Did you case manage some students – if so, how were they identified and
supported? d. How successful was it?e. Did you work with Non-Government Organisations?f. Was there a school attendance improvement team or how was the process
managed? g. How have parents been involved? The wider community? Elders? Describe the
communication processes you used with key stakeholdersh. Did you focus on particular groups of students?i. Who is responsible for improving school attendance?j. What resources did you deploy? What funding was utilised? (for example, National
Partnerships, Every Child Counts)?k. What worked? What did not work? How could it have been done differently?
Theme 2: Use of data and whole school planning
3. What data did you use to monitor the improvement?
a. When did you start collecting attendance data?b. What processes did you use to analyse the data? What patterns did you see? c. Who analysed the data? Did it involve all staff?d. Has the publication of attendance rates (e.g. My School website or school Annual
Report) had any impact?e. Was the attendance improvement process embedded in School Planning Review and
Reporting Framework?
Theme 3: Links to broader student outcomes
4. Has increased attendance led to improvement in individual student outcomes? a. How do you know?b. Have there been any changes at the classroom level? Have there been changes at
the school level?
Theme 4: Professional development and systemic support
5. Was there any professional learning that was provided to support the improvement?a. What is the professional learning required by principals and teachers? Parents or
students?b. What systemic support was provided to the school and staff?c. How important is the support of all staff?
Theme 5: Overall comments
6. Reflecting on your success, what are your key learnings? What advice for other schools?a. Are there other processes in the school that have contributed to improved school
attendance? b. Are you actions sustainable? Why?c. Do state, regional and federal government reporting expectations support or
hinder? How?