department of engineering mangement center for …
TRANSCRIPT
Development of a Productivity Enhancement Framework for
Private Sector Automotive Manufacturing Industry of Pakistan
Author
Mr. Sheikh Zahoor Sarwar
UET Registration No 10-UET/PhD-CASE-EM-46
Supervisor
Dr Danial Saeed Pirzada
DEPARTMENT OF ENGINEERING MANGEMENT
CENTER FOR ADVANCED STUDIES IN ENGINEERING
UNIVERSITY OF ENGINEERING AND TECHNOLOGY
TAXILA

Development of a Productivity Enhancement Framework for
Private Sector Automotive Manufacturing Industry of Pakistan
A dissertation submitted in partial fulfillment of the degree of Doctor of Philosophy (PhD) in
Engineering Management
Author
Mr. Sheikh Zahoor Sarwar
UET Registration No 10-UET/PhD-CASE-EM-46 Approved by:
Dr. Danial Saeed
Pirzada
Thesis Supervisor
______________ _______________ __________________ Dr. Nadeem Ehsan Dr. Asim Nisar Dr. Amir Baqai
Member Research
Committee, EM
Department, CASE,
Islamabad
Member Research
Committee, EM
Department, CASE,
Islamabad
External Member
Associate Professor,
Mechanical Department,
NUST Rawalpindi
DEPARTMENT OF ENGINEERING MANGEMENT,
CENTER FOR ADVANCED STUDIES IN ENGINEERING,
UNIVERSITY OF ENGINEERING AND TECHNOLOGY, TAXILA.

I dedicate this research to my wife mrs. moneeza zahoor who
suffered a lot due to my busy schedule and commitments of the
study. This work is completed due to our combined sacrifices and
this success is ‘our’ success.
============
I am GREATLY indebted to my great parents, Mr. sheikh
Mohammad Sarwar and Mrs. shahzada parveen, for grooming
me into a better human being, a better Muslim and a better
Pakistani. You have been perfect and i exist because of you!

I
DECLARATION
It is declared that the matter of this thesis is the original work of the author and due
references and acknowledgements have been made, where necessary, to the work of
others. No part of this thesis has been already accepted for any degree, and it is not
being currently submitted in candidature of any degree.
_______________
Mr. Sheikh Zahoor Sarwar
UET Registration No. 10-UET/PhD-CASE-EM-46
Thesis Scholar
Countersigned:
______________
Dr. Danial Saeed Pirzada
Thesis Supervisor
II
ACKNOWLEDGEMENTS
I would like to acknowledge and thank my supervisor Dr. Danial Saeed Pirzada
for bearing with me for such a long time. It was owing to his guidance and deep
affection that I have been able to achieve this milestone of my life.
I would also like to thank all my teachers and mentors who polished me to
become a successful scholar. Special thanks to the faculty and staff of Center
for Advance Studies in Engineering and University of Engineering and
Technology, Taxila, who helped and guided me throughout this process. My
special thanks to Mr. Shahinshah Faisal Azeem and Mrs. Sadia Masroor for
helping and guiding me finalization of this thesis.
I would also like to thank the staff of Libraries of NUST, CASE, Punjab
University, UET Taxila and IST for always being there to provide me all the
help and support required for my literature review.
My special thanks to all the industry officials especially CEOs and Top
Management of the organizations, for giving me time to conduct interviews and
gather data for this research work.

III
ABSTRACT
Organizational productivity is one of the basic tools to gauge its competitiveness. Research has proven that
methodologies for gauging productivity are lacking in industries globally, and mostly non-standard tools
are used to measure and evaluate productivity. In Pakistan specifically, not enough efforts have been put in
place to gauge and enhance the productivity of manufacturing industry. This research is focused on
identifying the prevalent status of productivity in automotive industry of Pakistan and then suggesting a
productivity enhancement framework. This mixed methodology research has been conducted using both
qualitative and quantitative methods. Sequential explanatory design in combination with sequential
exploratory design was used as suggested by Creswell [106]. Quantitative research was conducted by
carrying out productivity analysis of the industry using secondary data from sample companies. Authentic
government sources, such as Engineering Development Board and two national level associations i.e.
Pakistan Automotive Manufacturers Association (PAMA) and Pakistan Association of Automotive Parts
and Accessories Manufacturers of Pakistan (PAAPAM) were consulted for data collection. Secondary data
for ten years covering FY 2000-2010 for two major automotive manufacturing firms was gathered.
Total Productivity and all partial productivities were computed using methodology proposed by Sumanth
[4], while Total Factor Productivity (TFP) was computed using Cobb-Douglas production function. Results
gathered showed low productivity status of the industry as compared to that of international industry. In
order to develop a productivity enhancement framework, qualitative research was conducted by collecting
primary data through qualitative interviews from top management of 26 automotive manufacturing
companies. A total of 40 interviews were conducted on the basis of theoretical saturation and theoretical
sampling. Open ended questions used for survey were compiled from the internationally published literature
for validity and reliability requirements. Using explanatory and descriptive study, role of technology in
productivity enhancement of the industry was examined.
Findings of this research have been used to develop a productivity enhancement framework for the industry.
Developed framework was compared with the framework of 6 different countries, including USA, UK,
Sweden, India, China and Thailand [33], [36], [37], [44], [45]. Comparison resulted in emergence of the
finalized productivity enhancement framework of the industry. This framework was then implemented in
one of the major auto parts manufacturing companies of Pakistan for its validation. Results of the
implementation not only validated the model but also depicted that there is an immediate need to implement
these concepts for productivity enhancement. The cost- effective solutions suggested in this model and its
cross cultural comparisons also show that this model can be used for manufacturing industries in general in
the developing countries.
Keywords— Productivity measurement, enhancement model, automotive industry, manufacturing.

IV
TABLE OF CONTENTS DECLARATION............................................................................................................................ I
ACKNOWLEDGEMENTS ......................................................................................................... II
ABSTRACT ................................................................................................................................. III
LIST OF TABLES ................................................................................................................... VIII
LIST OF ILLUSTRATIONS ..................................................................................................... IX
LIST OF ABBREVIATIONS ................................................................................................. XIII
CHAPTER 1 .................................................................................................................................. 1
INTRODUCTION & PROBLEM STATEMENT ..................................................................... 1
1.1 Background ...................................................................................................................... 1
1.1.1 Role of Productivity in Global Competitiveness ...................................................... 1
1.1.2 New Dimensions and Challenges to Productivity .................................................... 2
1.1.3 Automotive Industry and Productivity ..................................................................... 4
1.1.4 Pakistan Automotive Industry .................................................................................. 7
1.2 Philosophical Background................................................................................................ 9
1.3 Research Problem ........................................................................................................... 10
1.4 Motivation of Research .................................................................................................. 11
1.5 Scope of Research .......................................................................................................... 11
1.6 Objectives of Research ................................................................................................... 11
1.6.1 Main Objective of the Research ............................................................................. 11
1.6.2 Sub Objectives of the Research .............................................................................. 12
1.7 Intended Stakeholders and Significance of the Study .................................................... 13
CHAPTER 2 ................................................................................................................................ 15
LITERATURE REVIEW .......................................................................................................... 15
2.1 Significance of Productivity ........................................................................................... 15
2.2 Productivity Definitions and Measurement.................................................................... 15
2.3 Productivity Improvement Models and Issues ............................................................... 17
2.4 Productivity Enhancement in Automotive Industry ....................................................... 22
2.5 Role of Government and Productivity Issues in Developing Countries ........................ 22
2.6 Reasons for Selecting Pakistan and Gap in Literature Review ...................................... 23
2.7 Contextualization of Research ....................................................................................... 25
2.8 Factors Affecting Productivity ....................................................................................... 26
2.8.1 Role of Technology ................................................................................................ 26
2.8.2 Impact of Job Satisfaction ...................................................................................... 32
V
CHAPTER 3 ................................................................................................................................ 35
RESEARCH METHODOLOGY .............................................................................................. 35
3.1 Preface ............................................................................................................................ 35
3.2 Research Process ............................................................................................................ 37
3.2.1 Stage I Productivity Measurement using Quantitative Methodology ............... 37
3.2.2 Stage II Developing Productivity Enhancement Model using Qualitative Research
................................................................................................................................ 42
3.2.3 Stage III Implementation of the Proposed Framework ........................................ 44
3.2.4 Stage IV- Validation of model by Quantitative Analysis ....................................... 44
CHAPTER 4 ................................................................................................................................ 47
RESULTS OF QUANTITATIVE ANALYSIS: MEASURING PRODUCTIVITY ............. 47
4.1 Profit and Loss Statements Analysis .............................................................................. 47
4.2 Production Capacity Vs Productions Output Analysis .................................................. 48
4.3 Results of Productivity Analysis of the two firms under study...................................... 49
4.4 Measuring Productivity with Cobb-Douglas Production Function ................................ 54
CHAPTER 5 ................................................................................................................................ 58
RESULTS OF QUALITATIVE ANALYSIS ........................................................................... 58
5.1 Demographic Details ...................................................................................................... 58
5.2 State of Productivity Knowledge ................................................................................... 61
5.3 Coding of the Survey Responses .................................................................................... 67
5.4 Prevailing Best Practices in the Industry........................................................................ 72
CHAPTER 6 ................................................................................................................................ 82
DEVELOPMENT OF PRODUCTIVITY ENHANCEMENT FRAMEWORK................... 82
6.1 Exploring the Data ......................................................................................................... 82
6.2 Model of Prevailing Productivity Enhancement Practices in Pakistan Automotive
Industry .......................................................................................................................... 92
6.3 Model of Best Suitable Practices for Pakistan Automotive Industry ............................. 94
6.4 Model of Problems Faced in Implementation of Latest Techniques ............................. 96
6.5 Model of Future Planning for Productivity Enhancement by the Respondents ............. 98
6.6 Comparison with the World Best Practices and Models .............................................. 100
6.6.1 UK Productivity Enhancement Techniques ......................................................... 100
6.6.2 Swedish Productivity Enhancement Factors ........................................................ 101
6.6.3 USA Best Practices Implementation Model ......................................................... 102
6.6.4 Chinese Productivity Model ................................................................................. 103
6.6.5 Indian Manufacturing Improvement Strategies .................................................... 103
VI
6.6.6 Thai Improvement Model ..................................................................................... 105
6.6.7 Thai Technology Implementation Model ............................................................. 105
6.6.8 Strategic Productivity Improvement Framework ................................................. 107
6.7 Proposed Productivity Enhancement Framework for Pakistan Automotive Industry . 108
6.7.1 Human Resource Development (HRD) ................................................................ 112
6.7.2 Modified lean manufacturing (JIT) and optimization techniques ........................ 112
6.7.3 Total Quality Management (TQM) ...................................................................... 116
6.7.4 Agile Manufacturing ............................................................................................ 116
6.7.5 Enterprise Resource Planning (ERP) and Supply Chain Management system
(SCM) ................................................................................................................... 118
6.7.6 Total Productive Maintenance (TPM) .................................................................. 119
6.7.7 Total Productivity Management (TPmgt) ............................................................ 119
6.7.8 Computer Aided Design (CAD) and Computer Aided Manufacturing (CAD) ... 119
6.7.9 Partial Automation and Induction of Latest Equipment ....................................... 120
6.7.10 Energy Audits ....................................................................................................... 121
6.7.11 TRIZ ..................................................................................................................... 121
6.7.12 Autonomous Development ................................................................................... 122
CHAPTER 7 .............................................................................................................................. 124
IMPLEMENTATION METHODOLOGY ............................................................................ 124
7.1 Stage wise Implementation .......................................................................................... 124
7.2 Human Resource Development .................................................................................... 125
7.2.1 Methodology of Engineer’s induction and placement in an organization ............ 126
7.2.2 Training ................................................................................................................ 129
7.3 Modified JIT and Optimization Techniques ................................................................ 130
7.4 TQM Implementation ................................................................................................... 140
7.5 Agile Manufacturing .................................................................................................... 142
7.6 ERP and SCM Implementations .................................................................................. 145
7.7 TPM and TPgmt Implementation ................................................................................. 145
7.8 TRIZ and Autonomous Development Implementation ................................................ 146
7.9 Energy Audits ............................................................................................................... 150
CHAPTER 8 .............................................................................................................................. 152
VALIDATION OF PRODUCTIVITY ENHANCEMENT MODEL AND DISCUSSION OF
THE OUTCOMES .................................................................................................................... 152
8.1 Production Graphs ........................................................................................................ 153
8.2 Human Resource Savings............................................................................................. 159

VII
8.3 KAIZEN’s Achieved .................................................................................................... 161
8.4 Development Projects .................................................................................................. 169
8.5 Energy Audit Results ................................................................................................... 173
8.6 Results in Financial Terms ........................................................................................... 178
8.7 Conclusions & Recommendations ............................................................................... 180
REFERENCES .......................................................................................................................... 188
ANNEXURE A .......................................................................................................................... 201
ANNEXURE B .......................................................................................................................... 204
ANNEXURE C .......................................................................................................................... 205
CURRICULUM VITAE ........................................................................................................... 207
PUBLICATIONS ...................................................................................................................... 208
UNDERTAKING ...................................................................................................................... 211
SUPERVISOR’S COMMENTS .............................................................................................. 212
VIII
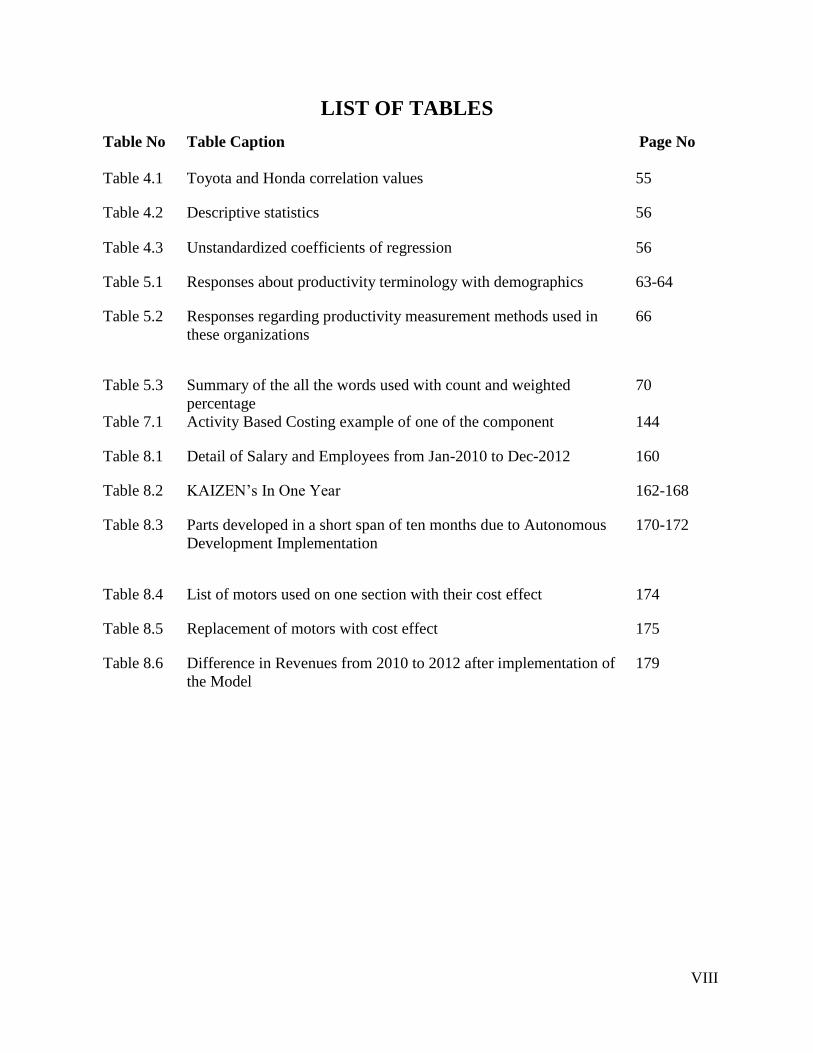
LIST OF TABLES
Table No Table Caption Page No
Table 4.1 Toyota and Honda correlation values 55
Table 4.2 Descriptive statistics 56
Table 4.3 Unstandardized coefficients of regression 56
Table 5.1 Responses about productivity terminology with demographics 63-64
Table 5.2 Responses regarding productivity measurement methods used in
these organizations
66
Table 5.3 Summary of the all the words used with count and weighted
percentage
70
Table 7.1 Activity Based Costing example of one of the component 144
Table 8.1 Detail of Salary and Employees from Jan-2010 to Dec-2012 160
Table 8.2 KAIZEN’s In One Year 162-168
Table 8.3 Parts developed in a short span of ten months due to Autonomous
Development Implementation
170-172
Table 8.4 List of motors used on one section with their cost effect 174
Table 8.5 Replacement of motors with cost effect 175
Table 8.6 Difference in Revenues from 2010 to 2012 after implementation of
the Model
179

IX
LIST OF ILLUSTRATIONS
Figure No Figure Caption Page No
Figure 1.1 Production pattern of automotive industry in the world, region wise 5
Figure 1.2 Global automotive production region wise from 1999 to 2012 6
Figure 1.3 Production pattern of automotive industry in the world, region wise 6
Figure 1.4 Trend line of Auto industry showing huge growth in production 8
Figure 1.5 Showing trend line of total production of the industry for both
commercial CV and private vehicles PV
8
Figure 1.6 Report of Federal Bureau of Statistics (FBS) Pakistan 2011 9
Figure 2.1 PPP Model as suggested by Tangen (2005) 21
Figure 2.2 Contextualization of research 25
Figure 4.1 Profit and Loss status of Indus Motors and Honda Atlas (Financial
Statement)
48
Figure 4.2 Line graph showing production trend line of Indus and Honda
Motors
49
Figure 4.3 Honda and Toyota Capacity verses Output 50
Figure 4.4 Comparison of partial productivities of Honda and Toyota 52
Figure 4.5 Total Productivities of Honda Atlas and Indus Motors 53
Figure 4.6 Total Productivities Indices of Honda Atlas and Indus Motors 53
Figure 5.1 Graph regarding number of respondents’ designation wise 59
Figure 5.2 Graph between designation and qualification 59
Figure 5.3 Graph of Age of the respondents 60
Figure 5.4 Graph between Designation and Age 61
Figure 5.5 Responses about terminology “Productivity”, yes for correct and no
for wrong meanings
62
Figure 5.6 Responses %age to correct and wrong measurement methods 67

X
Figure 5.7 Word tree for text run query search of word “Wastage” 69
Figure 5.8 Word tree for text query search of word “Kaizen” 69
Figure 5.9 Tag Cloud results the words and terminologies which have been
more emphasized by the respondents are shown in bigger size font
71
Figure 5.10 Graph showing 65% agree that tacit knowledge is very important
and 35% disagree
80
Figure 5.11 Graph showing 92.5% disagree that unions are good for productivity
and 7.5 % agree with this statement
80
Figure 6.1 Screen shot displaying formation of tree nodes 83
Figure 6.2 Coding strips showing the coding details and the density of the
coding
85
Figure 6.3 Node map showing the categories and sub categories with color
schemes
86
Figure 6.4 Results of Matrix coding query showing the numbers of responses
on optimization from people of different designation
88
Figure 6.5 Results of group coding query as connection map for respondents
vs used productivity enhancement practices
90
Figure 6.6 Zoom in view for Figure 6.5 showing the prominent concept 90
Figure 6.7 Connection Map for problems faced in implementation of latest
tools and techniques
91
Figure 6.8 Zoom in view of Figure 6.7 showing three major emerging themes 91
Figure 6.9 Zoom in view of Figure 6.7 showing Human resource resistance as
an emergent theme
92
Figure 6.10a Results of the model run test in NVIVO 93
Figure 6.10b Finally Developed Model of Prevailing Productivity Enhancement
Practices in Pakistan Automotive Industry
93
Figure 6.11 Suggested productivity enhancement model for Pakistan
automotive industry by the experts of the field
95
Figure 6.12 Model of problems faced in implementation of productivity
enhancement techniques
97
Figure 6.13 Model of future plans for productivity enhancement 99
Figure 6.14 Productivity enhancement model for UK manufacturing industry 100
Figure 6.15 Productivity Enhancement Factors by Thomas Grünberg (1996) 101

XI
Figure 6.16 USA best practices model 102
Figure 6.17 Chinese productivity enhancement techniques model 103
Figure 6.18 Indian automotive industry best practices model 104
Figure 6.19 Top 10 best practices of Thai automotive industry 105
Figure 6.20 Thailand top 15 automotive improvement techniques model 106
Figure 6.21 Problems faced in implementation of latest techniques in Thailand
automotive industry
106
Figure 6.22 Productivity improvement strategies framework of McTavish et al
(1996)
107
Figure 6.23 Productivity Enhancement Framework for Pakistan Automotive
Industry
111
Figure 7.1 Old Layout of Manufacturing sections 134-135
Figure 7.2 New layout of Manufacturing CNC section with latest techniques
used
138
Figure 7.3 Zoom in of flywheel production line and brake disc line 139
Figure 7.4 Zoom in for Brake drums manufacturing cell showing the process
flow with the help of arrows.
139
Figure 8.1 Production graphs of brake disc from Jan 2010 to Mar 2012
showing 396% production increase on same machines and lesser
manpower
154
Figure 8.2 Production graph of Brake Drum from Jan 2010 to Mar 2012
showing a production increase of 374% on same machines with
lesser manpower
154
Figure 8.3 Production graph of Brake Drum from Jan 2010 to Mar 2012
showing a production increase of 374% on same machines with
lesser manpower
156
Figure 8.4 Production graph of Brake Drum from Jan 2010 to Mar 2012
showing a production increase of 199% on same machines with
lesser manpower
156
Figure 8.5 Production graph of Valve Chamber from Jan 2010 to Mar 2012
showing a production increase of 652% with very less financial
investment
158
Figure 8.6 Graphs of three years lines showing number of employees per
month
160

XII
Figure 8.7 Comparison of energy consumption before and after the project
with indication of actual power required in green color
176
Figure 8.8 Financial effect of energy consumption before the project, after
project and price saving
177
Figure 8.9 Power consumption difference before and after project and power
saving
177
XIII
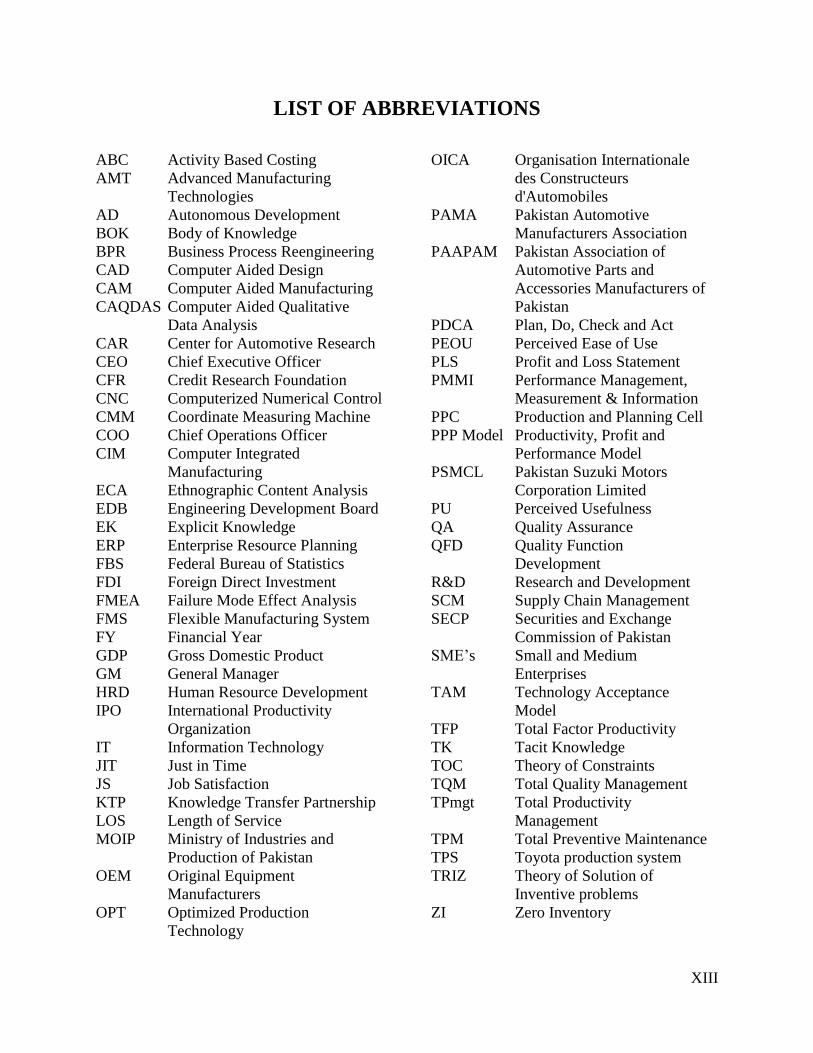
LIST OF ABBREVIATIONS
ABC Activity Based Costing
AMT Advanced Manufacturing
Technologies
AD Autonomous Development
BOK Body of Knowledge
BPR Business Process Reengineering
CAD Computer Aided Design
CAM Computer Aided Manufacturing
CAQDAS Computer Aided Qualitative
Data Analysis
CAR Center for Automotive Research
CEO Chief Executive Officer
CFR Credit Research Foundation
CNC Computerized Numerical Control
CMM Coordinate Measuring Machine
COO Chief Operations Officer
CIM Computer Integrated
Manufacturing
ECA Ethnographic Content Analysis
EDB Engineering Development Board
EK Explicit Knowledge
ERP Enterprise Resource Planning
FBS Federal Bureau of Statistics
FDI Foreign Direct Investment
FMEA Failure Mode Effect Analysis
FMS Flexible Manufacturing System
FY Financial Year
GDP Gross Domestic Product
GM General Manager
HRD Human Resource Development
IPO International Productivity
Organization
IT Information Technology
JIT Just in Time
JS Job Satisfaction
KTP Knowledge Transfer Partnership
LOS Length of Service
MOIP Ministry of Industries and
Production of Pakistan
OEM Original Equipment
Manufacturers
OPT Optimized Production
Technology
OICA Organisation Internationale
des Constructeurs
d'Automobiles
PAMA Pakistan Automotive
Manufacturers Association
PAAPAM Pakistan Association of
Automotive Parts and
Accessories Manufacturers of
Pakistan
PDCA Plan, Do, Check and Act
PEOU Perceived Ease of Use
PLS Profit and Loss Statement
PMMI Performance Management,
Measurement & Information
PPC Production and Planning Cell
PPP Model Productivity, Profit and
Performance Model
PSMCL Pakistan Suzuki Motors
Corporation Limited
PU Perceived Usefulness
QA Quality Assurance
QFD Quality Function
Development
R&D Research and Development
SCM Supply Chain Management
SECP Securities and Exchange
Commission of Pakistan
SME’s Small and Medium
Enterprises
TAM Technology Acceptance
Model
TFP Total Factor Productivity
TK Tacit Knowledge
TOC Theory of Constraints
TQM Total Quality Management
TPmgt Total Productivity
Management
TPM Total Preventive Maintenance
TPS Toyota production system
TRIZ Theory of Solution of
Inventive problems
ZI Zero Inventory
Chapter 1- Introduction
1
CHAPTER 1
INTRODUCTION & PROBLEM STATEMENT
1.1 Background
1.1.1 Role of Productivity in Global Competitiveness
In the early nineteenth century, the governing factors of influence were feudalism,
imperialism and regional power struggle [1]. In the mid-nineteenth century, agricultural production
became the center of attention and the world entered the “agricultural era”. In this era, intelligentsia
and practitioners concentrated on developing of methodologies for agricultural growth. The later
part of nineteenth century and early twentieth century is known as the “industrial era” wherein
ability to enhance manufacturing productivity became the biggest line of demarcation and
distinction between the nations, owing to which the world got segregated into industrialized and
non-industrialized states. All efforts of development in this era focused on this very aspect of
manufacturing productivity. In the mid twentieth century, the world entered into a new era called
the “technology era”. All the advancements in the former eras have helped in developing
technologies, which have ultimately changed human lives. In the technology era, the world has
been differentiated between those who have the technological capability, are able to further
enhance technical knowledge and know-how and can simultaneously employ the same for the
advantage of mankind vis a vis those who don’t have these capabilities and knowledge [1].
Technological advancements have brought revolutionary changes in the past few decades.
New techniques and technologies have emerged in every field of life. New inventions have
enhanced the need to revise and upgrade frequently used methodologies and definitions of terms
used in various fields. Globalization has changed concepts related to competition. With the
expansion of businesses and interdependence of economy, geographical boundaries are no longer
a limit. The whole world has become a common market. Anyone regardless of origin can come
Chapter 1- Introduction
2
into the field of competition. Productivity* is generally used as a measure of competitiveness [2],
[3]. In order to remain competitive in the global market, companies and firm s are striving for
higher standards of productivity.
With changing scenarios, methodologies used for measuring productivity and even
defining productivity require more thorough research and studies [4]. In the past few decades a lot
of research studies have been conducted on productivity all over the world [4]–[18]. Unfortunately,
in Pakistan not enough efforts have been placed to describe and gauge industrial productivity,
especially that of manufacturing industry [19]. In most of the research conducted on the issue, a
few major factors affecting productivity of an industrial organization have been highlighted,
including technology (being the most deliberated upon factor), equipment, management,
personnel, job satisfaction, rules and procedures [5], [6], [17].
1.1.2 New Dimensions and Challenges to Productivity
The 21st century has taken us into an entirely new technological era. With the emergence
of new technologies, people remain connected to their office work even when they are away from
their work place†. These new dimensions of work gave rise to numerous controversies e.g.
calculation of inputs (especially in time) and outputs (service/knowledge work). Furthermore, in
these changing scenarios, several difficulties are being faced in defining and measuring
productivity, which pose a major challenge for researchers. In order to measure productivity, the
use of partial productivities is generally resorted to, but they cannot depict the complete picture‡.
Therefore, measuring “Total Productivity” was proposed by Sumanth [4]. Several industrial
* Productivity is the term first used by Quensey in 1766 about 200 years ago as reported by Sumanth (1997). Since
then different definitions of the term have been suggested. The Organization of European Economic Cooperation
OEEC (1950) defined productivity as “Quotient obtained by dividing output by one of the factors of production”. † Work connectivity behavior of employees while being away from the workplace has been studied worldwide posing
new challenges for the researchers as well as for the industry. ‡ Sumanth (1994) elaborated upon the limitations of partial productivities. In the field of Economics several other
methods for measuring productivity like Cobb Douglas Production functions are used to overcome these limitations.

Chapter 1- Introduction
3
surveys in different countries have reported that basic standard methodologies are not in use to
measure and evaluate productivity; rather, nonstandard tools are being used for the purpose [4],
[10], [20]. The major reason is that knowledge and concept of productivity is misunderstood. The
drawback of nonstandard tools is that the time factor is not considered in these methodologies. The
time factor is very important in defining when a profit earning activity will achieve its desired
output or a specific government policy will render its effectiveness in terms of benefit for citizens
and nations.
Productivity analyses-based research on industries and organizations have picked up pace
all over the world in recent times. Main objectives of these research works have been to indicate
the flaws and suggest remedial measures. In a detailed analysis of manufacturing industries in
India [21], the researcher indicated the efficiency-gap between foreign and domestic firms in
eleven manufacturing industries. Hossler et al. [11] indicated the effectiveness of model techniques
for significant productivity enhancement. Researchers studied the necessity of model-to-model
transformations and successfully implemented the same, showing momentous productivity
enhancement. Credit Research Foundation (CFR) formulated a Collection Productivity formula;
which carries out productivity analyses to guide industries how to enhance their productivity. All
these latest research shows the interest of both academia and industry to find the solution to the
issues of productivity enhancement [4], [22]–[29]. However, further research is required in
different fields to identify the productivity problem areas and suggest enhancement methodologies
for industry. Several productivity enhancement models have been proposed in the past, but they
all focused on performance enhancement rather than productivity§. In Pakistan, especially in the
automotive manufacturing industry, comprehensive research has not been found despite extensive
§ This gap in the Body of Knowledge has been explained and discussed in detail in para 2.3 of Chapter 2.
Chapter 1- Introduction
4
literature review. So there is a dire need to carry out a comprehensive productivity measurement
of this industry; and on the basis of the findings suggest productivity enhancement framework.
1.1.3 Automotive Industry and Productivity
Economic growth of a nation depends upon its major industries. In the recent past, the
automotive industry has been recognized as a major contributor of growth, technology,
employment and GDP in many countries [30]. In today’s globally competitive world, the
automotive industry has to face enormous challenges such as e hyper-competition, adoption of
latest and advanced production technologies, meeting strict safety requirements, and enhanced
environment protection laws [31], [32]. Due to the importance of the role played by automotive
industry in the economic growth and development of a country, a lot of research has been
conducted in different countries on this industry [33]–[38]
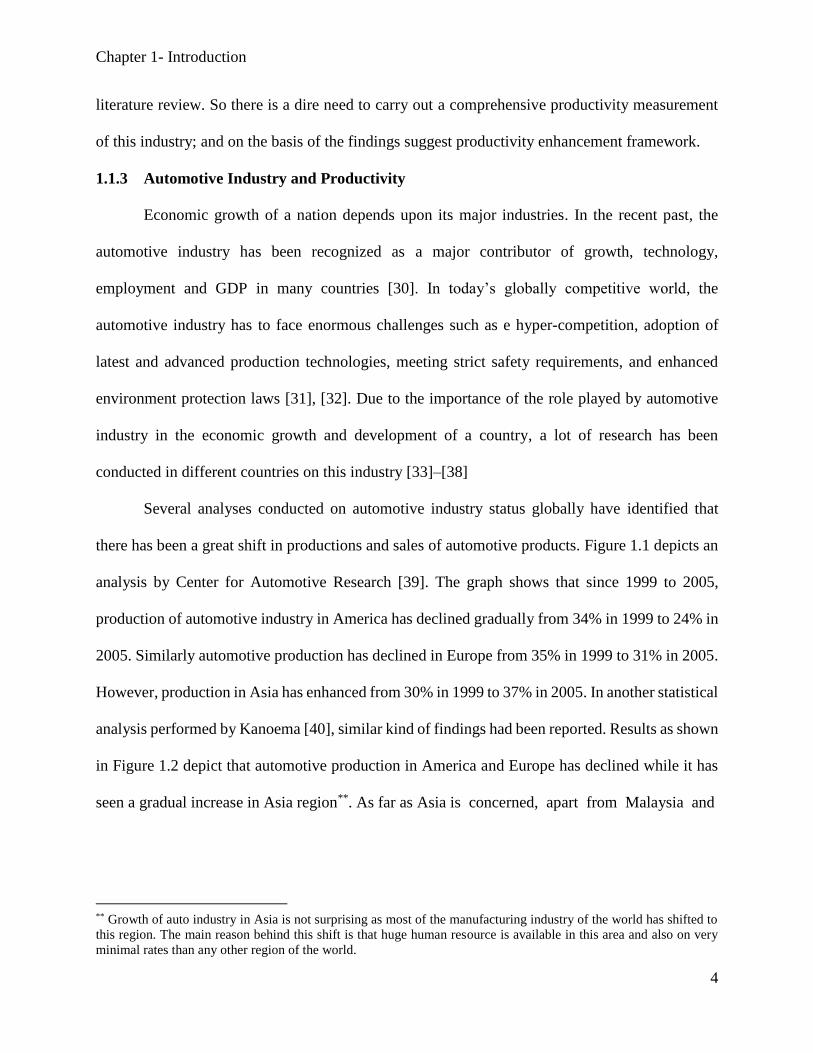
Several analyses conducted on automotive industry status globally have identified that
there has been a great shift in productions and sales of automotive products. Figure 1.1 depicts an
analysis by Center for Automotive Research [39]. The graph shows that since 1999 to 2005,
production of automotive industry in America has declined gradually from 34% in 1999 to 24% in
2005. Similarly automotive production has declined in Europe from 35% in 1999 to 31% in 2005.
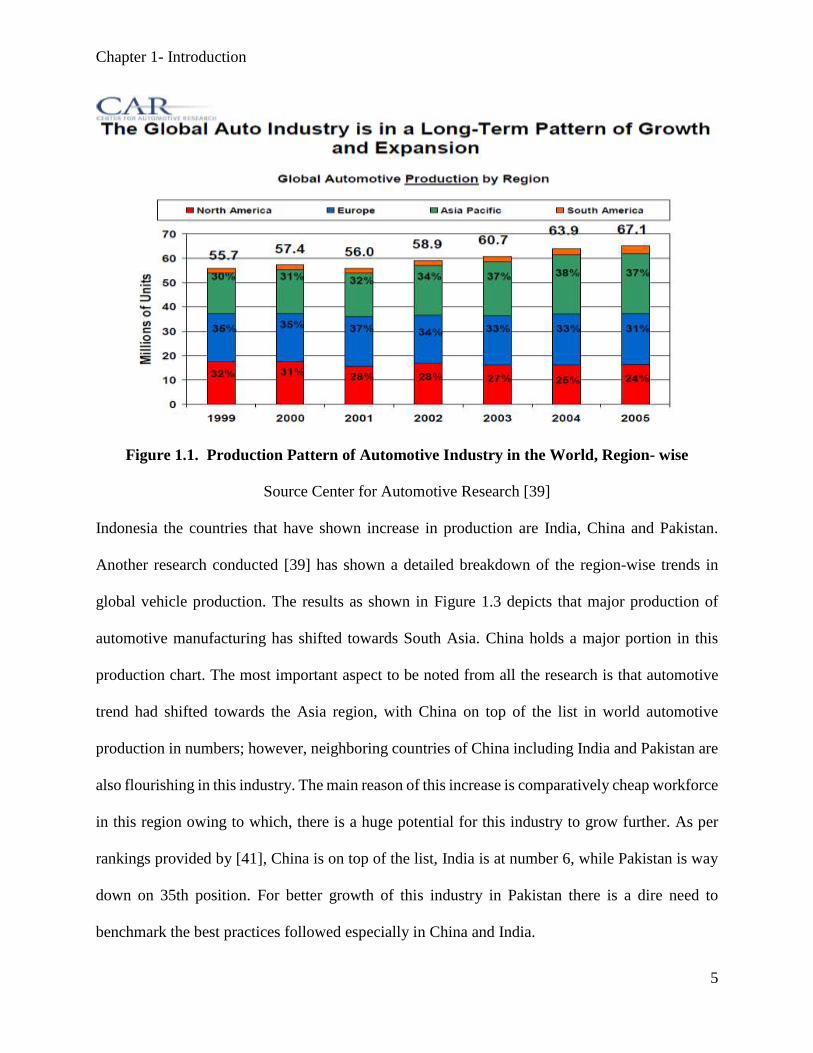
However, production in Asia has enhanced from 30% in 1999 to 37% in 2005. In another statistical
analysis performed by Kanoema [40], similar kind of findings had been reported. Results as shown
in Figure 1.2 depict that automotive production in America and Europe has declined while it has
seen a gradual increase in Asia region**. As far as Asia is concerned, apart from Malaysia and
** Growth of auto industry in Asia is not surprising as most of the manufacturing industry of the world has shifted to
this region. The main reason behind this shift is that huge human resource is available in this area and also on very
minimal rates than any other region of the world.
Chapter 1- Introduction
5
Figure 1.1. Production Pattern of Automotive Industry in the World, Region- wise
Source Center for Automotive Research [39]
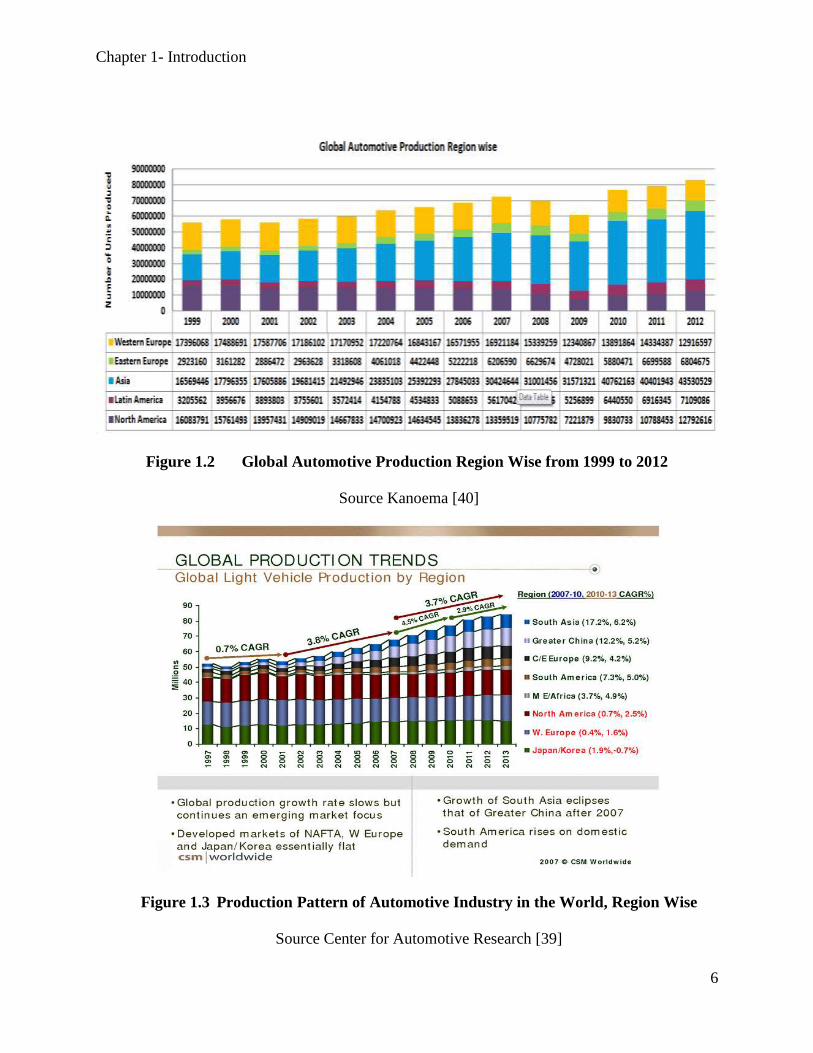
Indonesia the countries that have shown increase in production are India, China and Pakistan.
Another research conducted [39] has shown a detailed breakdown of the region-wise trends in
global vehicle production. The results as shown in Figure 1.3 depicts that major production of
automotive manufacturing has shifted towards South Asia. China holds a major portion in this
production chart. The most important aspect to be noted from all the research is that automotive
trend had shifted towards the Asia region, with China on top of the list in world automotive
production in numbers; however, neighboring countries of China including India and Pakistan are
also flourishing in this industry. The main reason of this increase is comparatively cheap workforce
in this region owing to which, there is a huge potential for this industry to grow further. As per
rankings provided by [41], China is on top of the list, India is at number 6, while Pakistan is way
down on 35th position. For better growth of this industry in Pakistan there is a dire need to
benchmark the best practices followed especially in China and India.
Chapter 1- Introduction
6
Figure 1.2 Global Automotive Production Region Wise from 1999 to 2012
Source Kanoema [40]
Figure 1.3 Production Pattern of Automotive Industry in the World, Region Wise
Source Center for Automotive Research [39]
Chapter 1- Introduction
7
1.1.4 Pakistan Automotive Industry
Pakistan is one of the developing countries having remarkable potential of manufacturing
enhancement. Pakistan entered the race of productivity enhancement a bit late. The automotive
industry of Pakistan has shown some improvements mainly owing to enhanced capital inputs,
though its contribution in GDP and employment is still modest in size††. From this perspective, a
remarkable difference can be observed if compared with other Asian countries like Japan, Korea,
Malaysia, India, China and Thailand. In all these countries the automotive industry has exploited
the catalytic role in promoting broad based manufacturing sector growth [42]. However, not much
research has been carried out on the operational procedures and productivity enhancement
possibilities of this industry [19].
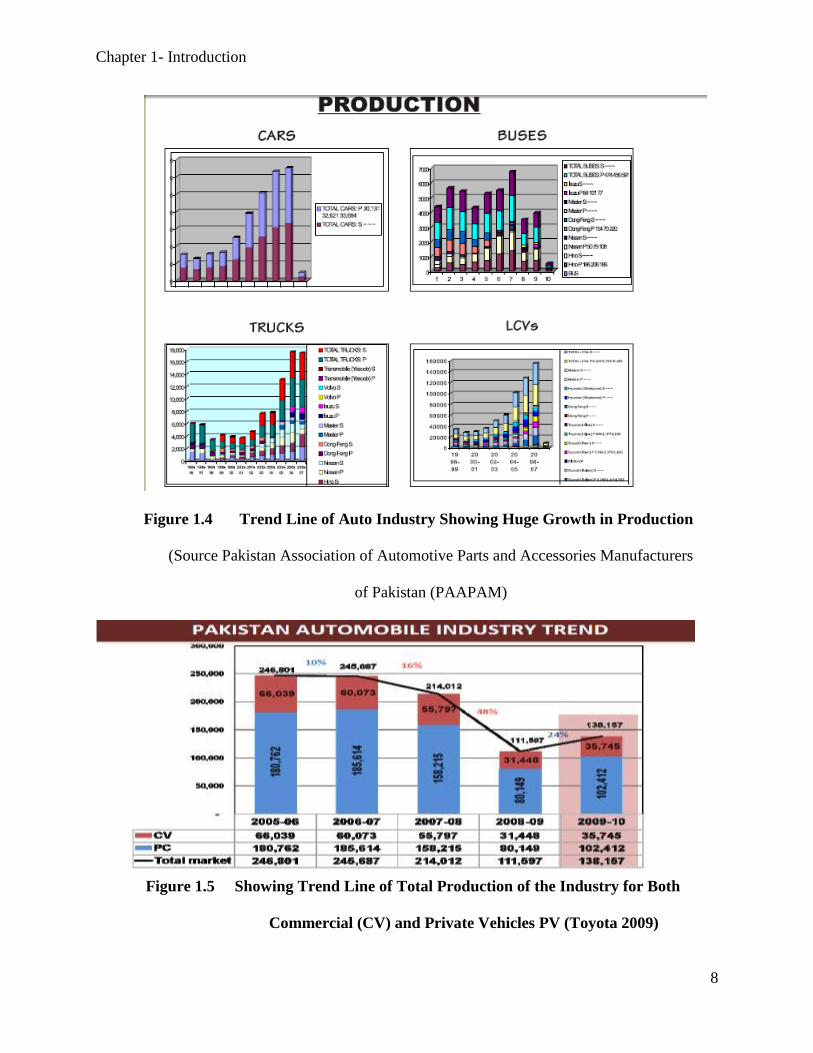
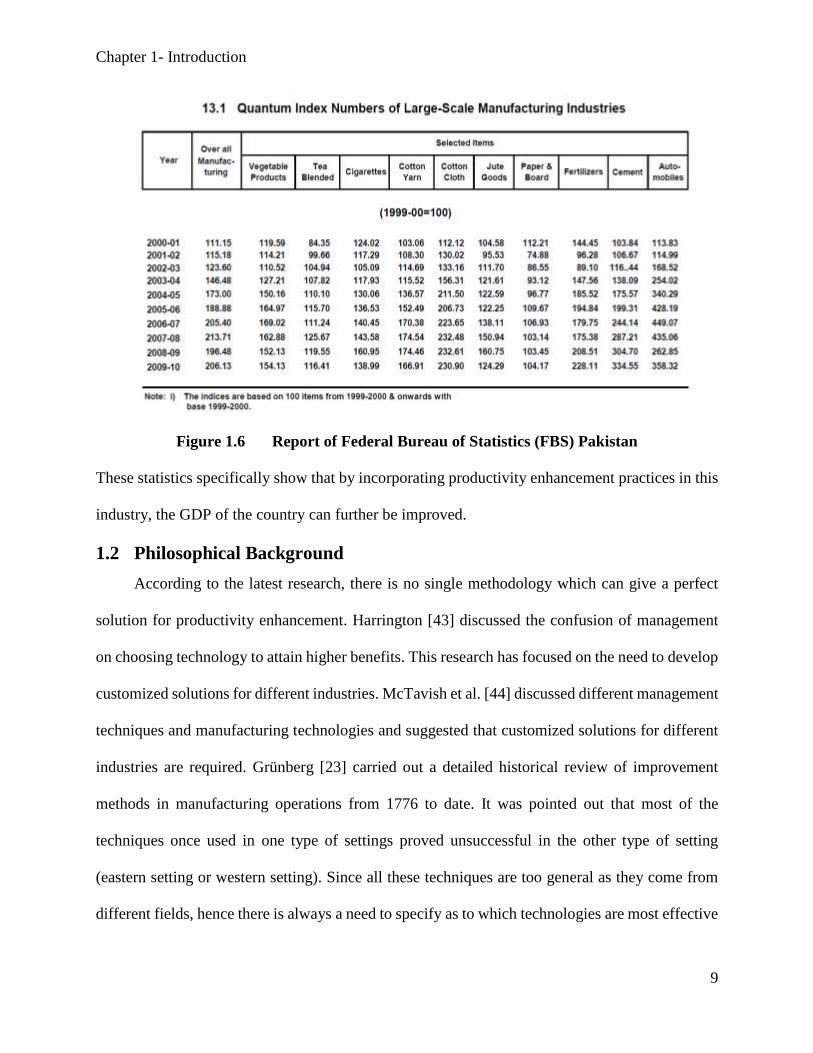
The production status of complete automotive industry of Pakistan has been analyzed by
different organizations. These analyses have shown that there has been a great increase in the
production of this industry. The significant growth in the last decade as shown in Figure 1.4 depicts
that there is a great potential in this industry as far as Pakistan is concerned. Another survey
conducted by Indus Motors shows the production trend line of the Pakistan automotive industry
over a span of five years, from FY 2005 to 2010. Results are shown in Figure 1.5. It shows that
production levels dropped in FY 2007-08, while FY 2008-09 was the worst year for the whole
automotive industry. However, FY 2009-10 showed an improvement upon the otherwise declining
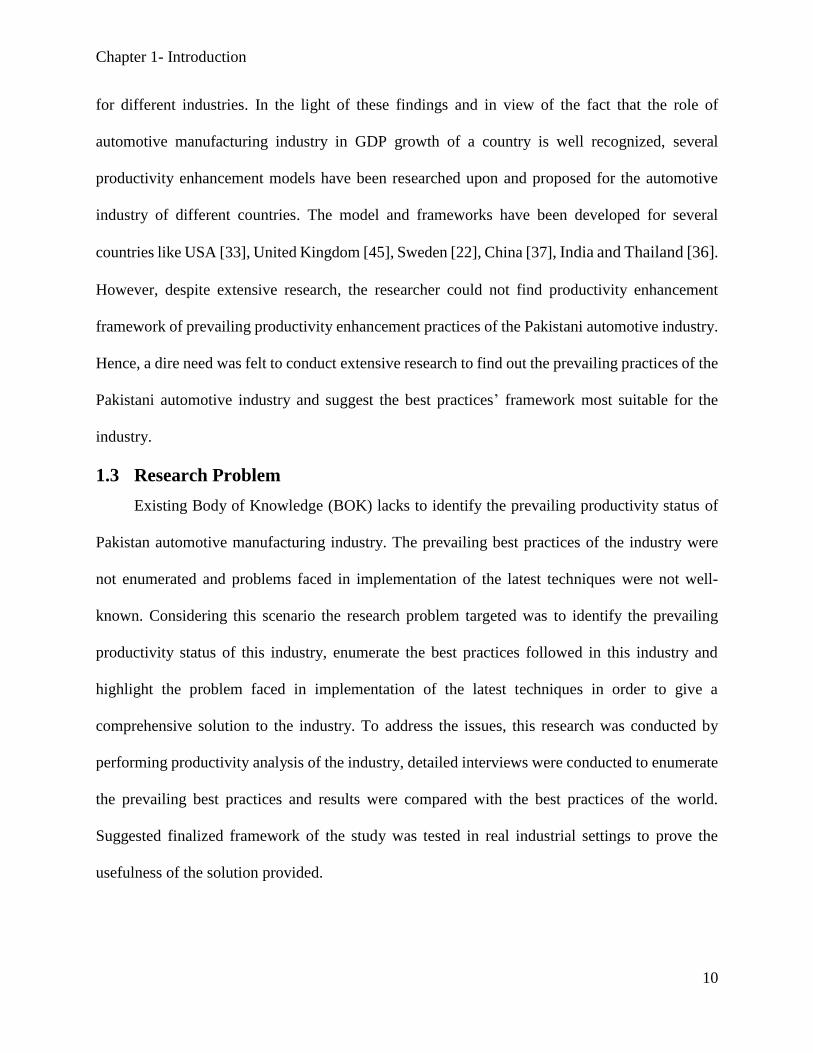
trend. In 2011, the Federal Bureau of Statistics (FBS), Pakistan reported that automobiles
manufacturing industry is producing more than any other industry in Pakistan (results shown in
Figure 1.6).
†† Pakistan GDP growth rate has been very low as compared to the GDP rate four to five decades ago. Contribution
of manufacturing industry in Pakistan GDP had been fluctuating around 18% to 19% in past few years. However, this
industry has the potential to make a better contribution in GDP.
Chapter 1- Introduction
8
Figure 1.4 Trend Line of Auto Industry Showing Huge Growth in Production
(Source Pakistan Association of Automotive Parts and Accessories Manufacturers
of Pakistan (PAAPAM)
Figure 1.5 Showing Trend Line of Total Production of the Industry for Both
Commercial (CV) and Private Vehicles PV (Toyota 2009)
Chapter 1- Introduction
9
Figure 1.6 Report of Federal Bureau of Statistics (FBS) Pakistan
These statistics specifically show that by incorporating productivity enhancement practices in this
industry, the GDP of the country can further be improved.
1.2 Philosophical Background
According to the latest research, there is no single methodology which can give a perfect
solution for productivity enhancement. Harrington [43] discussed the confusion of management
on choosing technology to attain higher benefits. This research has focused on the need to develop
customized solutions for different industries. McTavish et al. [44] discussed different management
techniques and manufacturing technologies and suggested that customized solutions for different
industries are required. Grünberg [23] carried out a detailed historical review of improvement
methods in manufacturing operations from 1776 to date. It was pointed out that most of the
techniques once used in one type of settings proved unsuccessful in the other type of setting
(eastern setting or western setting). Since all these techniques are too general as they come from
different fields, hence there is always a need to specify as to which technologies are most effective
Chapter 1- Introduction
10
for different industries. In the light of these findings and in view of the fact that the role of
automotive manufacturing industry in GDP growth of a country is well recognized, several
productivity enhancement models have been researched upon and proposed for the automotive
industry of different countries. The model and frameworks have been developed for several
countries like USA [33], United Kingdom [45], Sweden [22], China [37], India and Thailand [36].
However, despite extensive research, the researcher could not find productivity enhancement
framework of prevailing productivity enhancement practices of the Pakistani automotive industry.
Hence, a dire need was felt to conduct extensive research to find out the prevailing practices of the
Pakistani automotive industry and suggest the best practices’ framework most suitable for the
industry.
1.3 Research Problem
Existing Body of Knowledge (BOK) lacks to identify the prevailing productivity status of
Pakistan automotive manufacturing industry. The prevailing best practices of the industry were
not enumerated and problems faced in implementation of the latest techniques were not well-
known. Considering this scenario the research problem targeted was to identify the prevailing
productivity status of this industry, enumerate the best practices followed in this industry and
highlight the problem faced in implementation of the latest techniques in order to give a
comprehensive solution to the industry. To address the issues, this research was conducted by
performing productivity analysis of the industry, detailed interviews were conducted to enumerate
the prevailing best practices and results were compared with the best practices of the world.
Suggested finalized framework of the study was tested in real industrial settings to prove the
usefulness of the solution provided.
Chapter 1- Introduction
11
1.4 Motivation of Research
A lot of productivity enhancement solutions have been suggested such as Goodwin’s model
[46], Sutermeister’s model [47], Hershauer and Rcuh’s model [48], Crandall and Wooton’s
strategies [49], Stewart’s strategy [50], Analytical productivity improvement model [51],
Productivity improvement strategy [44] and Total Productivity Management (TPmgt) by [4].
However instead of productivity, performance was identified as the desired outcome in all these
models and this aspect was identified by researchers all around the world [4], [23], [25]–[27], [29],
[52], [53]. Especially after the acceptance of PPP Model proposed by Tangen [27] which
highlighted that productivity is at the core of performance and productivity umbrella, research
started in different countries of the world to find a solution for productivity enhancement of the
respective industries. Considering all these aspects, the researcher was motivated to develop a
framework which can focus on productivity enhancement for Pakistan automotive industry.
1.5 Scope of Research
Scope of this research is (but not limited to) to identify the prevailing productivity status
of Pakistan automotive manufacturing industry. This research also highlights the prevailing best
practices of the industry as well as the problems faced in implementation of the latest techniques
and technologies and suggest the most suitable best practices for this industry. Methodology of
implementation of these technologies and practices has also been suggested. The proposed
framework has been implemented in one of the major auto parts manufacturing company of
Pakistan and the results attained for productivity enhancement have also been elaborated.
1.6 Objectives of Research
1.6.1 Main Objective of the Research
Main objective of this research is to develop a productivity enhancement framework for
the private sector automotive manufacturing industry of Pakistan.
Chapter 1- Introduction
12
1.6.2 Sub Objectives of the Research
Sub objectives of research are (but not limited to) as under:
One of the sub objectives of the research is to identify the prevalent condition of
productivity in automotive industry of Pakistan by focusing on measurement of
productivity in major automotive manufacturing companies of Pakistan.
Productivity measurements will indicate the main productivity flaws of automotive
industry by pointing out the resources which have not been utilized to their
optimum. This measurement will indicate the probable productivity enhancement
areas.
Explore the extent of Productivity knowledge in the industry and productivity
practices.
To determine the prevailing best practices adopted in the industry.
To identify the main barriers posed in implementation of latest techniques and
practices.
Benchmarking best practices adopted by the automotive manufacturing industry
globally and comparing the best practices of the industry most closely associated
with Pakistan environment to suggest the framework.
To give a comprehensive methodology for adoption of this productivity
enhancement framework.
To validate the model by actually implementing the framework in one of the
companies of the industry.

Chapter 1- Introduction
13
1.7 Intended Stakeholders and Significance of the Study
Considering the research problem in hand, a unique approach was used to conduct this
study. Firstly, the present situation of the industry was analyzed. Then after taking input from the
stake holders a framework was generated, which was then compared with the best models of the
world. This comparison resulted in developing the finalized suggested framework. The final
recommendations of the framework were implemented in a functional company. The remarkable
financial and operation gains achieved due to these steps indicate the originality and
purposefulness of the research. This research will be beneficial for all the following stakeholders:-
All automotive manufacturing companies of Pakistan that intend to and are willing to
enhance their productivity and ultimately their profits.
All automotive manufacturing companies of developing countries (with minor
modifications) as the proposed framework are suitable for similar settings.
All manufacturing companies of Pakistan and other developing countries (with minor
modifications), as the proposed framework has been tested for validity through on
ground verification and the generalizability of the findings have been confirmed by
cross- cultural comparison.
Government bodies for making policies and rules for the industry.
All the governing bodies of the industry like Engineering Development Board of
Pakistan (EDB) for setting standards and redefining policies.
PAAPAM and PAMA for enhancing the productivity of this industry.
Consultancy and training firms that provide services to this industry.
Foreign investors and multinational firms who have invested or are considering
investments in the Pakistan automotive industry.

Chapter 1- Introduction
14
Chapter Summary
Technological advancements have brought revolutionary changes in the past few decades.
Mass globalization has changed the world and the concepts related to competition have also
transformed. Productivity, which is one of the key measure of competitiveness has become center
of focus for many research works conducted around the globe. New dimensions and challenges
have emerged in the field of productivity from defining and measuring to productivity
enhancement. Automotive industry is playing a vital role in GDPs of several countries. In past few
years there has been a major shift in number of automobiles produced and sold from western
countries to eastern countries. Production and sales of automotive in Pakistan has also increased
manifolds. In order to remain competitive with the world Pakistan automotive industry has to focus
on productivity enhancement. Existing Body of Knowledge (BOK) lacks to identify the prevailing
productivity status of Pakistan automotive manufacturing industry. Considering this scenario this
research focused on identifying the prevailing productivity status of this industry, enumerate the
best practices followed in this industry and highlight the problem faced in implementation of the
latest techniques in order to give a comprehensive solution to the industry for productivity
enhancement.

Chapter 2- Literature Review
15
CHAPTER 2
LITERATURE REVIEW
2.1 Significance of Productivity
The expansion of international trade, globalization of economies and emergence of new
markets have made productivity a critical success factor for any country in the world. Anticipating
these developments, most of the countries have formulated strategies and policies to ensure that
their local organizations have the capability to compete in the global market. Productivity is
generally used as a “measure of competitiveness” [2]. Problem faced in developing countries is
not only underdevelopment but also that of mis-management* [1]. Numerous studies have been
conducted to find out management issues; such as, determining the relationship of job behaviors
of employees, job satisfaction and motivation with employee commitment, turnover, absenteeism,
productivity and occupational stress [54]–[58]. Productivity has been identified as one of the most
serious challenges that have been confronting management. Apart from higher profitability and
better performance [27] productivity has been found to be negatively related with inflation. It is
positively related with the enhanced quality of life, higher employment rate, political stability and
economic growth of the country [1], [4].
2.2 Productivity Definitions and Measurement
Productivity and production are terminologies which have been misused and
misunderstood by many. Since the first mention of the word productivity by Quensey in 1766 [4]
several different definitions of the term have been suggested. The Organization of European
Economic Cooperation OEEC (1950) defined productivity as “Quotient obtained by dividing
* Todaro and Smith (2008) indicated in their book “Economic Development” at page 6 that in developing countries
issues of low productivity and poor performance are more related to management flaws rather than other techniques
and technologies used. They have further highlighted these issues in the proceeding chapters.
Chapter 2- Literature Review
16
output by one of the factors of production”. In defining productivity difference of objectives of
different stakeholders is the major issue. The reason of this difference is that the objectives of firms
and nation are multidimensional. The objectives of government are focused on improving the
standard of living of its citizens, increase employment and create more jobs. The main aims of the
firms are focused towards winning market shares both domestically and internationally, enhance
profits, and compete globally.
Sumanth [4] differentiated productivity and production† and explained that “production is
concerned with the activity of producing goods and/or services”, whereas, “productivity is
concerned with efficient and effective utilization of resources (inputs) in producing goods and/or
services (output)”. The author further distinguished partial productivity, total factor productivity
(TFP), total productivity and total productivity management (TPMgt)‡. He defined Partial
productivity as “ratio of gross output to single factor input”. Total factor productivity was defined
as “ratio of net output (excluding materials from gross output) and the sum of labor and capital
inputs in deflated monetary units”. Total productivity was defined as “ratio of total output to the
sum of all input factors”. Despite clear theoretical demarcation, practical implementation of these
terminologies in industrial applications has remained a grey area. Heshmati [59], [60] studied the
core methods of measuring efficiency and productivity. The author elaborated upon the effects of
productivity growth and efficiency in manufacturing and service industries. In another study the
† It has been reported by several researchers that in industry people used production and productivity
interchangeably. This misconception caused several issues related to the enhancing efficiency and effectiveness.
Sumanth in his books Productivity awareness in the US: A survey of some major corporations (1980) pages 84-90,
and Productivity Engineering and Management (1994), deliberated upon this aspect and clarified these terms. He
also identified that the knowledge of productivity is very vague even in the industry of developed countries like
USA as well. ‡ Sumanth in his book Total Productivity Management, A systematic and quantitative approach to compete in
quality, price and time (1998) gave the concept of Total Productivity Management Chapter 4. He gave the complete
system of measuring, evaluating, planning and enhancing productivity.

Chapter 2- Literature Review
17
latest trends of these methods were compared [60]. Wang and Szirmai [18] carried out a
comprehensive study on the Chinese manufacturing industry. They studied the productivity growth
of this sector from 1980 to 2002. The study deliberated upon the structural changes in the sector
as well as the effects of productivity growth.
Another myth argued about by many researchers is that productivity and quality don’t go
hand in hand [9], [10], [61]. It has been reported that this misconception prevails in several large
industries like the Finnish Industry [9] and also the American industry [61]. Hunnula [10] indicated
that this myth is true only if partial productivity ratios are utilized. The author gave a solution that
this problem can be solved by using Total productivity measures, since conceptually total
productivity measures incorporate only quality products in the outputs. Author further suggested
and proved that total productivity can be measured with the help of simple and commonly used
partial productivity ratios. He named this methodology as expedient total productivity
measurement. This methodology helps the firms to effectively measure and thus enhance their
productivity. Furthermore, Cobb-Douglas type production functions are preferred from point of
view of economists but are not generally used in managerial practices due to complexities involved
[10]. In this research Cobb-Douglas production function has been used to determine the factors of
productivity and to calculate total factor productivity.
2.3 Productivity Improvement Models and Issues
For productivity enhancement at firm and international level several models have been
proposed. Goodwin [46] gave a productivity enhancement model named as “Goodwin Model”.
The main theme of this model was “Improvement Management”. He emphasized that the way we
improve has to be improved first. He gave a three-prong approach encompassing philosophy of
human considerations, tools and techniques to be incorporated and the complete plan envisaging
a stream of actions to be conducted. His model was not focused on productivity improvement as

Chapter 2- Literature Review
18
envisioned, rather it gave a complete framework for organizational change and performance
improvement.
Sutermeister’s approach [47], focused on labor productivity and performance. Schematic
diagram of his model comprised of series of circles with labor productivity and performance at the
core of the circles. He elaborated that the factors affecting labor productivity were arranged in
circles, those nearer to the circle of the core affects more the labor productivity than the ones
further away. His model consisted of two major themes; technological development and
employee’s motivation. He showed the interrelations of different factors affecting the employee’s
productivity and performance with the help of pictorial depiction. His model too was an
interpretation of taking productivity and performance collectively. Despite being fairly elaborative
his model was a broad descriptive framework to enhance labor productivity and performance.
Hershauer and Rcuh [48] gave a “Servo System Model”. This model was focused on worker
performance. They showed as to how organizational factors and individual factors affect the
worker performance directly or indirectly. They particularized this model as a “dynamic feedback
system”. This model was adopted and implemented by several organizations of the industry with
successful results. However, this model gave a system for performance improvement only the
worker. This model was considered to be a good system for qualitative feedback but was unable
to give any quantitative results for the industrialists to compare the performance.
Crandall and Wooton [49] explained in their research that the traditional efficiency based
productivity improvement models were to be replaced with organizational growth strategies. Their
proposed strategies known as “Crandall and Wooton’s Strategies” were focused on
“entrepreneurial growth”, “bureaucratic growth”, “diversification and systemization growth” and
“mega organizational growth”. The main themes of this model were “stabilization”,
Chapter 2- Literature Review
19
“redevelopment” and “reduction”. These techniques were very realistic but these strategies again
focused on organizational performance instead of organizational productivity. They emphasized
that focus on organizational growth will ultimately result in productivity and efficiency
improvement of the organization. As their focal point was organizational growth and
organizational culture, so they expounded upon the issues of long term strategies, missing out the
daily improvement activities necessary for productivity growth.
Stewart [50] gave a more focused approach for productivity improvement. The
productivity enhancement model proposed by him is known as “Stewart’s Strategy”. Instead of
focusing on overall organizational performance improvement strategies, he proposed a system of
network encompassing small improvement from lower level in order to improve organizational
performance. His schematic diagram gave a system in which an organization is seen as a grid of
small subunits working together for enhanced organizational performance. He gave a detailed
approach in which small teams of a unit work in collaboration with the teams of other units for
improvement of the system. His concept of task force was very near to the quality circle teams as
given in TQM Philosophy. He used the Nominal Group Technique (NGT) for development of
several groups all around the organization for improvement from the grass root level. His model
was probably closest for industrial implementation. However, due to the complexities of the
model, it was not used widely in manufacturing units.
Aggarwal [62] gave a step by step procedure for productivity enhancement in
organizations. His procedure was based on several case studies carried out in industrial settings.
His procedure was named as “Aggarwal Approach”. His steps included; identification,
prioritization and quantification of the issues, preparation of action plans for productivity
improvements, elimination of productivity barriers in the industry, development of productivity

Chapter 2- Literature Review
20
measurement model, execution of the productivity improvement plans, motivating workers and
staff, maintaining momentum of productivity efforts and continuous audit of the organizational
climate. His approach was one of the most focused approaches for productivity enhancement but
failed to get industrial application status. Despite being based on real time case studies this
approach failed to get industrial attention. It was more of a broad outline on productivity
improvement without elaborating the detail explanation of the methodology to be followed. For
industrialist it was more of an academic proposal rather than a feasible industrial implementation
model. Sumanth [51] utilized the findings of these studies and the step by step approach of
Aggarwal, and suggested an “Analytical Productivity Improvement Model”. Continuous efforts of
Sumanth, focused towards industrial application resulted in a better response from the industry.
He conducted several industry wide surveys and resultantly was able to come up with the most
accepted management technique known as Total Productivity Management (TPgmt) [4]. His
surveys focused on industry and ensured industrial officials to be part of these developments.
Resultantly, he was able to get better acceptance of his productivity management strategy by the
industry. He gave the steps of productivity measurement, productivity evaluation, productivity
planning and productivity improvement. His management strategy was largely adopted by industry
but lacked the sequence and details of the latest manufacturing technologies and diverse
management techniques. However, researchers all around the globe kept on striving to suggest
customized solutions for different industries.
One aspect to be noticed in these models is the fact that generally performance was
considered as the core desired outcome instead of productivity, assuming that higher productivity
would be achieved in the process. The terms productivity and performance are often confused and
Chapter 2- Literature Review
21
incorrectly considered as mutually interchangeable, like the terms efficiency and effectiveness§.
Many researchers [4], [52], [53] believed that by referring to productivity people were actually
working on performance improvement. A similar myth prevailed regarding productivity and
profitability that they go hand in hand, so most of the organizations concentrated on profitability
and performance in financial terms rather than concentrating on productivity enhancement
techniques. Many researchers [23], [25], [27] indicated this myth and elaborated that these
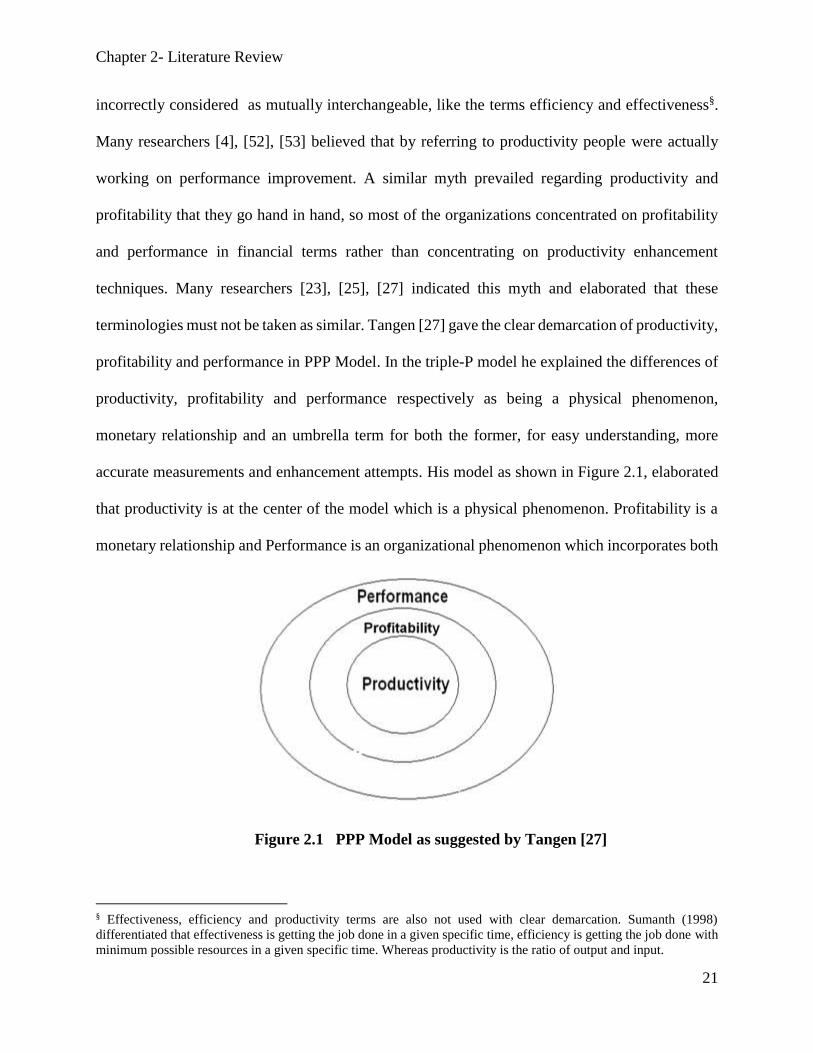
terminologies must not be taken as similar. Tangen [27] gave the clear demarcation of productivity,
profitability and performance in PPP Model. In the triple-P model he explained the differences of
productivity, profitability and performance respectively as being a physical phenomenon,
monetary relationship and an umbrella term for both the former, for easy understanding, more
accurate measurements and enhancement attempts. His model as shown in Figure 2.1, elaborated
that productivity is at the center of the model which is a physical phenomenon. Profitability is a
monetary relationship and Performance is an organizational phenomenon which incorporates both
Figure 2.1 PPP Model as suggested by Tangen [27]
§ Effectiveness, efficiency and productivity terms are also not used with clear demarcation. Sumanth (1998)
differentiated that effectiveness is getting the job done in a given specific time, efficiency is getting the job done with
minimum possible resources in a given specific time. Whereas productivity is the ratio of output and input.
Chapter 2- Literature Review
22
productivity and profitability. He further distended the necessity of tackling these terms separately
in order to have a more focused measurement and enhancement endeavors. After this demarcation,
a lot of research has been carried out all around the globe. It aided in the development of
improvement methodologies specifically for productivity enhancement [25], [28], [38], [63].
2.4 Productivity Enhancement in Automotive Industry
In the recent past the automotive industry in many countries has been recognized as a major
contributor of growth, technology, employment and GDP [30]. Owing to the importance of the
role played by this industry in the economic growth and development of a country, a lot of research
has been conducted all over the world. Hitt, Ireland and Hoskisson [64] examined the Honda Motor
Company and reported that by Honda Motors reduced its production costs by 30% by adopting
flexible production systems through small car and small volume operations. A research on BMW
and Mercedes-Benz cars [65] revealed that they have edge in superior engineering, elevated stature
and excellent quality. Studies have been carried out on the effects of task rotation and working
methods on enhancement of soft issues such as motivation and job satisfaction in automotive
setups in Malaysia [66]. A research on Lexus, a division of Toyota Motor Corporation Ltd has
been conducted by Markides [67] identifying the need of integration in the value chain. Hill and
Hones [68] elaborated upon several different strategies adopted by automobile manufacturers for
customer satisfaction. Authors gave examples of GM’s midsize Cadillac, and Ford’s midsized
products. Authors have highlighted that Toyota, Ford, Daimler-Chrysler, and Mercedes Benz have
employed strategies like integrated cost leadership and differentiation to attain competitive
advantage.
2.5 Role of Government and Productivity Issues in Developing Countries
Zutshi and Gibbons [69] discussed that there has been an active role played by the
governments in Southeast Asia to promote industrial growth both in manufacturing and service

Chapter 2- Literature Review
23
fields, which is contradictory to western theories. The authors argued that government
participation, polices and decisions have been the backbone for industrial growth and achieving
competitiveness in this region. This research reviewed two government linked companies (GLCs)
in Singapore outlining their internationalization process from a contextual perspective. Mahadevan
[13] explained two different views on government involvement with a special focus on the role of
the public sector in services and manufacturing: firstly, “Washington consensus” deliberating that
excessive and unfair competition from public sector results in cutting down progress of the private
sector, and secondly, “Developmental state view” debating that there is a dire need for government
to intervene and public sector to actively participate towards economic growth in developing
countries. The author gave the examples of Korea and Singapore emphasizing that in Asia an
active role of the public sector is a must to achieve desired developments. Dependence on public
sector industry specifically the defense industry is a must for under developing countries due to
political and strategic factors [70]. The author expressed that the arms embargo on these countries
has been another major factor for development and expansion of public sector. The research
evaluates establishment of defense industry in Jordan while also examining the same in Brazil,
South Africa, South Korea and Taiwan, pointing out the positive effects they had on the economies
of their countries. Strong effects of Government Policies on productivity of industrial sector has
been studied [4] and it has been recognized that effective and favorable government policies are
essential for productivity enhancement.
2.6 Reasons for Selecting Pakistan and Gap in Literature Review
Pakistan is one of the developing countries with remarkable potentials for manufacturing
enhancement. The automotive industry of Pakistan has shown some improvements mainly due to
enhanced capital inputs but its contribution in GDP and employment is still of modest size.
Particularly, a remarkable difference can be observed compared with other Asian countries like

Chapter 2- Literature Review
24
Japan, Korea, Malaysia, India, China and Thailand. In these countries the automotive industry has
exploited the catalytic role in promoting growth of broad based manufacturing sector (Asian
Development Bank Report). One reason for the difference is the fact that very less research has
been carried out on the operational procedures and productivity enhancement possibilities of
Pakistan automotive industry.
Sarwar et al. [71] indicated that Pakistan loses more than Rs. 450 billion annually due to
poor quality, low productivity and wastages. It was also explained that frequently changing
government policies in Pakistan has resulted in slow economic growth. In the beginning, private
sector was relied on for manufacturing and services but in early 70’s policies shifted towards
nationalization. In the late 80’s and 90’s, it was realized that public sector organizations were not
performing as per desired expectations. Hence, declining private sector was given relief through
inclined polices [19]. The Privatization Act 2000 was the first milestone achieved that gave a
remarkable boost to the private industry (Asian Development Bank Report 2008). This act gave
private sector a big boost and Pakistan’s output got a rise to 13 percent in 2005-06 from 5.67
percent in 1959-60 [72]. Federal Bureau of Statistics, Pakistan [73] conducted a survey and it was
found out that the manufacturing industry of Pakistan contributes 19% in the GDP. According to
a survey conducted by them in 2010, it has been stated that the manufacturing industry contributed
18.5% in GDP. This percentage is still quite low as compared to the neighboring countries like
India, China and Malaysia. In order to improve productivity, attention has to be paid to fast
changing world and improve capacity of organizations for change adjustment. It is necessary to
recognize the importance of all major factors, which contribute to or put barriers against
productivity growth. This research has been carried out to measure and evaluate the productivity of
the leading automotive manufacturing companies of Pakistan; while highlighting the flaws in the
Chapter 2- Literature Review
25
existing systems and conducting surveys to propose a productivity enhancement framework. In this
research, gap in the body of knowledge regarding the productivity enhancement model for
automotive industry in Pakistan has been researched. After identifying the blemishes and
drawbacks in the prevailing system, a comprehensive productivity enhancement framework has
been proposed. This framework was then validated as a model, in one of the major auto parts
manufacturing factories of Pakistan.
2.7 Contextualization of Research
Development processes and economic growth scenario in developing countries is
drastically different from that of the developed world [1]. The results and solutions of research
conducted in the developed world cannot be implemented in the developing countries without
change, because cultural as well as other differences also play an important role and can give
different results for similar kind of research [74]–[77]. Considering these facts as revealed from
previous research, this research is carried out in one of the major countries of developing world
i.e. Pakistan. This research focuses on the automotive industry and specifically productivity
measurement and productivity enhancement in Pakistan which is a grey area in the Body of
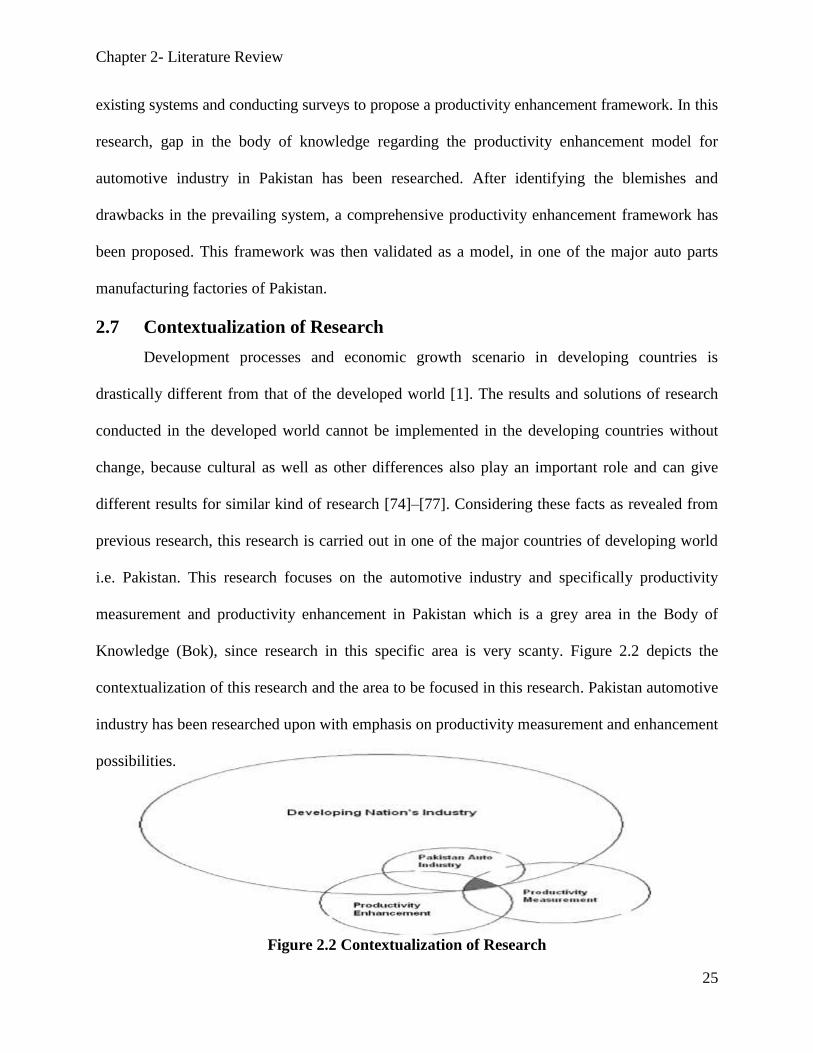
Knowledge (Bok), since research in this specific area is very scanty. Figure 2.2 depicts the
contextualization of this research and the area to be focused in this research. Pakistan automotive
industry has been researched upon with emphasis on productivity measurement and enhancement
possibilities.
Figure 2.2 Contextualization of Research
Chapter 2- Literature Review
26
2.8 Factors Affecting Productivity
There has been a consensus amongst the researchers that major factors influencing the
overall productivity of an industrial organization are identified as technology, equipment,
management, personnel, job satisfaction, rules and procedures [5], [6], [17], [78].
2.8.1 Role of Technology
Role of technology has been considered as one of the most crucial factors affecting
productivity of an organization [5], [6], [17], [78]. As per Webster dictionary the word technology
is formed of two Greek words techno meaning “art, skill or craft” and –logía meaning “the study
of something or the branch of knowledge of a discipline”.
Technology is mostly thought of as being consisting of the latest gadgetry, computers and
most modern machines however, [4] indicated this misconception about technology and elaborated
that technology is defined as “any means to accomplish an objective or task”. Sumanth discussed
that there are four types of technologies, product technology, process technology, information
technology and managerial technology. According to the author, process technology is the most
crucial factor for productivity enhancement in any organization. However, in this research all four
types will be considered for productivity enhancement because role of the other three types in
productivity enhancement cannot be ruled out.
Most research is conducted only on the impact of process technologies on performance and
productivity of the enterprises. Several surveys have been conducted on benefits of advanced
manufacturing technologies (AMT) which basically encompasses only the process technologies
[28], [79]–[82]. Thomas et al. [28] conducted a survey on 300 SME’s in UK to investigate the state
of AMT in manufacturing organizations. The survey results were then used to propose a strategic
model for AMT implementation. This research used the most effective methodology used for these
kinds of surveys, a mix of qualitative and quantitative questionnaires. A survey was conducted of

Chapter 2- Literature Review
27
Turkish manufacturing industries and highlighted the effects of overall technical changes on
industrial growth [83]. They argued that technical enhancement is the key towards effective
utilization of resources and productivity enhancement. A detailed evaluation of Korean
manufacturing industries was carried out [84]. The researcher identified and estimated the sources
of technical inefficiency in these organizations.
Coronado [85] conducted a research on impact of information systems (IS) on
manufacturing agility in SMEs. The author used a similar type of survey using qualitative and
quantitative surveys to investigate the issue and as an outcome proposed a framework for
enhancing the manufacturing agility. It was reported in the research that how IS can be used for
enhancing the performance of an organization. In productivity improvement efforts, information
technology has always been considered to be one of the most important aspects. However, debate
and discussion on the role of IT gave rise to the concept of “Productivity Paradox”. Also known
as “Solow Computer Paradox” once Solow [86] pointed out that “You can see the computer age
everywhere but in the productivity statistics”. Brynjolfsson [87] noted the disagreement of
advancement in computer technologies and relatively slow growth of productivity at firm,
individual and national levels. Several other research works have also pointed out this aspect and
emphasized that not all latest technologies are good for all kinds of scenarios. It is duty of the
management to decide how much and where to invest in IT [4], [44]. This aspect also holds true
for other kinds of technologies as well.
McTavish et al., [44] established a framework for improving productivity. They talked
about a new trend for productivity improvement i.e. concentrating on “knowledge workers” to
enhance productivity. The authors emphasized that despite the fact that a number of new
technologies, concepts and techniques have been proposed and developed but still there is a need

Chapter 2- Literature Review
28
to make a choice between them in different scenarios in order to enhance productivity. They talked
about Zero Inventory (ZI), Just in Time (JIT), Flexible Manufacturing System (FMS), Optimized
Production Technology (OPT), Computer Integrated Manufacturing (CIM), Activity Based
Costing (ABC), Quality Function Development (QFD) and Total Quality Management (TQM).
They gave a generalized solution to make different combinations of these technologies in order to
increase output and also proposed a strategic framework to enhance productivity. However, this
framework was so generalized that there is still a need to propose and establish frameworks for
different industries.
The effectiveness of different management technologies have also been researched upon.
Saad and Patel [38] investigated the possibilities of Supply Chain Management (SCM) for
performance measurement in the Indian automotive sector. Authors indicated that there are very
few attempts to research the aspects and practices of SCM in developing countries and especially
in India. The findings of the research gave alarming results that the world’s best technologies like
SCM and balance scorecards may not be very effective to use in India until and unless proper
grounds are prepared for the purpose. This research further augmented the belief that there is a dire
need to conduct a study in Pakistan automotive industry as well.
Park [16] coupled productivity with the Six Sigma concept and explained as to how Six
Sigma implementation has improved the productivity of several firms in Asia. Productivity and
quality relationship has also been clarified to be interdependent and that none is useful without
augmentation and emphasis of the other. On the other hand different results have been shown in a
research conducted in Brazil [63]. They worked on benchmarking the Six Sigma application in
Brazil and found out that organizations fail to implement the Six Sigma concepts successfully
without fulfilling the basic criteria. They highlighted that lack of managing ability is one of the

Chapter 2- Literature Review
29
major causes of several failures of Six Sigma implementation. Secondly, a specific number of
black belts, green belts must be trained first within the organization before trying to implement
this concept.
A research was carried out in Finland on managerial perceptions of productivity in public
sector [25]. They conducted a survey and reported that there is a misconception about productivity
in this sector. It was also reported in the research that some respondents were not able to define
productivity at all, indicating that there is a dire need in the industry to work on this aspect to
enhance performance and profits. Grünberg [22] carried out a detailed historical review of
improvement methods in manufacturing operations. The author reviewed the latest techniques and
methods from 1776 to 2003. Author discussed methodologies adopted in Japan and USA including
Total Preventive Maintenance (TPM), 5S, Kaizen, Benchmarking, Toyota Production System
(TPS), Theory of Constraints (TOC), Business Process Reengineering (BPR), Lean Manufacturing
and Deming’s Wheel of improvement. He also linked these with improvement of profits,
performance and productivity. It was also pointed out that most of the techniques once used in
western settings proved unsuccessful due to cultural differences. The limitations of these
techniques and methods were also pointed out in this research while proposing measurement model
and performance factor model to fill the gap. An important finding of the review was that only
after measurement one can decide which tool to use for performance enhancement. Another aspect
pointed out by this research was the fact that all these techniques are too general as they come
from different fields. Hence, there is always a need to specify which technologies are most
effective for different industries.
The list of productivity enhancing tools used by different industries has been enumerated
by Performance Management, Measurement and Information (PMMI) report [88]. A detailed

Chapter 2- Literature Review
30
review of mostly used technologies and techniques was carried out and a list of 15 most used
techniques has been elaborated upon in this report. This report is an excellent review of the
technologies used, but it only concentrates on performance as an outcome. Harrington [43]
proposed a new model with the concept of total improvement management. Author pointed out
that most of the research and management decisions focused on quality issues and aspects with the
view that improvement will be achieved on successful implementation of quality solutions only.
In a detailed literature review, the author discussed the contribution of quality Gurus while
highlighting that no single methodology gives a perfect solution and highlighted the confusion of
management as to which technology should be chosen. It was elaborated that mostly all
management technologies require a major portion of resources. Furthermore, the effect of
frequently changing decisions of management on the performance of an organization was also very
effectively highlighted. This research again focused on a need to develop customized solutions for
different industries.
On the basis of this extensive literature review, the author felt that a productivity
enhancement framework specifically for the automotive manufacturing industry of Pakistan
should be developed, which can also be generally used in other developing countries with some
minor modifications. A similar concept was used by Davis [89] as he proposed Technology
Acceptance Model (TAM). This model is probably the most accepted and cited model, though it
was basically proposed for computer usage and information technology only. The authors also
gave the concepts of perceived usefulness (PU) and perceived ease of use (PEOU). PEOU is
defined in this research as “the degree to which an individual believes that using a particular system
would be free of physical and mental effort”, and PU as “the degree to which an individual believes
that using a particular system would enhance his/her job performance”. Davis emphasized that

Chapter 2- Literature Review
31
“user acceptance is often the pivotal factor determining the success or failure of an information”
[90]. As an extension of TAM, TAM2 was proposed [91]. In this new extension, the authors
included social influence process and cognitive instrumental process. There is a dire need that a
similar kind of TAM should be developed for other aspects of technology i.e. process technologies,
product technologies and managerial technologies.
Knowledge management is a field which has caught the notice of researchers and academia
all over the world. Sigala and Chalkiti [92] linked the concept of knowledge management with
performance improvement. The importance of knowledge management for any kind of
improvement in any field was highlighted by the authors. The authors elaborated that there are
different definitions of Knowledge but they defined it as “actionable information”. In an extensive
literature review conducted in this research, the two dimensions of knowledge advocated upon
have also been explained which are Explicit Knowledge (EK) and Tacit Knowledge (TK). TK is
defined as “type of knowledge that cannot be expressed and transcribed in written form, as it is in
our minds only” whereas EK is defined as “knowledge that can be transmitted into formal
language”. As per the point of view of the author EK is just a tip of the iceberg and world of
knowledge lies in the invisible part that is TK which has to be explored. The importance of TK for
enhancing business performance has been discussed and studied in this research. It was also
indicated that different performance (and productivity) improvement techniques like supply chain
have been investigated in the light of knowledge management in the past, however specific studies
focusing on TK are not traceable. The problem for externalization and ultimately utilization of TK
has been elaborated in this research conducted on Greek Hotels. The important finding of the
survey of this research is very relevant and important for my research because a lot can be explored

Chapter 2- Literature Review
32
and utilized for productivity enhancement from the extension and utilization of TK in Pakistan
automotive industry. So TK has been added as an important variable in this research.
2.8.2 Impact of Job Satisfaction
During the past few decades, job satisfaction of the employees in both public and private
sectors has received intensive research. The scholarly attention on job satisfaction is not surprising
because it is a strong predictor of productivity [93], [94] and job performance, which ultimately
lead to high employee retention [95]. Job Satisfaction has also been found to be negatively related
to turnover [96] and absenteeism [97]. Organizations need to promote job satisfaction in their
employees in order to prevent job withdrawal and boost productive performance. Interestingly,
literature has recognized differences in levels of satisfaction across cultures [74]. Job satisfaction
due to intrinsic motivational factors is found to be higher in individualistic countries; whereas,
extrinsic factors provoke higher satisfaction level in collectivistic cultures [98]. A positive
relationship between collectivism and job satisfaction is also found in one of the studies [99].
Another study found that job satisfaction is higher in the U.S. than in Japan [74]. The cultural
differences also have to be taken into account while interpreting the findings of this research
because the results of the western world do not necessarily hold true for the eastern world (and
vice versa) as indicated by previous studies conducted in non-western work settings [74]–[77]
Job Satisfaction is the sense of achievement, accomplishment and pride felt by employees
in their respective job settings and is believed to be ‘‘an attitude toward one’s job’’ [100]. There
are many factors which influence job satisfaction and its importance was earlier realized by
Herzberg et al. [101]**. Later, Herzberg’s theory was tested for its validity in different work
** In motivation-hygiene theory, he identified six factors achievement, recognition, work itself, responsibility,
advancement and growth, which cause satisfaction and named them “Motivators”. Another six factors identified were
company policy, supervision, relationship with boss, work conditions, salary and relationship with peers which might
cause dissatisfaction and were called as “Hygiene factors”.

Chapter 2- Literature Review
33
settings by many researchers. The study on Thai construction engineers and foremen [102] showed
that motivators contribute to job satisfaction, while hygiene factors lead to dissatisfaction. The
quest of increase in job performance compelled administrators to identify factors that foster
employees’ work satisfaction. A comparative analysis [103] was conducted between the public
and private sector employees of Florida U.S.A. The results revealed that the public sector value
the extrinsic factors significantly higher than those in the private sector. Private Sector employees
were found to be more inclined towards intrinsic factors [104]. However, significant empirical
studies carrying out analysis of satisfaction level of public sector organizations in South East Asian
countries are rarely found. A qualitative study was conducted to investigate the important factors
necessary to increase the level of job satisfaction in the public service sector of Pakistan [105].
The extent of research exploring the effects of job satisfaction on productivity is limited in both
private and public sectors of Pakistan, and very rare in the automotive manufacturing industry.
Hence there is a dire need to further explore this relationship.
Chapter Summary
The expansion of international trade, globalization of economies and emergence of new
markets have made productivity a critical success factor for any country in the world. A lot of
research has been conducted in the world on productivity due to this aspect. Several productivity
improvement models have been suggested in the past. One of the major issue with these models
was that performance was considered as the desired outcome instead of entirely focusing on
productivity. Tangen [27] gave the PPP model differentiating these terms. Due to this addition in
BoK, researchers all over the world started developing productivity enhancement models for their
industries. Pakistan is one of the developing countries with remarkable potentials of manufacturing
enhancement. The automotive industry of Pakistan has shown some improvements mainly due to
enhanced capital inputs, but its contribution in GDP and employment is still of modest size. There

Chapter 2- Literature Review
34
is a dire need to work on productivity enhancement of this industry so that it can play a vital role
in GDP of the country. In this chapter a detailed literature review has been conducted which has
identified that development of customized productivity enhancement model for Pakistan
automotive industry is essential. Several different methodologies used all over the world for
productivity enhancement e.g. role of technology, have also been discussed in detail.

Chapter 3- Research Methodology
35
CHAPTER 3
RESEARCH METHODOLOGY
3.1 Preface
Several productivity enhancement models have been proposed in the past but measurement
in that specific area is a must for any kind of enhancement [4]. Proposing a productivity
enhancement model without measuring and depicting the prevailing status is useless. Sumanth [4]
proposed Total Productivity Management (TPgmt) in which measuring productivity is the first
stage, evaluating productivity is the second, productivity planning is the third and productivity
enhancement activities is the fourth stage. This model was followed in this research and first the
prevailing productivity status was measured quantitatively from secondary data. Based on these
results qualitative research was done to find the knowledge about productivity in this industry.
Thereafter, the prevailing productivity enhancement best practices used in the industry were found.
These best practices were compared with the best practices followed in the world and a
comprehensive productivity enhancement model was proposed based on this comparison. The
proposed framework was implemented in one of the major auto manufacturing companies of
Pakistan. The results were monitored after implementation to confirm the validity of the model.
Detailed description of the procedures followed and samples selected are given in the succeeding
paragraphs.
This mix methods research was conducted using sequential explanatory design in
combination with sequential exploratory design as suggested by Creswell* [106]. Firstly,
quantitative research was conducted in order to measure the prevailing productivity status of the
* John W Creswell is considered to be one of the best experts in mix methods research. He is Author of several
books on mix methods research and founder of the first mix methods journal, International Journal of Mix Methods
Research. In his book “Research Design: Qualitative, Quantitative and Mix Methods Approaches” (2013), he gave
six research designs for mix methods research, Chapter 10.
Chapter 3- Research Methodology
36
industry. A detailed productivity analysis of two major automotive manufacturing companies for
10 years span i.e. 2000 to 2010 was conducted. This analysis gave the status of the prevailing
productivity. Further, in order to find out the productivity knowledge and the best practices
followed in the industry, qualitative research was done. Interviews of 40 CEO’s and top managers
were completed from 26 companies of automotive industry all across Pakistan. This qualitative
research was conducted to develop a comprehensive productivity enhancement framework. The
results hence obtained were implemented in a functional factory at Lahore. In order to check the
validity of the model, another quantitative research was done on the secondary data in order to
check the validity of the model. This combination of first conducting quantitative research and
then, on the basis of its results, conducting qualitative research is known as Sequential explanatory
design†. In the second stage of the research, results of qualitative data analysis were used to
conduct quantitative analysis; this model has been named as Sequential exploratory design by
Creswell [106].
The main theme of this research was to enhance the productivity of these organizations.
This dependent variable of productivity enhancement is affected by several independent variables.
This research was conducted to find out the most important and promising variables which cause
some increase in the productivity of these organizations. These variables were identified with the
help of qualitative research conducted and their importance was confirmed with the help of the
results of implementation of these on ground in actual industrial settings.
† Sequential Explanatory Design was proposed by Creswell in his book Research Design: Qualitative, Quantitative
and Mix Methods Approaches (2007) page 209. In this type of research first quantitative research is conducted and
on the basis of the results qualitative research is conducted. Results of both are compiled for finalization of results.
Chapter 3- Research Methodology
37
3.2 Research Process
This research was conducted in four stages:-
Stage I Productivity Status of the industry was measured using quantitative
methodology.
Stage II Based on the results of first stage qualitative methodology was used,
in order to analyze knowledge of the industry about productivity and to develop a
comprehensive productivity enhancement framework for the industry.
Stage III Based on the results of the second stage the proposed framework
was implemented in one of the major auto manufacturing industry.
Stage IV Quantitative methodology was used to measure and compare
production increase, revenue generations and inputs used before and after the
implementation of the model to prove the validity of the model.
3.2.1 Stage I Productivity Measurement using Quantitative Methodology
Automotive manufacturing industry of Pakistan prospered during 1980’s and 1990’s owing
to inflow of foreign direct investment (FDI). During this period, world renowned automotive
manufacturing companies like Honda, Toyota and Suzuki launched their manufacturing plants in
the country. This industry flourished further after 2000 due to favorable polices adopted by
Government of Pakistan. Presently there are more than 21 automotive manufacturing companies
in Pakistan, out of which only three are car manufacturers, including Honda Atlas, Indus Motors
and Pak Suzuki. This study has focused on two wheelers as well as four wheelers, automotive
assemblers and auto parts manufacturers.

Chapter 3- Research Methodology
38
3.2.1.1 Data Sampling and Under Study Organizations
For productivity analysis, two major market share holding companies were selected out of
three cars- manufacturing companies in Pakistan. The two companies selected were Indus Motors
(principle is Toyota Motors) and Honda Atlas (principle is Honda Motors). The major reason for
selecting these companies was that only these two companies compete in nearly same nature of
cars i.e. 1300cc to 1800 cc cars. A detailed productivity analysis of these companies was carried
out over a span of 10 years’ time i.e. from the year 2000 to 2010. In order to measure productivity,
the most important aspect is to collect reliable, valid and detailed data including all aspects. It was
indented to measure Total Productivity as proposed by Sumanth [4], as well as all partial
productivities and Total Factor Productivity (TFP) using Cobb-Douglas function.
3.2.1.2 Data Collection
Data of the employees, their wages, total man-hours consumed, fixed capital input,
working capital input, cost of materials used, cost of energy utilized, cost of all other expenses;
including taxes, traveling expenses, and all other overheads was required. Furthermore, outputs,
in terms of both quantity and value were also required. All these details required secondary data
of the organizations. Asking companies about their capital investment including fixed and working
capital, employment details including wage rates, materials cost, energy expenses and other
overheads is a sensitive issue and inquiries like these can sometimes offended people, especially
in a country like Pakistan where such kind of research culture is still in nascent stage. Similar
problems were faced during data collection for this research directly from the companies. Owing
to failure to directly collect complete data from companies despite best efforts, the following
process was resorted to:
Chapter 3- Research Methodology
39
Firstly, internet search was conducted and two associations who maintain the detailed data
of Pakistan automotive industry, namely Pakistan Automotive Manufacturers Association
(PAMA) and Pakistan Association of Automotive Parts and Accessories Manufacturers of
Pakistan (PAAPAM) were consulted. A lot of information and data was gathered from these
associations. However, in certain aspects the data were incomplete for comprehensive productivity
measurements. Therefore, as an alternative for data collection, certain government organizations
like Ministry of Industries and Production of Pakistan (MOIP), Engineering Development Board
of Pakistan (EDB), Securities and Exchange Commission of Pakistan (SECP) and Federal Bureau
of Statistics Pakistan were consulted, because all organizations submit their organizational details
to these government agencies. Thus some important information was retrieved by using these
sources. A major problem with the data was that data gathered from these organizations was not
compiled keeping in view measurement of productivity, rather it was more inclined towards
financial issues only. During this process, it was felt that productivity awareness in Pakistan
industry needs more up gradation. The third option available was financial reports of these
companies. Therefore, the most reliable and valid sources of data of any company; i.e. their audit
reports were selected. The data extracted from these reports filled a huge gap in compiling the
productivity analysis of automotive industry. However, two key drawbacks of this data were that
available data on these reports had been prepared and compiled with a view to present the financial
status of the companies and not for measuring productivity. Secondly, in these reports sales’ of
products are the main aspect of emphasis whereas data of quantity produced are required for
productivity analysis. In order to retrieve required data from productivity point of view, several
formulae were derived. Details of these derived formulae are reported in Annex ‘A’. Output value
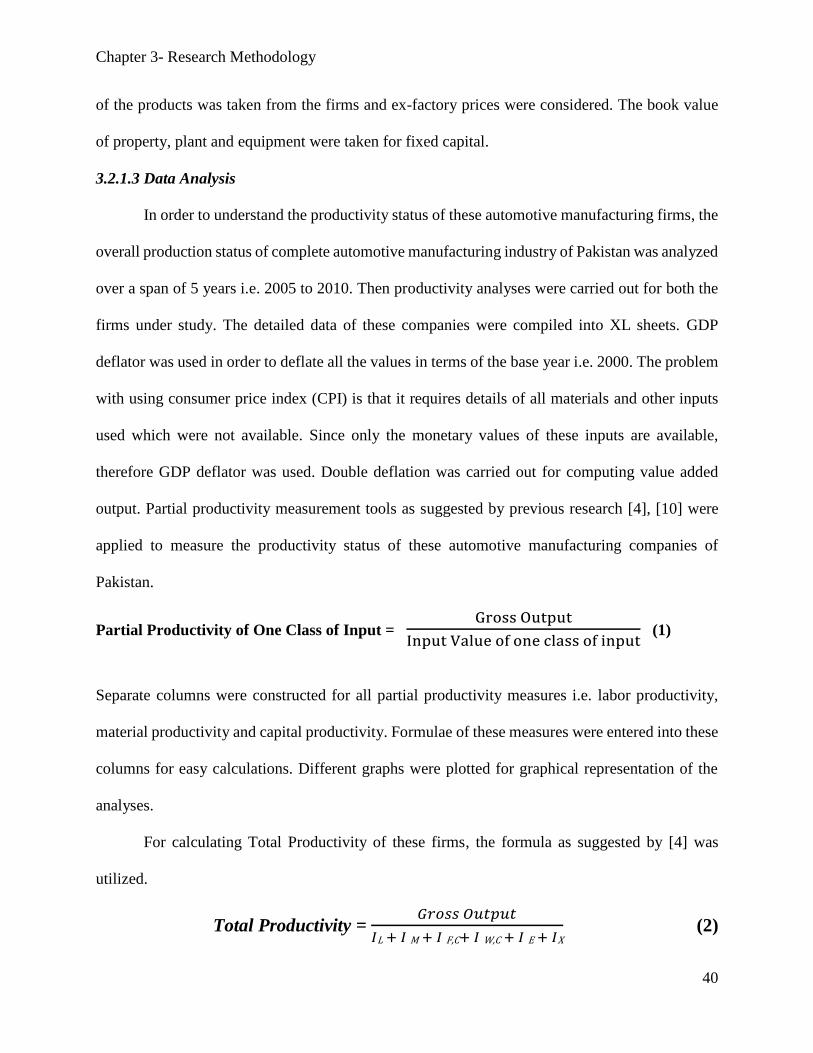
Chapter 3- Research Methodology
40
of the products was taken from the firms and ex-factory prices were considered. The book value
of property, plant and equipment were taken for fixed capital.
3.2.1.3 Data Analysis
In order to understand the productivity status of these automotive manufacturing firms, the
overall production status of complete automotive manufacturing industry of Pakistan was analyzed
over a span of 5 years i.e. 2005 to 2010. Then productivity analyses were carried out for both the
firms under study. The detailed data of these companies were compiled into XL sheets. GDP
deflator was used in order to deflate all the values in terms of the base year i.e. 2000. The problem
with using consumer price index (CPI) is that it requires details of all materials and other inputs
used which were not available. Since only the monetary values of these inputs are available,
therefore GDP deflator was used. Double deflation was carried out for computing value added
output. Partial productivity measurement tools as suggested by previous research [4], [10] were
applied to measure the productivity status of these automotive manufacturing companies of
Pakistan.
Partial Productivity of One Class of Input = Gross Output
Input Value of one class of input (1)
Separate columns were constructed for all partial productivity measures i.e. labor productivity,
material productivity and capital productivity. Formulae of these measures were entered into these
columns for easy calculations. Different graphs were plotted for graphical representation of the
analyses.
For calculating Total Productivity of these firms, the formula as suggested by [4] was
utilized.
Total Productivity = 𝐺𝑟𝑜𝑠𝑠 𝑂𝑢𝑡𝑝𝑢𝑡
𝐼L + 𝐼 M + 𝐼 F,C+ 𝐼 W,C + 𝐼 E + 𝐼X (2)
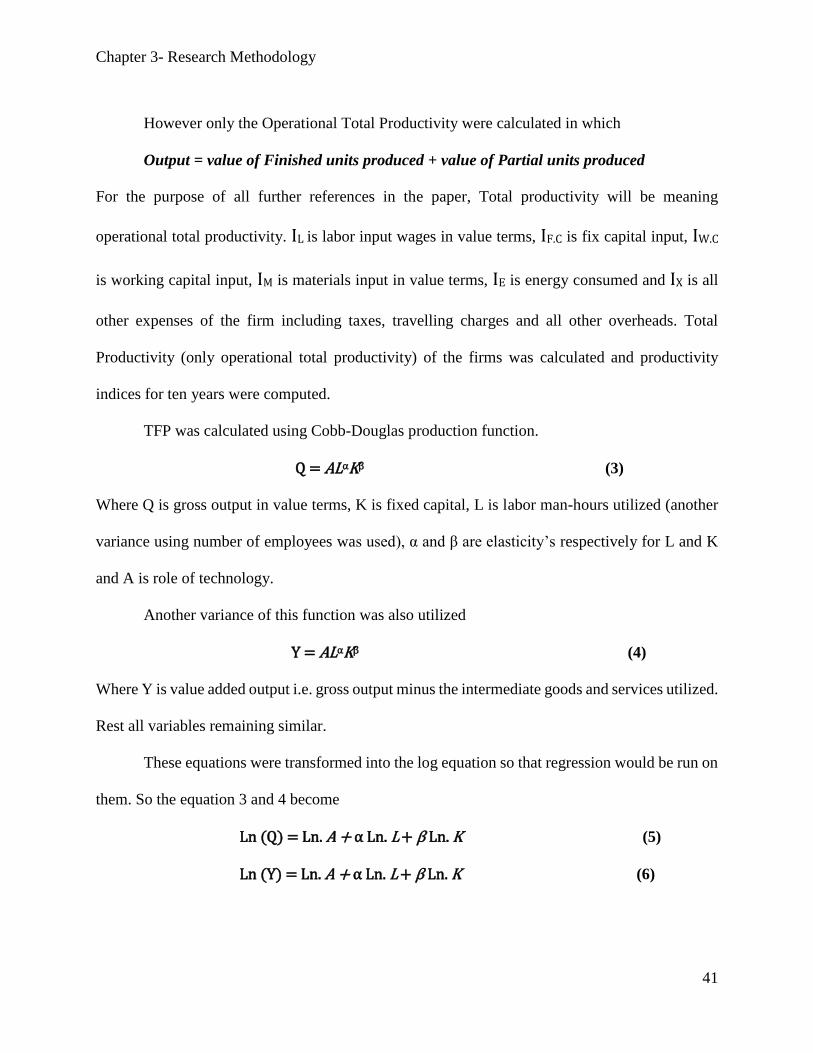
Chapter 3- Research Methodology
41
However only the Operational Total Productivity were calculated in which
Output = value of Finished units produced + value of Partial units produced
For the purpose of all further references in the paper, Total productivity will be meaning
operational total productivity. IL is labor input wages in value terms, IF.C is fix capital input, IW.C
is working capital input, IM is materials input in value terms, IE is energy consumed and IX is all
other expenses of the firm including taxes, travelling charges and all other overheads. Total
Productivity (only operational total productivity) of the firms was calculated and productivity
indices for ten years were computed.
TFP was calculated using Cobb-Douglas production function.
Q = ALαKβ (3)
Where Q is gross output in value terms, K is fixed capital, L is labor man-hours utilized (another
variance using number of employees was used), α and β are elasticity’s respectively for L and K
and A is role of technology.
Another variance of this function was also utilized
Y = ALαKβ (4)
Where Y is value added output i.e. gross output minus the intermediate goods and services utilized.
Rest all variables remaining similar.
These equations were transformed into the log equation so that regression would be run on
them. So the equation 3 and 4 become
Ln (Q) = Ln. A + α Ln. L + β Ln. K (5)
Ln (Y) = Ln. A + α Ln. L + β Ln. K (6)

Chapter 3- Research Methodology
42
Simple and multiple regressions were run on these equations in order to determine the
elasticity’s of both labor (L) and capital (K). As A is role of Technology so value of Ln. A was
transformed into numeric term by using exponential factor Ln A = -x = e-x = z
3.2.2 Stage II Developing Productivity Enhancement Model using Qualitative Research
3.2.2.1 Sampling Techniques and Understudy Participants
A mix of both face to face interviews and telephonic interviews were conducted from
CEO’s, Managing Directors, directors and general managers of automotive enterprises. These
enterprises included Pak Suzuki, Indus Motors, Honda Atlas, Millat Tractors, MEL, Al-Ghazi
Tractors, Ravi Autos, Super Asia, Infinity Engineering, Pakistan Springs and Engineering
Company, Master Motors and several other companies. Interviews conducted ranged from 15 to
30 minutes. Most of the respondents agreed to the interview on the condition of anonymity.
Already made question guide as given at annexure B was used. However, as per wish and will of
the respondents sequence of questions was changed for their ease and comfort. Theoretical
sampling was done on the basis of theoretical saturation phenomenon as suggested by Byman and
Bell [107], and a sample size of 40 was completed from 26 companies of automotive industry.
Multistage sampling was conducted making a combination of cluster sampling, stratified sampling,
random sampling and, on several occasions, snow ball sampling techniques. These combinations
were used in order to achieve maximum randomization and to avoid biased sampling.

Chapter 3- Research Methodology
43
3.2.2.2 Data Collection
Grounded theory strategy‡ was used for data collection and analyses, as suggested by
Strauss and Corbin [108]. For productivity survey of the industry, interviews§ were conducted
using open ended questions as per the precedence from the world recognized research carried out
in the past [4], [25], [28], [38], [92]. Considering the requirement of this research semi structured
interviews were conducted because similar research methodology has been used in the past in
different countries to solve similar kind of problems [4], [25], [28], [38], [63], [85], [92]. This
action research was done utilizing ethno methodology. Ethnography and participant observation
in combination with qualitative interviewing was conducted as suggested by Bryman and Bell
[107]. Triangulation methodology, as conceptualized by Webb et al. [109] was utilized to avoid
going native, as the researcher was performing as General Manager Productions in an organization
of the same industry which is the target population of this research. To ensure external reliability,
semi structured qualitative interviewing was conducted using an interview guide consisting of 11
items extracted from the published work, attached as Annex ‘B’ [4], [25], [28], [38], [92]. Results
obtained and concurrence of the researcher’s ideas confirmed the internal reliability and internal
validity of the research. External validity was limited only for similar type of organizations.
3.2.2.3 Data Analysis
Computer Aided Qualitative Data Analysis (CAQDAS)** were used for data analyses. Data
compiled in field notes and responses of the respondents were transcribed verbatim, entered into
‡ Grounded Theory is a qualitative research technique which was described and elaborated by Glaser and Strauss
(1967). There has been some criticism of this technique by some authors (Charmaz, 2003; Bringer, Johnston and
Brackenridge 2004) due to some quality issues but due to its diversity this technique has gained popularity and has
been the most extensively used qualitative analysis technique in the recent past (Hood 2007). § The importance of interviews to carry out a research has been deliberated upon a lot in past (Muchinsky, 2003; Davis
2004). Davis (2004) in his research carried out an extensive literature review of this aspect and pointed out the
differences of several authors about structured, semi structured and unstructured interviews. ** CAQDAS is perceived and accepted by experts as it can greatly enhance the data handling and data analysis
procedure (Bringer, Johnston, and Brackenridge, 2006a, 2006b; Bringer et al., 2004).

Chapter 3- Research Methodology
44
XL and then imported into NVIVO version10. Several audio and video proofs were also gathered
and entered because NVivo has the capability to handle and help in analyses of these kind of data.
Grounded theory strategy was use for data analyses as suggested by Corbin and Strauss [108].
Themes that emerged from the data were coded using tree nodes. Coding sequence of open coding,
axial coding and selective coding as suggested by Corbin and Strauss [108] was also done. On the
basis of constant comparison concepts and categories were extracted from the data. Ethnographic
content analysis (ECA) as suggested by Altheide [110] was conducted which resulted in
formulation of substantive theory. Formal theory could not be explored from this substantive
theory as the research was conducted in similar organizations. However, alternate methodology
was utilized for generation of formal theory; by comparing this substantive theory with existing
theory and comparable settings, as suggested by Bryman and Bell [107].
3.2.3 Stage III Implementation of the Proposed Framework
Developed framework was implemented in one of the major company of automotive
industry. The researcher was performing as GM Productions in one of the biggest Auto Parts
manufacturing plants in Pakistan. The status and position ensured that these management
techniques and manufacturing technologies were implemented in true letter and spirit. The
implementation of the framework required a complete cultural change; hence stage wise
implementation was adopted. This stage wise implementation ensured a gradual shift towards the
betterment and productivity enhancement. Detailed implementation methodology is explained in
chapter 7.
3.2.4 Stage IV- Validation of model by Quantitative Analysis
After implementation of the techniques as proposed in the framework, complete analysis
of the firm’s record was conducted. In this analysis the financial effects of the revenue difference

Chapter 3- Research Methodology
45
of year 2010, 2011 and 2012 was done. Production in numbers, reduction in manpower, reduction
in other inputs like electricity and material were also calculated. The detailed methodology and
results of this analysis are explained in chapter 8. Especially elaborated points of this report include
the results of energy audits, production graphs, human resource saving, development projects
successfully completed, KAIZEN’s achieved and revenue generation.
3.3 Reliability and Validity
3.3.1 Reliability
The reliability of the qualitative data was tested as per methodology given by Bryman and
Bell [107]. There are two types of reliability to be tested: internal reliability and external reliability.
As per Bryman and Bell [107] external reliability is the extent and degree to which a study or
research can be replicated and internal reliability is the matching of the ideas of research. To
ensure external reliability semi structured qualitative interviewing was conducted using an
interview guide consisting of 11 items extracted from the published work, attached as Annex ‘B’
[4], [25], [28], [38], [92]. Results obtained and concurrence of researcher’s ideas confirmed the
internal reliability of the study.
3.3.2 Validity
Validity also has to be tested for both external validity and internal validity [107]. For this
research, the convergence of the ideas conceived by the researcher in the start of research and the
end results of the study proved the internal validity of the research. For external validity, same
research has to be conducted in similar kind of organizational settings which was not done in this
study. Alternative methodology was used to prove the external validity and to generate the formal
theory; i.e. by comparing the substantive theory of this research with existing theory and
comparable settings, as suggested by Bryman and Bell [107]. For this, the results of this study
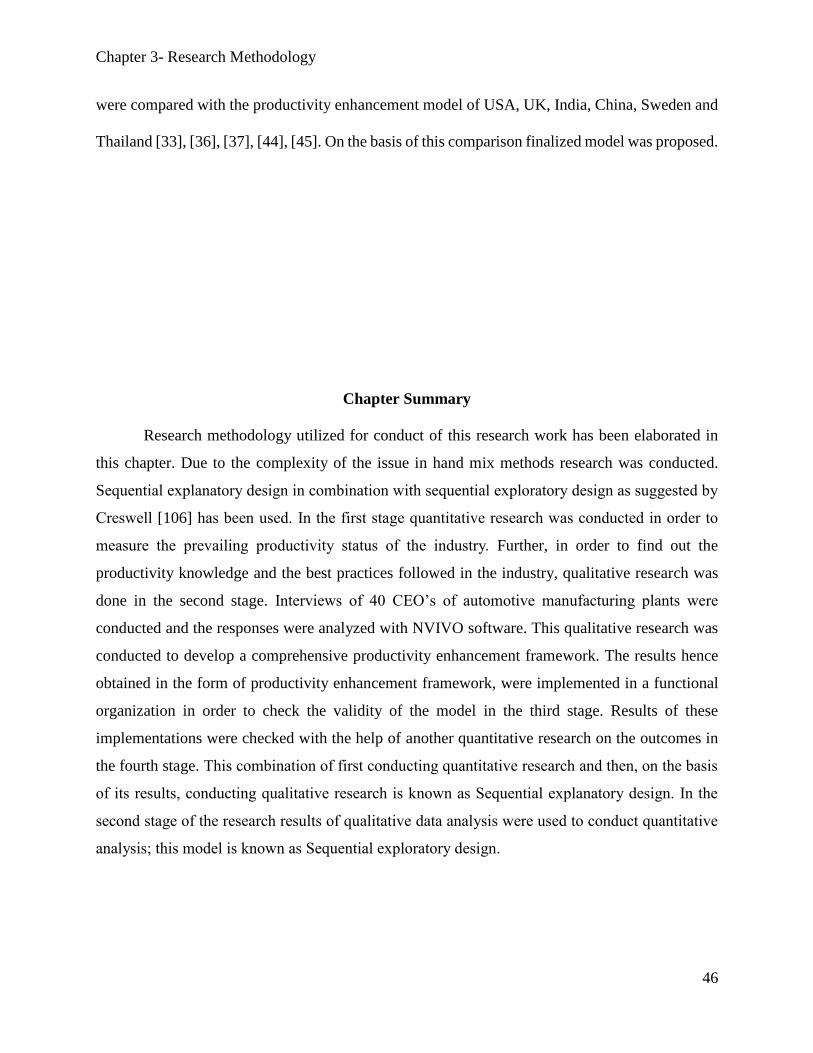
Chapter 3- Research Methodology
46
were compared with the productivity enhancement model of USA, UK, India, China, Sweden and
Thailand [33], [36], [37], [44], [45]. On the basis of this comparison finalized model was proposed.
Chapter Summary
Research methodology utilized for conduct of this research work has been elaborated in
this chapter. Due to the complexity of the issue in hand mix methods research was conducted.
Sequential explanatory design in combination with sequential exploratory design as suggested by
Creswell [106] has been used. In the first stage quantitative research was conducted in order to
measure the prevailing productivity status of the industry. Further, in order to find out the
productivity knowledge and the best practices followed in the industry, qualitative research was
done in the second stage. Interviews of 40 CEO’s of automotive manufacturing plants were
conducted and the responses were analyzed with NVIVO software. This qualitative research was
conducted to develop a comprehensive productivity enhancement framework. The results hence
obtained in the form of productivity enhancement framework, were implemented in a functional
organization in order to check the validity of the model in the third stage. Results of these
implementations were checked with the help of another quantitative research on the outcomes in
the fourth stage. This combination of first conducting quantitative research and then, on the basis
of its results, conducting qualitative research is known as Sequential explanatory design. In the
second stage of the research results of qualitative data analysis were used to conduct quantitative
analysis; this model is known as Sequential exploratory design.

Chapter 4- Results of Quantitative Analysis
47
CHAPTER 4
RESULTS OF QUANTITATIVE ANALYSIS: MEASURING
PRODUCTIVITY
4.1 Profit and Loss Statements Analysis
Trend line of the industry was an important factor in analyzing the productivity status of the
two automotive manufacturing firms under study. In order to understand their business status,
detailed analyses of these firms were done on their secondary data; i.e. financial statements. Firstly,
profit and loss statements of these firms were analyzed. Figure 4.1 shows the profit and loss (PLS)
status of both Indus Motors and Honda Atlas from FY 2000-2010. It shows that both firms were
at approximately similar profit levels in the base year 2000-2001. In FY 2001-2002 Honda Atlas
took the lead. But in FY 2002-2003 Indus Motors enhanced its profits by four times and since then
it continued to increase its profits. The profits declined only in FY 2007-2008 and FY 2008-2009
but it parallels the overall situation for the Industry (as per their financial statements). The poor
performance in these two years can be attributed to the overall political and economic instability
in the country. Indus Motors however, showed remarkable profits in FY 2009-2010. Honda Atlas
on the other hand could never catch up with Indus Motors since FY 2002-2003; rather it showed
reduced profits in 2004-2005 and a huge loss in FY 2006-2007. In FY 2007-2008 it recovered
from loss but again in 2008-2009, it showed a loss and especially in FY 2009-2010 it showed a
loss of 8.522 billion rupees – the biggest loss by any automotive manufacturing company in
Pakistan. The trend shown by Honda was totally different from the rest of the industry and
warranted further investigation and probing in order to identify the reasons for this phenomenon.

Chapter 4- Results of Quantitative Analysis
48
Figure 4.1 Profit and Loss Status of Indus Motors and Honda Atlas (Financial
Statement)
4.2 Production Capacity Vs Productions Output Analysis
Figure 4.2 shows the trend line for total production volume depicting a similar picture as has
been elaborated in the Profit and Loss graph. To further augment the findings, capacity verses
output graphs of both firms were plotted as shown in Figure 4.3. These graphs depict that Indus
Motors had been producing nearly at the optimum level of capacity since FY 2002-2003 except
for FY 2008-2009, which is in line with the trend of the industry. Honda Atlas on the other hand
was producing more than its capacity till FY 2005-2006. Honda shows its capacity on a single-
shift basis whereas Indus shows capacity on a double-shift basis. Again, these graphs showed that
something drastically went wrong in FY 2006-2007 and since then the performance of Honda Atlas
has been deteriorating. Another interesting point is that in FY 2006-2007 the production levels of
the company kept on decreasing but the capacity level was enhanced to a maximum level of 50,000
units. It is not understandable as to why capacity been enhanced for a manufacturing plant which
is going in loss and is not able to produce even 50 per cent of the previously available capacity?
2000-01
2001-02
2002-03
2003-04
2004-05
2005-06
2006-07
2007-08
2008-09
2009-10
Honda Profit 204471 431642 346135 408683 162179 705294 -264540 75010 -401833 -852200
Toyota Profit 203370 360463 1257614 1473242 1484646 2648464 2745701 2290845 1385102 2719850
-1500000-1000000
-5000000
50000010000001500000200000025000003000000
Rs.
in (
00
0)
Profit & Loss
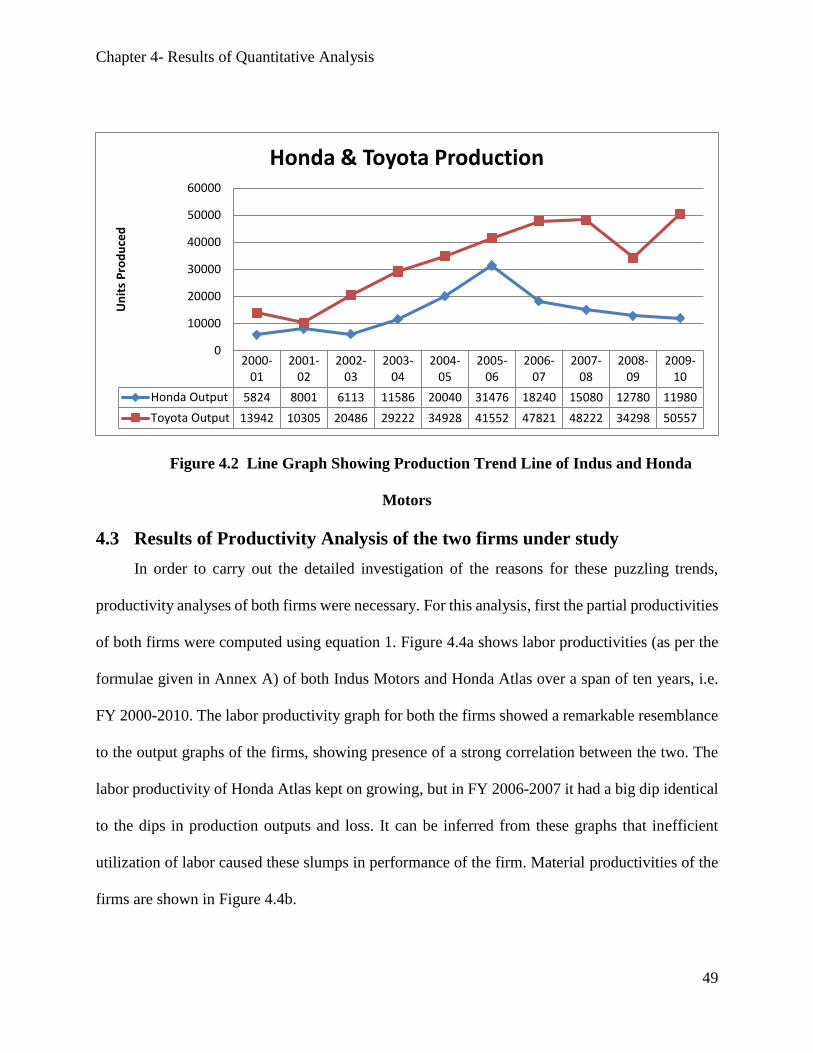
Chapter 4- Results of Quantitative Analysis
49
Figure 4.2 Line Graph Showing Production Trend Line of Indus and Honda
Motors
4.3 Results of Productivity Analysis of the two firms under study
In order to carry out the detailed investigation of the reasons for these puzzling trends,
productivity analyses of both firms were necessary. For this analysis, first the partial productivities
of both firms were computed using equation 1. Figure 4.4a shows labor productivities (as per the
formulae given in Annex A) of both Indus Motors and Honda Atlas over a span of ten years, i.e.
FY 2000-2010. The labor productivity graph for both the firms showed a remarkable resemblance
to the output graphs of the firms, showing presence of a strong correlation between the two. The
labor productivity of Honda Atlas kept on growing, but in FY 2006-2007 it had a big dip identical
to the dips in production outputs and loss. It can be inferred from these graphs that inefficient
utilization of labor caused these slumps in performance of the firm. Material productivities of the
firms are shown in Figure 4.4b.
2000-01
2001-02
2002-03
2003-04
2004-05
2005-06
2006-07
2007-08
2008-09
2009-10
Honda Output 5824 8001 6113 11586 20040 31476 18240 15080 12780 11980
Toyota Output 13942 10305 20486 29222 34928 41552 47821 48222 34298 50557
0
10000
20000
30000
40000
50000
60000
Un
its
Pro
du
ced
Honda & Toyota Production
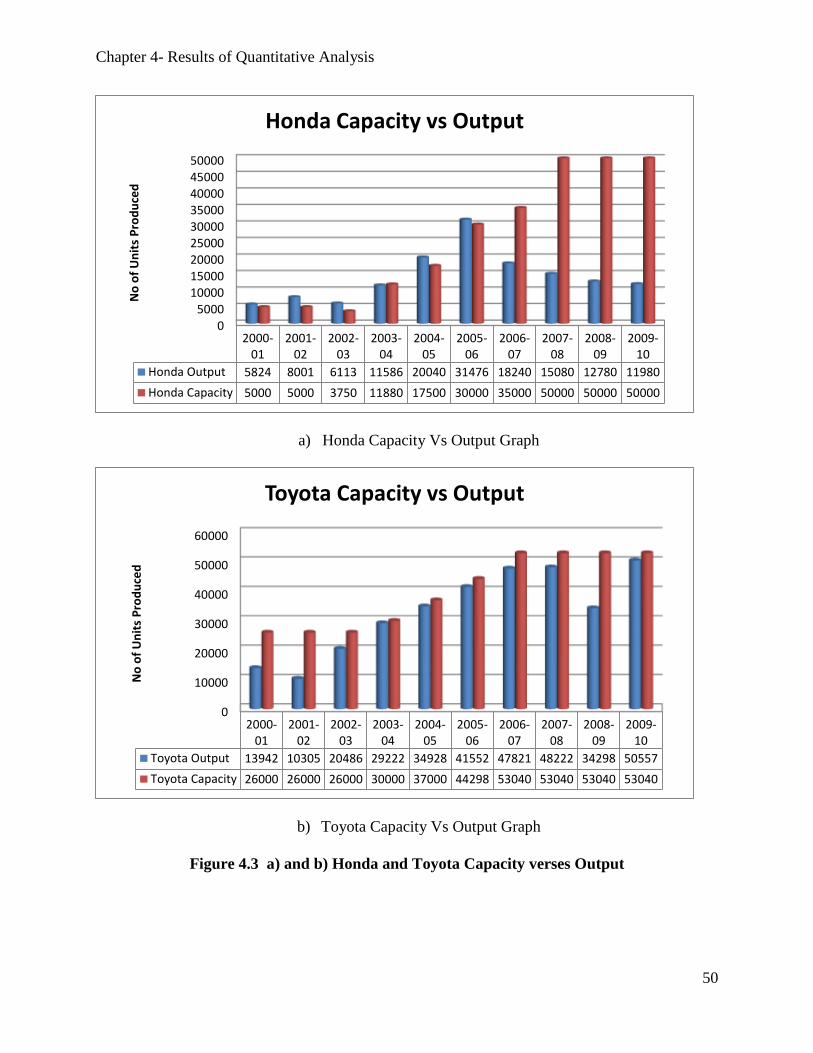
Chapter 4- Results of Quantitative Analysis
50
a) Honda Capacity Vs Output Graph
b) Toyota Capacity Vs Output Graph
Figure 4.3 a) and b) Honda and Toyota Capacity verses Output
05000
100001500020000250003000035000400004500050000
2000-01
2001-02
2002-03
2003-04
2004-05
2005-06
2006-07
2007-08
2008-09
2009-10
Honda Output 5824 8001 6113 11586 20040 31476 18240 15080 12780 11980
Honda Capacity 5000 5000 3750 11880 17500 30000 35000 50000 50000 50000
No
of
Un
its
Pro
du
ced
Honda Capacity vs Output
0
10000
20000
30000
40000
50000
60000
2000-01
2001-02
2002-03
2003-04
2004-05
2005-06
2006-07
2007-08
2008-09
2009-10
Toyota Output 13942 10305 20486 29222 34928 41552 47821 48222 34298 50557
Toyota Capacity 26000 26000 26000 30000 37000 44298 53040 53040 53040 53040
No
of
Un
its
Pro
du
ced
Toyota Capacity vs Output

Chapter 4- Results of Quantitative Analysis
51
This graph depicts that material productivity of both the firms kept on growing with a minor drop.
So it can be inferred that no problem of inefficient utilization of materials prevailed in both the
firms. However, the graph also portrays that Indus Motors had a big jump in FY 2009-2010 in
material productivity, which shows its better and more efficient utilization of materials in this
financial year. This can be a big contributor to the enlarged outputs and profits of Indus Motors in
the same fiscal year. Capital productivity graphs of both firms are shown in Figure 4.4c. This graph
explains the most logical and relevant reason for the poor performance of Honda Atlas since FY
2006-2007 and onwards. Poor capital utilization seen here looks like the prime cause for the drop
in profits and outputs of the firm from this year onwards. The huge capital invested in 2006 should
have given more profits but instead its poor utilization resulted in very low capital productivity.
The huge losses shown by the firm most probably were the result of this aspect which needed to
be explored. Total operational productivities and total productivity indices of the firms were also
computed over a similar span of ten years. Figure 4.5 shows total productivities of Honda Atlas
and Indus Motors (Toyota). Figure 4.6 shows total productivities indices of the firms. Comparison
of the two firms gave similar results as in previous graphs i.e. a sudden drop in productivity of
Honda Atlas from FY 2006-07 and onwards. However, another important aspect to be analyzed
here is that productivity analyses of firms in different countries have shown that automotive firms
grow from low to high productivity levels of even 5 and above over a span of five to six years.
However, in Pakistan even flourishing firms like Indus Motors had shown an increase of
productivity from 0.97 to a maximum of 1.88 over a span of ten years, which is very low as
compared to other developing countries. In order to confirm existence of a relationship between
profits of the firm, output produced, total productivity, partial productivities Person’s product
moment correlations were run in SPSS.

Chapter 4- Results of Quantitative Analysis
52
a) Comparison of Labor Productivities of Honda and Toyota
b) Comparison of Material Productivities of Honda and Toyota
c) Comparison of Capital Productivities of Honda and Toyota
Figure 4.4 a), b) and c) Comparison of Partial Productivities of Honda and
Toyota
0.0020.0040.0060.0080.00
100.00120.00140.00160.00180.00
2000-01
2001-02
2002-03
2003-04
2004-05
2005-06
2006-07
2007-08
2008-09
2009-10
Honda labor Productivity 61.64 71.22 62.82 81.77 118.45130.93 61.27 66.60 60.82 68.31
Toyota Labor Productivity 72.15 55.36 95.77 121.78125.26120.00132.24118.63 94.88 167.40
Pro
du
ctiv
ity
Honda & Toyota Labor Productivity
0.001.002.003.00
Pro
du
ctiv
ity
Years
Honda & Toyota Material Productivity
Honda Material Productivity
Toyota Material Productivity
2000-01
2001-02
2002-03
2003-04
2004-05
2005-06
2006-07
2007-08
2008-09
2009-10
Honda Capital Productivity 11.95 18.69 14.07 21.29 33.84 16.03 5.49 5.40 4.07 5.52
Toyota Capital Productivity 8.27 7.12 17.02 29.46 32.47 24.76 24.72 13.97 12.46 21.03
0.0010.0020.0030.0040.00
Pro
du
ctiv
ity
Honda & Toyota Capital Productivity

Chapter 4- Results of Quantitative Analysis
53
Results are presented in Table 4.1. In the first matrix, results are presented for Honda Atlas
whereas in the second matrix results are presented for Indus Motors (Toyota). For Honda Atlas
profits of the firm were moderately correlated (γ = 0.49 to 0.61) to all partial productivities and
total productivity of the firm with statistically significant results (p > 0.05 and p> 0.1). Total
productivity was found to be strongly correlated (γ 0.781; p > 0.01) with capital productivity and
strongly correlated (γ 0.813; p > 0.01) with labor productivity at statistically significant results.
Labor productivity was found to be strongly correlated (γ 0.80; p > 0.01) with output and
moderately correlated (γ 0.5; p > 0.1) with number of employees. Employees’ number was found
to be strongly correlated (γ 0.887; p > 0.01) with output of the firm. For Indus motors, profits of
Figure 4.5 Total Productivities of Honda Atlas and Indus Motors
Figure 4.6 Total Productivities Indices of Honda Atlas and Indus Motors
0.000.501.001.502.00
2000-01
2001-02
2002-03
2003-04
2004-05
2005-06
2006-07
2007-08
2008-09
2009-10
Honda Productivity Index 1.00 1.05 1.05 1.09 1.13 1.14 0.96 1.01 0.91 1.04
Toyota Productivity Index 1.00 0.97 1.08 1.15 1.21 1.25 1.45 1.43 1.25 1.81
Pro
du
ctiv
ity
Ind
ex
Honda Toyota Productivity Index

Chapter 4- Results of Quantitative Analysis
54
the firm were moderately (γ = 0.549) to strongly (γ =0.8561) correlated with partial productivities
of the firm with statistically significant results (p > 0.01 to p > 0.1). Profits were found to be
strongly correlated (γ 0.80; p > 0.01) with total productivity. Total productivity was found to be
strongly correlated (γ 0.983; p > 0.01) with material productivity and strongly correlated (γ 0.891;
p > 0.01) with labor productivity at statistically significant results. Labor productivity was found
to be strongly correlated (γ 0.879; p > 0.01) with output and strongly correlated (γ 0.744; p > 0.1)
with number of employees. Employees’ number was found to be strongly correlated (γ 0.946; p >
0.01) with output of the firm. Outputs of the firm were found out to be strongly correlated (γ 0.899;
p > 0.01) with total productivity of the firm.
4.4 Measuring Productivity with Cobb-Douglas Production Function
To further investigate the problems of low productivity especially in Honda Atlas, regression
tests were run in SPSS. For regression tests Cobb-Douglas production function duly transformed
in log equations were computed as per equation 5 and 6. Descriptive statistics are presented in
Table 4.2. Results of regression tests in the form of nonstandardized coefficients are shown in
Table 4.3. Non standardized coefficients of the regression tests showed significant values (β = -
7.26036, p < 0.05), for Ln man hours (β = 1.707, p < 0.01) and marginally accepted significant
values for Ln Capital (β = -.137, p < 0.1). The relationship showed a high value of R (0.979) and
high lower variance (R² = .958; p < 0.01). Adjusted R² showed a value of 0.946.
The regression equation of log function and Cobb- Douglas production function for value
added computed for Honda Atlas are
Ln. (Y) = -7.263 -0.137 Ln. (K) + 1.707 Ln. (L)
A = e.-7.263 = 0.0007
TFP(Y) = 0.0007L1.71K-0.13

Chapter 4- Results of Quantitative Analysis
55
TABLE 4.1 Correlation Values
a) Toyota Correlations
Toyota Profit
Toyota L Productivity
Toyota K Productivity
Toyota M Productivity
Toyota TPM
Toyota Employees
Toyota Output
Toyota Profit
Toyota L Productivity
.865**
Toyota K Productivity
0.549 .703*
Toyota M Productivity
.780** .800** 0.174
Toyota TPM
.849** .891** 0.344 .983**
Toyota Employees
.860** .744** 0.353 .794** .836**
Toyota Output
.949** .879** 0.5 .839** .899** .946**
**. Correlation is significant at the 0.01 level (1-tailed).
*. Correlation is significant at the 0.05 level (1-tailed).
b) Honda Correlations
Honda Profit
Honda L Productivity
Honda K Productivity
Honda M Productivity
Honda TPM
Honda Employees
Honda Output
Honda Profit
0.494 Honda L Productivity
.571* .669* Honda K Productivity
-.705* -0.249 -.676* Honda M Productivity
.610* .813** .781** -0.351 Honda TPM
-0.214 0.537 -0.084 0.432 0.074 Honda Employees
0.199 .800** 0.169 0.125 0.415 .887** Honda Output
*. Correlation is significant at the 0.05 level (1-tailed).
**. Correlation is significant at the 0.01 level (1-tailed).

Chapter 4- Results of Quantitative Analysis
56
The regression equation of log function and Cobb-Douglas production function for gross
output computed for Honda Atlas are
Ln. (Q) = -3.331 -0.234 Ln. (K) + 1.606 Ln. (L)
A = e.-3.331 = 0.036
TFP (Q) = 0.036L1.606K-0.234
For both methods very low values of role of technology (0.036 and 0.0007) were attained,
showing a lot of room of improvement for induction of technology. Low and negative elasticity’s
for capital K showed over injection of capital. Whereas increasing returns to scale resulted as a
whole, giving values of (1.606 and 1.707) for labor, depicted high volumes of returns by marginal
increment of labor.
Table 4.2 Descriptive Statistics
Mean Std.
deviation
n
Ln value added
output
15.0658 0.59355 10
Ln man hours 14.1842 0.38529 10
Ln capital 13.7191 0.89002 10
Table 4.3 Unstandardized Coefficients of Regression
Model Unstandardized coefficients
B Std. error
(Constant) -7.263 1.805
Ln Man hours 1.707 0.164
Ln Capital -0.137 0.071
Notes: Dependent variable: Ln value added output

Chapter 4- Results of Quantitative Analysis
57
Chapter Summary
In order to determine the prevalent productivity status of Pakistan automotive industry,
productivity status of two major automotive manufacturers were calculated, Indus Motors
(principle is Toyota Motors) and Honda Atlas (principle is Honda Motors). Major reason for
selecting these two companies out of total 3 companies in Pakistan, was the fact that only these
two companies compete in nearly same nature of cars i.e. 1300cc to 1800 cc cars. A detailed
productivity analysis of these companies was carried out over a span of 10 years’ time i.e. 2000 to
2010. As per financial statements of these companies Honda Atlas showed huge losses from 2006
to 2010. Indus Motors showed better results. Computing all partial productivities and total
productivity using formulae as proposed by Sumanth [4], showed that poor capital productivity
was the main issue with Honda Atlas. Cobb- Douglas production function also showed the
opportunity of investing more in labor rather than capital, especially for Honda Atlas.

Chapter 5- Results of Qualitative Analysis
58
CHAPTER 5
RESULTS OF QUALITATIVE ANALYSIS
Lack of research culture in Pakistan and especially in the automotive industry was the
biggest barrier in the way of conducting this research. Automotive industry is technologically
based, and absence of knowledge sharing methodology in these organizations was a huge
hindrance. However, since the researcher himself had been serving in the same industry for the
last 17 years, he was able to convince these respondents for interviews by virtue of personal
contacts and daily meetings with these individuals. Thus, being a participant observer of this
industry a lot of information was gathered very easily. However, in order to avoid getting native,
triangulation methodology was adopted for data analysis, as conceptualized by Webb et al. [109].
In this methodology two different researchers or two different methods for data analyses are used.
Interviews ranging from 15 minutes to half an hour were written, taped and videotaped
(wherever allowed by the respondents). The responses of the survey were gathered and entered
into XL Sheets. This XL sheet data was then imported into NVivo version 10. Imported file was
placed in internal folders. Columns which were to be coded were entered as code-able data and the
rest were entered as categorical data. After complete analysis of the emerging themes, a total of
326 nodes were made with a total of 2440 references.
5.1 Demographic Details
Classifications of the respondents were made for categorical analysis. Out of 40 respondents,
15 were CEOs, 5 were Directors, 2 were COOs, 15 were General Managers and two were DGMs
as shown in Figure 5.1. Thereafter, comparison chart of two variables were made showing the
designation and qualifications of the respondents. Graph is shown in Figure 5.2. It shows that a
majority of CEOs are under metric (specifically from vendor industry), one is F.Sc.,
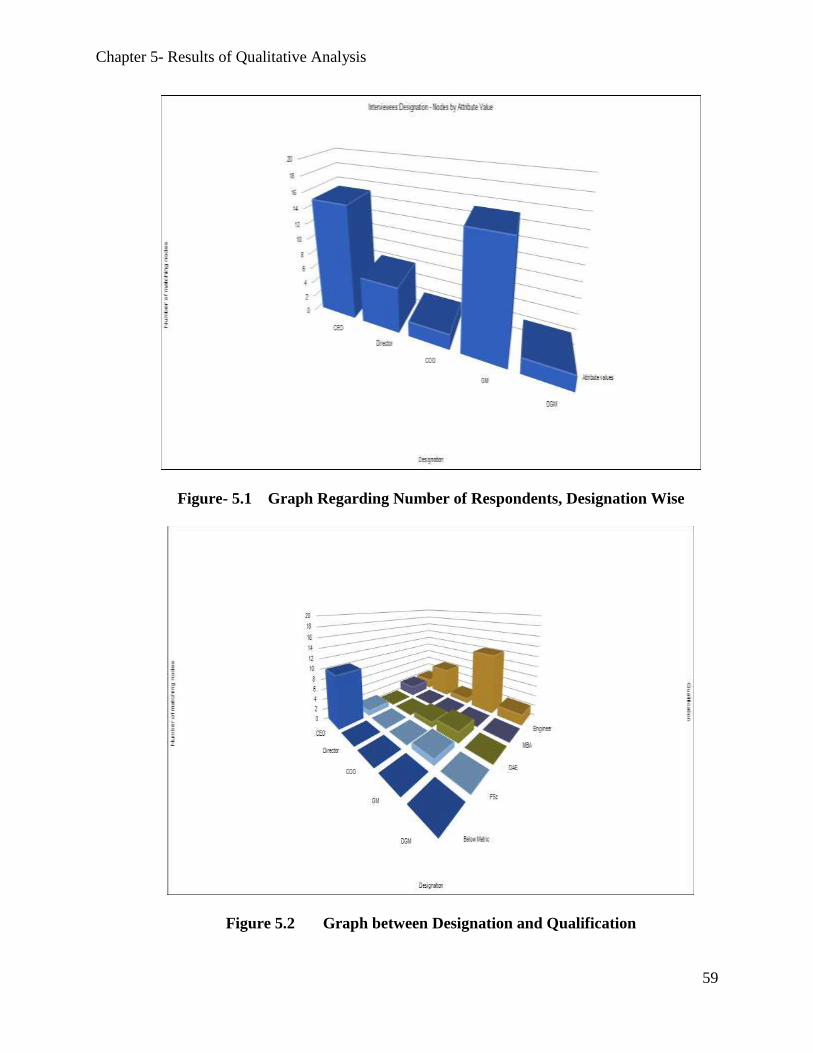
Chapter 5- Results of Qualitative Analysis
59
Figure- 5.1 Graph Regarding Number of Respondents, Designation Wise
Figure 5.2 Graph between Designation and Qualification
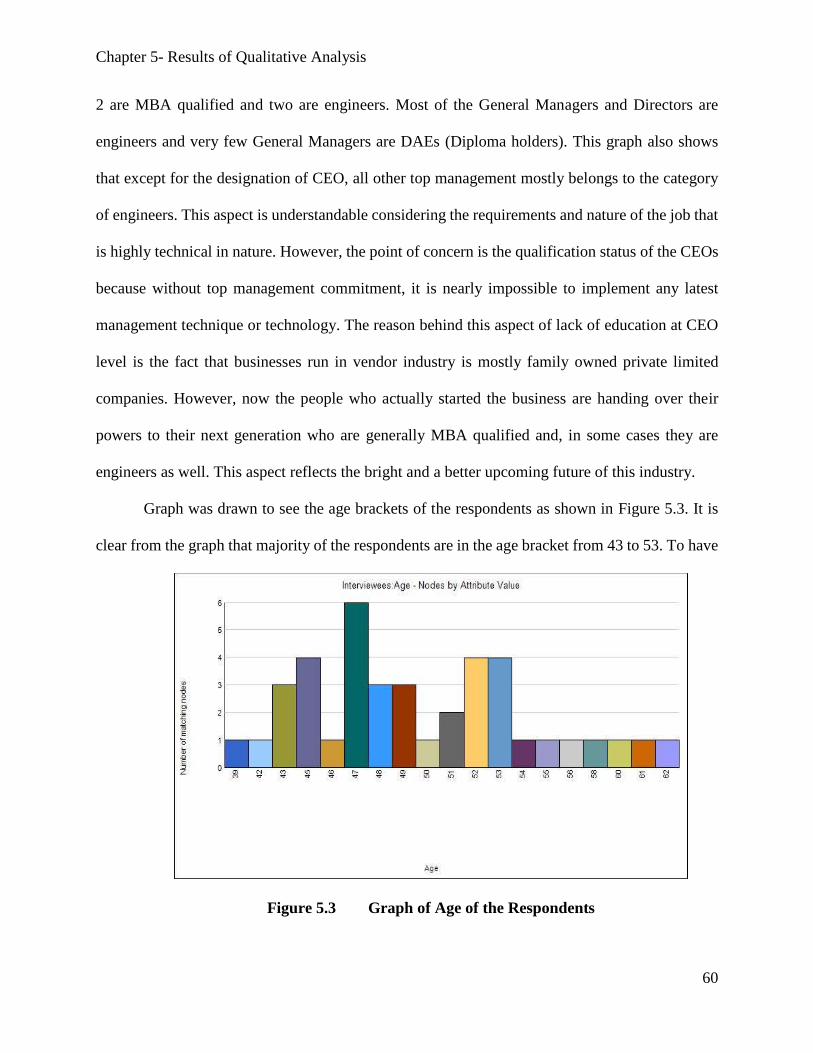
Chapter 5- Results of Qualitative Analysis
60
2 are MBA qualified and two are engineers. Most of the General Managers and Directors are
engineers and very few General Managers are DAEs (Diploma holders). This graph also shows
that except for the designation of CEO, all other top management mostly belongs to the category
of engineers. This aspect is understandable considering the requirements and nature of the job that
is highly technical in nature. However, the point of concern is the qualification status of the CEOs
because without top management commitment, it is nearly impossible to implement any latest
management technique or technology. The reason behind this aspect of lack of education at CEO
level is the fact that businesses run in vendor industry is mostly family owned private limited
companies. However, now the people who actually started the business are handing over their
powers to their next generation who are generally MBA qualified and, in some cases they are
engineers as well. This aspect reflects the bright and a better upcoming future of this industry.
Graph was drawn to see the age brackets of the respondents as shown in Figure 5.3. It is
clear from the graph that majority of the respondents are in the age bracket from 43 to 53. To have
Figure 5.3 Graph of Age of the Respondents

Chapter 5- Results of Qualitative Analysis
61
a further in- depth analysis, another graph between two demographics was drawn i.e. age and
designation as shown in Figure 5.4. According to this graph majority of the CEOs’ are in the age
bracket of 48 to 53, majority of the GMs’ are in the age bracket of 47 to 49 years, while the
youngest GM is 39 years old. The youngest CEO is of 43 years of age, whereas the oldest are in
the age bracket of 60 to 62 years.
5.2 State of Productivity Knowledge
As per the interview guide, the first question asked from the respondents was regarding the
definition, meaning and interpretation of the word productivity. Most of the respondents were not
sure about the actual meaning of the word productivity. While discussing productivity, they were
actually talking about production or quality. The responses of all the respondents were gathered in
an excel sheet and are represented in Table 5.1. Once the responses were analyzed against the
actual sense and meaning of this terminology as explained by International Organization for
Productivity Management, it was found that 92.5% of the
Figure 5.4 Graph between Designation and Age

Chapter 5- Results of Qualitative Analysis
62
respondents were unaware of the true meaning of this terminology. Apart from the meaning of this
terminology, the respondents were not clear about the actual sense and need of this important
aspect. These results are in line with the research conducted even in the developed nations like
USA, Australia and Europe, as discussed and proved by Sumanth [4]. The results were entered as
a separate variable with two choices, ‘yes’ for the right interpretation and ‘no’ for wrong
interpretation. The pie chart shown in Figure 5.5 depicts the statistics.
In the second question, the following information was asked
“Do you have any productivity measurement, evaluation, planning and an improvement
department in your organization?”
Figure 5.5 Responses about Terminology “Productivity”, Yes for Correct and No
for Wrong Meanings

Chapter 5- Results of Qualitative Analysis
63
Table 5.1 Responses about Productivity Terminology with Demographics
Respondent ID Qualification Designation Age Q 1: How you define productivity?
PD001 Mechanical Engineer
GM Inventory
54 Productivity means more production.
PD002 FSc CEO 48 Output/input
PD003 Mechanical Engineer DGM 43 More production
PD004 Below Metric CEO 48 Production with minimum rejection
PD005 Mechanical Engineer Director 45 Output/Input,
PD006
Mechanical Engineer GM 47 It is combination of wastages reduction, cycle time and continuous optimization
PD007 Mechanical Engineer GM 56 Productivity means production per cycle time.
PD008 Below Metric CEO 53 Output/Input
PD009
FSC GM 49 Not very important, safety and quality are more
important
PD0010
Mechanical Engineer Director 52 Stock per hour SPH
PD0011 Engineer DGM 45 Output/Input
PD0012 Below Metric CEO 52 Output planned and done
PD0013
Mechanical Engineer
MSC Manufacturing GM 49
Man hour per Vehicle (HPV), less HPV means more
efficiency
PD0014 Mechanical Engineer MSC Engg. Mgmt.
GM 48 HPV i.e. man hour per vehicle
PD0015 Below Metric CEO 51 Not required with quality improvement is made
PD0016 Mechanical Engineer Director 61 It is a cultural issue
PD0017 Below Metric
CEO 52 More output/ Same input (Resources)
PD0018
Mechanical Engineer GM 52 More production for same resources and manpower
PD0019
Below Metric CEO 47 Efficiency
PD0020 MBA CEO 53
Ratio of out to input in the sense input is the sources
available i.e. man, machine, layout, system, produces and output is their best utilization
PD0021 DAE
GM
Productions 42 Improvement in production
PD0022
Below Metric CEO 62 More production
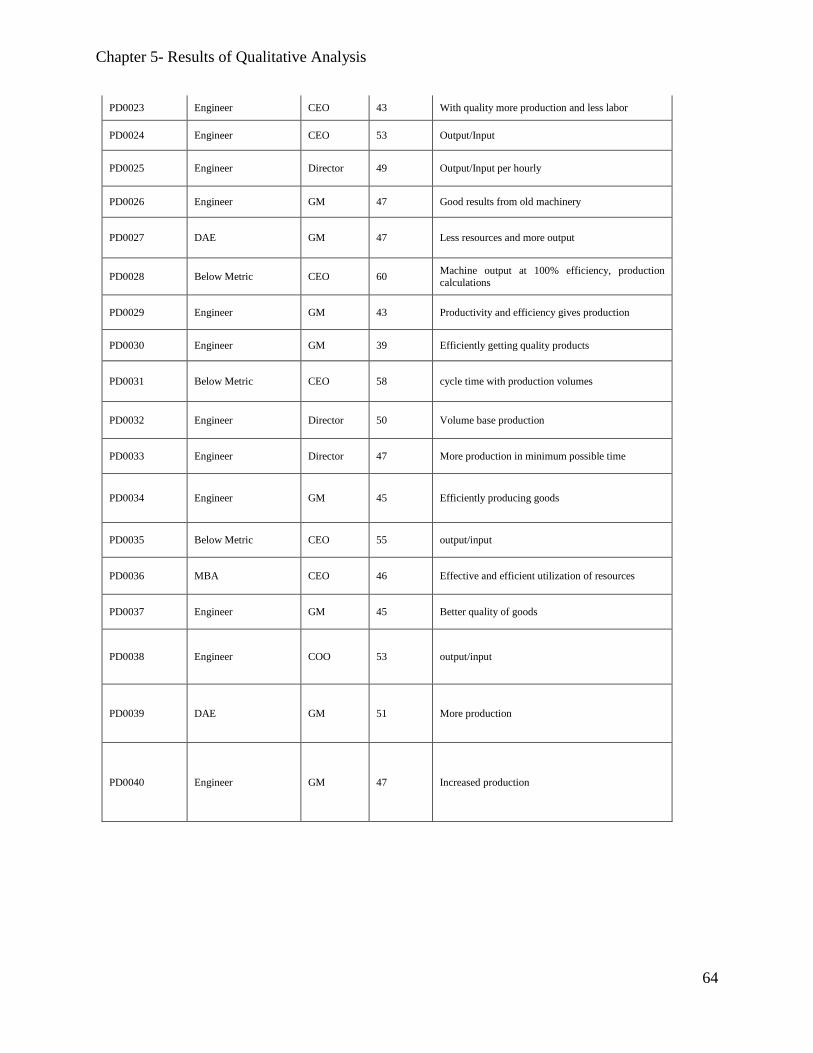
Chapter 5- Results of Qualitative Analysis
64
PD0023 Engineer CEO 43 With quality more production and less labor
PD0024 Engineer CEO 53 Output/Input
PD0025 Engineer Director 49 Output/Input per hourly
PD0026 Engineer GM 47 Good results from old machinery
PD0027 DAE GM 47 Less resources and more output
PD0028 Below Metric CEO 60 Machine output at 100% efficiency, production calculations
PD0029 Engineer GM 43 Productivity and efficiency gives production
PD0030 Engineer GM 39 Efficiently getting quality products
PD0031 Below Metric CEO 58 cycle time with production volumes
PD0032 Engineer Director 50 Volume base production
PD0033 Engineer Director 47 More production in minimum possible time
PD0034 Engineer GM 45 Efficiently producing goods
PD0035 Below Metric CEO 55 output/input
PD0036 MBA CEO 46 Effective and efficient utilization of resources
PD0037 Engineer GM 45 Better quality of goods
PD0038 Engineer COO 53 output/input
PD0039 DAE GM 51 More production
PD0040 Engineer GM 47 Increased production
Chapter 5- Results of Qualitative Analysis
65
Responses regarding this aspect were not required to be drawn on any graph because 100%
respondents replied with “NO”. There is not a single organization in Pakistan automotive industry
which has a complete system of productivity measurement, evaluation, planning and improvement
department, as per the research and knowledge of the researcher. In very few organizations,
maximum evidences found were existence of either some measurement or productivity
enhancement practices under a department.
When the respondents were asked if their organization has hired any individuals for
productivity enhancement related jobs, similar results were found and 100% ‘No’ was received to
this aspect. However, some respondents gave very alarming answers for example; one of the
General Managers, who is an engineer, was of the opinion that “Quality department do the job of
productivity enhancement”. Another respondent who is Director of a company said “productivity
enhancement is the job of quality department”.
One senior official of a large car manufacturing company in Pakistan, who is an engineer,
responded that productivity is looked after by PPC department in their organization. One GM
responded that KAIZEN is for everyone. All these responses indicate ignorance of the top
management of Pakistan automotive industry regarding ‘productivity’ which is one of the most
important aspects of industry. If top management is not so sure, then we can well imagine how
well the complete workforce of these organizations would be as far as productivity enhancement
is concerned. These results depict the actual picture and reasons for the present state of productivity
of Pakistan automotive industry, as measured and shown in chapter 3.
As for question No. 4 from the interview guide, the question asked from the respondents
was:-
“How productivity is measured in your organization?”
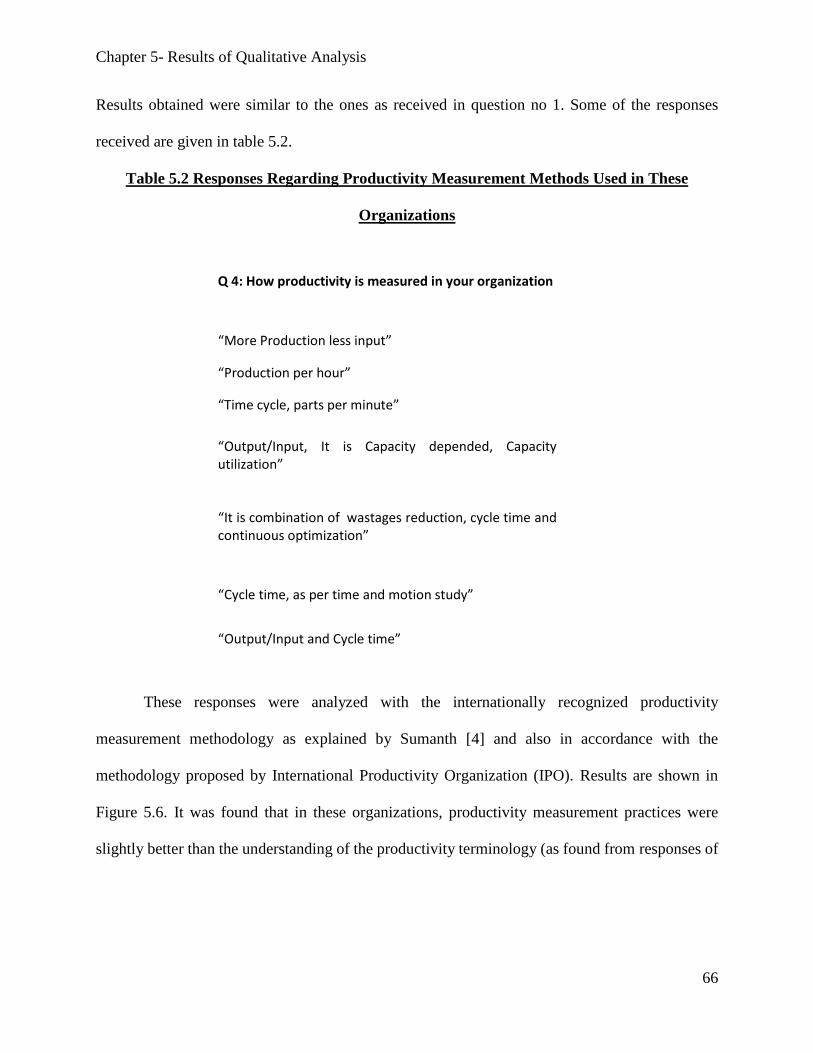
Chapter 5- Results of Qualitative Analysis
66
Results obtained were similar to the ones as received in question no 1. Some of the responses
received are given in table 5.2.
Table 5.2 Responses Regarding Productivity Measurement Methods Used in These
Organizations
Q 4: How productivity is measured in your organization
“More Production less input”
“Production per hour”
“Time cycle, parts per minute”
“Output/Input, It is Capacity depended, Capacity utilization”
“It is combination of wastages reduction, cycle time and continuous optimization”
“Cycle time, as per time and motion study”
“Output/Input and Cycle time”
These responses were analyzed with the internationally recognized productivity
measurement methodology as explained by Sumanth [4] and also in accordance with the
methodology proposed by International Productivity Organization (IPO). Results are shown in
Figure 5.6. It was found that in these organizations, productivity measurement practices were
slightly better than the understanding of the productivity terminology (as found from responses of
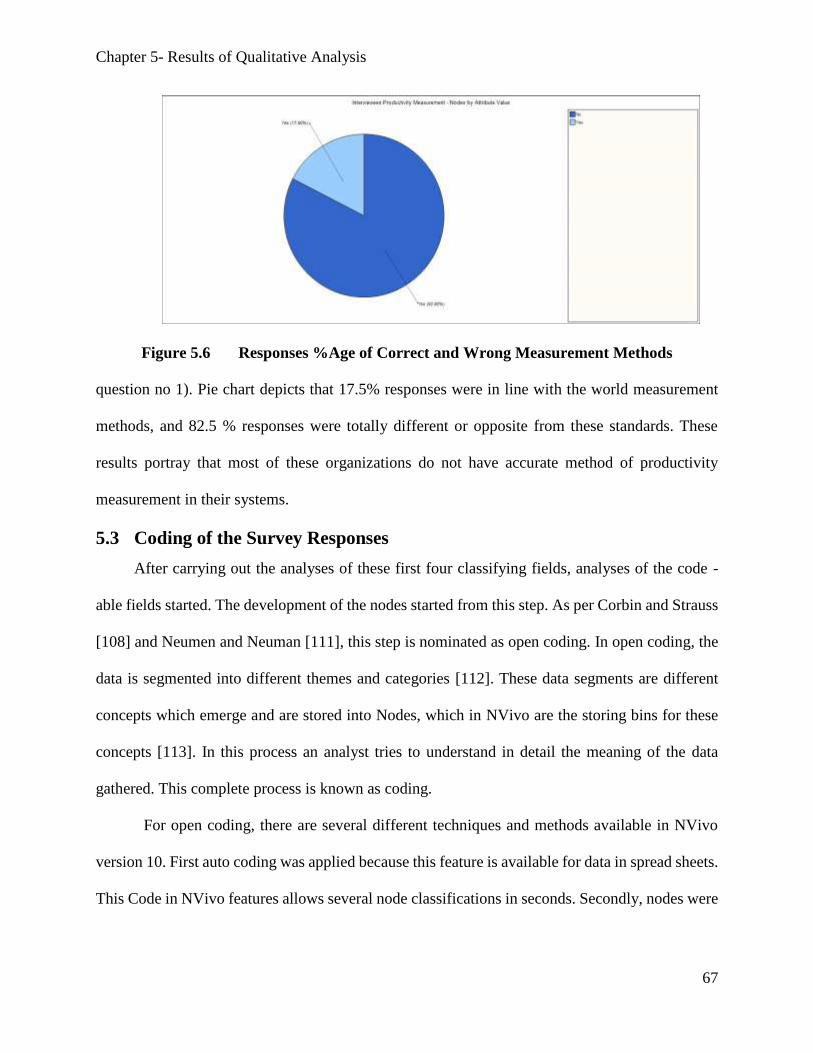
Chapter 5- Results of Qualitative Analysis
67
Figure 5.6 Responses %Age of Correct and Wrong Measurement Methods
question no 1). Pie chart depicts that 17.5% responses were in line with the world measurement
methods, and 82.5 % responses were totally different or opposite from these standards. These
results portray that most of these organizations do not have accurate method of productivity
measurement in their systems.
5.3 Coding of the Survey Responses
After carrying out the analyses of these first four classifying fields, analyses of the code -
able fields started. The development of the nodes started from this step. As per Corbin and Strauss
[108] and Neumen and Neuman [111], this step is nominated as open coding. In open coding, the
data is segmented into different themes and categories [112]. These data segments are different
concepts which emerge and are stored into Nodes, which in NVivo are the storing bins for these
concepts [113]. In this process an analyst tries to understand in detail the meaning of the data
gathered. This complete process is known as coding.
For open coding, there are several different techniques and methods available in NVivo
version 10. First auto coding was applied because this feature is available for data in spread sheets.
This Code in NVivo features allows several node classifications in seconds. Secondly, nodes were

Chapter 5- Results of Qualitative Analysis
68
made as per number of respondents. Forty nodes were built as there were forty respondents.
Another set of nodes was built as per number of questions asked i.e. 11.
Then coding of the data was done for all code-able columns. All the responses for one
particular question were chosen and all possible nodes were made. Methodology of tree nodes was
adopted to converge the emerging themes into hypothesis and ultimately, into theories. For
analysis of the data, several different options and tests available in this software were utilized. The
option of making new nodes and coding the theme on existing nodes are the options which let the
analyzer subsequently to do open coding with some stages of axial coding simultaneously. Using
the constant comparison methodology, as suggested by Glayser and Strauss [114], allows a
researcher to code or un-code the themes under different nodes as deemed appropriate, which
resulted in refinement of analysis. In order to carry out most accurate coding, the two query
commands TSQ “text search query” and WFQ “word frequency query” were used. With the help
of these two commands, one can very easily explore the data set and can start making nodes
swiftly. Once text query is run e.g. for a word “wastage”, the analysis shows where and in which
context this word has been used, how many times it is used and who used it. Summary of the same
can also be seen in the results. The most effective advantage of this query is the results in the form
of WORD TREE. The results are shown as in Figure 5.7 and 5.8, in which the complete linkages
of the word with said sentences are shown in the form of word trees. These results helped in
understanding the complete context in which the word was used.
To further explore the data word frequency query was run. This analysis tool gives four
types of results. As a sample, results of these tests run on Question 8 are shown on these pages. In
this question, respondents were asked about the difficulties they faced in implementation of latest
productivity enhancement techniques. In the results, word frequency query test gave a complete
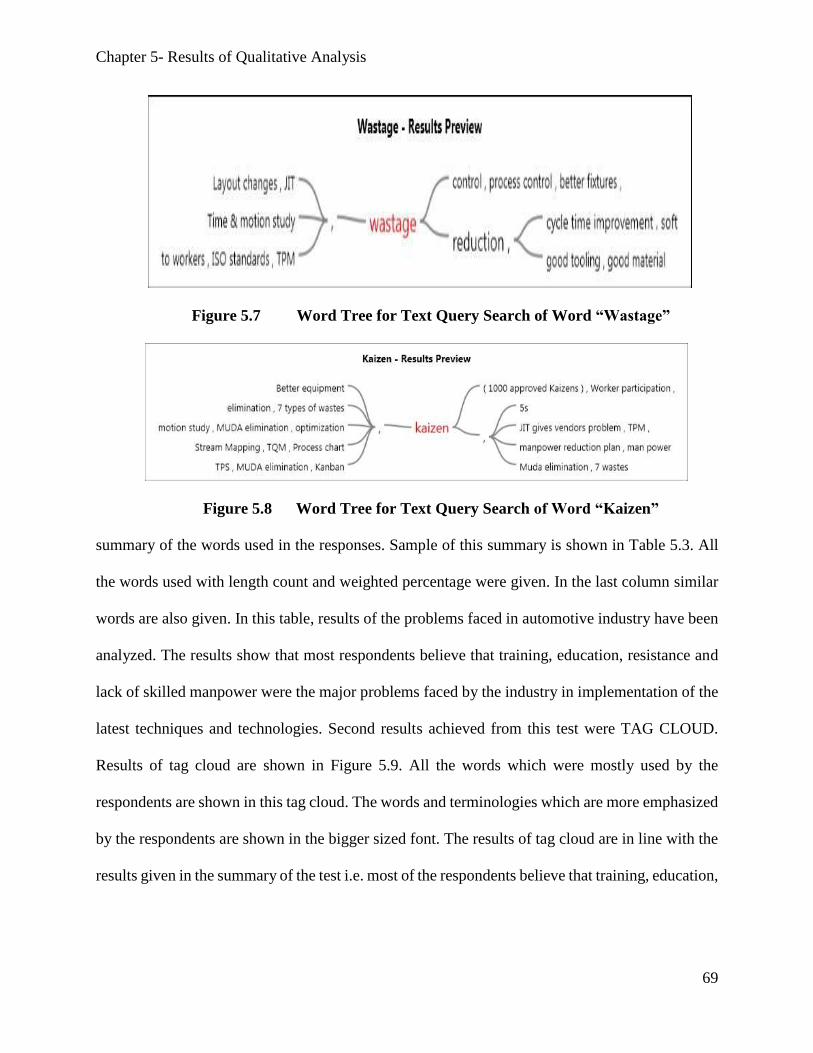
Chapter 5- Results of Qualitative Analysis
69
Figure 5.7 Word Tree for Text Query Search of Word “Wastage”
Figure 5.8 Word Tree for Text Query Search of Word “Kaizen”
summary of the words used in the responses. Sample of this summary is shown in Table 5.3. All
the words used with length count and weighted percentage were given. In the last column similar
words are also given. In this table, results of the problems faced in automotive industry have been
analyzed. The results show that most respondents believe that training, education, resistance and
lack of skilled manpower were the major problems faced by the industry in implementation of the
latest techniques and technologies. Second results achieved from this test were TAG CLOUD.
Results of tag cloud are shown in Figure 5.9. All the words which were mostly used by the
respondents are shown in this tag cloud. The words and terminologies which are more emphasized
by the respondents are shown in the bigger sized font. The results of tag cloud are in line with the
results given in the summary of the test i.e. most of the respondents believe that training, education,

Chapter 5- Results of Qualitative Analysis
70
resistance and lack of skilled manpower are the major problems faced by the industry in
implementation of the latest techniques and technologies.
Table 5.3. Summary of All the Words Used With Count and Weighted Percentages
Word Length Count Weighted Percentage (%)
Similar Words
Training 8 153 10.52 trained, training
Education 9 114 7.84 educated, education
Less 4 95 6.53 less
Resistance 10 88 6.05 resistance
Problem 7 56 3.85 problem, problems
Skilled 7 54 3.71 skilled, skillful
Change 6 45 3.09 change
People 6 42 2.89 people, peoples
Workers 7 36 2.47 worker, workers
Required 8 33 2.27 required
Manpower 8 26 1.79 manpower
Implementation 14 25 1.72 implementation
Cultural 8 24 1.65 cultural, culture
Staff 5 22 1.51 staff
JIT 3 18 1.24 JIT
Low 3 18 1.24 low
Persons 7 18 1.24 person, persons
Level 5 17 1.17 level, levels
Vendors 7 17 1.17 vendor, vendors
Proper 6 15 1.03 proper, properly
Inventory 9 14 0.96 inventory
One 3 14 0.96 one
Advanced 8 12 0.82 advanced
Due 3 12 0.82 due
ERP 3 12 0.82 ERP
Hiring 6 12 0.82 hiring
System 6 12 0.82 system, systems
Techniques 10 12 0.82 techniques
Lack 4 9 0.62 lack
Pakistan 8 9 0.62 Pakistan
Possible 8 9 0.62 possible
Mind 4 8 0.55 mind
Set 3 8 0.55 set
Sigma 5 8 0.55 sigma
Six 3 8 0.55 six
Stock 5 8 0.55 stock
Constraints 11 7 0.48 constraint
Available 9 6 0.41 available
Biggest 7 6 0.41 biggest
Build 5 6 0.41 build
Centers 7 6 0.41 centers
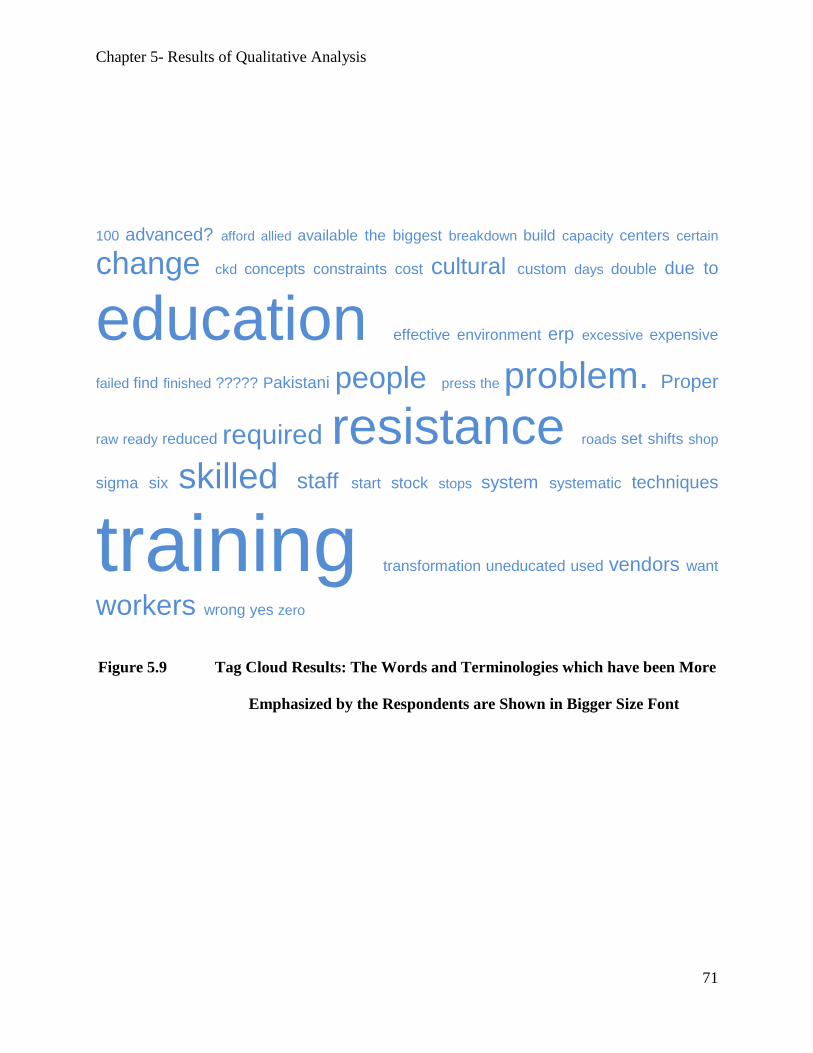
Chapter 5- Results of Qualitative Analysis
71
100 advanced? afford allied available the biggest breakdown build capacity centers certain
change ckd concepts constraints cost cultural custom days double due to
education effective environment erp excessive expensive
failed find finished ????? Pakistani people press the problem. Proper
raw ready reduced required resistance roads set shifts shop
sigma six skilled staff start stock stops system systematic techniques
training transformation uneducated used vendors want
workers wrong yes zero
Figure 5.9 Tag Cloud Results: The Words and Terminologies which have been More
Emphasized by the Respondents are Shown in Bigger Size Font
Chapter 5- Results of Qualitative Analysis
72
5.4 Prevailing Best Practices in the Industry
The step of Question No. 5 was the starting point of coding, since Questions Nos. 1 to 4 went
into the categorical data. Question number five asked:
“What productivity improvement practices have been adopted in your organization?”
This is one of the richest data filled area. A lot of respondents reported several different
types of productivity improvement practices which they thought that they were following in their
organizations. One of the respondents who is General Manager Foundry of an automotive
organization informed that
“Yield increase is used for productivity enhancement as only the good quality raw material
results in better output/input ratio. For productivity enhancement we carry out optimization
studies. We have observed that extra facilities like free food for employees and accommodation
results in far better production outcome from the same labor”.
Another respondent who is Director of an automotive firm reported:
“More capacity utilization is the best methodology for productivity enhancement. We have
to study the operations sequence what is the bottle neck and accordingly, go for the line balancing.
Where ever required we have to, we add machines and add people.”
Open coding of this column resulted in 61 nodes with 28 parent and 33 child nodes and
132 references. First, all terminologies were open coded and then several nodes were made as child
nodes as they were resulted from the same theme. This step is described as axial coding by Corbin
and Strauss [108]. Constant comparison methodology as suggested by Bryman and Bell [107] were
used for axial coding as only this methodology ensures that similar and alike themes are grouped
together. All these nodes were then imported into a folder with title “Used productivity
enhancement techniques” for further analysis and constant comparison. This folder was saved in
the nodes folder.
Chapter 5- Results of Qualitative Analysis
73
Similar practice were done with Question No 6, which asked
“What latest technologies have been adopted in your organization?”
Generally replies from most of the respondents made it clear that the word ‘technologies’
refers to the latest new machines. For example, an MBA qualified CEO of an organization
answered:
“CNC’s and some automation of the processes……..”
Whereas, some of the respondents also highlighted management issues related to
technologies. For example, one of the respondents who is a General Manager Plant and an engineer
by qualification, replied:
“ISO Certification is good for all purposes, Six Sigma and ERP are too expensive for us.”
One of the General Managers from OEM car manufacturing firm replied:
“Automation is less as we have fool proof systems which result in less accidents due to
POKA YOKA. We have Robots for Wind Screen fitment and have testing lines.”
A CEO of an organization was of the view that:
“No Automation is required only CNC machines are good, old copy lathe give low cost
and more production.”
44 nodes resulted from this question out of which 39 were parent nodes and 5 were placed
as child nodes, with a total of 79 references. No further axial coding was found possible due to the
diverse nature of the respondent themes. All these were saved in a folder named “Used latest
technologies” for further analysis and review.
In Question No. 7 prime players of the game were asked advice on the main theme of this
research:

Chapter 5- Results of Qualitative Analysis
74
“According to you, which are the best suitable practices for Pakistan Automotive
Industry?”
Answer to this question resulted in a total of 46 nodes, out of which 12 were parent nodes
and 34 were child nodes with a total of 169 references. The two major themes that emerged having
convergent views by almost all of the respondents were “optimization” and “human resource
issues”. 57 references were linked with the parent node of “optimization”, having the maximum
frequency. Under this theme the most referred and emphasized productivity enhancement
methodology for Pakistan Automotive industry of Pakistan, as far as these experts are concerned,
is “Wastage Reduction” having a count of 21. One of the General Manager Plants, of an
organization was of the view that for productivity enhancement required elements are
“Continuous improvement, flexible manufacturing and optimization techniques which can
give wastage reduction …..”.
General Manager Productions of another company who is a mechanical engineer
accentuated that for productivity enhancement, certain techniques have to be adopted:
“Time and motion study, optimization, wastage control, and rejection which is hidden by
employees we have to unearth it ………”.
The second most emphasized point was layout improvement, which was referred to on 12
times. A CEO of a company, who is an engineer by qualification, stressed that for productivity
enhancement things to be looked after are:
“Machinery selection, TPM, quality maintenance, layout of Machinery (with time and
motion study)……….”
All these aspects suggested by the experts of this field were in line with their views that
they use the same techniques in their factories and plants, as shown in the answer of Question No.

Chapter 5- Results of Qualitative Analysis
75
5. However, the second most prominent field which was highlighted in their opinion as the most
suitable productivity enhancement practice for Pakistan’s industries, was to resolve the human
resource issues, having 40 references. This aspect will be discussed in detail in the succeeding
paragraphs. However, an important gap to be identified here is that once their answers were
compared with what they actually do in their own organizations, as there is a total divergence
between the two. It means that they never agreed that they are looking after these human resource
issues in their organizations once asked in Question 5, but they strongly suggest that these human
related issues cannot be resolved without looking into these aspects. This was one of the most
important findings that helped in suggesting and finalizing the productivity enhancement model
for this industry.
For example, one COO of an organization gave the following opinion:
“…….trained staff which can stay for long is required then quality systems can be applied.
Wastage control and layout changes are required but talented officers are required who are well
educated to do this task”.
General Manager of an organization replied:
“First of all we need trained and skilled workers who can apply these practices for that we
have to take care of our manpower………”.
Apart from the aspects of training of the employees and availability of skilled manpower,
another aspect which emerged as the strongest point tinted in the opinion of these experts was Job
Satisfaction of the employees. This aspect was the strongest solution suggested by most of the
respondents. One of the General Managers pointed out following points as solution:
“.…ensuring process capability, skill enhancement, training technical people, hiring
educated people like engineers and taking care of HR by ensuring Job Satisfaction”.

Chapter 5- Results of Qualitative Analysis
76
Another General Manger pointed out that in order to enhance productivity, we should be:
“……..enhancing morale by free lunch, taking care of them, providing transport facility,
and providing safety measures will result in better profits”.
12 of the respondents underlined the issues of TQM implementation instead of TQM
certification. They also emphasized for implementation of ERP and modified JIT, for productivity
enhancement of these firms. The respondents highlighted very enlightening issues when they were
asked about the difficulties they faced in implementation of these techniques in Question No. 8.
The question narrated:
“What are your experiences in implementation of these latest techniques and practices in
your organization?”
A total of 23 nodes were made with 11 parent nodes and 12 child nodes with 90 references.
65% of the coding done was converging on one main theme “Human resource resistance”. Under
this parent node the major child nodes were; resistance due to less educated manpower, resistance
due to less training, resistance due to unskilled manpower and resistance to change. Vendor
limitations and issues with the JIT methodology were also discussed.
A General Manger responded to this query as follows:
“Resistance to change is a result of less education level. This can be reduced by imparting
training and hiring skilled workers”
Another respondent who is an engineer and performed the job of General Manager,
responded:
“Skilled persons are required for implementation of advanced techniques and skilled and
educated workers are hard to find in Pakistan”.

Chapter 5- Results of Qualitative Analysis
77
Director of a company who is a mechanical engineer responded to the issue of resistance
as:
“Proper training after that implementation….”
Response of a CEO from vendor company was:
“Very less skilled and trained manpower, less education and resistance from uneducated
people….”
A very important aspect ensued from these responses is that most of the top management
is conceived regarding the core issue in hand, but the point which is not understood is that why
educated people are so hard to find in our country though there is a huge unemployment rate of
educated manpower in this country. This gap identifies a major issue to be looked at, and that is
Knowledge transfer partnership (KTP) between industry and academia. Advanced nations have
utilized this aspect for the betterment of their problems e.g. Singapore. A lot of effort in this regard
are required to address these issues in Pakistan’s automotive industry. A Deputy General Manager
of a company enumerated the following main problems faced in the implementation of these
techniques:
“Vendor industry problem, education, load shedding, environment change and training”
Another major issue highlighted the most, regarding the issues of implementation of the
latest techniques was the limitations of Just- in Time- methodology. JIT is one of the management
techniques which has been implemented in almost all of the major OEMs of auto car assemblers
in Pakistan. OEM includes Pakistan Suzuki, Indus Motors (Toyota), Honda Atlas, Millat Tractors
(Massi Ferguson) and AL-Ghazi Tractors (Fiat Tractor). However, one aspect highlighted by most
of the respondents was that there is a need to make changes in JIT in order to implement it in an
effective manner. The terminology mostly used was “Modified JIT”. This modified JIT is
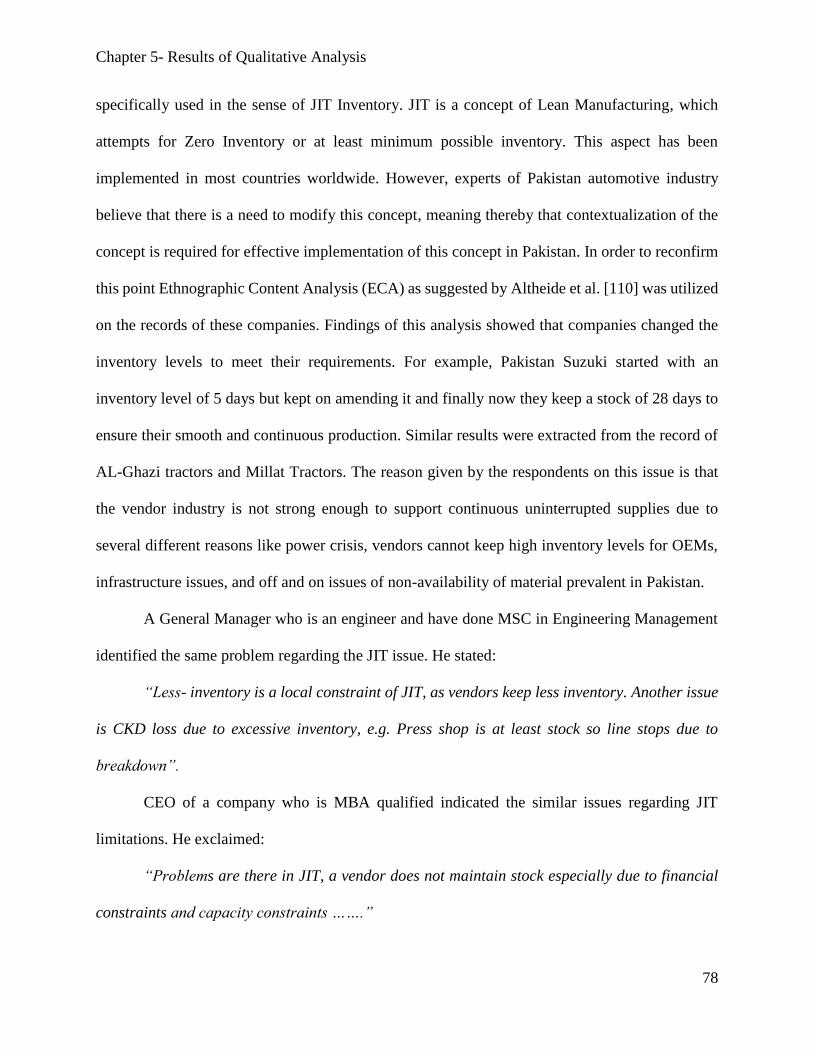
Chapter 5- Results of Qualitative Analysis
78
specifically used in the sense of JIT Inventory. JIT is a concept of Lean Manufacturing, which
attempts for Zero Inventory or at least minimum possible inventory. This aspect has been
implemented in most countries worldwide. However, experts of Pakistan automotive industry
believe that there is a need to modify this concept, meaning thereby that contextualization of the
concept is required for effective implementation of this concept in Pakistan. In order to reconfirm
this point Ethnographic Content Analysis (ECA) as suggested by Altheide et al. [110] was utilized
on the records of these companies. Findings of this analysis showed that companies changed the
inventory levels to meet their requirements. For example, Pakistan Suzuki started with an
inventory level of 5 days but kept on amending it and finally now they keep a stock of 28 days to
ensure their smooth and continuous production. Similar results were extracted from the record of
AL-Ghazi tractors and Millat Tractors. The reason given by the respondents on this issue is that
the vendor industry is not strong enough to support continuous uninterrupted supplies due to
several different reasons like power crisis, vendors cannot keep high inventory levels for OEMs,
infrastructure issues, and off and on issues of non-availability of material prevalent in Pakistan.
A General Manager who is an engineer and have done MSC in Engineering Management
identified the same problem regarding the JIT issue. He stated:
“Less- inventory is a local constraint of JIT, as vendors keep less inventory. Another issue
is CKD loss due to excessive inventory, e.g. Press shop is at least stock so line stops due to
breakdown”.
CEO of a company who is MBA qualified indicated the similar issues regarding JIT
limitations. He exclaimed:
“Problems are there in JIT, a vendor does not maintain stock especially due to financial
constraints and capacity constraints …….”

Chapter 5- Results of Qualitative Analysis
79
A director of a company also highlighted the need of a modified JIT:
“JIT failed, 15 days stock is held now, good roads and infrastructure is required….”
Another CEO of a company, who is also an MBA, very bluntly rejected the implementation
possibility of JIT in Pakistan:
“JIT cannot be implemented properly and zero- inventory is a joke in Pakistan. Due to
certain issues, we have to keep inventory levels both of raw materials and of finished goods”.
Another aspect which was explored in this research was regarding the future planning of
these experts. The question asked was:
“What are the future plans of your organization for implementation of new techniques?”
Strange findings emerged as a result of the fact that most of the experts were concentrating
upon “Automation” instead of the most highlighted issue of Human resource resistance”. After
analyzing the results of Question No. 5 and 6 regarding the methods used and the most problematic
issues faced in implementation of these techniques, it was felt that most of these experts would
elaborate upon these specific issues and give forth recommendations to resolve these issues for
productivity enhancement and profit increases. But unfortunately, the analysis of the responses
showed that although they feel that HR resistances is the most problematic issue; still they are not
even thinking about taking any steps to resolve these sore issues. It is clear from the analysis that
there is a dire need for these influential people of the industry to look into these matters and try to
improve the present scenario.
CEO of a company gave the following foresight of his organization
“Maximum automation and purpose build machines…”
General Manager of an organization who has done mechanical engineering showed his
future plans in the following manner
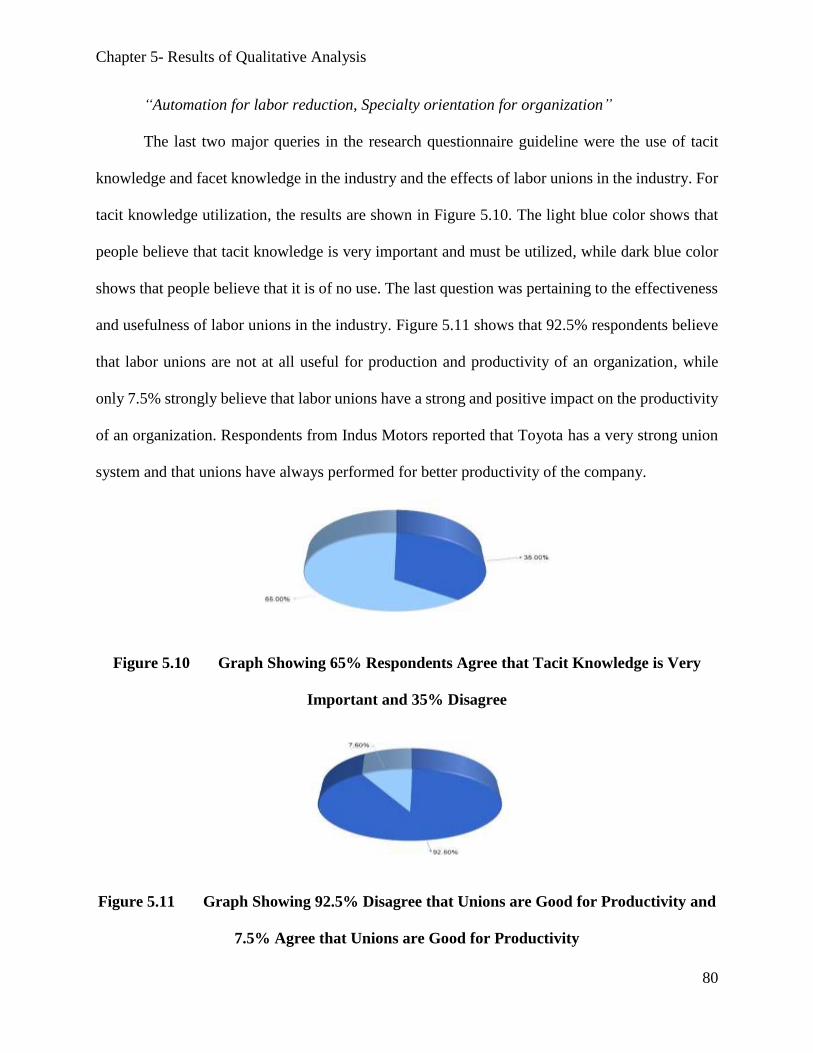
Chapter 5- Results of Qualitative Analysis
80
“Automation for labor reduction, Specialty orientation for organization”
The last two major queries in the research questionnaire guideline were the use of tacit
knowledge and facet knowledge in the industry and the effects of labor unions in the industry. For
tacit knowledge utilization, the results are shown in Figure 5.10. The light blue color shows that
people believe that tacit knowledge is very important and must be utilized, while dark blue color
shows that people believe that it is of no use. The last question was pertaining to the effectiveness
and usefulness of labor unions in the industry. Figure 5.11 shows that 92.5% respondents believe
that labor unions are not at all useful for production and productivity of an organization, while
only 7.5% strongly believe that labor unions have a strong and positive impact on the productivity
of an organization. Respondents from Indus Motors reported that Toyota has a very strong union
system and that unions have always performed for better productivity of the company.
Figure 5.10 Graph Showing 65% Respondents Agree that Tacit Knowledge is Very
Important and 35% Disagree
Figure 5.11 Graph Showing 92.5% Disagree that Unions are Good for Productivity and
7.5% Agree that Unions are Good for Productivity

Chapter 5- Results of Qualitative Analysis
81
Chapter Summary
In the second stage of research, interviews were conducted from 40 respondents comprising
of CEO’s, directors and GM’s of 26 automotive manufacturing companies. Interviews ranging
from 15 minutes to half an hour were written, taped and videotaped (wherever allowed by the
respondents). The responses of the survey were gathered and entered into XL Sheets. This XL
sheet data was then imported into NVivo version 10. Responses were coded as per the themes that
emerged from the data. After complete analysis of the emerging themes, a total of 326 nodes were
made with a total of 2440 references. Text search query, word frequency query and several coding
queries were run to explore the data and perform open and axial coding. Demographic details
showed most of the CEO’s are above 50 years of age. 92.5 % respondents were not aware of correct
meanings of productivity. Results showed that measurement methods for productivity used in the
industry are not as per world standards. 65% respondents agreed that tacit knowledge is important
for productivity improvement. 92.5% respondents believe that labor unions are not good for
productivity of organizations.

Chapter 6- Development of Productivity Enhancement Framework
82
CHAPTER 6
DEVELOPMENT OF PRODUCTIVITY ENHANCEMENT
FRAMEWORK
6.1 Exploring the Data
In order to explore the data, coding is done in three stages i.e. open coding, axial coding and
selective coding [108]. In the previous chapter, detail methodology of open coding which was done
in this research was explained with few steps of axial coding. In this chapter, further elaboration
on axial coding and selective coding conducted for this research are being discussed with the
ultimate aim of theory generation. One of the major criticisms on grounded theory methodology
is that researcher and analyst always try to do conceptual analysis instead of trying to generate
substantive or formal theory [112], [115], [116]. Hutchison, Johnston and Breckon [117] explained
that a lot of research has been conducted using grounded theory method, but researchers have
failed to inter-relate concepts in order to generate a theory from which the hypotheses can be
generated. Another major criticism of using grounded theory with CAQDAS like NVivo is that
researchers try to fit their research data into computer software instead of using software as a help
for analysis [118]. In order to avoid all such mistakes proper iterative procedure and systematic
constant comparison techniques of data collection and analysis were adopted as explained by the
experts of the field [107], [108], [114], [116], [117]. In this procedure analyst oscillates between
the concepts and categories in order to explore the data for all new possibilities.
Starting from open coding and going towards axial coding is a process in which analyst tries
to go from thick descriptive data into micro analysis of the data [108]. This process was adopted
in the analysis to get the most accurate outcome of the data. In this process, memo making is one
of the helping technique which was persistently utilized for analytical ideas. NVivo gives options
of memo making throughout the process. These memos helped in exploring and understanding the
Chapter 6- Development of Productivity Enhancement Framework
83
data. These memos were used in conjunction with the field notes taken during the participant
observation. Axial coding is named such, as the concepts included in the categories are checked
and rechecked around the axis. There are several different tools available in NVivo to facilitate
this analytical process. One of the techniques is using tree nodes. NVivo give options to organize
the data in the method as shown in Figure 6.1. With the help of this option tree nodes were formed.
This method allows nodes to have more than one dimension. During the constant comparison
method this researcher kept on comparing the concepts emerged and tried to explore in which
category or categories they fit best. However, at tree nodes stage, the categories made are very
broad in nature, so in order to avoid the forceful incorporation of concepts into categories,
Figure 6.1 Screen Shot Displaying Formation of Tree Nodes

Chapter 6- Development of Productivity Enhancement Framework
84
different coding quires available in NVivo were used. These queries and their results will be
discussed and elaborated upon later in this chapter. These queries help in understanding different
dimensions of the concepts and categories.
During axial coding apart from using epistemological methodology ontological stance
(constructive view) was also used. The main reason behind this approach was the criticism on
losing the iterative approach during this process [116], [119]. In order to do so, several questions
were formed while analyzing the data. These questions were answered with the help of coding
queries run. One analytical question formed was:
“What engineers say about the productivity enhancement techniques?”
The same question was used for diploma holders and different education-level people. To
answer this question, simple coding query was run. Results showed views of the engineers about
the prevailing productivity enhancement techniques being used in Pakistan automotive industry.
Similar different questions were run utilizing these coding queries command to explore and
finalize the sub categories. The main purpose of this axial coding was to place the concepts in the
best-suited categories and sub categories.
Another tool utilized for further in-depth study of the concepts and nodes is coding strips.
As shown in Figure 6.2, “coding strips” command of NVivo gives a pictorial view of the coding
done on the text. It also shows the density of the coding on the text and also depicts how one
concept is coded or can be coded in more than one category. This view also helped in exploring
the themes emerged and their relevant placement in the node structure either as a parent node or
child node. This node tree gives strength for axial coding and selective coding. During the constant
comparison method, another strong tool used in NVivo was development of the node map.
Shown in Figure 6.3 is a node map for used productivity enhancement techniques and technologies

Chapter 6- Development of Productivity Enhancement Framework
85
Figure 6.2 Coding Strips Showing the Coding Details and the Density of the Coding
in Pakistan as per respondents. This node map helped in analyzing the parent nodes and the child
nodes. It showed as to which concepts are formed as part of which categories/subcategories. The
bigger box is for the main category and small boxes encompassed inside are the sub categories and
concepts comprising it. The size of the box represents the importance and strength of the concept
in a category and the color scheme depicts the most empathized and repeated concept emerged
from the responses of the respondents. As in the figure below wastage reduction and CNC are
shown in a different color, which shows their importance. This map shows that optimization is the
major category emerged from the data and in this category the most influential concept is wastage
reduction. Similar steps were utilized for all major nodes.

Chapter 6- Development of Productivity Enhancement Framework
86
Figure 6.3 Node Map Showing the Categories and Sub Categories with Color
Schemes
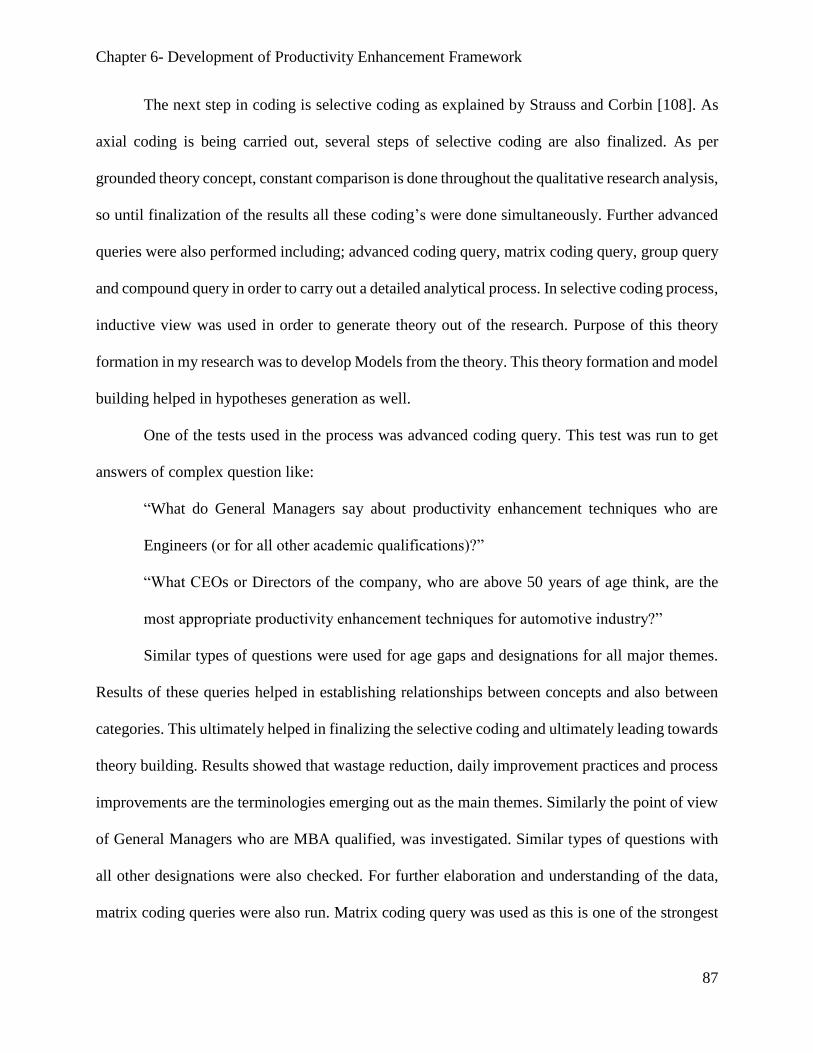
Chapter 6- Development of Productivity Enhancement Framework
87
The next step in coding is selective coding as explained by Strauss and Corbin [108]. As
axial coding is being carried out, several steps of selective coding are also finalized. As per
grounded theory concept, constant comparison is done throughout the qualitative research analysis,
so until finalization of the results all these coding’s were done simultaneously. Further advanced
queries were also performed including; advanced coding query, matrix coding query, group query
and compound query in order to carry out a detailed analytical process. In selective coding process,
inductive view was used in order to generate theory out of the research. Purpose of this theory
formation in my research was to develop Models from the theory. This theory formation and model
building helped in hypotheses generation as well.
One of the tests used in the process was advanced coding query. This test was run to get
answers of complex question like:
“What do General Managers say about productivity enhancement techniques who are
Engineers (or for all other academic qualifications)?”
“What CEOs or Directors of the company, who are above 50 years of age think, are the
most appropriate productivity enhancement techniques for automotive industry?”
Similar types of questions were used for age gaps and designations for all major themes.
Results of these queries helped in establishing relationships between concepts and also between
categories. This ultimately helped in finalizing the selective coding and ultimately leading towards
theory building. Results showed that wastage reduction, daily improvement practices and process
improvements are the terminologies emerging out as the main themes. Similarly the point of view
of General Managers who are MBA qualified, was investigated. Similar types of questions with
all other designations were also checked. For further elaboration and understanding of the data,
matrix coding queries were also run. Matrix coding query was used as this is one of the strongest

Chapter 6- Development of Productivity Enhancement Framework
88
queries available in NVivo which can actually compare different concepts and themes in the form
of rows and columns giving result in the form of a chart as well. The following question raised
the requirement for running this query:-
“What is the opinion of the respondents of different educational background on
optimization?”
This question arose as optimization emerged to be the most prominent technology which
is graded very high in the data. Results of the query are shown in graphical form in Figure 6.4. The
graph shows that mostly the engineers talk about wastage reduction and KAIZEN, whereas the
diploma holders have emphasized upon CAD/CAM technologies. On the other hand, the MBA
Figure 6.4 Results in the Form of Chart from Matrix Coding Query Showing the
Numbers of Responses on Optimization from Respondents of Different
Designation
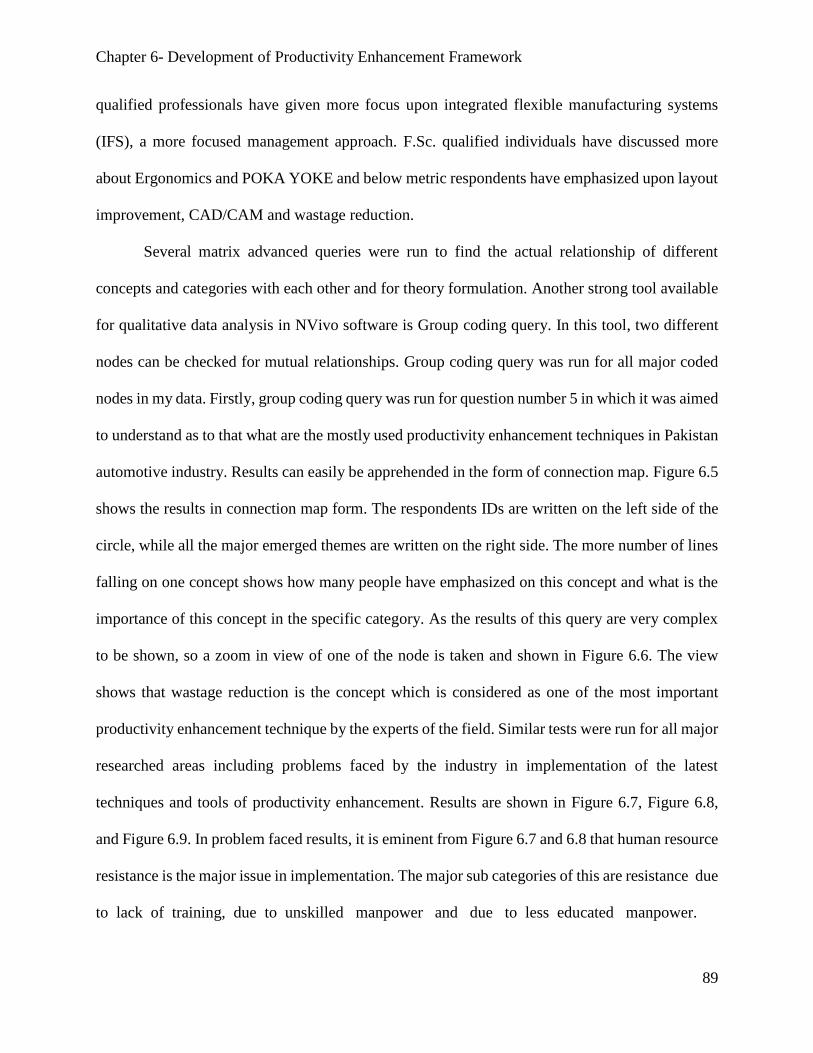
Chapter 6- Development of Productivity Enhancement Framework
89
qualified professionals have given more focus upon integrated flexible manufacturing systems
(IFS), a more focused management approach. F.Sc. qualified individuals have discussed more
about Ergonomics and POKA YOKE and below metric respondents have emphasized upon layout
improvement, CAD/CAM and wastage reduction.
Several matrix advanced queries were run to find the actual relationship of different
concepts and categories with each other and for theory formulation. Another strong tool available
for qualitative data analysis in NVivo software is Group coding query. In this tool, two different
nodes can be checked for mutual relationships. Group coding query was run for all major coded
nodes in my data. Firstly, group coding query was run for question number 5 in which it was aimed
to understand as to that what are the mostly used productivity enhancement techniques in Pakistan
automotive industry. Results can easily be apprehended in the form of connection map. Figure 6.5
shows the results in connection map form. The respondents IDs are written on the left side of the
circle, while all the major emerged themes are written on the right side. The more number of lines
falling on one concept shows how many people have emphasized on this concept and what is the
importance of this concept in the specific category. As the results of this query are very complex
to be shown, so a zoom in view of one of the node is taken and shown in Figure 6.6. The view
shows that wastage reduction is the concept which is considered as one of the most important
productivity enhancement technique by the experts of the field. Similar tests were run for all major
researched areas including problems faced by the industry in implementation of the latest
techniques and tools of productivity enhancement. Results are shown in Figure 6.7, Figure 6.8,
and Figure 6.9. In problem faced results, it is eminent from Figure 6.7 and 6.8 that human resource
resistance is the major issue in implementation. The major sub categories of this are resistance due
to lack of training, due to unskilled manpower and due to less educated manpower.

Chapter 6- Development of Productivity Enhancement Framework
90
Figure 6.5 Results of Group Coding Query as Connection Map for Respondents vs Used
Productivity Enhancement Practices
Figure 6.6 Zoom in View for Figure 6.5 Showing the Prominent Concept
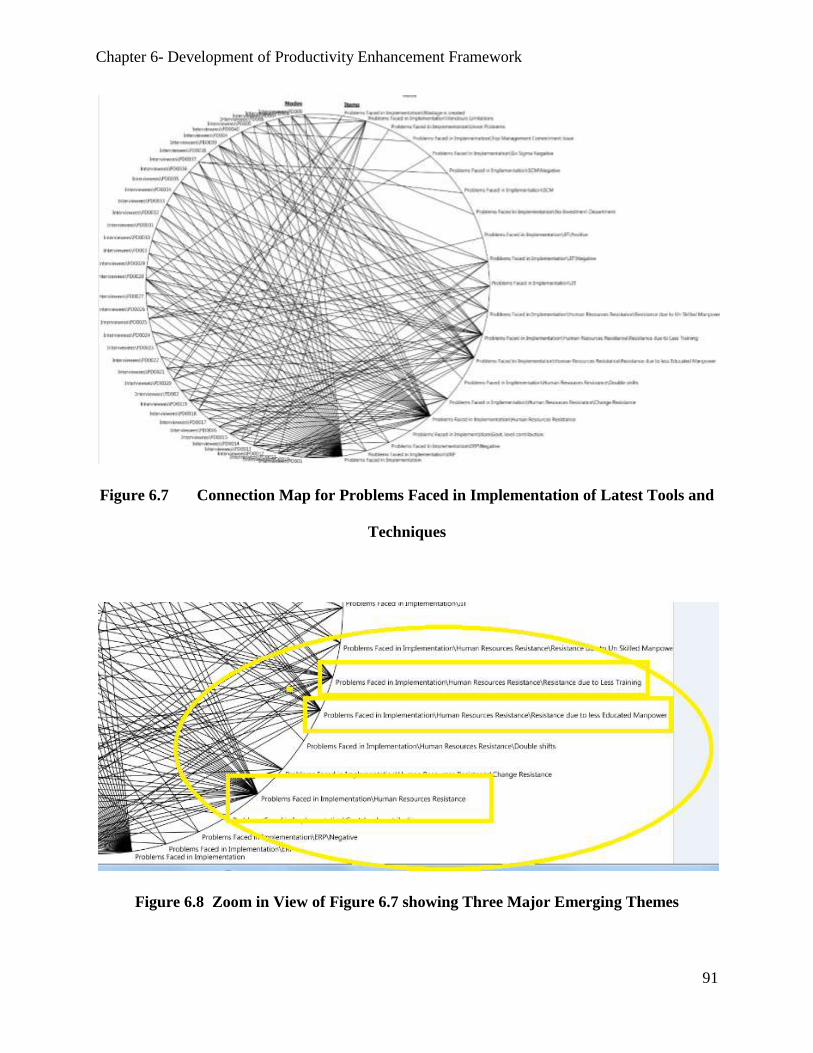
Chapter 6- Development of Productivity Enhancement Framework
91
Figure 6.7 Connection Map for Problems Faced in Implementation of Latest Tools and
Techniques
Figure 6.8 Zoom in View of Figure 6.7 showing Three Major Emerging Themes
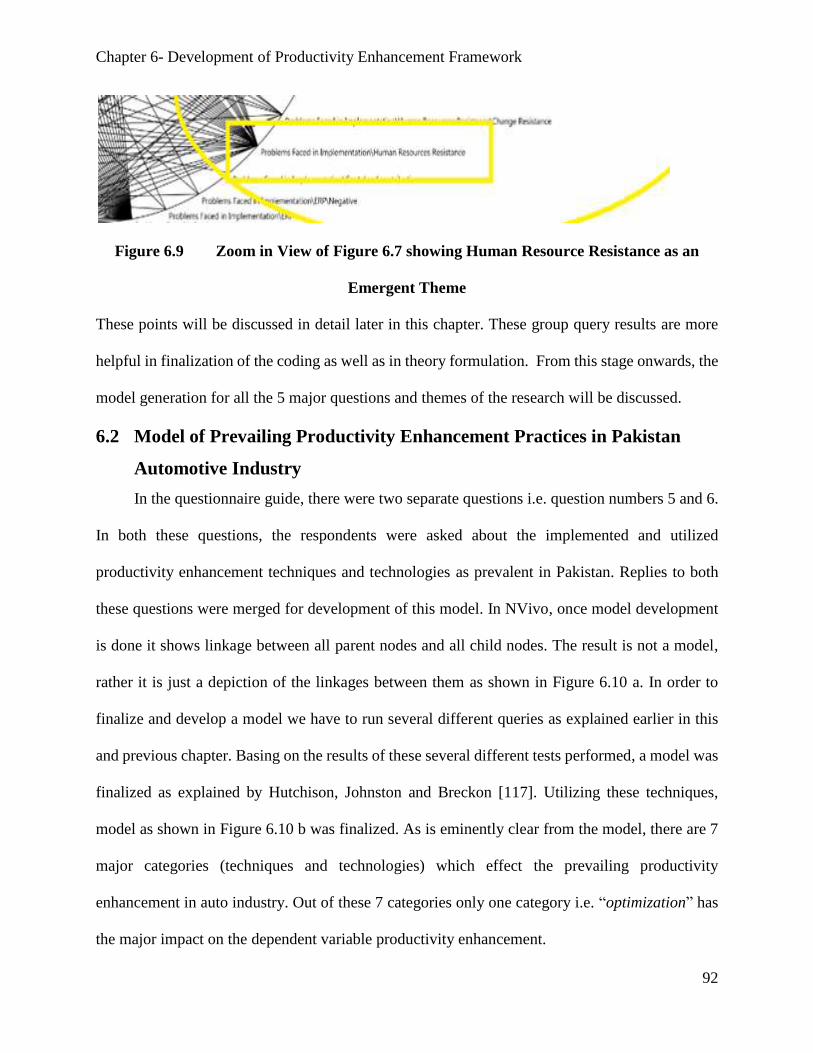
Chapter 6- Development of Productivity Enhancement Framework
92
Figure 6.9 Zoom in View of Figure 6.7 showing Human Resource Resistance as an
Emergent Theme
These points will be discussed in detail later in this chapter. These group query results are more
helpful in finalization of the coding as well as in theory formulation. From this stage onwards, the
model generation for all the 5 major questions and themes of the research will be discussed.
6.2 Model of Prevailing Productivity Enhancement Practices in Pakistan
Automotive Industry
In the questionnaire guide, there were two separate questions i.e. question numbers 5 and 6.
In both these questions, the respondents were asked about the implemented and utilized
productivity enhancement techniques and technologies as prevalent in Pakistan. Replies to both
these questions were merged for development of this model. In NVivo, once model development
is done it shows linkage between all parent nodes and all child nodes. The result is not a model,
rather it is just a depiction of the linkages between them as shown in Figure 6.10 a. In order to
finalize and develop a model we have to run several different queries as explained earlier in this
and previous chapter. Basing on the results of these several different tests performed, a model was
finalized as explained by Hutchison, Johnston and Breckon [117]. Utilizing these techniques,
model as shown in Figure 6.10 b was finalized. As is eminently clear from the model, there are 7
major categories (techniques and technologies) which effect the prevailing productivity
enhancement in auto industry. Out of these 7 categories only one category i.e. “optimization” has
the major impact on the dependent variable productivity enhancement.
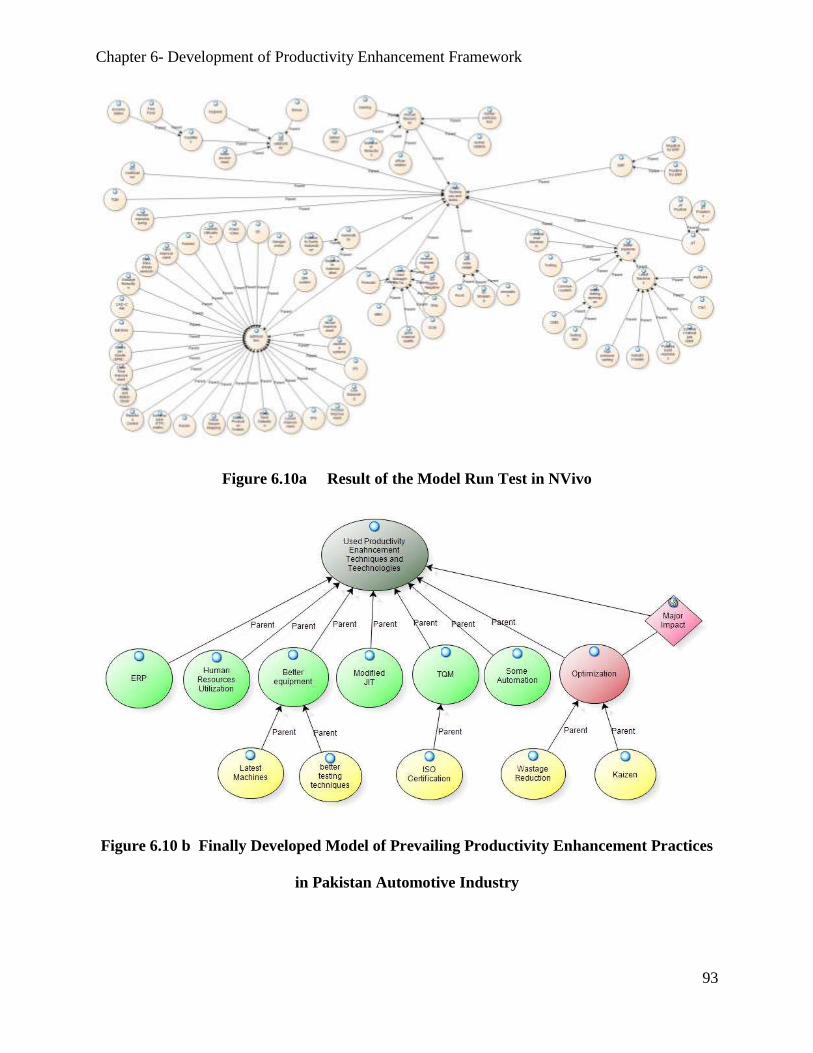
Chapter 6- Development of Productivity Enhancement Framework
93
Figure 6.10a Result of the Model Run Test in NVivo
Figure 6.10 b Finally Developed Model of Prevailing Productivity Enhancement Practices
in Pakistan Automotive Industry
Chapter 6- Development of Productivity Enhancement Framework
94
In optimization, only two subcategories out of 17 sub categories have emerged as more
influential which are wastage reduction and Kaizen. Based on this model, several hypotheses were
generated which are given in the succeeding paragraphs.
Hypothesis 1a: Optimization techniques have a major impact on productivity enhancement in
automotive industry.
Hypothesis 1b: Wastage reduction and Kaizen are the most used and effective productivity
enhancement techniques in Pakistan automotive industry.
Hypothesis 2: Using better equipment i.e. latest machines and better testing equipment will
result in productivity enhancement.
Hypothesis 3: TQM systems especially ISO certification will result in better productivity.
Hypothesis 4: Some automation of the processes will enhance productivity.
Hypothesis 5: Modified JIT is more effective for productivity enhancements in Pakistan.
Hypothesis 6: Imparting training will result in better human resource utilization which will give
higher productivity gains.
Hypothesis 7: ERP implementation in Pakistan automotive firms results in better productivity
enhancements.
6.3 Model of Best Suitable Practices for Pakistan Automotive Industry
These respondents were then asked to give their opinion as to what are the best suited
productivity enhancement practices from Pakistan automotive industry. On the basis of the
collected data and utilizing the detailed methodology as discussed earlier, model was developed
as shown in Figure 6.11. As per the model, 8 practices have emerged as the most prominent and
effective for productivity enhancement in Pakistan automotive industry according to these experts
of the field. Two out of these eight techniques have major impact on productivity enhancement.
One is optimization which is very similar to my first model, with one change that layout changes

Chapter 6- Development of Productivity Enhancement Framework
95
have been suggested as equally important and influential methodology by these experts. Secondly,
addressing the human resource issues have also emerged as the major impact practice for
productivity enhancement. In the first model only one aspect came as prominent for better human
utilization and that was training, while in this model three sub categories have emerged which are
hiring of educated manpower, utilization of skilled manpower via training and attaining job
satisfaction of the employees for better productivity enhancements. In this model, Job satisfaction
has shown a major impact on this category. Based on these models, following hypotheses have
emerged from this theory.
Hypothesis 1a: Optimization techniques have a major impact on productivity enhancement in
Pakistan automotive industry.
Figure 6.11 Suggested Productivity Enhancement Model for Pakistan Automotive
Industry by the Experts of the Field
Chapter 6- Development of Productivity Enhancement Framework
96
Hypothesis 1b: Layout changes and wastage reduction have major impact on optimization
resulting in productivity enhancement.
Hypothesis 2: Using better equipment will result in productivity enhancement.
Hypothesis 3: TQM systems have a positive relationship with better productivity.
Hypothesis 4: Better maintenance systems will enhance productivity.
Hypothesis 5: Modified JIT is more effective for productivity enhancements in Pakistan.
Hypothesis 6a: Resolving human resource issues have a major impact on productivity
enhancement.
Hypothesis 6b: Imparting training will result in skilled manpower which will give higher
productivity gains.
Hypothesis 6c: Hiring educated manpower will result in enhanced productivity.
Hypothesis 6d: Attaining higher job satisfaction of the employees will result in enhanced
productivity.
Hypothesis 7: Supply chain management system (SCM) implementation in Pakistan automotive
firms will result in better productivity enhancements.
Hypothesis 8: ERP implementation in Pakistan automotive firms will result in better productivity
enhancements.
6.4 Model of Problems Faced in Implementation of Latest Techniques
Respondents were asked to elaborate upon their experiences in implementation of the latest
techniques in Pakistan. Several problem areas were highlighted which were analyzed and finally
a model was developed showing the most chronic and disturbing issues. Model was developed
utilizing the same methodologies as explained earlier in this chapter. Figure 6.12 shows this model.
In this model, a new concept emerged was vendor limitations. Respondents were of the view that
most of the latest techniques and technologies cannot be implemented accurately in Pakistan
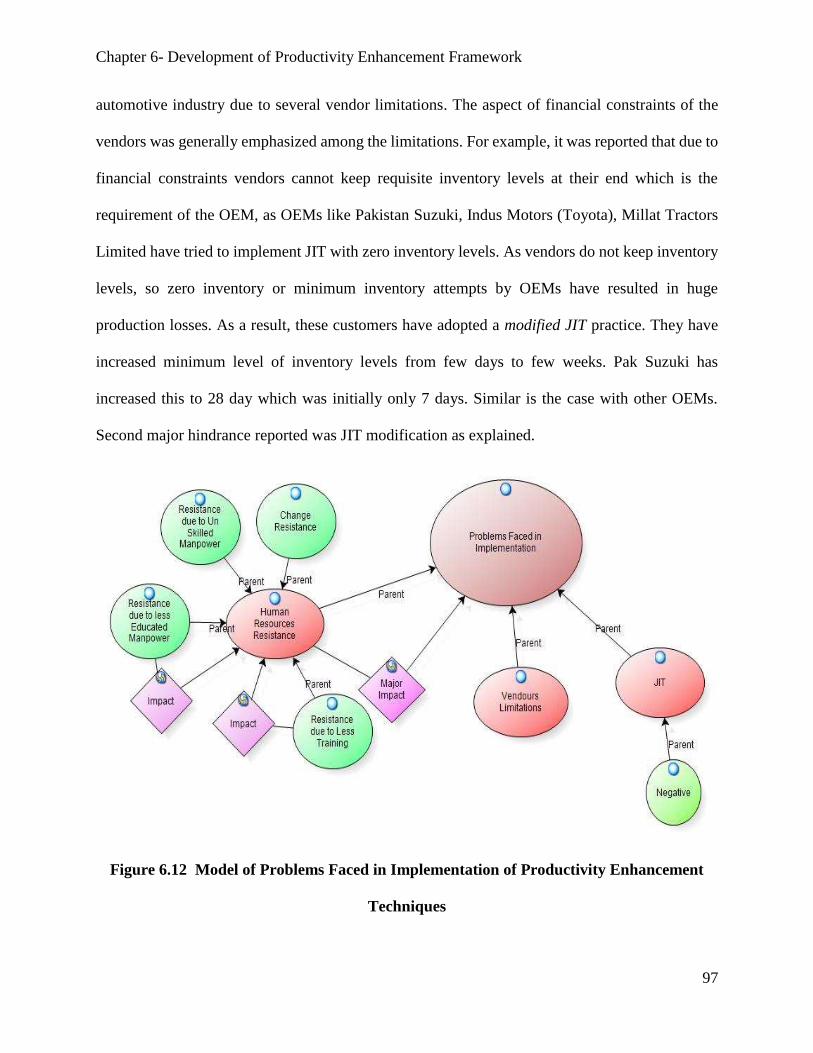
Chapter 6- Development of Productivity Enhancement Framework
97
automotive industry due to several vendor limitations. The aspect of financial constraints of the
vendors was generally emphasized among the limitations. For example, it was reported that due to
financial constraints vendors cannot keep requisite inventory levels at their end which is the
requirement of the OEM, as OEMs like Pakistan Suzuki, Indus Motors (Toyota), Millat Tractors
Limited have tried to implement JIT with zero inventory levels. As vendors do not keep inventory
levels, so zero inventory or minimum inventory attempts by OEMs have resulted in huge
production losses. As a result, these customers have adopted a modified JIT practice. They have
increased minimum level of inventory levels from few days to few weeks. Pak Suzuki has
increased this to 28 day which was initially only 7 days. Similar is the case with other OEMs.
Second major hindrance reported was JIT modification as explained.
Figure 6.12 Model of Problems Faced in Implementation of Productivity Enhancement
Techniques
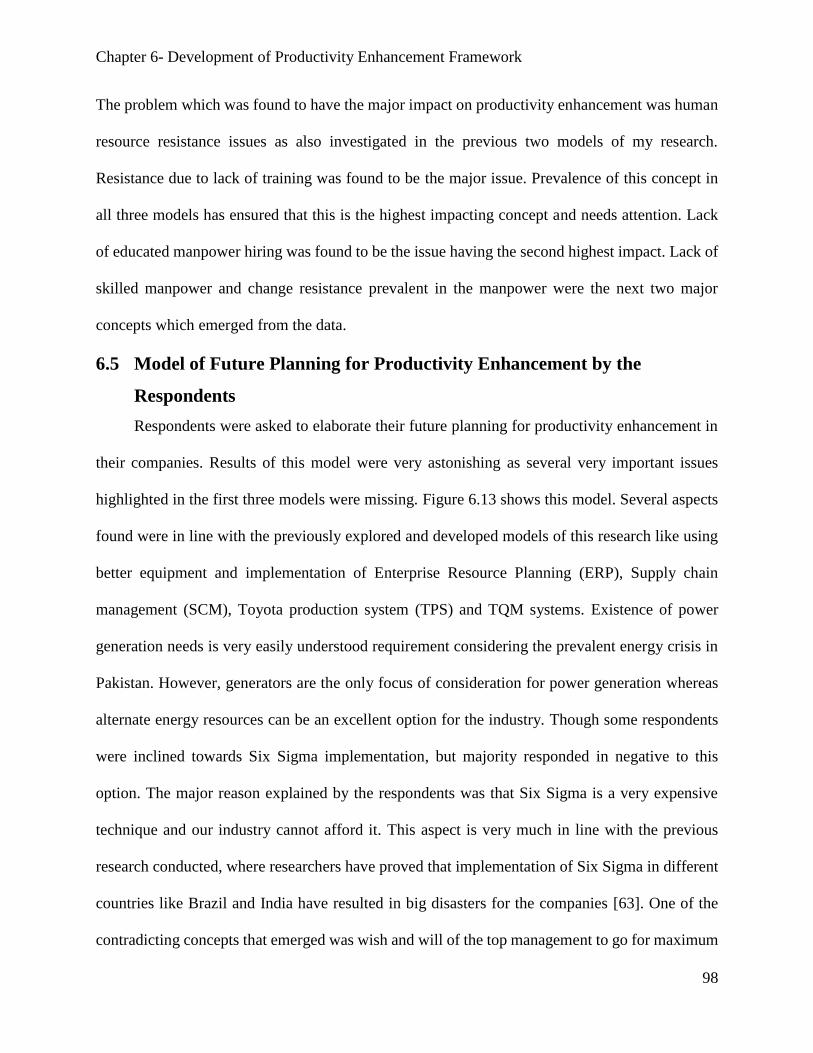
Chapter 6- Development of Productivity Enhancement Framework
98
The problem which was found to have the major impact on productivity enhancement was human
resource resistance issues as also investigated in the previous two models of my research.
Resistance due to lack of training was found to be the major issue. Prevalence of this concept in
all three models has ensured that this is the highest impacting concept and needs attention. Lack
of educated manpower hiring was found to be the issue having the second highest impact. Lack of
skilled manpower and change resistance prevalent in the manpower were the next two major
concepts which emerged from the data.
6.5 Model of Future Planning for Productivity Enhancement by the
Respondents
Respondents were asked to elaborate their future planning for productivity enhancement in
their companies. Results of this model were very astonishing as several very important issues
highlighted in the first three models were missing. Figure 6.13 shows this model. Several aspects
found were in line with the previously explored and developed models of this research like using
better equipment and implementation of Enterprise Resource Planning (ERP), Supply chain
management (SCM), Toyota production system (TPS) and TQM systems. Existence of power
generation needs is very easily understood requirement considering the prevalent energy crisis in
Pakistan. However, generators are the only focus of consideration for power generation whereas
alternate energy resources can be an excellent option for the industry. Though some respondents
were inclined towards Six Sigma implementation, but majority responded in negative to this
option. The major reason explained by the respondents was that Six Sigma is a very expensive
technique and our industry cannot afford it. This aspect is very much in line with the previous
research conducted, where researchers have proved that implementation of Six Sigma in different
countries like Brazil and India have resulted in big disasters for the companies [63]. One of the
contradicting concepts that emerged was wish and will of the top management to go for maximum
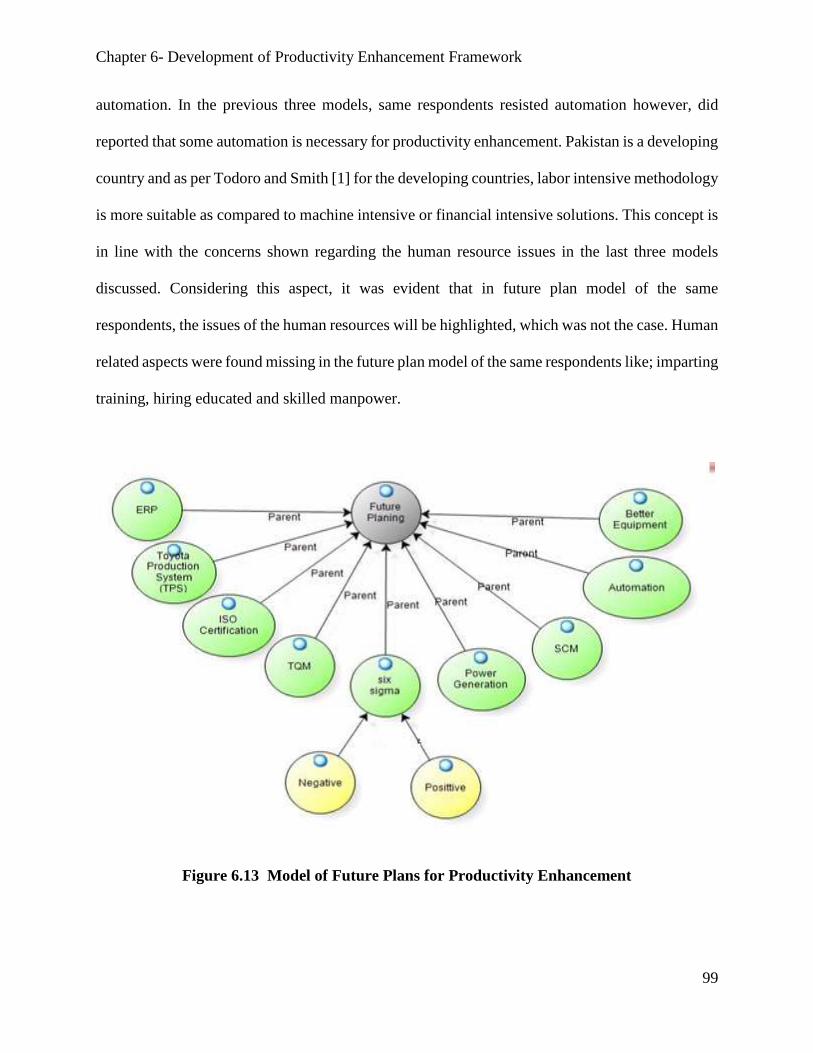
Chapter 6- Development of Productivity Enhancement Framework
99
automation. In the previous three models, same respondents resisted automation however, did
reported that some automation is necessary for productivity enhancement. Pakistan is a developing
country and as per Todoro and Smith [1] for the developing countries, labor intensive methodology
is more suitable as compared to machine intensive or financial intensive solutions. This concept is
in line with the concerns shown regarding the human resource issues in the last three models
discussed. Considering this aspect, it was evident that in future plan model of the same
respondents, the issues of the human resources will be highlighted, which was not the case. Human
related aspects were found missing in the future plan model of the same respondents like; imparting
training, hiring educated and skilled manpower.
Figure 6.13 Model of Future Plans for Productivity Enhancement

Chapter 6- Development of Productivity Enhancement Framework
100
6.6 Comparison with the World Best Practices and Models
All the four models discussed in the preceding paragraphs were the result of substantive
theory. As per Bryman and Bell [107], a theory emerged from the research data and empirical
evidence is called substantive theory, as it was emerged from my research findings. However, in
order to generate formal theory, similar research should be conducted in comparable
circumstances- a method not followed or adopted in this research. However, alternate methodology
of formal theory generation as discussed by Bryman and Bell [107] was utilized according to which
the generated substantive theory is pitched against the already built theory form the literature
review to generate formal theory. For the purpose of formal theory generation, these four models
were than compared with the already established models in the literature. Seven productivity
enhancement models chosen from the literature are discussed in succeeding paragraphs.
6.6.1 UK Productivity Enhancement Techniques
Herrona and Braiden [45] conducted a vast research in United Kingdom on the productivity
enhancement techniques for manufacturing industry. In their research, they emphasized on
utilization of productivity enhancement techniques used in automotive industry worldwide and
suggested the following Model as shown in Figure 6.14. According to their model, 17 practices
Figure 6.14 Productivity Enhancement Model for UK Manufacturing Industry (Herrona
and Braiden 2006)

Chapter 6- Development of Productivity Enhancement Framework
101
are mostly used and are considered as best practices for UK manufacturing industry.
6.6.2 Swedish Productivity Enhancement Factors
Thomas Grünberg [22] conducted a detailed research in Swedish manufacturing
organizations and suggested the major factors contributing to productivity, performance and
profitability. These factors are given in Figure 6.15. He divided the factors in four major categories;
process, overall control, product and resources. He showed his results in a fish bone diagram. He
included a total of 48 concepts which, according to him, are the most important for productivity
enhancement.
Figure 6.15 Productivity Enhancement Factors by Thomas Grünberg [32]
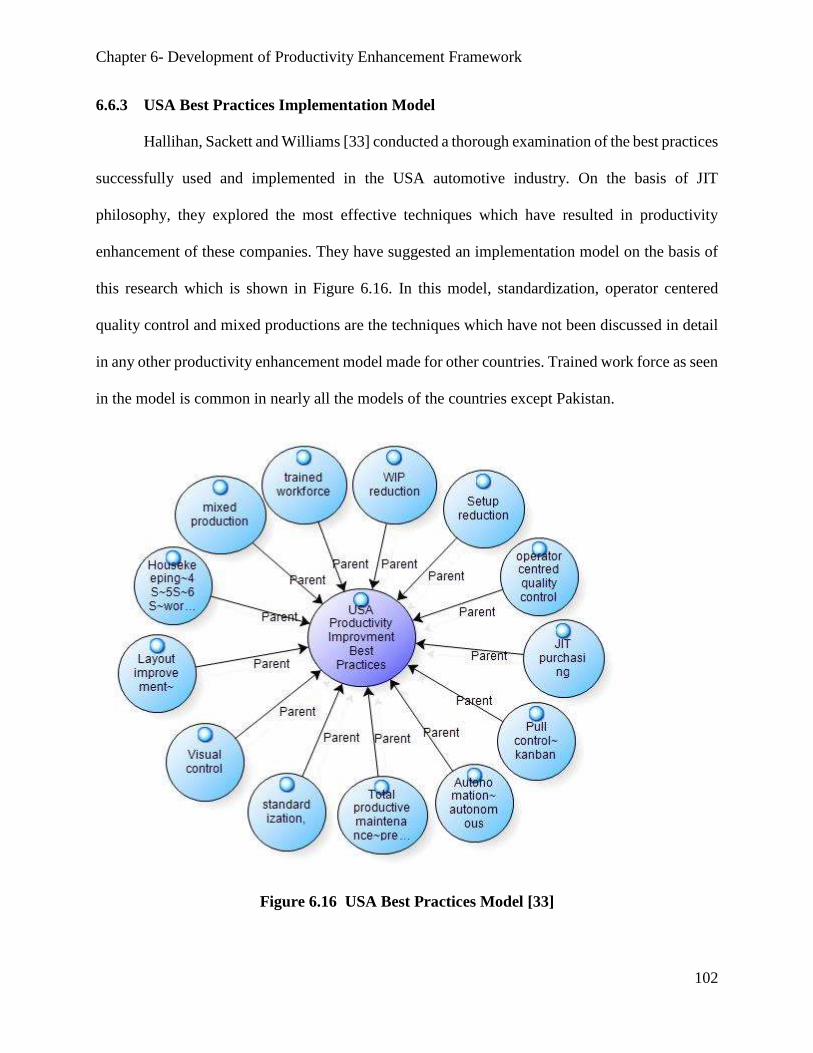
Chapter 6- Development of Productivity Enhancement Framework
102
6.6.3 USA Best Practices Implementation Model
Hallihan, Sackett and Williams [33] conducted a thorough examination of the best practices
successfully used and implemented in the USA automotive industry. On the basis of JIT
philosophy, they explored the most effective techniques which have resulted in productivity
enhancement of these companies. They have suggested an implementation model on the basis of
this research which is shown in Figure 6.16. In this model, standardization, operator centered
quality control and mixed productions are the techniques which have not been discussed in detail
in any other productivity enhancement model made for other countries. Trained work force as seen
in the model is common in nearly all the models of the countries except Pakistan.
Figure 6.16 USA Best Practices Model [33]
Chapter 6- Development of Productivity Enhancement Framework
103
6.6.4 Chinese Productivity Model
A survey was conducted in Chinese manufacturing sector to determine the state of
prevailing best practices and future plans of these companies for better performance and
productivity. Pyke, Farley and Robb [37] reported 16 best practices successfully adopted and
implemented in these manufacturing units, as shown in Figure 6.17. Automated assembly lines
and automation in production have been reported and emphasized separately in this model.
Electronic Data Interchange (EDI) has been discussed in several research works conducted in
china. However, all other computerized concepts discussed in this model as well, like EDI can
be a part of Enterprise Resource Planning (ERP) instead of being addressed separately.
Figure 6.17 Chinese Productivity Enhancement Techniques Model [37]
6.6.5 Indian Manufacturing Improvement Strategies
After studying the productivity improvement models of the developed countries, an effort
was made to study and analyze the top 10 productivity improvements techniques (out of 26 listed)
and the best practices implemented in developing countries. Laosirihongthong and Dangayach [36]
jointly conducted an empirical research on two industrial countries, India and Thailand. In India,

Chapter 6- Development of Productivity Enhancement Framework
104
they conducted survey in 68 automotive companies to find out the best improvement strategies
utilized in these companies. Total Quality Management (TQM) was the technique which showed
the major impact as improvement strategy. Majority of the respondents was of the view that TQM
is the best technique to bring about improvements in automotive manufacturing company.
Amongst these, automation was the least liked practice. Researchers reported that companies in
developing countries were more focused on labor intensive practices than full automation. The
model generated for this research is shown in Figure 6.18.
Figure 6.18 Indian Automotive Industry Best Practices Model [36]
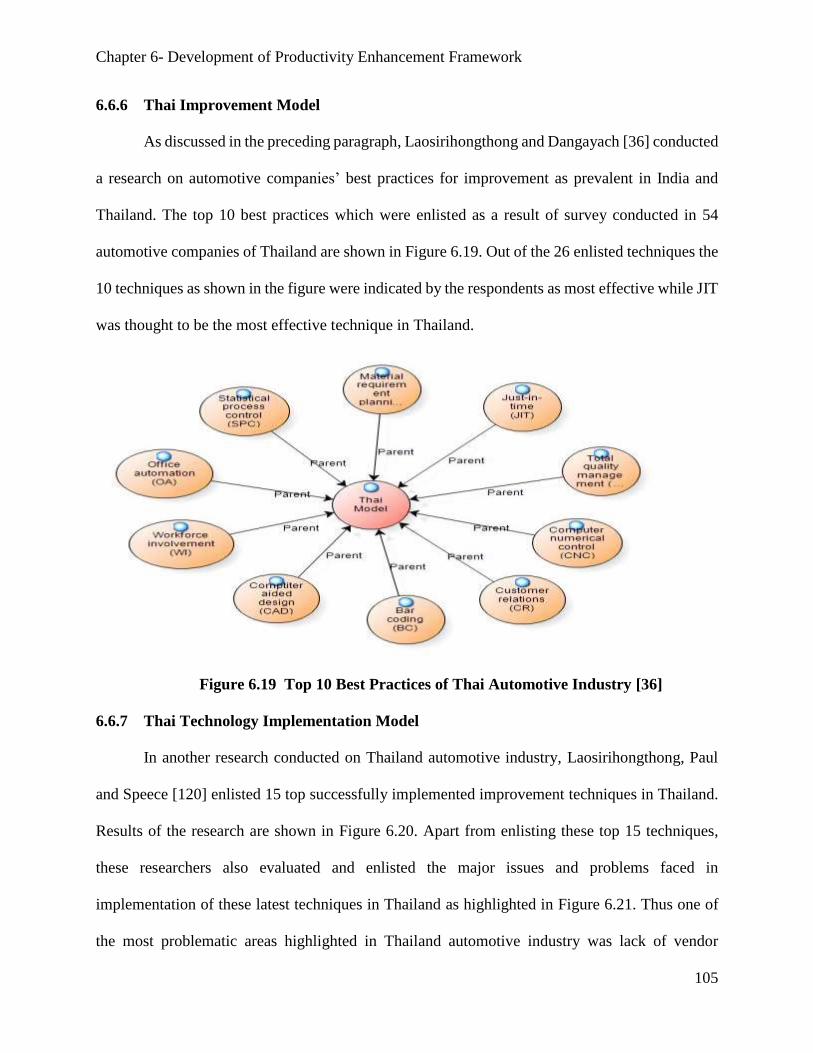
Chapter 6- Development of Productivity Enhancement Framework
105
6.6.6 Thai Improvement Model
As discussed in the preceding paragraph, Laosirihongthong and Dangayach [36] conducted
a research on automotive companies’ best practices for improvement as prevalent in India and
Thailand. The top 10 best practices which were enlisted as a result of survey conducted in 54
automotive companies of Thailand are shown in Figure 6.19. Out of the 26 enlisted techniques the
10 techniques as shown in the figure were indicated by the respondents as most effective while JIT
was thought to be the most effective technique in Thailand.
Figure 6.19 Top 10 Best Practices of Thai Automotive Industry [36]
6.6.7 Thai Technology Implementation Model
In another research conducted on Thailand automotive industry, Laosirihongthong, Paul
and Speece [120] enlisted 15 top successfully implemented improvement techniques in Thailand.
Results of the research are shown in Figure 6.20. Apart from enlisting these top 15 techniques,
these researchers also evaluated and enlisted the major issues and problems faced in
implementation of these latest techniques in Thailand as highlighted in Figure 6.21. Thus one of
the most problematic areas highlighted in Thailand automotive industry was lack of vendor

Chapter 6- Development of Productivity Enhancement Framework
106
capability. This point is in line with the research findings of my research according to which vendor
incapability results in several issues including JIT implementation in Pakistan also. Similarly,
skilled workers issues and resistance from workers as highlighted by them are also in line with the
results of my research. Moreover, over-estimation of utilization, which actually means
underutilization of capacity and capabilities of equipment in particular and of company in general,
is one of the major issues in Pakistan industry as well.
Figure 6.20 Thailand Top 15 Automotive Improvement Techniques Model [120]
Figure 6.21 Problems Faced in Implementation of Latest Techniques in Thailand
Automotive Industry [120]

Chapter 6- Development of Productivity Enhancement Framework
107
6.6.8 Strategic Productivity Improvement Framework
McTavish et al. [44] emphasized that localized productivity enhancement models are not
the only solution to the problems face by the industry. Rather they suggested a generalized strategic
productivity improvement framework. Their framework is given in Figure 6.25. They emphasized
on management techniques generally used in the manufacturing industry for productivity
improvement but they also highlighted the neglected softer issues from the BoK i.e. job satisfaction
of employees.
Figure 6.22 Productivity Improvement Strategies Framework [44]

Chapter 6- Development of Productivity Enhancement Framework
108
6.7 Proposed Productivity Enhancement Framework for Pakistan
Automotive Industry
Sumanth [4] amply differentiated between production and productivity and also
highlighted that the proposed and developed productivity enhancement models, as given in the
literature review, have mainly focused on performance at their core instead of productivity. This
argument started a new field of model and strategies development, specifically focusing on
productivity. In 2005, Tangen gave the concept of PPP model [26], [27]. In his model clear
demarcation between performance, profitability and productivity was made. This study also
triggered several new research paradigms. Researchers all over the world started investigating and
exploring the best practices which could lead to productivity enhancement for a company. From a
generalized scope of manufacturing techniques, researchers started focusing on specific industries.
Automotive industry also received a lot of research and investigation in this field. Researchers [44]
emphasized a lot on generalized models for the world, instead of making localized models. This
kind of strategies showed failure results in industries all over the globe. These results compelled
the researchers to go for local specific or at least country specific improvement models. This
research is also a continuation of these endeavors started all over the world.
As a result of the field survey conducted on the automotive industry of Pakistan and having
compiled the responses of 40 top ranking management individuals of this industry, the following
four models emerged :-
1. Utilized productivity enhancement techniques and technologies Model
2. Proposed productivity enhancement Model by the experts
3. Future Planning for productivity enhancement
4. Problems faced in implementation of latest techniques and technologies
Chapter 6- Development of Productivity Enhancement Framework
109
These models gave a very clear understanding of the prevailing condition of the industry
and also the future plans of the top management of the industry. But once these models were cross-
checked and analyzed, it was found that there were huge gaps between: the prevailing practices in
the industry; the problems faced in the industry, opinion on what should be the productivity
enhancement model of this industry and specially the future plans of these experts. For example
the problem of resistance by the people, non-availability of skilled manpower, less educated work
force and vendor in capabilities were highlighted as the core issues in implementation of latest
techniques and technologies resulting in slag in improvement activities. But very strangely, it was
found that there were no remedial actions against these sore issues in the future plans of these same
individuals. It is believed by the researcher that the core issues that create hindrances in the
productivity improvement must be dealt with as top priority. Therefore, I have included all these
remedies in the proposed productivity enhancement framework of this research.
Secondly, the theory generated as a result of this study was substantive theory as explained
earlier in this chapter. In order to formulate a formal theory, these models were compared with the
already established models in the literature. For this purpose, three models each, developed for the
developed and developing countries were selected. The developing countries selected for the
purpose were India, China and Thailand as all these countries came into being within
approximately similar time frame and have had circumstances quite similar to those of Pakistan.
Furthermore, almost all these countries are also neighboring countries. The close comparison of
these models with developed models of this research gave the final shape to finally proposed
framework.
Figure 6.23 shows the finally generated productivity enhancement framework for Pakistan
automotive industry. This framework looks complicated at first sight, but it actually indicates only

Chapter 6- Development of Productivity Enhancement Framework
110
12 major techniques and technologies which can impact productivity enhancement directly. Other
models in the world generally comprise of 10 to 15 most appropriate techniques for the local
industry. A major flaw indicated in the previous models is that only name of a technique like TQM
is given, whereas TQM is a complete philosophy. Researchers of those studies have not indicated
as to what are the suitable practices, specially focusing on two to three for easy comprehension
and implementation by the industrialists. In this research, apart from giving 12 major techniques
and technologies proposed for the framework, a further detailed description of the sub categories
of these techniques have also been given. These twelve techniques are given below
1. Human Resource Development (HRD)
2. Modified Lean Manufacturing (JIT) and Optimization Techniques
3. Total Quality Management
4. Agile Manufacturing
5. Supply Chain Management System Implementation & Enterprise Resource Planning
(ERP)
6. Total Productive Maintenance
7. Total Productivity Management
8. Computer Aided Design and Computer Aided Manufacturing
9. Partial Automation and induction of latest Equipment
10. Energy Audits
11. TRIZ
12. Autonomous Development

Chapter 6- Development of Productivity Enhancement Framework
111
Figure 6.23 Productivity Enhancement Frameworks for Pakistan Automotive Industry

Chapter 6- Development of Productivity Enhancement Framework
112
6.7.1 Human Resource Development (HRD)
As empirical based results show in this study, human resource resistance is the major
problem in implementing the latest techniques and technologies in Pakistan automotive industry.
Unfortunately, this aspect has not been covered in the future plans model given by these top
management people. In this model the concept of human resource development (HRD) has been
incorporated. Mostly in these organizations the HR department is thought to be responsible of
hiring and firing only. Therefore, important concept of HR development is neglected.
Training has the major role to play in order to overcome the issues of non-availability of
skilled manpower. With training the present manpower can be trained to achieve the desired skills.
Cross training of the individuals is another neglected aspect which has to be incorporated.
Secondly, hiring educated workforce can help resolve the issues. In this industry the strength of
educated manpower is very minimal. In automotive companies especially in the vendor companies
where hardcore engineering is being practiced, problem prevailing is deficiency of and lack in the
number of engineers being hired.
6.7.2 Modified lean manufacturing (JIT) and optimization techniques
“Modified JIT” is another new concept in the findings of this research. Despite intensive
literature review conducted on the topic, researcher has been unable to find any proof of presence
of this term in the BoK. This terminology actually means modified JIT inventory. This concept
has evolved in the past two decades. Organizations of this industry faced several problems due to
low inventory levels as the JIT Inventory explains. Millat tractors (Massey Ferguson), Pak Suzuki,
Al Ghazi Tractors (Fiat) have suffered enormously due to non-availability of spares resulting from
low levels of inventories held. JIT concept explains and desires minimum possible inventory levels
and even claims Zero Inventory levels. This aspect has failed badly in Pakistan industry. Pakistan
Chapter 6- Development of Productivity Enhancement Framework
113
is not very advanced in materials development. Mostly raw materials used for parts manufacturing
are imported. These imports also have flaws that results in a situation when raw materials are very
hard to find or are very rarely available in Pakistan. These shortages of materials during several
diverse times during a year badly hamper production line. In order to avoid this shortage of
supplies, vendors have to keep very high level of inventories so that OEM production does not
suffer. Huge finances are required for this purpose, and there are very few organizations in Pakistan
which have such kind of finances available. This is a major cause of hindrances in supplies owing
to which top management of auto assembler companies complaint about vendor in-capabilities. In
response to these problems, Pak Suzuki increased its inventory stock levels of local manufactured
parts from 3 day to 7 days and then from 2 weeks to now of 28 days. Only this strategy has worked
for Suzuki. Similar findings were reported by Millat and Al Ghazi Tractors as well. This is the
reason why “Modified JIT” terminology has been used. Another reason of short supplies is that
most of the parts manufacturers possess very old machinery and their maintenance systems are
also poor. These problems accumulate and result in line stoppage several times. These down times
also result in short supplies to auto assemblers resulting in production losses and overall low
productivity of the organization. Hence Modified JIT inventory levels have been suggested for
Pakistan in this model.
Another aspect which has been highlighted by nearly all the respondents and also is evident
from the previous productivity enhancement models of other countries is ‘optimization
techniques’. These techniques are less capital intensive and if properly implemented, give
remarkable results. On the basis of empirical analysis, some most prominent optimization
techniques have been suggested in this model. These techniques have emerged as major themes in
qualitative analysis of the data and previous models. These techniques include plant layout
Chapter 6- Development of Productivity Enhancement Framework
114
improvement and work assignment strategy, which enhances productivity with only some minor
changes in the existing equipment and facilities held. Supplier partnering strategy is another
optimization technique which is one of the most neglected areas in Pakistan automotive industry.
Suppliers are not considered as partners rather they are considered as smaller organizations with
lesser importance. This attitude of the assemblers and even vendors to their vendors create big
gaps between these organizations, which result into several quality issues. All these issues can be
resolved and optimization of the capabilities held can be achieved by considering the suppliers as
partners. Similarly, materials optimization is a neglected area, as material is the basic input so
saving material input results in better results. Same is the case with tools and inserts optimization.
Kaizen technique was basically emerged from Japanese manufacturing practices. It is one
of the most adopted and accepted techniques in both manufacturing and services sectors.
Continuous improvement methodology, if inculcated up to the operator level, results in huge
productivity gains. In continuation of this strategy, another technique used is reduction of
wastages. This was the most discussed and emphasized technique in the data gathered from the
respondents of the study. In Pakistan wastage reduction is the most expansive area which needs a
lot of efforts. The famous 7 wastes include: overproduction, waiting, transportation, non-value
added processing, excess inventory, excess motion and defects. The biggest waste in Pakistan
automotive industry is underutilization of capacity. Optimization techniques discussed in this
model will result in elimination of these wastes and will result in better productivity.
Pull system strategy is one of the core strategies of Toyota Production System. In this
strategy, quick change over methodology is used which ensures minimum non-operational time of
the equipment and manpower. Quick changeover means changeover of dies and fixtures resulting
in flexible manufacturing. Minimum setup time is also essential for successful implementation.
Chapter 6- Development of Productivity Enhancement Framework
115
Heijunka technique is also part of this system which means level scheduling. Techniques like these
are not very commonly known to our industry but can make drastic changes with very minimal
cost effect. Proper production planning is essential to implement this technique and get the desired
results. Takt time is another part of this strategy in which process time of each part is set to meet
the production requirements of the complete cell. It is number of minutes consumed in producing
that part as per requirement. This technique is also very accurate and requires no investment.
Similarly Kanban technique is also used which results in pull strategy success.
‘Support the worker’ is a terminology used and adopted in several developed and
developing countries of the world. In Pakistan, giving pay in time, giving food during duty hours
and ensuring accommodation for the workers are the best utilized techniques. There are several
other soft issues which have been neglected in the Pakistan industry. Even several other models
proposed for productivity enhancement in the past do not cover these soft issues of organizational
behavior. In this research, a new addition to the model for productivity enhancement has been
included; the soft issues discussed and proved from the evidence based analysis are job satisfaction
and job security. A lot of research has been conducted in the recent past on the issues of job
satisfaction. Organizations need to promote job satisfaction in their employees in order to prevent
job withdrawal and boost productive performance. Despite proofs and findings of research from
several different countries and cultures, this important aspect of workers job satisfaction has not
been properly emphasized in the prevalent productivity enhancement models. The responses of the
participants and literature survey have proved that ensuring job satisfaction of the workers result
in enhanced productivity. Another major aspect explored is the issue of job security in the industry
as found out during informal interviews of the worker of the industry. It has been found that due
Chapter 6- Development of Productivity Enhancement Framework
116
to job insecurity issues in Pakistan automotive industry, especially in the vendor companies,
workers are not performing at their best resulting into lower productivity of the companies.
Process analysis approach was observed to be the most successfully used technique in some
of these organizations and was producing good results. All organizations need to make use of this
technique because it not only gives remarkable results but is also a cost effective methodology,
considering the fact that finances is a major issue for vendor industry especially. This process
analysis approach is not time bound; rather, it is an ongoing process for continuous improvement.
6.7.3 Total Quality Management (TQM)
In developing countries, TQM has proved to be the most effective productivity
enhancement technique. TQM has been adopted in several organizations but unfortunately the
complete philosophy of TQM has not been implemented in true sense in Pakistan. This is the
biggest drawback in Pakistan automotive industry. It is, therefore, necessary to implement this
philosophy for better productivity. Generally it is falsely understood in this industry that getting
the company ISO certified means TQM implementation. On the contrary, it is a continuous
process, incorporating statistical process control tools and the major concept of quality assurance.
Failure Mode Effect Analysis (FMEA), POKA YOKE (mistake proofing), visual controls and
techniques like 5S implementation are very necessary for quality assurance. In most of the
productivity enhancement models, only TQM word is used without emphasizing and elaborating
upon the techniques which must be incorporated like PDCA cycle. In this model this aspect is
therefore elaborated.
6.7.4 Agile Manufacturing
Lean methodologies have been considered as the most suited practices especially in the
automotive industry all over the world. However, ReVelle [121] indicated that lean techniques are
Chapter 6- Development of Productivity Enhancement Framework
117
old, whereas agile manufacturing techniques are the latest trend setter for productivity
enhancement. He further explained that Agile Enterprise concept is past-lean production paradigm.
Agility is a concept very largely investigated in the recent research studies [54]. This concept has
been discussed in all kinds of setting like services and manufacturing. Agility is concerned with
being flexible enough to accommodate change, explore and also take advantage of the
opportunities posed by the new requirements. Agile practices are basically built on lean practices
with addition of quickness to adopt and accommodate change. The main strategies of agile
enterprise take the enterprise towards being a “niche enterprise”, knowledge based enterprise and
agile (or adaptive) enterprise [121]. Niche enterprise is able to adopt diversity at a quick pace.
Knowledge management is a field which has made an impact on all the fields known to mankind,
and agile philosophy incorporates a never ending knowledge enhancing quest. Being adaptive to
change is the third most important pillar of agile enterprise.
These agile philosophies are the key to success in the prevailing global business scenario.
Researchers have talked about flexible manufacturing in the past but in this model agile
manufacturing and agile concepts have been incorporated. No such precedents were found in the
literature despite extensive survey of the previously proposed productivity enhancement models.
Several agile manufacturing tools and matrices have been proposed to incorporate this agile
philosophy [121]. These tools and matrices are not capital intensive and can give desired results
in a very short span of time. Owing to this aspect specifically, this dimension has been added in
this productivity enhancement framework.
Activity/cost chain is a tool which is extension of activity based costing (ABC). Costing is
a very sore issue in Pakistan automotive assemblers and parts manufacturing companies. Reason
behind this problem is again not hiring educated experts of the field. Very few companies have
Chapter 6- Development of Productivity Enhancement Framework
118
hired ACMA qualified individuals. Mostly costing is done by individuals having M.Com, B.Com
or MBA degrees. ACMA qualified individuals must be hired and they can use activity/cost chains
to resolve the issue. Transactions analysis is another major tool of agile technique which is
interview based studies and research work which highlights how an enterprise is operating. These
tools and concepts are far from even conception in this industry apart from being implemented.
Furthermore, Organization maps can help a company understand the place and relationship
between suppliers and other stake holders of the business. Key Characteristics (KCs) are basically
the most important of the product features which are marked specially to be incorporated for
customer satisfaction. Flexible manufacturing is highlighted specially in this model as this aspect
can enhance productivity of the organizations. By implementation of these techniques, drastic
productivity enhancement can be achieved.
6.7.5 Enterprise Resource Planning (ERP) and Supply Chain Management system (SCM)
The biggest issue observed in these industries was lack of implementation of Enterprise
Resource Planning (ERP) and Supply Chain Management system (SCM) techniques. Most of the
top management claimed that they used these techniques in their industry but the on-ground
verification gave different results. As the researcher was part of the industry, therefore, along with
ethnographic observation, the participant observations were very close to reality. Without naming
these companies here, it can easily be stated that though ERP software is purchased but on-ground
implementation is missing. SCM is used as a name of the department but basic principles and
methodologies which give actual results are far from being implemented in these organizations
except for the foreign collaboration companies like Indus Motors and Honda Atlas. Even in these
organizations, a lot of efforts have to be put in to take full advantage of these techniques.

Chapter 6- Development of Productivity Enhancement Framework
119
6.7.6 Total Productive Maintenance (TPM)
TPM has been successfully implemented in several manufacturing companies of Pakistan
like Pakistan Tobacco Company. As the poor maintenance issues were highlighted by most of the
respondents, therefore it is strongly believed that TPM implementation can drastically improve the
production and productivity of these organizations as proved in literature. It also is a less capital
intensive technique.
6.7.7 Total Productivity Management (TPmgt)
As per the results of this research, it has been explored that there is not even a single
organization in Pakistan automotive industry where Total Productivity Management (TPmgt) has
been implemented. On the contrary, people do not have any knowledge about this philosophy. In
order to enhance productivity TPmgt have to be implemented. It incorporates productivity
measurement, evaluation, planning and improvement practices. Even if TPmgt is not implemented
as a whole at least some productivity department is a must in every organization. Without
measuring, evaluating and planning, productivity cannot be improved which is the core of PPP
model. So it is strongly suggested that every automotive organization must have some people hired
for the job who measure, evaluate and plan productivity improvement. In larger organizations, a
complete productivity department must be incorporated which may require a time span of 2 to 3
years.
6.7.8 Computer Aided Design (CAD) and Computer Aided Manufacturing (CAD)
It has been observed that CAD and CAM methodologies have been implemented a lot but
still there is a dire need to have CAD/CAM philosophy implemented which can further enhance
the capabilities of these organizations. CAD/CAM philosophy is a methodology used successfully
in other manufacturing units of Pakistan like public sector organizations. This philosophy reduces
Chapter 6- Development of Productivity Enhancement Framework
120
the gap between CAD and CAM through which more harmonized production can be attained. This
methodology can be implemented within a time span of two years.
6.7.9 Partial Automation and Induction of Latest Equipment
“Some automation” is the terminology used by several respondents once they were asked
about the prevailing productivity enhancement practices. Full automation is the technique mostly
used in developed countries where a lot of automotive manufacturing plants have been fully
automated. Likewise, several auto parts manufacturing plants have also been mostly automated.
The main reason for adoption of this technology in western settings is owing to high labor rates.
Todaro and Smith [1] explained that developed countries utilize capital intensive technologies due
to more finances available. On the contrary, developing countries mostly focus on labor intensive
technologies, as in these countries financial constraints and low labor rates incline the decision
makers towards these options.
Pakistan is also a developing country so as per this economic theory it is eminent that labor
intensive technologies should be empathized for obvious reasons. Considering these aspects, it is
understood why “some automation” terminology was used by most of the respondents. Even
Pakistan Suzuki Motors (PSMCL), having its principle at Japan, has not installed full automation
in Pakistan as only its Paint shop and assembly line track system is automated. Apart from these
systems, there are very less and partial processes which are automated in the whole organization.
Similarly several auto parts manufacturers have adopted very partial kind of automations.
However, inductions of latest equipment have been found very important and eminent aspect.
Several manufacturers are inducting CNCs and latest test gadgetries like CMM. However, most
successful organizations, especially in China, have very limited investment in expensive
automation machines. These companies invest on economical machines to give them some
Chapter 6- Development of Productivity Enhancement Framework
121
automation. So with less investment, nearly similar results are achieved as can be with expensive
equipment. Timeframe for implementation of this concept depends on the finances available with
the organization.
6.7.10 Energy Audits
In-house power generation is an aspect that has emphatically emerged in the industry in
recent times owing to the prevailing energy crisis in the country. This aspect is essential for all the
industry. Multinational firms like Suzuki Motors have also incorporated in-house power
generation in current financial year. Non availability of electricity is resulting in line stoppage of
these companies for days and days. Hence, in-house power generation capability is a must for
better productivity of these organizations. Its shortage results in low overall equipment efficiency
and plant efficiency. One of the most important aspects before going for in-house power generation
is carrying out energy audit of the company so that energy wastages can be reduced and actual
energy requirement can be computed. This aspect needs a study of 2 to 3 months only.
6.7.11 TRIZ
Innovation and creativity is in the soul of human beings. Unfortunately these aspects are
not given due importance in manufacturing, especially when routine productions and operations
are concerned. TRIZ is terminology invented by Genrich Altshuller, a Russian (1926-1998) who
made several new discoveries in the field and gave numerous tools for TRIZ implementation [121].
TRIZ is Russian terminology, translated as the theory of solution of innovative problems.
Innovation and creativity are two strongest concepts in the core of TRIZ. In order to use innovation
and creativity techniques in an organization, empowerment and freedom of thinking are the most
promising and foremost requirements. Unfortunately, in manufacturing as a whole and automotive
manufacturing specifically, employees have to follow strict orders. This is the main reason that
Chapter 6- Development of Productivity Enhancement Framework
122
not even a single productivity enhancement model proposed in the past, possess these strong
techniques. Mentors of the automotive industry e.g. Henry Ford gave great importance to
innovation and creativity and achieved remarkable enhancement results. Considering these
aspects, it has been suggested in this model that TRIZ should be implemented in Pakistan
automotive industry as a strategy while giving empowerment to the employees at all tiers for
productivity enhancement.
6.7.12 Autonomous Development
Being a participant observer of one of the companies of this industry and being
ethnographic researcher for most of the other companies of the same industry, the researcher
conceptualized that instead of trying to increase the existing R and D section or to establish two or
three of these sections, the best option to adopt is “Autonomous Development”. As per this new
concept, every production section can be given a small in-house team which can develop new
processes and products which are similar to the parts already in production. Actually, a huge
diversity can be seen in Pakistan automotive parts manufacturing companies. A single organization
is producing parts like flywheels, brake discs, brake drums, exhaust manifolds, clutch assemblies,
tie-rod ends for different assemblers. Similarly, one organization is not only producing parts of
casting but is also producing sheet metal and die casting parts. Generally people in the world are
going for specialization. However, in Pakistan not a very large number of auto parts producers
who can produce quality parts consistently are operating, so OEM assemblers are focusing on the
big parts manufacturers only. Owing to this aspect, these parts manufacturing companies are
diversifying continuously to enhance their market shares. Considering this scenario it was felt that
these different sections can be given teams to develop new processes and improve those without
taking help from R & D sections. In-charge of each production section, line heads and operations

Chapter 6- Development of Productivity Enhancement Framework
123
engineers of these sections can actively participate in these development activities apart from
looking after productions. In this way, with very less financial inputs, time to market can be greatly
decreased because specialization of these production people can be utilized in producing new
similar kind of parts and processes. Only one year is required to implement it in complete sense.
Unfortunately, development philosophies are not incorporated in the existing productivity
enhancement models. It is felt that incorporation of this new concept along with existing
development techniques will result in huge productivity gains. It was also established that labor
unions are not playing positive role in these organizations and, as a matter of fact, are having
negative impact on the productivity. Therefore, maximum efforts should be made to either
eliminate these labor unions or their role should be directed towards positivity which will result in
better productivity.
Chapter Summary
Open coding and some steps of axial coding were done in the previous chapter. In this
chapter selective coding was done as suggested by Strauss and Corbin [108] in order to develop
the final theme. For selective coding advanced coding queries comprising of Matrix coding query,
group coding query and coding comparison query were run. The main purpose was to develop
productivity enhancement framework for Pakistani automotive industry. Firstly, with the help of
this methodology productivity model of prevalent best practices of this industry was developed.
Another model was developed to show the problem faced by this industry in implementation of
latest techniques. These models were then compared with the productivity enhancement models
of USA, UK, China, India, Thailand and Sweden. Comparison showed several gaps in the model
followed in Pakistan. One example of the gap was emphasis of Pakistani organizations on ISO
Certification only without proper step by step on ground implementation of TQM Philosophy.
Based on this comparison finalized productivity enhancement framework was developed. Being a
developing country and labor intensive culture the best practices used in the world which require
less capital providing maximum output were suggested. Suggested model was then explained point
wise in order to give the clear picture of the suggestions made.
Chapter 7- Implementation Methodology
124
CHAPTER 7
IMPLEMENTATION METHODOLOGY
In the previous chapters, it has been discussed that how productivity enhancement
framework was developed from the survey data collected from respondents. The comparison of
this framework was done with the previously established productivity enhancement models for
automotive industries of different countries and ultimately, a finalized productivity enhancement
framework emerged. In order to validate the concepts of the framework, implementation of these
concepts was done in XYZ company (name of the company is hidden due to secrecy of the
company records. XYZ (Pvt) Ltd is one of the largest auto parts manufacturers in Pakistan
automotive industry that has also been enlisted in Top 100 fastest growing organizations in
Pakistan in 2012. Pakistan Suzuki Motors Corporation and Millat Tractors have given the best
partnership (vendor) award this company several times in past few years. This organization has
revenues in Billions of Rs per annum. Another reason to choose this organization was that the
researcher was closely linked with this company and thus had the leverage to get these techniques
and technologies implemented in real time productions and operations.
7.1 Stage wise Implementation
The proposed framework was implemented stage wise, as this implementation required
complete cultural change. Bringing about such a change in any organization is one of the most
difficult tasks. The biggest challenge faced in this context is resistance from the employees [120]
as also found in the results of the data gathered during survey of this research. Secondly, as
highlighted in chapter 6, top management of these organizations is of the opinion that the biggest
problem faced in implementation of these technologies relates with manpower. Stage wise
implementation will be discussed concept wise in the preceding paragraphs.
Chapter 7- Implementation Methodology
125
7.2 Human Resource Development
Once the researcher joined this company, the first problem observed was nonexistence of
educated manpower in the required places. Despite being one of the biggest engineering
organizations in Pakistan, it lacked presence of engineers on the shop floor. Hence the first and
foremost step taken was induction and placement of engineers on the shop floor. This is certainly
the most difficult task in Pakistani organizations especially in the vendor industry. Maximum
qualified employees looking after production and operations in these companies are diploma
holders i.e. DAEs. These engineer associates are most powerful people in productions and also
have the maximum strength in number as well as in influence. Several foremen of the production
sections are even less educated. The fear of job security compels them to ensure that people who
are more educated and competent than them should not be hired or, if at all hired, should not stay
in the organization, particularly in their sections. Such organizational politics gives rise to
numerous issues and problems within the organization. Given this scenario, several attempts to
induct engineers on the shop floor failed in the past. Knowing the past history, a complete work
plan was made in order to execute this implementation successfully. The implementation
guidelines and methodology is given in the succeeding paragraphs. Any organization whether
manufacturing or services, can use a similar methodology to bring about successful cultural change
in their respective organizations. Apart from hiring engineers, educated and skilled manpower was
hired at all tiers, right from operators to managers. Previously, the operators hired were mostly
uneducated as they take less pay. After the change of rules, at least diploma holders or people with
some educational back ground were hired in order to ensure better job performance. Similar policy
was adopted regarding supply chain management people and computer operators. These aspects
have to be addressed for better productivity results and it will take maximum one to two years for
implementation.

Chapter 7- Implementation Methodology
126
7.2.1 Methodology of Engineer’s induction and placement in an organization
Fresh engineers form the newly passed courses should be given priority. This is because
new engineers can easily be adjusted into the organizational culture instead of trying to change an
old engineer. Fresh engineers have the motivation and stamina to forego the agonies of the early
days, especially if the organization does not have engineers as per their previous record. Engineers
with more experience can be hired at a later phase if deemed necessary. In order to retain these
engineers, the organization must hire one engineer as senior level manager to whom they would
be reporting and are looked after.
7.2.1.1 Introduction Stage
Introduction visits needs to be arranged for engineering students. The best way to do this
is to collaborate with main engineering universities in the area and invite them for industrial visits.
As a general practice, most of these institutes also write continuously to the organizations and
request for the permission to bring their students for such visits. Internships requests from the
universities should be entertained and at least two engineers must be doing internship in the
organization as frequently as possible. These internees can be assessed very easily during this
period and can be offered a job if found competent and hardworking. This way the whole costly
process and exercise of hiring, interviews and induction can be eliminated. Still if requirement
arises, proper hiring procedure can be undertaken and engineers can be interviewed and hired on
three month probation period.
7.2.1.2 Appropriate Strength
If engineers have not been hired in the organization previously, at least a group of 3 to 4
engineers should be hired. This group can be a mix of mechanical, mechatronics, electrical and
electronic engineers in accordance with the requirement of the company. The reason for this group
Chapter 7- Implementation Methodology
127
concept is that single engineer runs away if left alone. Group activities give them strength to face
the difficulties posed by the shop floor individuals, workers and foremen. All efforts must be made
not to hire a group from the same class and if possible not from the same university, at least in the
beginning.
7.2.1.3 Diffusion Methodology
Smooth diffusion of these engineers (trainees) into the existing system may be ensured in
two phases.
Phase I
1) An extensive on job training of 3-6 months (depending upon the tasks assigned,
which will require continuous evaluation).
2) No authorities to be delegated to the trainee engineers in Phase I.
3) Trainees should work under the supervision of floor managers or shop floor
supervisors, who will be responsible for their effective training.
4) Trainees must work on the machines with their own hands.
5) Working with their own hands does not necessarily means producing parts on
regular basis like machine operators; rather this practice should be taken as an
exercise for better understanding of the procedures and processes of
manufacturing.
6) While working on the shop floor, trainee engineers must closely interact with the
working staff and floor managers to enhance cordial relationships and understand
their problems and agonies.
7) Under no circumstances should the trainee engineers get harsh or try to show
bossy attitude to the staff/floor managers.

Chapter 7- Implementation Methodology
128
8) In case of any problem or unwanted situation, trainees must report to Senior
Engineer hired at the post of Manager or General Manager for guidance and
support to solve the issues at hand.
9) Trainees must always have a note book and a pen and must take notes of any flaw
or unwanted activity in the processes. They should endorse some suggestions for
improvement of processes every day.
10) They should submit summary of daily notes to the senior engineer.
11) Progress of these trainees should be monitored continuously. They should be
given assignments on regular basis e.g. downloading details about the machine
and processes the trainee is working on, making operating procedures of the
machines and processes in witting, drafting list of safety checks/ precautions to
be ensured in a process etc.
12) Based on these points they would be giving a presentation to the Board of
Directors/ Director or senior management on weekly basis for the first month and
after that on monthly basis.
13) Rotation of trainees into different departments should be monitored by senior
engineer personally.
14) Before sending these trainees to any department, floor managers must be briefed
personally by Board of Directors/Director about the need and advantages of
having these engineers in our organization. (The main reason for this practice is
to curb any tendency of retaliation or negative impact about this most wanted and
needed addition).

Chapter 7- Implementation Methodology
129
Phase II
1) Trainee engineers can be given the post of Operation Engineer of minimum 1-2
departments after completion of first 3 to six months (depending on the
complexity and nature of the job).
2) First pay increment should be authorized at this stage.
3) Trainee mechatronics and electrical engineers can be given the responsibility of
establishing an in-house repair and maintenance department of CNC machines,
and subsequently given the role of repair and maintenance engineers.
4) Trainee mechanical and industrial engineers must be given production sections
and they must report on the continuous improvements done in their sections.
5) Job description/job design should be finalized before the end of the stipulated
training period.
6) On completion of one year period these engineers should be promoted to the
appointment of assistant managers. After another two years time they can be
promoted to the appointment of deputy manager. On completion of 6 years they
can be given Manager Post.
7.2.2 Training
Training is mostly thought to be an activity for the beginners especially in Pakistani
organizations. However, this is the biggest misconception, as training is an ongoing process for
every individual of an organization from top to bottom. For new induction at any appointment in
an organization, people do tend to train and guide the individual but as the time passes everyone
starts believing that they do not need any training any more. This aspect was specifically
concentrated upon. Apart from the on job training of the engineers and other work force and staff
Chapter 7- Implementation Methodology
130
special training sessions were run. Some training programs were conducted in- house and some
were outsourced. For engineers and operators, CNC programming training was most beneficial as
it gave instant results in the shape of better production, better efficiency of manpower and machine
and better quality products hence resulting into better productivity. Trainings of 5S
implementation, Kaizen methodology and layout improvements techniques also resulted in
marvelous results. Engineers were also given the opportunity to attend management courses from
best reputed universities in the evening on company expenses. Foreign tours to world re-known
manufacturing companies were conducted to learn the latest manufacturing techniques. Training
of computer operators was also carried out for better performance.
7.3 Modified JIT and Optimization Techniques
Modified JIT terminology has been discussed earlier in chapter 6 as well. Modified JIT
specifically refers to modified JIT inventory levels. JIT philosophy is advocate of zero inventory
levels. Nearly all big automotive assemblers and several auto parts manufacturers have
implemented JIT philosophy in Pakistan, but no organization has been able to achieve zero-level
inventories. The major reasons as explained earlier are: material shortages, poor infrastructure of
the roads and other communication means and non-capability of the vendors. Considering the
experiences of these organizations for past 20 to 30 years it is quite evident that every automotive
manufacturing or assembling unit in Pakistan has to adopt modified JIT. The inventory levels for
these companies now range from 15 to 28 days at least. Similar is the case with JIT manufacturing
for the similar reasons.
Optimization techniques were the terminologies most discussed and emphasized upon by
the respondents of this research. Almost all the respondents were of the view that the first and
foremost activity to be performed for productivity enhancement in Pakistan automotive industry
has to be use of optimization techniques. Several different terminologies and concepts were
Chapter 7- Implementation Methodology
131
discussed by the respondents regarding optimization techniques. Wastage reduction was the most
prominent one amongst them. It is generally believed that wastage reduction can drastically
improve the productivity of any organization. This aspect has further been strengthened by proofs
in the literature review about the issue. Existence of this technique in nearly every productivity
improvement model further augments the belief. Wastage reduction is very less capital intensive
and can give substantial results. Therefore, considering these points, several wastage reduction
techniques were used for productivity enhancement. Layout improvements are among the
optimization techniques which are believed to be the key in wastage reduction and productivity
improvement.
Most of the auto parts manufacturers in Pakistan grew from very small enterprises to
SME’s, while some have grown up to the size of large organizations. As these organizations started
from very small setups, their growth varied from time to time as per the market demand. For all
the growth stages, new machineries were added over a span of time without changing the layouts
of older machinery and equipment. This led to haphazard placement of the machinery and
equipment. Similar was the case at XYZ Company and several other auto parts manufacturing
organizations which were personally visited by the researcher. The international auto assemblers
like Toyota, Suzuki, Honda, Millat Tractors, Al-Ghazi Tractors and MEL had better plant layouts.
But it was felt that even in these plants a lot of older techniques are in practice and there is a dire
and urgent need for immediate improvement and better results. Most of these plants were planned
and established in last 80’s and big improvements has to be done in these plants as well.
Detailed process analyses of all the products manufactured at XYZ Company were carried
out to determine the flaws and bottlenecks. During these process analyses, it was found that a lot
of time and energy is wasted due to poor layouts. The machines are not placed as per the operations
Chapter 7- Implementation Methodology
132
to be performed on the products. Rather in due course of time as the machines were added those
were placed wherever the space was available. As a sample study, one section of this organization
will be discussed. The previous layout of the specific machines will be shown and discussed, and
then the new improved layout with benefits will be listed. The results of all these activities will be
discussed at the end.
The section which has been taken as a case study is named as flywheel section. This section
comprises of CNC machines (i.e. CNC Machining Center 3-axis and 4-axis, CNC turning /lathe)
and induction machines. All parts manufactured in this section are critical and require high
accuracy at the customers end, as these parts are supplied to OEM’s (Pak Suzuki, MEL, MTL and
FIAT). The parts being manufactured in this machining cell include fly wheels, brake drums, brake
discs and exhaust manifolds. Furthermore, oil pump and water pump of tractors are also
manufactured in this section. Several components like flywheels are single source components as
they are manufactured only in this organization for some of the make and type of cars
manufactured in Pakistan. The layout of this machining cell was functional type and all machines
were placed in the cell randomly. Owing to this unplanned layout, large number of problems used
to arise during production that caused rejections and also led to customer complaints. The problems
faced include following:
Time wastage
High work-in-process inventory
High labor cost
High rate of rejection
Parts mixing
Less Production

Chapter 7- Implementation Methodology
133
High parts movement within the cell
High Operator’s Fatigue
High Customer Complaints
The old layouts are shown in Figure 7.1 (a, b, c and d). The figures depict that these
placements were adding up to the issues as enumerated in the preceding paragraphs. Process flows
of these components are shown in blue and green colors. In order to overcome the above mentioned
problems, layouts of the manufacturing cells were changed. While developing and improving the
proposed layouts, the foot print areas of machines were taken according to perfect scale and total
shop floor space was measured. During the setting of machines sequence, the ergonomics and
cellular manufacturing concepts were incorporated. Time and motion study and work study of each
machining operation was done accordingly. The concept of Heijunka technique (level scheduling),
pull strategy, takt time methodology, quick change-over time methodologies were kept in mind
while finalizing the new proposed layout in order to achieve the benefits of these techniques. In
order to eliminate the 7 wastes, every location of the machines was drawn on AutoCAD and finally
a complete model was finalized as shown in Figure 7.2. Before changing the layout, a buffer stock
of spares of 14 days, manufactured on these machines, was maintained. All machines were
removed and after ensuring 4S of this area, marking was done on the ground and machines were
placed as per the planned layout.

Chapter 7- Implementation Methodology
134
Figure 7.1 a Old Layout of Flywheels Manufacturing
Figure 7.1 b Old Layout of Brake Drum type X Manufacturing

Chapter 7- Implementation Methodology
135
Figure 7.1 c Old Layout of Brake Disc Manufacturing
Figure 7.1 d Old Layout of Brake Drum type Y Manufacturing
Chapter 7- Implementation Methodology
136
The whole exercise took only two days and production on these machines started on the
third day. New layout is shown in Figure 7.2. Comparison of the old layout and the new layout
shows the remarkable difference. In Figure 7.3 zoom in view of the flywheel production line and
brake disc production line is shown. The new positions and old position of the machines are shown
with the help of arrows and circles. The upper line is of flywheel machines. The two and fro
movement of the in-process components are evident from the old layout. After first and second
operation, parts used to be taken to induction machines and after the ring fitment these were again
taken back for fourth operation. This was a complete waste of time and efforts and also resulted in
quality issues. Now, under the new arrangement, these machines are placed as per the operation
sequence as shown in new layout, resulting in minimum possible travel of parts with lesser
manpower required. Another thing added was trolleys, with which instead of picking up and
carrying, the items are now easily passed to the next operation resulting in lesser fatigue for the
workers as well. Similarly, machining centers were placed far away from the operations
requirement owing to which the to and fro movement was too much. Now, under new arrangement,
from first to the last operation all the machines are placed in line and smooth operations results in
better quality and improved productivity. Similarly in Figure 7.4 brake drum section is shown as
per new layout which is in sequential order. Previously these machines were mixed with the CNCs
of flywheel and brake disc operations. The new cellular arrangement results in smooth flow as all
the parts produced are checked, inspected and packed the same day. Still, in the new production
line, batch manufacturing concept is followed along with process analyses techniques in which
bottleneck operations are allowed more number of WIP then the other operation. The logic of this
arrangement is very similar to the modified JIT concept described earlier. Another technique used
while planning the layout was converting several CNC operations to conventional machines

Chapter 7- Implementation Methodology
137
operations. The main reason behind this methodology is the fact that CNCs are very expensive and
number of parts produced on CNC’s are less due to several small operations performed. Bringing
out the smaller and easier operations on to conventional machinery resulted in increased
production and also higher productivity. Similar exercises were conducted on all the sections and
improved productivity gains were achieved. Several other layouts are placed in annexure C. All
these changes were made in the existing factory.
Apart from all these continuous improvement methodologies, another highlighted area of
support for the workers was also explored and worked upon. First, a survey was conducted in this
company to measure the job satisfaction level of the employees. This satisfaction level was pitched
against the concepts of intension to leave and organizational citizenship behavior. The tools as
discussed in the literature review section were utilized. The results showed that employees were
generally not satisfied due to low pay scales, insufficient annual increments, non-existence of
proper policies and procedures and non-cooperative attitude of supervisors. Therefore, proper
policies were made for attaining enhanced job satisfaction, pay scales of these individuals were
increased during three years from 2010 to 2013 and annual increments from 15% to 35% were
given. Another major issue highlighted in the results was job insecurity resulting into high
turnovers especially for the educated employees. The researcher was not able to fully control this
aspect due to several reasons one of which is that these vendor organizations are family owned
businesses and owners do hiring and firing on frequent basis as per their normal practice. The only
solution for this problem is incorporating cooperate culture in these organizations for which Top
Management is still not fully ready. However, the next generation of these owners are very well
educated hence a change is coming which will take few years to become effective. All these
techniques require at least 2 to 3 years’ time for proper implementation.
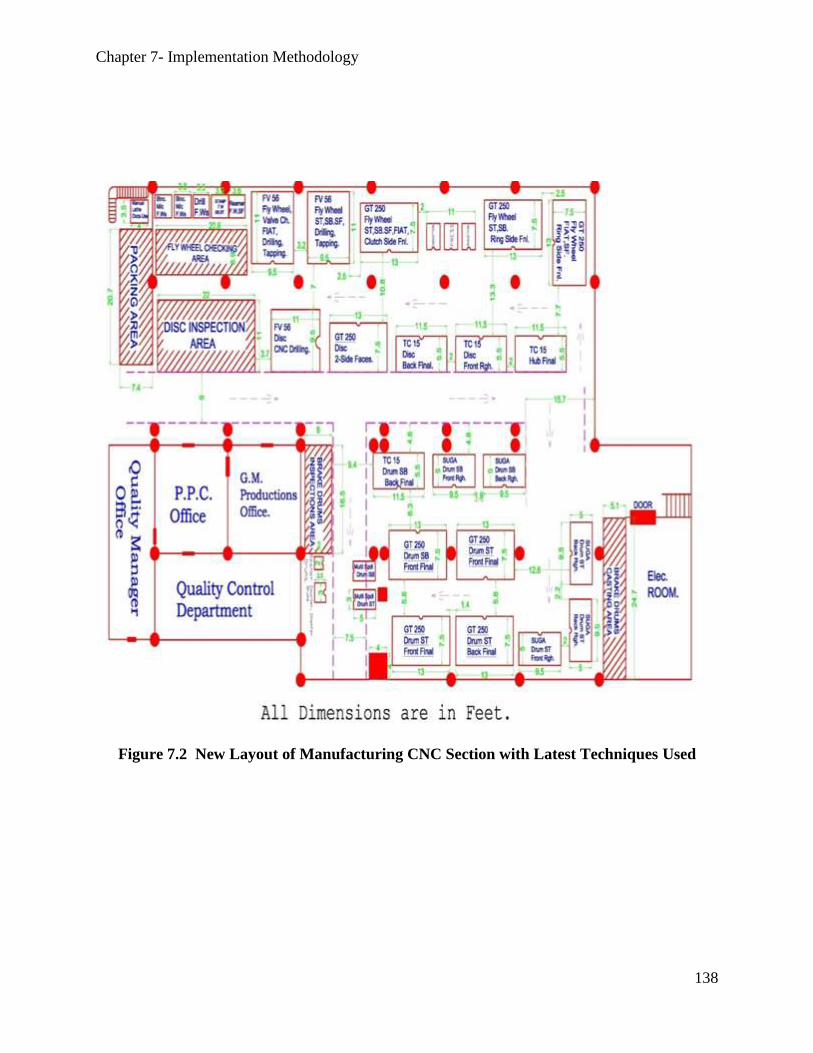
Chapter 7- Implementation Methodology
138
Figure 7.2 New Layout of Manufacturing CNC Section with Latest Techniques Used
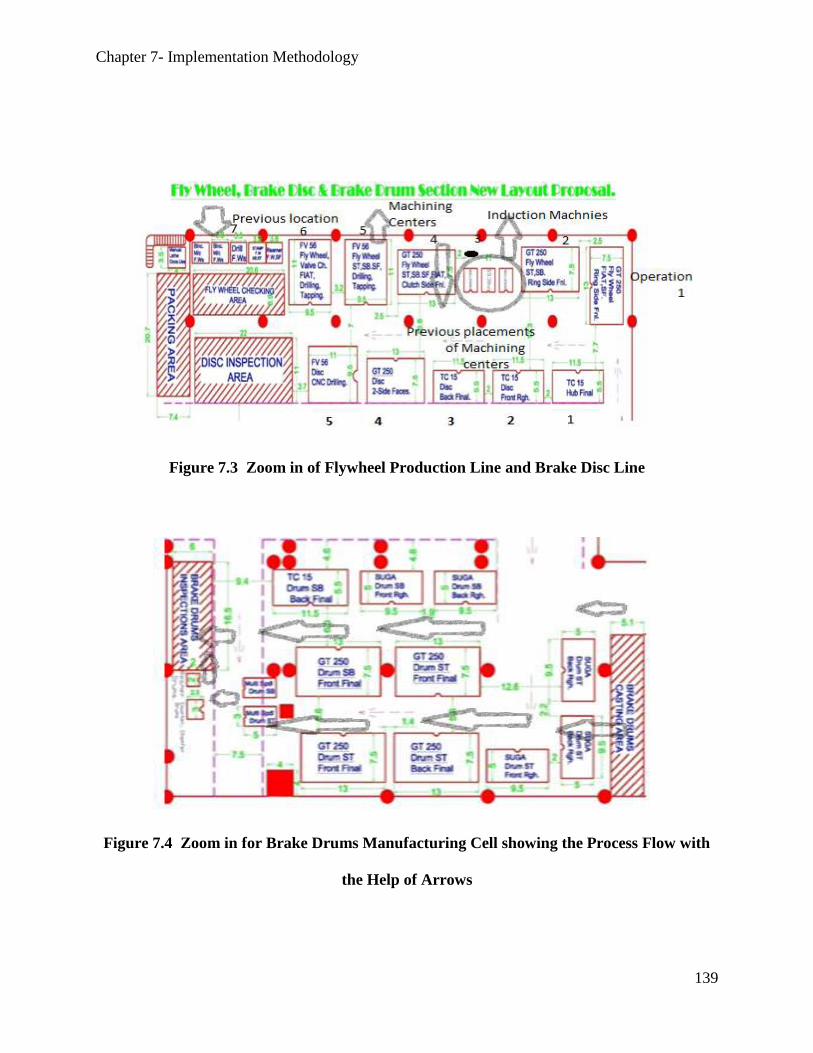
Chapter 7- Implementation Methodology
139
Figure 7.3 Zoom in of Flywheel Production Line and Brake Disc Line
Figure 7.4 Zoom in for Brake Drums Manufacturing Cell showing the Process Flow with
the Help of Arrows
Chapter 7- Implementation Methodology
140
7.4 TQM Implementation
This organization was not even ISO 9001 certified in 2010, despite the fact that it had been
in operation since 1980s and was also involved in exports. Therefore, as the first step, ISO
certification of the organization was ensured. It took one and a half year to complete this process
during which a lot of documentation was done to fulfill the requirements of the process. This whole
practice improved a lot of processes. This comprehensive exercise was not done for the sake of
getting the certification alone. Rather, proper implementation of the TQM philosophy was done
during this exercise. Generally in these organizations a very ghastly practice done is that most of
the rejections are hidden from the top management and true picture is never shown to them due to
several reasons that among other include job insecurity and fear of getting punishment. Another
reason for this concealment is non-acceptance of any rejection by top management. Therefore, a
lot of effort was done to document every rejection and even every rework. Rework was considered
as part of production. A culture of quality ensuring and producing parts right the first time, was
incorporated. Every rework is a wastage which results in cost of poor quality. The famous 7 SPC
tools were brought into practice to improve the situation.
The case of brake disc is an example to depict the results of these activities. A huge number
of brake disc failures were received from Pakistan Suzuki, one of the customers for one of their
products. In July 2012, a detailed exercise was done to improve the situation and reduce these
rejections to minimum. Proper quality checks along with process improvements were made.
Quality by design concept of Taguchi was utilized and fixtures and processes were modified. The
quality checks were documented and improved. Enormous financial benefits were achieved due to
these exercises.
In Pakistani organizations, the old concepts of quality controls are still generally practiced.
Quality Assurance (QA) acts as an umbrella on quality control as per TQM philosophy. QA was

Chapter 7- Implementation Methodology
141
established and practices of failure mode effect analysis (FMEA) were made a routine practice.
Inclusion of these practices changed the quality culture of the organization. Visual controls were
added for POKA YOKE (mistake proofing). These visual controls are one of the best tools for less
skilled and less educated manpower in these organizations.
In 2010, the atmosphere of the production line was so disturbing that mostly the visitors
used to avoid going into the production sections due to the fear of getting their clothes dirty or
even torn in certain cases. It was assumed that as this facility as well as the machinery and
equipment is so old, therefore it cannot be improved as far as the environment is concerned. It was
also misconstrued that these workers love to work in dirty environment and does not need to keep
the environment clean. First of all this mindset was changed for implementation of 5S. Long
duration of talks with the workers and the management convinced everyone that the situation needs
to be improved. These discussions convinced the top management that by applying cleanliness
practices and improving the environment, production will enhance and quality of the products
produced will also get better. The entire workforce was empowered to improve their surrounding
as they deemed appropriate. They were rewarded for every incremental improvement made in their
area. This changed the culture and a very leaner environment was achieved with placement of
requisite tools and accessories at their right places with an effort of 6 to 10 months’ time. The
worst practice previously adopted was placement of parts and even finished goods on the floor.
Proper plastic pallets and trolleys were made and fine was imposed for placing the components,
either WIP or finished, on the floor. Cabinets were provided on the shop floor and tools and
accessories which were of immediate use were placed with name tags. All the extra items present
at the shop floor were submitted in the store.

Chapter 7- Implementation Methodology
142
As per the results of this research, it was found that mostly people believe that Six Sigma
is a very expensive methodology to be implemented in Pakistani organizations. Previous research
done internationally on similar kind of environment also gave the similar results. So it was
conceptualized that instead of investing heavily in Six Sigma, the basic theme and tools of Six
Sigma can be used i.e. PDCA cycle as given by Deming. Plan, do, check and act tactics can be
used along with 7 SPC tools to give an alternative of six sigma and still sufficient satisfactory
results can be achieved. This aspect requires 2 to 3 years for comprehensive implementation.
7.5 Agile Manufacturing
Agile manufacturing is one of the latest manufacturing concepts in the manufacturing
paradigm. This aspect has been discussed in detail in the previous chapter. Agile enterprise concept
has to be incorporated for agile manufacturing. The researcher was unable to find even a single
source in Pakistani organizations that was aware or was thinking about converting to this latest
manufacturing technique. Since this is a totally new area, it was felt that it would be impossible to
convert any organization into agile enterprise. Hence, it was decided that instead of convincing the
management to incorporate agile enterprise concept in the strategy of the organization, utilization
of agile enterprise tools and matrices will be used in the first place. In the auto parts manufacturing
companies one of the biggest flaws observed was nonexistence of proper costing systems. Even
absence of ACMA qualified professionals for manufacturing costing added the agonies in
improving the prevailing system. Mostly MBA qualified and finance people, with very limited
knowledge of manufacturing methodologies, perform costing of the manufacturing activities. In
order to cope up with the system, first of all Industrial Manufacturing Engineering Department
(IME) was established. To the best knowledge of the researcher, this is first ever IME department
consisting of engineers in any of the auto parts manufacturing organizations in Pakistan. These
engineers were taught and trained about activity based costing (ABC) which was then taken to the
Chapter 7- Implementation Methodology
143
next level of activity/ cost chains, one of the strongest tools of agile manufacturing. One of the
examples of these activity based costing sheets is given in table 7.1. These costing chains resulted
in actual on-ground calculations of the manufacturing cost. This in turn led to price revision cases,
results of which will also be discussed in the validation section. Top management was astonished
to find out that several components were supplied at prices lower than the actual cost of the
component resulting in huge losses to the organization. Therefore, for the parts where OEMs
refused to give proper price revisions, production was stopped and focus was shifted to the parts
giving some profit to the organization. This did affect the revenues negatively but resulted in pure
increase in the profits of the organization. Flexible manufacturing techniques were also
incorporated which resulted in higher productions for several parts utilizing the same machinery.
For this purpose, quick setup times and quick change over time of fixtures were ensured.
Transaction analyses technique was used in which interview based surveys were conducted
to determine the problems areas and to address them. These research based techniques are the most
neglected areas in the understudy organizations. Organization maps and key characteristics
techniques were also incorporated. Having said that, it is pertinent to mention here that agile
manufacturing concept was not implemented with 100% accuracy and still needs lot of endeavors
to ensure better results.
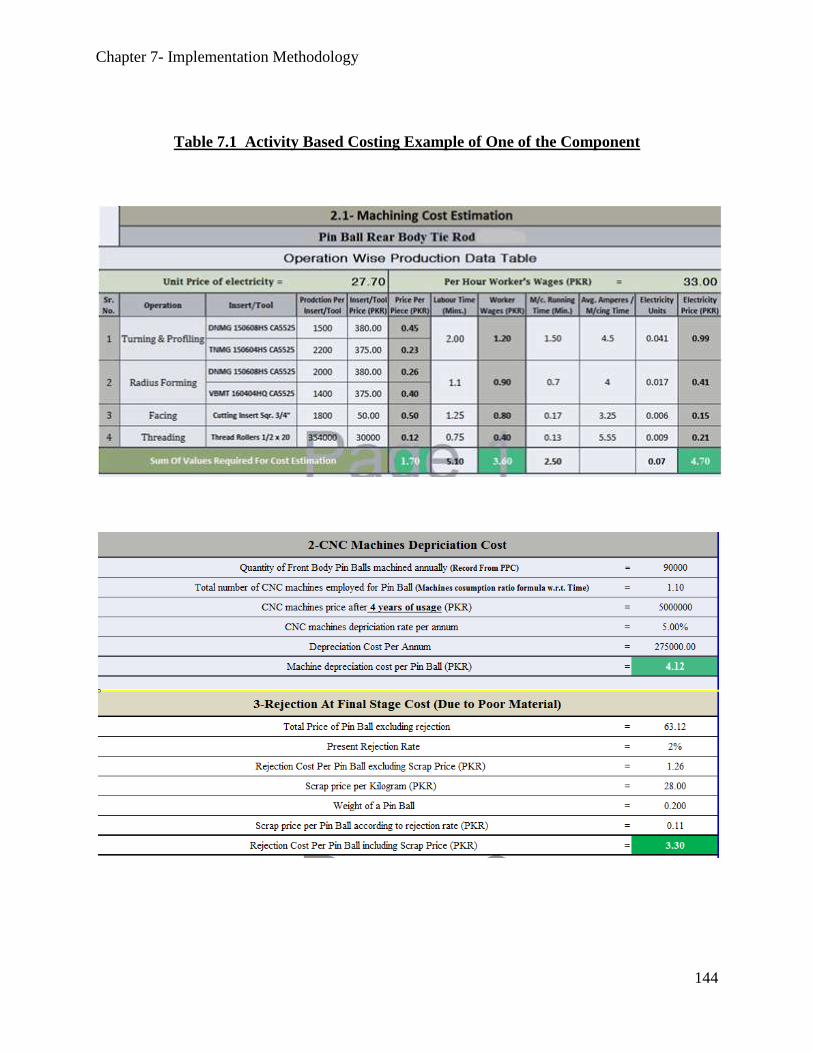
Chapter 7- Implementation Methodology
144
Table 7.1 Activity Based Costing Example of One of the Component

Chapter 7- Implementation Methodology
145
7.6 ERP and SCM Implementations
ERP is being used in XYZ Company. Ground Plans were bought back in 2009 but on- ground
verification showed that even the stores were not computerized accurately. Documentation was
mostly done on pages instead of ERP system. For finance department, ERP has given good results
but implementation of ERP in all sections of the organization was a sore point. It was strongly felt
that proper implementation of ERP and SCM was required in order to get optimum utilization of
this expensive asset. This exercise of proper implementation is still under progress and will take
some more time due to lesser top management commitment to the same.
7.7 TPM and TPgmt Implementation
Out of 7 pillars of Total Productive Maintenance (TPM), the concept of Autonomous
Maintenance (AM) is highly valued and considered to be the basis of TPM. This concept was
implemented right from the beginning in the implementation phase. This autonomous maintenance
concept advocates that every operator is responsible for the maintenance of his/her
machine/equipment. This concept gives the powers and responsibility to the operator resulting in
better performance for both machine and labor. In 2011, the maintenance department working for
the conventional machines was dissolved. This was the beginning of TPM philosophy
implementation. The production sections were given the responsibility and powers to undertake
autonomous maintenance of their equipment, whereas the maintenance department was made
responsible for development of new machines and up gradation of the existing ones. This practice
is also partially completed and still needs a lot of efforts and time for proper implementation. Big
resistance from the workers and management is the main reason that it is still incomplete. Remedy
for this problem is visit to organizations like Pakistan Tobacco Company that very successfully
implemented this technique a decade ago. ‘Seeing is believing’ methodology can be used to make

Chapter 7- Implementation Methodology
146
people believe in this methodology. Proper implementation of these techniques requires a complete
cultural change in the organization which takes at least 1 to 2 years’ time.
For TPgmt, it is essential to hire people of productivity field if complete cultural change
has to be brought about, which requires 2 to 3 years’ time. In productivity department there has to
be four different sections;
a. Productivity Measurement Section
b. Productivity Planning Section
c. Productivity Evaluation Section
d. Productivity Enhancement Section
Theses sections have to work in collaboration to measure, plan, evaluate and enhance
productivity. This methodology needs more hiring of productivity specialist people and giving
them resources to do their job. Phase wise implementation of this department is also possible by
starting from productivity measurement and subsequently going for productivity planning,
evaluation and enhancement.
7.8 TRIZ and Autonomous Development Implementation
TRIZ theory was basically conceptualized and propounded by Genrich Altshuller, a Russian
(1926-1998). He made several discoveries in this area and developed several tools for TRIZ
implementation. The theme of TRIZ consists of two main concepts i.e. Innovation and Creativity.
It is still generally misunderstood around the globe that innovation and creativity are not possible
in the paradigm of routine daily production operations especially in the manufacturing industry.
ReVelle [121] discussed this aspect in detail and included TRIZ as one of the latest manufacturing
technique for the industry. Based on the arguments of this author, it is believed by this researcher
that though strictly following the routine daily productions and operations rules/procedures can
give results, but in order to get drastic improvements one has to adopt TRIZ tools and techniques
Chapter 7- Implementation Methodology
147
in the industry. For innovation and creativity, the first and foremost aspect is giving empowerment
to the workers so that they can think and try to improve every step of manufacturing with their
vast experience and tacit knowledge. Knowledge base is the core theme of agile manufacturing as
well as TRIZ. The two basic tools of TRIZ are classical TRIZ tools and ITRIZ [121]. Classical
TRIZ tools are knowledge based tools and are the easiest to be implemented in any organization.
However, for ITRIZ detailed training and understanding of the latest software is essential. In any
organization, it is much easier to start with classical tools which can then be augmented with ITRIZ
software at a later stage. In this organization also, the classical tools were applied. The basis of the
application was giving authority, powers and liberty to think and apply the tacit knowledge to the
employees. This empowerment helped in KAIZEN activities and implementation of 5S techniques
as well. All the workers, line heads, foremen and shop floor engineers were given the liberty to
think and act to improve any aspect of the production/operations and general daily activities. This
technique helped in attaining 1000 Kaizen’s within one year.
Another methodology used for enhancing the innovation and creativity attitude of the
employees was conceptualizing and implementation of the Autonomous Development concept. As
explained earlier, it was realized that considering the high number of demands of the customers,
one or two independent R&D sections cannot fulfill the requirements of development tasks.
Therefore, a complete independent entity was added into every production section. These entities
were in-house small development sections of these production sections. Only two to three basic
machines like conventional lathe, milling machine and grinders were given to these sections. The
team of these sections comprised of two to three expert machinists who worked under the
supervision of the foreman and operations engineers of these production sections. These small
autonomous units were made responsible to develop all the components similar to the one already

Chapter 7- Implementation Methodology
148
being produced by them. For example, flywheel section was made responsible to develop every
new flywheel (for every new order received) along with complete process, gauges, fixtures and
checking fixtures for the specific product. Similarly other departments were given the tasks related
to their area. This practice actually resulted in inculcating the new concept of concurrent
engineering. There were times that 10 new products were ordered by the OEMs and all of them
were developed in a short span of four months. This was all made possible because all these
autonomous development sections were simultaneously developing their respective components.
In a span of ten months, a record development of 32 components was completed successfully.
These all achievements were made possible because of the empowerment given to these small
units and implementation of TRIZ techniques. Implementation of these concepts require 4 to 5
years.
A new terminology has been introduced in this productivity enhancement model and that is
Autonomous Development (AD). Development is one of the most prominent factors for
organizational success. Only the accurately developed processes can give better productivity with
quality outputs. This is the main reason that development techniques are considered to be most
time consuming and require heavy financial consumption. In most of the world class organizations
like GM, Toyota, Ford, BMW, Mercedes Benz, the Research and Development (R&D)
departments/sections are considered to be the most important assets of the organization. The
mostly misunderstood concept about R&D in Pakistan specifically and in the world generally is
that they develop new products. Actually these departments develop processes which produce
quality products with maximum productivity. The responsibility of these departments is not only
to develop new processes for new products but they also continuously work and redesign and
improve the existing processes of in-production components to improvement of quality and
Chapter 7- Implementation Methodology
149
productivity. This concept has to be incorporated in Pakistani organizations also. Secondly, the
most important aspect in development of a new product (meaning thereby, development of a
process which can produce the desired product) is the concept of Time to Market. In traditional
manufacturing, developing a new product successfully was considered a mega achievement while
ignoring long development spans at times. In the new millennium however, globalization has
changed several manufacturing concepts. Now successfully developing a process or product in
long span of time is considered a failure. Organizations have to meet the market demand in
minimum possible time to remain competitive. In order to win orders, time to market has to be
shortest possible now a days, otherwise some other organization having reduced time to market
takes away the sales. Similarly, time to market concept should be given due consideration for
improvement of an existing process by improving or redesigning for improvement with minimum
possible time to achieve better productivity and attain competitive advantage. Considering these
challenges, organizations around the globe have been concentrating upon increasing their R & D
capabilities in one way or another. Some have increased the size of their R &D sections in number
of machines or labor. Some have also established more than one R &D sections. Still, the customer
demands are not met in several cases. In the recent past, most of the organizations have started
outsourcing their development activities. A large number of development organizations have
emerged which provide development services to the manufacturing units. This activity is proving
to be expensive.
This concept has been introduced in this research considering all these issues. Its
implementation does not require new hiring. Empowerment has to be given to the sections in which
teams of development can be made. Head of the team should be department/section engineer with
foreman as being his assistant. Two machinists and a designer have to be added in the section and
Chapter 7- Implementation Methodology
150
these small teams can develop all the parts pertaining to the respective section. In this way with
very minimum possible investment complete concept of Autonomous Development can be
incorporated in a time period of six months.
7.9 Energy Audits
The issue of power crises was discussed by nearly all the respondents. The prevailing energy
crises in Pakistan have affected the overall industry very severely. The problem with generators is
that the manufacturing cost of the product goes very high as per unit cost is high on diesel
generators. This problem has resulted in huge production losses to the industry in general and auto
industry in particular. Factory owners have also started working towards alternate power sources.
The biggest gap found in all this process is the fact that industry people are not focusing on energy
audit of their firms in order to at least reduce their energy requirements. Hence energy audit of this
company was conducted with the help of engineers from the universities. Instead of paying huge
amount of money to the consultants, industry can have Knowledge Transfer Partnership (KTP)
with the academia which will result in benefits to both sides. But these fresh engineers or
engineering students have to be managed by an experienced engineer to make this exercise fruitful.
This was the methodology used in this study which gave fruitful results.
Chapter Summary
The proposed productivity enhancement framework was implemented in a functional
organization. This implementation was done to prove the validity of the model. Implementation
was done stage wise as it requires complete cultural change of the organization. The problems
faced in implementation of this model were noted and suggestions were also documented. This
implementation methodology was written in order to guide the user of this model in smooth
implementation of the suggested techniques. First of all step by step methodology of hiring
educated manpower and their proper placement and future growth was suggested as there is very
less number of educated manpower working on the production lines. Methodology of human
Chapter 7- Implementation Methodology
151
resource development was also described. The best solution for implementation of these
techniques is capacity building of the existing manpower. Modified JIT concept which can be
easily followed by all others along with optimization techniques has also been elaborated. Detailed
illustrations of the old layouts have been given showing the gaps and wastages due to poor
planning. The new implemented layout with additional benefit has also been shown. Concept of
agile manufacturing in combination with lean manufacturing has also been discussed. Results and
methodology of activity based costing has also been deliberated upon with the help of case study
of one of the component. Methodologies of implementing TRIZ, TQM, TPM, TPgmt, TPM and
conducting energy audits have also been explained.
Chapter 8- Validation of Model and Discussions
152
CHAPTER 8
VALIDATION OF PRODUCTIVITY ENHANCEMENT MODEL
AND DISCUSSION OF THE OUTCOMES
Implementation methodologies as discussed and explained in the previous chapter are the
guidelines for successful utilization of this productivity enhancement model. It cannot be claimed
that 100% implementation of this model was done, but most of the concepts and techniques
elaborated have been implemented successfully. Radical changes were achieved in a considerably
short span of time despite partial implementation of this model. Owing to certain reasons explained
in the previous chapter, some aspects of this model were not fully implemented. However, this
gives a chance for future research implementation and further confirmation of the model in similar
as well as in different settings, for further refinement of this model. In this chapter the validation
of this model will be proved by highlighting and indicating the improvements achieved due to its
implementation. The improvements achieved and the outcomes of these implementations will be
elaborated in six different paradigms.
1. Improvements achieved in the production volumes
2. Human Resource savings
3. KAIZEN’s achieved
4. Development projects successfully completed
5. Energy audit results
6. Results in financial terms of the outcomes of these implementations
Chapter 8- Validation of Model and Discussions
153
8.1 Production Graphs
The production graphs shown in this section start from January 2010 and expand till March
2012. Development of this model started in November 2010. As the stage wise implementation of
this model progressed, the production graphs also showed radical changes. March 2012 was the
time span where maximum optimization of the equipment and the manpower was achieved. After
that more concentration was given to the quality graphs. Before looking at the graphs and
discussing the results, it is pertinent to mention here that all these production targets were achieved
without adding huge number of machines/equipment in the already held assets of the company.
Rather, several machines not required and found extra were removed from the production line and
placed in stores for future utilization. Another aspect to mention is the fact that all these production
volumes were achieved with 10% to 50% reduction in manpower. The energy consumption, which
was a direct cost to the production, was also reduced to 25%- 30%. These figures show under
capacity utilization of the assets of this organization.
Figure 8.1 shows per month production volumes of brake disc from January 2010 to March
2012. All these volumes only include the good pieces as rejections and rework were not included
in these production numbers. The output of 1170 pcs in Jan 2011 hiked to 4630 pcs per month i.e.
396% increase in the production from the same machines with less manpower and less energy
consumption. Figure 8.2 shows the production volumes of Brake Drum. From volumes of 2160
pcs per month, maximum production achieved was 6574 pcs per month i.e. 304% increase in
production. An important aspect to note from these graphs is the fact that there is some fluctuation
in productions owing to fluctuation in supply demands.

Chapter 8- Validation of Model and Discussions
154
Figure 8.1 Production Graphs of Brake Disc from Jan 2010 to Mar 2012 showing 396%
Production Increase on Same Machines and Lesser Manpower
Figure 8.2 Production Graphs of Brake Drum from Jan 2010 To Mar 2012 showing a
Production Increase of 304% on Same Machines with Lesser Manpower
400 350 400 350 450704
1184944
782
1234
792
1086117011961112
19701790
1496
1928
1284
4524
3200
28822762
4630
1228
3116
0
500
1000
1500
2000
2500
3000
3500
4000
4500
5000
`Jan-2010
`Feb-2010
`Mar-2010
`Apr-2010
`May-2010
`Jun-2010
`Jul-2010
`Aug-2010
`Sep-2010
`Oct-2010
`Nov-2010
`Dec-2010
`Jan-2011
`Feb-2011
`Mar-2011
`Apr-2011
`May-2011
`Jun-2011
`Jul-2011
`Aug-2011
`Sep-2011
`Oct-2011
`Nov-2011
`Dec-2011
`Jan-2012
`Feb-2012
`Mar-2012
DISC. FRONT BRAKE
11701080135013501260
1620
2070
16201620
2250
1710
2160
2880
1530
3420
2570
16682028
4008
1980
4506
2262
4274
6574
45504890
3870
0
1000
2000
3000
4000
5000
6000
7000
`Jan-2010
`Feb-2010
`Mar-2010
`Apr-2010
`May-2010
`Jun-2010
`Jul-2010
`Aug-2010
`Sep-2010
`Oct-2010
`Nov-2010
`Dec-2010
`Jan-2011
`Feb-2011
`Mar-2011
`Apr-2011
`May-2011
`Jun-2011
`Jul-2011
`Aug-2011
`Sep-2011
`Oct-2011
`Nov-2011
`Dec-2011
`Jan-2012
`Feb-2012
`Mar-2012
DRUM FRONT BRAKE

Chapter 8- Validation of Model and Discussions
155
In the past, there were months when supply targets were not met due to more demand than
the number of parts produced owing to which complaints of short supplies were received from the
customers. In order to resolve this issue, production was increased on the same machines. Then a
new situation arose where there were months when OEM reduced their production due to certain
issues. In these months it was not possible for the vendors to go on full production as it could result
in huge piles of finished goods which are not financially feasible for any vendor. Normal practice
followed in this scenario is that overtime of the labor is stopped and these CNCs remain stopped
for hours and hours. Considering this situation, the months when less orders were received, the
production on these machines was done on full pace without any stoppage and orders were
completed within a few days’ time. The remaining days in the month when the machines were free
were utilized for development of new parts. That is one strategy which allowed successful
implementation of autonomous development concept. For this practice, the number of parts
produced per hour was calculated and production planning was done in such a manner that
maximum time of the machines was made available for production of other parts or development
of new parts. Quick change-over time of complete production lines including fixtures and tooling
was done to make all these things possible. This resulted in flexible manufacturing lines as several
different types of parts are being produced in this organization.
Similarly, huge production enhancements were achieved for brake drum and exhaust
manifold as shown in Figure 8.3 and Figure 8.4 respectively. These production enhancements were
done on same machines with lesser labor resulting in productivity enhancement. Brake drum
improved from 1300 pcs per month in January 2011 to 4870 pcs per month in Dec 2012. 374%
increase in the production. Exhaust manifold production improved from 1700 pcs per month in

Chapter 8- Validation of Model and Discussions
156
Figure 8.3 Production Graph of Brake Drum from Jan 2010 to Mar 2012 showing a
Production Increase of 374% on same Machines with Lesser Manpower
Figure 8.4 Production Graph of Brake Drum from Jan 2010 to Mar 2012 showing a
Production Increase of 199% on same Machines with Lesser Manpower
500 600800
600 600900
130010001100
1500
1000130014001300
2300
1744
11881254
3510
1536
3744
31862970
4870
2640
1200
3024
0
1000
2000
3000
4000
5000
6000
`Jan-2010
`Feb-2010
`Mar-2010
`Apr-2010
`May-2010
`Jun-2010
`Jul-2010
`Aug-2010
`Sep-2010
`Oct-2010
`Nov-2010
`Dec-2010
`Jan-2011
`Feb-2011
`Mar-2011
`Apr-2011
`May-2011
`Jun-2011
`Jul-2011
`Aug-2011
`Sep-2011
`Oct-2011
`Nov-2011
`Dec-2011
`Jan-2012
`Feb-2012
`Mar-2012
DRUM REAR BRAKE
200
488600 600
500
900
1300
950
13501450
1700
1400
1800
1350
18001900
704
1550
19041912
3392
2578
1770
2140
2778
1172
3150
0
500
1000
1500
2000
2500
3000
3500
4000
`Jan-2010
`Feb-2010
`Mar-2010
`Apr-2010
`May-2010
`Jun-2010
`Jul-2010
`Aug-2010
`Sep-2010
`Oct-2010
`Nov-2010
`Dec-2010
`Jan-2011
`Feb-2011
`Mar-2011
`Apr-2011
`May-2011
`Jun-2011
`Jul-2011
`Aug-2011
`Sep-2011
`Oct-2011
`Nov-2011
`Dec-2011
`Jan-2012
`Feb-2012
`Mar-2012
EXHAUST MANIFOLD
Chapter 8- Validation of Model and Discussions
157
November 2010 to 3392 pcs per month in September 2011. 199% increase in production.
Apart from the production improvement achieved on Suzuki parts, similar success was
achieved on Massey Ferguson and Fiat Tractor parts. Valve chamber is a component of tractor
hydraulic pump and huge production enhancements were achieved for this part as well, using some
extra techniques. OEM of Hydraulic pump is MEL which was not able to achieve its production
targets since long, as no vendor was able to manufacture and supply requisite number of value
chambers for them to carry out their production. The supply orders received by MEL in 2010 were
“supply as many as you can produce”. Within a time span of one year, production of this
component was increased from 1053 pcs per month in Dec 2010 to 6870 pcs per month in June
2012 as shown in Figure 8.5, an increase of 652% in production. This was the highest production
target enhancement per month achieved in this organization. In this production increase however,
some extra techniques were also incorporated which included the earlier explained terminology of
“some automation”. Previously the only attempts made were production on CNC machines only
as this is a very highly precision part. So the only strategy used by the top management was
increase in the number of CNC machines in this line. Gradually several operations were brought
out of the CNC and were done on conventional machines. Conventional machines are less
expensive machines and with very less investment several machines can be added. This practice
resulted in huge production increase without increasing the number of CNCs and resultantly, huge
production gains were achieved with very less financial effect.

Chapter 8- Validation of Model and Discussions
158
Figure 8.5 Production Graph of Valve Chamber from Jan 2010 to Mar 2012 Showing a
Production Increase of 652% with very Less Financial Investment
468604
950
1200
780630
1200
1478
956
1076
690
1053
12791926
2070
2501
31223210
4035
3392
2997
5087
2000
350
2514
3716
5864
0
1000
2000
3000
4000
5000
6000
7000
`Jan-2010
`Feb-2010
`Mar-2010
`Apr-2010
`May-2010
`Jun-2010
`Jul-2010
`Aug-2010
`Sep-2010
`Oct-2010
`Nov-2010
`Dec-2010
`Jan-2011
`Feb-2011
`Mar-2011
`Apr-2011
`May-2011
`Jun-2011
`Jul-2011
`Aug-2011
`Sep-2011
`Oct-2011
`Nov-2011
`Dec-2011
`Jan-2012
`Feb-2012
`Mar-2012
VALVE CHAMBER
Chapter 8- Validation of Model and Discussions
159
8.2 Human Resource Savings
Most of the organizations in the world are using one basic technique to enhance productivity,
and that is downsizing. However, it not only creates panic in the employees but also badly affect
the overall performance of the organization because job insecurity fear hamper the performance
of the employees. According to the author of this research, “Downsizing” is the worst method to
be used while “Rightsizing” is the best method. Rightsizing means placing exact number of
employees for the requisite job. If an operation requires 15 people, than exactly 15 individuals
must be placed. A lot of estimations are required for this “exact” estimation. Proper process
analysis with proper layouts and all the techniques discussed in the last chapter have to be
incorporated to make the right estimate. Once proper estimation is done, extra manpower can be
moved to some other operations or can be laid off without having fears of panic in the employees.
The worst practice is that industrialists just start to lay off people without making proper
estimations, a practice that needs to be curbed.
Proper time and motion study and detailed analysis were done in this organization and
“Rightsizing” was done. The results of this rightsizing showed presence of large number of extra
employees. The figures in Table 8.l and graphs shown in Figure 8.6 depict the improvement
achieved in last three years. The numbers of employees have been reduced from an average of 650
per month to only 350 per month. Total pay distributed in 2010 was Rs 65,514,421, pay distributed
in 2011 was Rs 64,180,140 and pay distributed in 2012 was Rs 58,263,169. An important aspect
to be considered is that total number of employees were decreasing in this period and every year
an increment of 15% to 35% was given to the employees. Even then, the total payments made by
the company was on the decrease. While reducing the manpower, the production graphs also show
how much production was also increased resulting in high productivity gains.
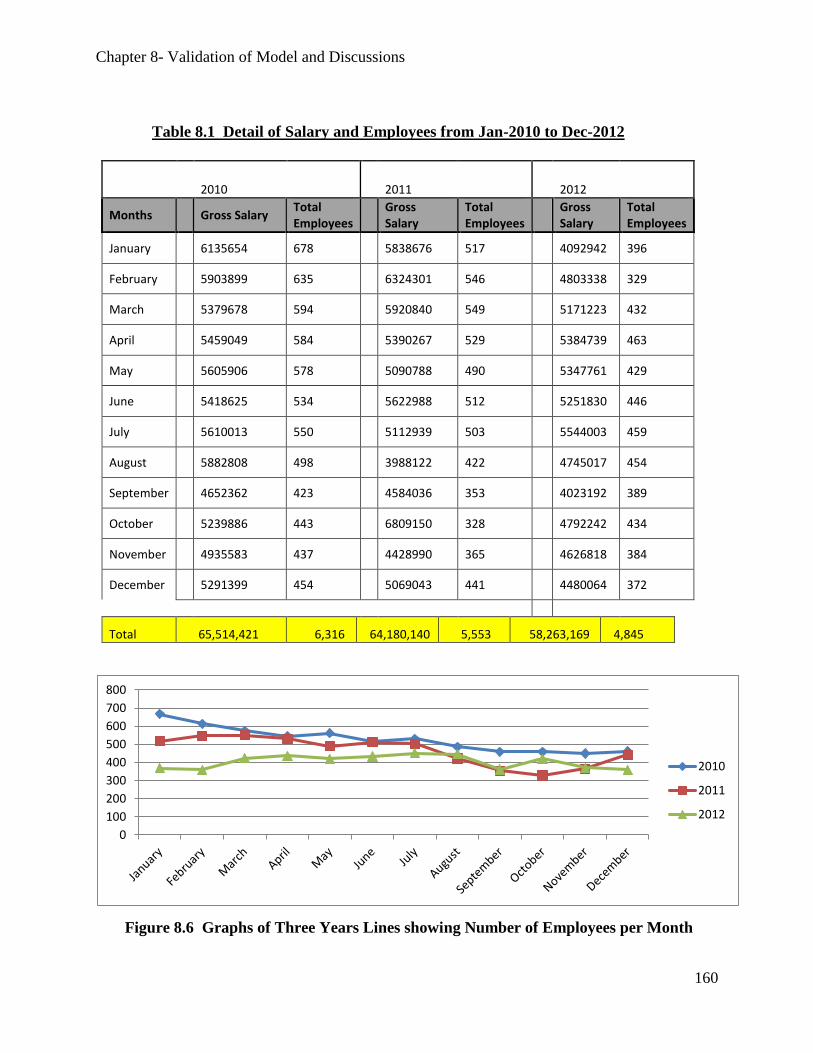
Chapter 8- Validation of Model and Discussions
160
Table 8.1 Detail of Salary and Employees from Jan-2010 to Dec-2012
2010 2011 2012
Months Gross Salary Total Employees
Gross Salary
Total Employees
Gross Salary
Total Employees
January 6135654 678 5838676 517
4092942 396
February 5903899 635 6324301 546
4803338 329
March 5379678 594 5920840 549
5171223 432
April 5459049 584 5390267 529
5384739 463
May 5605906 578 5090788 490
5347761 429
June 5418625 534 5622988 512
5251830 446
July 5610013 550 5112939 503
5544003 459
August 5882808 498 3988122 422
4745017 454
September 4652362 423 4584036 353
4023192 389
October 5239886 443 6809150 328
4792242 434
November 4935583 437 4428990 365
4626818 384
December 5291399 454 5069043 441
4480064 372
Total 65,514,421 6,316 64,180,140 5,553 58,263,169 4,845
Figure 8.6 Graphs of Three Years Lines showing Number of Employees per Month
0
100
200
300
400
500
600
700
800
2010
2011
2012
Chapter 8- Validation of Model and Discussions
161
8.3 KAIZEN’s Achieved
A complete Kaizen culture was developed in the organization. Initially, this philosophy was
implemented on the shop floor as the results are more easily checked and measured, and then this
culture was taken across the board to all the sections and functions of the organization. The first
thing implemented on the shop floor was that the workers were empowered to make any small
change in the daily routine activities. Small financial benefits were added with every incremental
change made or suggested. This incentive boosted the activity and every individual of the
organization started participating in this daily activity. Small improvements were recorded on daily
basis and photographed for record. Even the minutest changes like cleaning the workplace
environment was also encouraged and appreciated, which led to easy implementation of 5S. These
incremental changes were shifted towards the daily operations and functions. Improvement of jigs
and fixtures, improvement of checking fixtures, improvement of gauges, calibration and
persistence use of gauges, improvement of tools and inserts consumption, optimum utilization of
materials and lot more activities similar to these led to 1000 Kaizen’s achieved in one year’s time.
First 200 Kaizen’s out of these are shown in Table 8.2. The result of these improvements have
already been discussed which include: better productivity, better quality of products and processes,
and better profit margins for the organization. These results depict that implementing this
philosophy requires minimum financial inputs but it can provide huge gains for any manufacturing
or services company in the developing countries.

Chapter 8- Validation of Model and Discussions
162
Table 8.2 KAIZEN’s In One Year

Chapter 8- Validation of Model and Discussions
163

Chapter 8- Validation of Model and Discussions
164

Chapter 8- Validation of Model and Discussions
165

Chapter 8- Validation of Model and Discussions
166
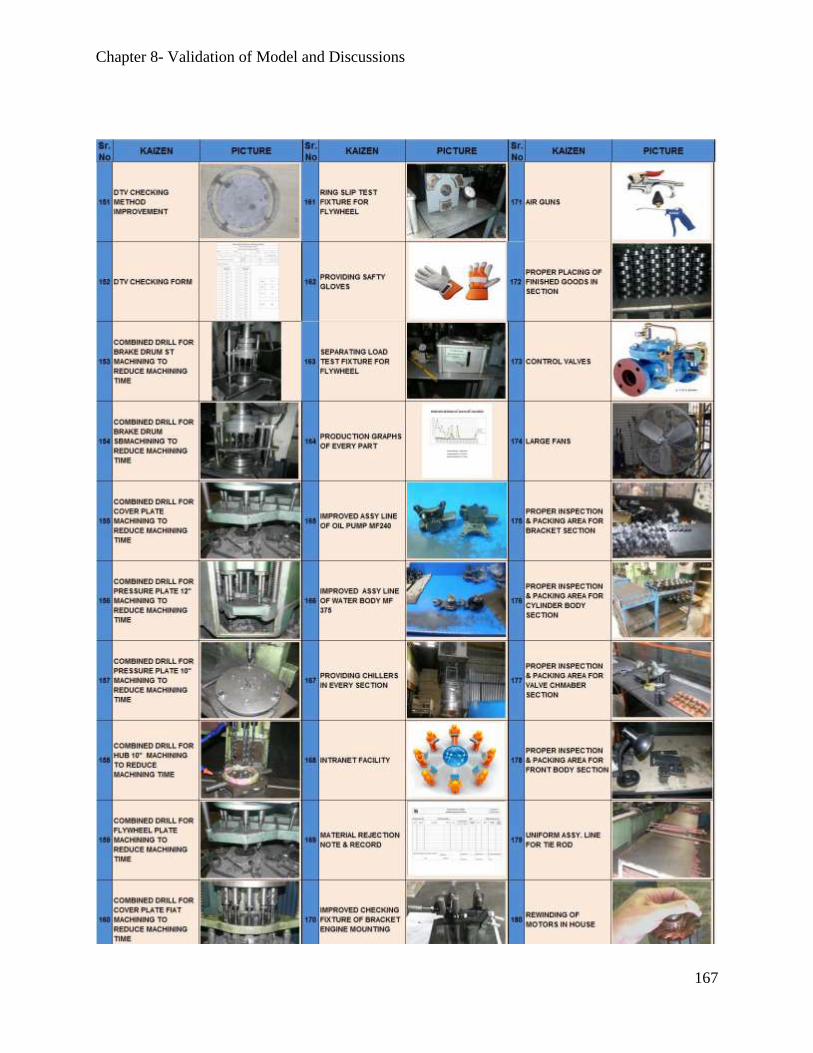
Chapter 8- Validation of Model and Discussions
167

Chapter 8- Validation of Model and Discussions
168
Chapter 8- Validation of Model and Discussions
169
8.4 Development Projects
The Autonomous Development (AD) concept as explained earlier resulted in a system that
is mature enough to give new developments within a very short span of time, which can be huge
in output numbers due to utilization of concurrent engineering concept. Thus, within a short time
span of 10 months, 32 new components were developed along with their complete processes and
gauges. Table 8.1 shows the details of these parts. All the customers for which these parts were
developed showed their complete satisfaction of the methodology and short time to market. All
tiers of Pakistan Suzuki management visited and witnessed the results and gave great appreciation.
Visitors from SMC Japan Head Office also appreciated the new methodology. This new concept
was appreciated for its ingenuity. It was confirmed from the records of Pak Suzuki, Millat Tractors
and also Engineering Development Board of Pakistan that no such precedence exists in the history
that this many parts were development in this short span of time. This organization has received a
lot of new orders on the basis that now they have the capability to develop new products in a very
short span of time.
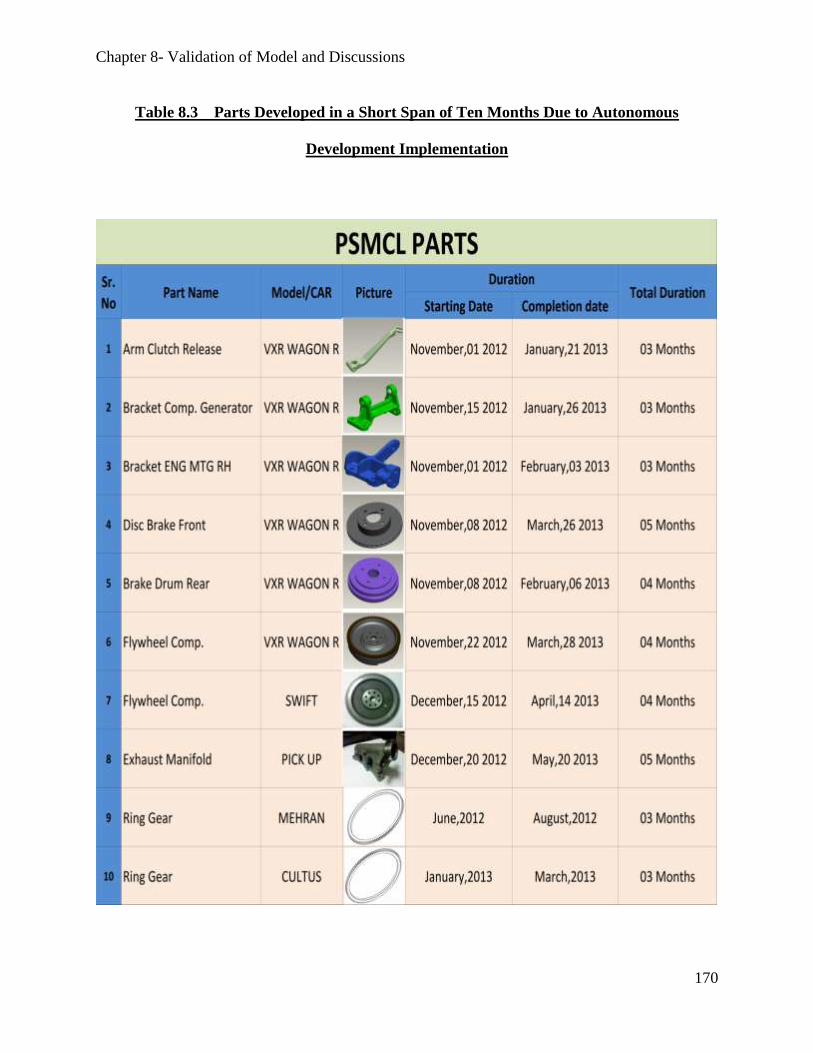
Chapter 8- Validation of Model and Discussions
170
Table 8.3 Parts Developed in a Short Span of Ten Months Due to Autonomous
Development Implementation
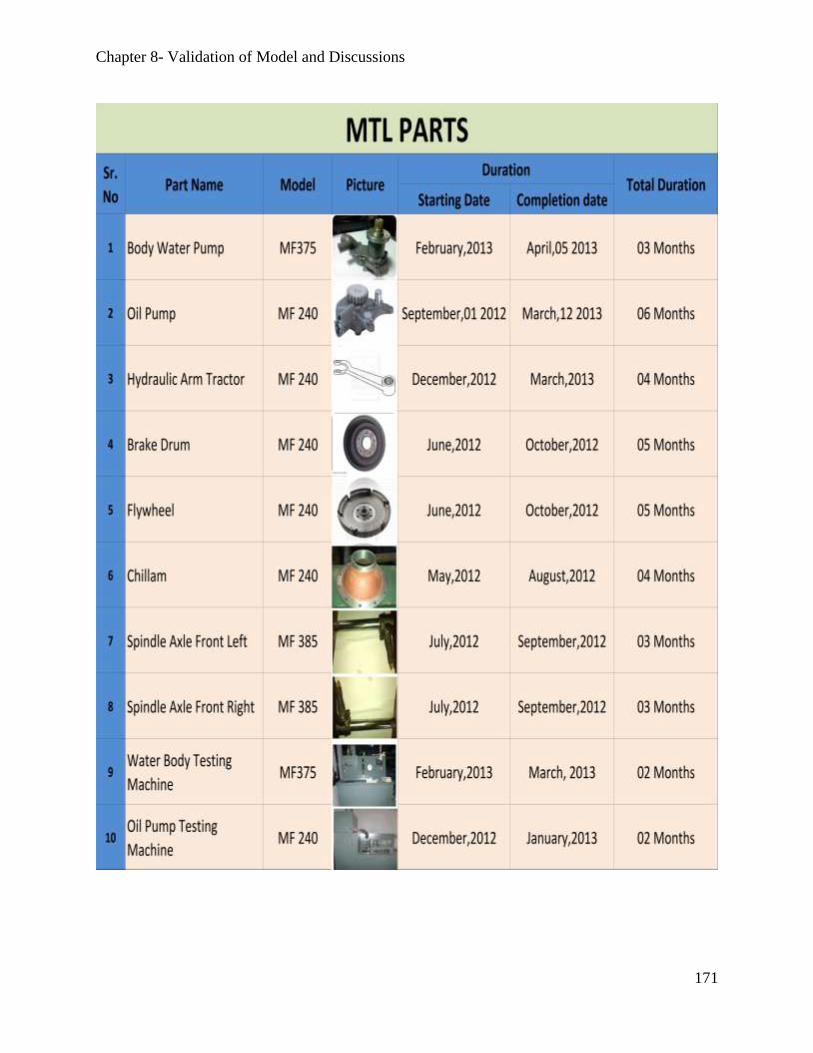
Chapter 8- Validation of Model and Discussions
171

Chapter 8- Validation of Model and Discussions
172
Chapter 8- Validation of Model and Discussions
173
8.5 Energy Audit Results
A detailed survey of the company was carried out and it was found that there were a number
of areas which needed immediate improvement. These areas included power losses due to wrong
type of wirings, using over-power motors on the machines, extra lights, use of high power bulbs
instead of energy savers, extra ACs, lose connections etc. In order to keep the project manageable
within time and available resources, the scope of the project was limited to use of power motors
and that too on small scale. First of all, the motors used in one of the section of foundry were
calculated for their power capacity and power usage. Table 8.3 shows the list of these motors and
the cost effect of their power consumption. It was observed that very high power motors were
installed on these machines. Reason for this is that generally machines installed in this organization
are very old and old engineering technique of using high power motors were used in their design.
Same is the case with most of the organizations in automotive parts manufacturers and assemblers
in Pakistan auto industry. In view of this, it was planned to replace the high power motors of 7 Hp
and 20 Hp with lower power motors of 5 HP with alteration of gear box synchronization. Seven
motors were selected as shown in Table 8.4 and their replacement cost was calculated.
Replacement resulted in huge energy and cost savings as shown in Figure 8.7, Figure 8.8 and
Figure 8.9. Figure 8.7 also shows the comparison of power required before the project and after
the project while indicating the actual powered required for the operation. Figure 8.8 shows cost
savings of Rs 0.5 million due to this project, after replacement of only 7 motors. If similar practice
can be performed on all 1130 motors of the factory, the price effect in monetary terms can be easily
imagined. Similarly in Figure 8.9 power saving is shown. After carrying out the energy audit,
actual power generation requirement should be calculated and then new generators should be
bought accordingly.
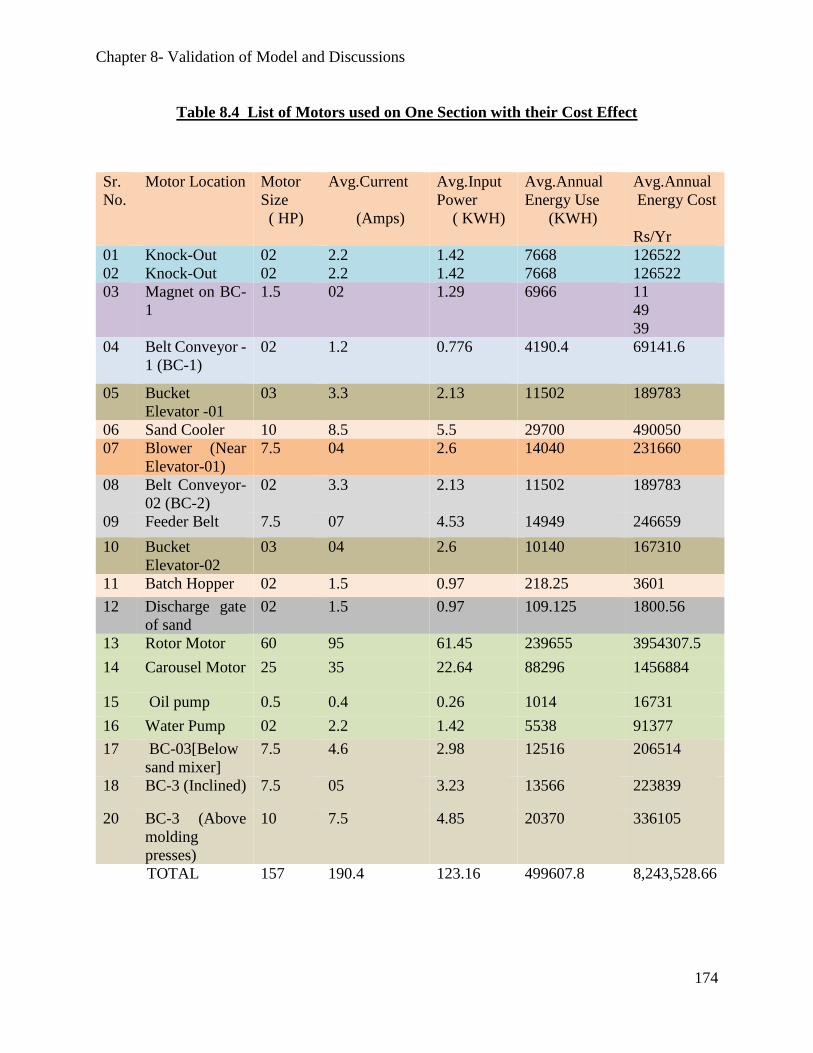
Chapter 8- Validation of Model and Discussions
174
Table 8.4 List of Motors used on One Section with their Cost Effect
Sr.
No.
Motor Location Motor
Size
( HP)
Avg.Current
(Amps)
Avg.Input
Power
( KWH)
Avg.Annual
Energy Use
(KWH)
Avg.Annual
Energy Cost
Rs/Yr
01 Knock-Out 02 2.2 1.42 7668 126522
02 Knock-Out 02 2.2 1.42 7668 126522
03 Magnet on BC-
1
1.5 02 1.29 6966 11
49
39
04 Belt Conveyor -
1 (BC-1)
02 1.2 0.776 4190.4 69141.6
05 Bucket
Elevator -01
03 3.3 2.13 11502 189783
06 Sand Cooler 10 8.5 5.5 29700 490050
07 Blower (Near
Elevator-01)
7.5 04 2.6 14040 231660
08 Belt Conveyor-
02 (BC-2)
02 3.3 2.13 11502 189783
09 Feeder Belt 7.5 07 4.53 14949 246659
10 Bucket
Elevator-02
03 04 2.6 10140 167310
11 Batch Hopper 02 1.5 0.97 218.25 3601
12 Discharge gate
of sand
02 1.5 0.97 109.125 1800.56
13 Rotor Motor 60 95 61.45 239655 3954307.5
14 Carousel Motor 25 35 22.64 88296 1456884
15 Oil pump 0.5 0.4 0.26 1014 16731
16 Water Pump 02 2.2 1.42 5538 91377
17 BC-03[Below
sand mixer]
7.5 4.6 2.98 12516 206514
18 BC-3 (Inclined) 7.5 05 3.23 13566 223839
20 BC-3 (Above
molding
presses)
10 7.5 4.85 20370 336105
TOTAL 157 190.4 123.16 499607.8 8,243,528.66

Chapter 8- Validation of Model and Discussions
175
Table 8.5 Replacement of Motors with Cost Effect
Motor Location Motor Size (HP) Replacement Cost (Rs) Total
Replacement
Cost (Rs)
Foundry Existing Replacement Motor Cost Gear box
Cost
BC-03[Below
sand mixer]
7.5 5 11000 32000 43000
BC-3 (Inclined) 7.5 5 11000 32000 43000
BC-3 (Above
molding
presses)
10 7.5 Available
(15500)
32000 47500
Molasses
Muller(Near
750 Kg
Furnace)
20 7.5 Available
(15500)
32000 32000
Fan Motor
Shot Blast
Machine(Small)
30 25 Ok -----
Blower Motor
Shot Blast
Machine(Small)
7.5 5 Ok -----
Sodium Silicate
+ Silica Sand
Mixer Machine
Motor
7.5 5 Ok ------

Chapter 8- Validation of Model and Discussions
176
Unit of Power = Horsepower = HP (Along Vertical Axis)
Where,
M-1 = Molasses Muller (Near Induction Furnace 750 kg)
M-2 = BC-03 (Below Sand Mixer)
M-3 = BC-03(Inclined)
M-4 = BC-03 (Above Molding Presses)
M-5 = Sodium Silicate + Silica Sand Mixing Machine
M-6 = Shot Blast Machine (Small) Fan’s Motor
M-7 = Shot Blast Machine (Small) Blower
Figure 8.7 Comparison of Energy Consumption before and after the Project with
Indication of Actual Power Required in Green Color
0
5
10
15
20
25
30
M-1 M-2 M-3 M-4 M-5 M-6 M-7
Motor's Power Before Project
Motor's Power After Project
Max. Power Required

Chapter 8- Validation of Model and Discussions
177
Figure 8.8 Financial Effect of Energy Consumption before and after the Project and
Price Saving
Figure 8.9 Power Consumption Difference before and after Project and Power Saving
150,030.2
116,917
33113.2
KWH/Yr
Total Avg.Annual Energy Use byoversized Motors beforeReplacements (KWH/Yr)
Total Avg.Annual Energy Use byMotors after Replacements withproperly sized Motors (KWH/Yr)
Total Avg.Annual Energy Savingsafter Replacement of properlysized Motors (KWH/Yr)
2,475,498.5
1,929,142.7
546,355.82
Energy Cost (Rs/Yr)
Total Avg.Annual Cost of OversizedMotors before Replacements (Rs/Yr)
Total Avg.Annual Energy Cost afterReplacement of Oversized MotorsWith Properly Sized Motors (Rs/Yr)Total Avg.Annual Energy CostSavings (Rs/Yr)

Chapter 8- Validation of Model and Discussions
178
8.6 Results in Financial Terms
All these increments resulted in huge financial impacts. In view of the privacy and secrecy
policies of the concerned company, only the revenue differences will be elaborated upon and its
profit margins will not be discussed here. Only 9 parts out of 58 will be discussed here. Table 8.6
shows difference of production in number of parts produced and also the financial affects. In the
first segment of the table, difference in production between 2010 and 2011 is shown. In the
columns difference per month is shown and then its financial effect is calculated. In the last
columns difference per annum and its price impact is depicted. As can be seen from the table, a
huge increase of 18440 drums per annum were achieved for brake drum ST, while an increase of
17902 were achieved for brake drum SB. A total of 50.906 MN Rs were achieved from 2010 to
2011 in total for 9 selected parts. Then in the second row, difference of 2011 and 2012 are shown
giving an increase of 101.617 MN Rs. In the last rows the comparison of 2010 with 2012 is given
showing the difference in two years’ time. An increase of 31670 drums per annum is one of the
most prominent figures. Similarly increase of 23 thousand drum SB and 22 thousand Brake Disc
SBs was achieved in these two years. Overall impact of Rs 143.935 MN was achieved due to
proper implementation of most of the concepts discussed in the model.
Activity cost chains were another achievement tool due to which huge price revisions were
received from the OEMs. These activity cost chains ensured the OEMs about the actual cost of
manufacturing so that they were no longer reluctant to allow the price revisions. Previously, a lot
of price revision requests used to be denied as people were not able to convince the representatives
of the OEMs. All the revision cases which were successfully executed were accumulated. In these
calculations all the revision cases were collected with the effective date since when these revisions
were effective.

Chapter 8- Validation of Model and Discussions
179
Table 8.6 Difference in Revenues from 2010 to 2012 after Implementation of the Model

Chapter 8- Validation of Model and Discussions
180
Calculations are done for all the parts which have been supplied after these price
revisions and their price impacts. In the columns, first the old price of the component was entered
then its revised price was entered. In the next column, dispatch quantity was written. Then
differences in the prices were totaled in the end. For Suzuki components an extra amount of Rs
172.180 MN was collected for the same number of parts in less than two years’ time. For Al ghazi
tractors a total of 12.890 MN was collected in less than a years’ time. For Millat tractors a total of
Rs 26.984 MN were received in less than ten months’ time. On the whole a total of Rs 217.546
MN was received by the organization as extra amount due to these price revision cases.
8.7 Conclusions & Recommendations
There is no single methodology available in the world which can give a perfect solution to
the industries of the world. There are many techniques and technologies invented which have to
be used in combination for achieving efficiency and higher productivity that can ultimately lead
to better performance and profits. The confusion of management on choosing appropriate
methodology has led to invention of different combinations for different industries. Mostly all
management technologies require a major portion of resources. Several research works have been
initiated all over the world to develop customized solutions for different industries. This research
was an endeavor to establish a comprehensive framework for productivity enhancement in
Pakistan automotive industry. During the course of development of this framework, one of the
most important aspect considered was the types of technologies. According to Sumanth [4], there
are four types of technologies, product technology, process technology, information technology
and managerial technology. According to this author, process technology is most crucial for
productivity enhancement in any organization. However, in this research all four types have been
considered for productivity enhancement because role of other three types in productivity

Chapter 8- Validation of Model and Discussions
181
enhancement cannot be ruled out. For managerial technology, the concepts included in the
proposed and validated productivity enhancement model are HRD, Modified JIT, TQM, Agile
manufacturing, SCM, TPM, Tpgmt, Energy Audits, and TRIZ. For process technologies concepts
of process analysis, optimization techniques, modified JIT, Agile Manufacturing, and TRIZ
concepts have been incorporated. For amalgamation of information technologies concepts of ERP,
SCM and CAD/CAM have been included. For integration of product technologies concepts of
Autonomous Development and TRIZ have been incorporated.
In an attempt to provide solution to the industry, different successful models have been
proposed and tested. TAM and TAM2 [91] were attempts in this regard. The biggest shortfall of
TAM however, was that it was established for information technology only. Technology
acceptance model is required for all the three remaining technologies as well, i.e. process
technology, product technology and management technology. The model developed and validated
in this research is actually a TAM covering all four aspects of technology. In an attempt to develop
a model for automotive industry of Pakistan, actually a TAM has been developed and tested which
can be generalized not only to other industries but can also be generalized for all developing
countries.
After establishment of this framework proper implementation methodology has also been
narrated. Using and properly implanting this model will result in higher gains for any industry with
minimum possible investments. In finalization of this model, the first and foremost aspect that was
given most importance was using less capital intensive technologies. However, implementation
has to be stage wise, as implementation stage requires cultural change and resistance in the system
and people make the task even more challenging. This research has shown that the biggest waste
in Pakistan automotive industry is underutilization of capacity. Optimization techniques discussed
Chapter 8- Validation of Model and Discussions
182
in this model will result in elimination of these wastes and will result in better productivity. It has
also been understood from this study that similar kind of research has to be conducted on mega
scale if we want to take our industries to the highest ranks in global competition. The sub model
developed in understanding of the industry gave the true picture of the prevailing condition of the
industry and also about the future plans of the top management people of the industry. But once
these models were cross checked and analyzed, it was found that there is huge gap between the
prevailing practices in the industry, the problems faced in the industry, opinion on what should be
the productivity enhancement model of this industry and especially, the future plans of these
experts. For example the problem of resistance by the people, non-availability of skilled
manpower, less educated work force and vendor in-capabilities were highlighted as the core issues
in implementation of latest techniques and technologies resulting in slag in the improvement
activities. But very strangely it was found that in the future plans of these same individuals, there
are no remedial actions against these sore issues. It is believed by the researcher that the core issue
making hindrances in the productivity improvement must be dealt with at top priority. Therefore,
all these remedies have been included in the proposed productivity enhancement framework of
this research.
Detailed recommendations and phase wise implementation methodology has already been
elaborated upon in Chapter 7. Salient points of the recommendations are enumerated as under for
cost effective manufacturing:-
1. Downsizing is not the best option for any organization, as it leads to several issues
including dissatisfaction of employees and intentions to leave. Best option is to conduct
a detailed work study as suggested and “Right Sizing” should be resorted to. During
right sizing it is easy for management to justify the manpower required for a specific

Chapter 8- Validation of Model and Discussions
183
task and extra manpower can easily be adjusted in the other sections of the same
company where the need arises. The same skilled manpower can also be employed on
other lines where new lines for new developed parts are to be set up instead of hiring
new and raw workforce.
2. Considering the ever growing demand of the local as well as international market, it is
eminent that one or two R&D sections cannot meet the demands. Several “Autonomous
Development Sections” in the organization can do wonders and time to market can be
reduced drastically. This will ensure enhanced confidence of the customers in the
organizational performance.
3. Automation is expensive. A thorough research should be conducted and feasibility
report of the project must be made before going for “BUY” decisions for automation
lines. Better option available to the manufacturing units is “Optimization First”. As
already shown by the results of this research that underutilization of plant is one of the
major issues in these companies, so optimization can enhance productivity of the
organizations without huge investments. However, if the cost of manufacturing can be
reduced by automation than automation should be made considering the financial costs
in view.
4. Wastage is our worst enemy. We have to identify them daily and eliminate them. The
complete record of daily wastage elimination must be kept for complete cultural change
of the organization.
5. Asking for price increase from OEMs especially in developing countries like Pakistan
is a very sour issue, which can result in annoying the customers. The only solution to
the problem is implementing of “Activity Based Costing” and gradually improving the
Chapter 8- Validation of Model and Discussions
184
system to “Activity Cost Chains”. Without long difficult meetings changing markets
prices of the material and labor can easily be incorporated in the final price of the
products.
6. Buying generator is not the first step. First conduct detailed energy audits. A lot of
energy is being wasted in the industry. These energy audits will result in huge cost and
energy savings as shown by the results of validated model. These audits will also show
the actual requirement of the power of the generator to be bought resulting is
investment savings.
7. Energy crisis as faced by the industry of Pakistan warrants concentration on all
alternate energy resources available in the market. This aspect is not deliberated upon
much by top management of the companies.
8. Buying more and more machines and equipment, as demanded by the production and
quality departments is not the right decision. Changing and improving existing layouts
with continual process analyses can increase production on the same machines.
9. Huge raw material inventory can be reduced by conducting material optimization
experiments and daily activities to save material. Process once developed does not
mean that material optimization cannot be done by Kaizen activities.
10. The concept of zero-inventories as given in JIT has not been found very successful
specifically in Pakistan auto industry, as reported by several organizations. Modified
JIT with customized solutions has been found more successful. Considering the kind
of parts and assemblies produced some inventory levels have to be maintained to avoid
production interruptions.

Chapter 8- Validation of Model and Discussions
185
11. To have big enterprise is not an indicator of success. Developing a “Niche Enterprise”,
which can adjust as per the demands of the market, is the key to success. Being
agile/adaptive as per requirements of the market will only ensure competitive edge in
the prevailing global competition. Developing flexible manufacturing lines which can
produce different kind of parts as per the requirement is one of the best way to achieve
performance excellence.
12. Being knowledge intensive enterprise is better from being capital intensive enterprise.
Financial cost is one of the most expensive costs for manufacturing. Heavy investments
especially in dead capital inventory (buildings and constructions) must be avoided.
Unfortunately in Pakistani organizations huge investments are made in fixed capital
instead of investing in running capital.
13. Striving for full automation cannot result in cost effective manufacturing. Having
islands of automation with combination of conventional machinery as proved via model
validation gives enhanced profits due to most cost effective manufacturing.
14. Productivity department has to be incorporated in the infrastructure of the organization.
Productivity measurement, productivity planning, productivity evaluation and
productivity enhancement sections have to be made and skilled productivity specialist
have to be hired for better productivity.
15. Having huge maintenance departments are overheads on manufacturing costs.
Implement Total Productivity Maintenance concept by enhancing worker skills to
reduce the overheads of the company.
16. SCM department and MM departments cannot work effectively and efficiently without
proper implementation of Supply Chain Management Philosophy. This philosophy has

Chapter 8- Validation of Model and Discussions
186
to be implemented right from the organogram of the company. For easy implementation
ERP solutions have proved to be very successful especially in Pakistani organizations.
But every organization has to conduct a comprehensive need assessment analysis
before final investment in any ERP solution. Implementing expensive solutions like
SAP for small and medium organization is not the advisable investment decision.
17. Quality Culture development in any organization is the prime step. Starting from
investing in expensive solutions like Six Sigma before incorporating quality culture in
any organization cannot give desired results. Implementing PDCA circles first is a
better choice. Running after ISO certification only cannot ensure the quality change
required, as is perceived erroneously in Pakistani organizations. Proper utilization of
SPC tools on-ground can ensure better quality controls. Quality Assurance in
combination with quality control departments has to be developed and made effective
for ensuring this quality culture.
18. We have to change the Human Resource Departments into Human Resource
Development Departments to ensure better performance of the employees. Skills of the
employees have to be enhanced through training and career development. Educated
manpower has to be employed with maximum possible efforts to make all the above
points successful. Trying to hire less educated manpower to save labor cost is not a
good choice at all. Job satisfaction and job security of the employees have to be ensured
through the measures as explained in chapter 7 to enhance and ensure better
productivity of the workers and the organization. EOBI and workers old age benefits
are not overheads they actually add value to the product manufactured in the longer
run, these aspects are mostly neglected in these organizations.
Chapter 8- Validation of Model and Discussions
187
19. Continuous Improvements through KAIZEN Culture can only make the great change
at the end of the day. Incentive has to be given to the workers to ensure implementation
of this culture
20. TRIZ techniques of “Innovation and Creativity” are essence of success for any
organization of any nature. In daily operations as well these aspect has to be inculcated
which can only come by through empowerment and worker participation. We have to
implement the tools of TRIZ to achieve organizational success.
Chapter Summary
In this chapter the validation of this model has been proved by highlighting and indicating
the improvements achieved due to its implementation. The improvements achieved have been
elaborated in six different paradigms. Improvements achieved in the production volumes,
elaborated with the help of production graphs. Human Resource savings. KAIZEN’s Achieved.
Development projects successfully completed. Energy audit results. Results in financial terms of
the outcomes of these implementations. Production graphs showed enormous increase in the
production volumes i.e. up to 652% production increase in one of the component. All these
production targets were achieved without adding even a single machine/equipment in the already
held assets of the company. Rather, several machines not required and found extra were removed
from the production line and placed in stores for future utilization. Another aspect to mention is
the fact that all these production volumes were achieved with 10% to 50% reduction in the
manpower. The energy consumption which was a direct cost to the production was also reduced
to 25%- 30%. 1000 Kaizen’s were achieved in one year’s span due to implementation of this
model. Due to implementation of Autonomous Development concept several new products were
developed in a record time. In financial terms overall impact of Rs 143.935 MN was achieved in
revenues of the organization due to proper implementation of most of the concepts discussed in
the model. Recommendations have been given in this chapter for all the stake holders.
188
REFERENCES
[1] M. P. Todaro and S. C. Smith, “Economic development,” Engl. Pearson Educ. Ltd., 2009.
[2] M. E. Porter, “Competitive Advantage, Agglomeration Economies, and Regional Policy,”
Int. Reg. Sci. Rev., vol. 19, no. 1–2, pp. 85–90, Apr. 1996.
[3] M. E. Porter, Competitive Advantage of Nations: Creating and Sustaining Superior
Performance. Simon and Schuster, 2011.
[4] D. J. Sumanth, Total Productivity Management (TPmgt): A Systemic and Quantitative
Approach to Compete in Quality, Price and Time. CRC Press, 1997.
[5] A. Azadeh, M. Sheikhalishahi, S. M. Khalili, and M. Firoozi, “An integrated fuzzy
simulation–fuzzy data envelopment analysis approach for optimum maintenance planning,”
Int. J. Comput. Integr. Manuf., vol. 27, no. 2, pp. 181–199, 2014.
[6] M. A. Azadeh, “Optimizing the existing machinery resources,” Technical report, 2000.
[7] M. Born, J. Hössler, O. Kath, M. Soden, and S. Saito, “Significant productivity enhancement
through model driven techniques: a success story,” in 2013 17th IEEE International
Enterprise Distributed Object Computing Conference, 2006, pp. 367–373.
[8] B. Das, “Development of a comprehensive industrial work design model,” Hum. Factors
Ergon. Manuf. Serv. Ind., vol. 9, no. 4, pp. 393–411, 1999.
[9] M. Hannula, Productivity measurement methods at the firm level. Tampere University of
Technology, 1998.
[10] M. Hannula, “Total productivity measurement based on partial productivity ratios,” Int. J.
Prod. Econ., vol. 78, no. 1, pp. 57–67, Jul. 2002.
[11] J. Hossler, M. Born, and S. Saito, “Significant Productivity Enhancement Through Model
Driven Techniques: A Success Story,” in Proceedings of the 10th IEEE International
189
Enterprise Distributed Object Computing Conference, Washington, DC, USA, 2006, pp.
367–373.
[12] J. R. Lindner, “Understanding employee motivation,” J. Ext., vol. 36, no. 3, pp. 1–8, 1998.
[13] R. Mahadevan, New Currents in Productivity Analysis. Asian Productivity Organisation,
2002.
[14] R. Mahadevan, “A DEA Approach to Understanding the Productivity Growth of Malaysia’s
Manufacturing Industries,” Asia Pac. J. Manag., vol. 19, no. 4, pp. 587–600, Dec. 2002.
[15] R. Mahadevan, “A frontier approach to measuring total factor productivity growth in
Singapore’s services sector,” J. Econ. Stud., vol. 29, no. 1, pp. 48–58, Feb. 2002.
[16] S. H. Park, Six Sigma for quality and productivity promotion. Asian Productivity
Organization, 2003.
[17] J. A. Tompkins, J. A. White, Y. A. Bozer, and J. M. A. Tanchoco, Facilities Planning. John
Wiley & Sons, 2010.
[18] L. Wang and A. Szirmai, “Productivity growth and structural change in Chinese
manufacturing, 1980–2002,” Ind. Corp. Change, vol. 17, no. 4, pp. 841–874, 2008.
[19] S. Z. Sarwar, A. Ishaque, N. Ehsan, D. S. Pirzada, and Z. M. Nasir, “Identifying productivity
blemishes in Pakistan automotive industry: a case study,” Int. J. Product. Perform. Manag.,
vol. 61, no. 2, pp. 173–193, 2012.
[20] H. Singh, J. Motwani, and A. Kumar, “A review and analysis of the state‐of‐the‐art research
on productivity measurement,” Ind. Manag. Data Syst., vol. 100, no. 5, pp. 234–241, Jul.
2000.
[21] S. Tripathy, “Are Foreign Firms Allocatively Inefficient?: A study of selected
manufacturing industries in India,” in Fifth Annual GEP Postgraduate Conference
190
(Leverhulme Centre for Research on Globalisation and Economic Policy (GEP),
Nottingham. http://www. nottingham. ac.
uk/economics/leverhulme/conferences/postgrad_conf_2006/Tr ipathy1. pdf, 2006.
[22] T. Grünberg, “A review of improvement methods in manufacturing operations,” Work
Study, vol. 52, no. 2, pp. 89–93, 2003.
[23] T. Grünberg, “Performance improvement: towards a method for finding and prioritising
potential performance improvement areas in manufacturing operations,” Int. J. Product.
Perform. Manag., vol. 53, no. 1, pp. 52–71, 2004.
[24] M. Jackson, An analysis of flexible and reconfigurable production systems: an approach to
a holistic method for the development of flexibility and reconfigurability. Production
Systems, Department of Mechanical Engineering, Linköpings universitet, 2000.
[25] P. Linna, S. Pekkola, J. Ukko, and H. Melkas, “Defining and measuring productivity in the
public sector: managerial perceptions,” Int. J. Public Sect. Manag., vol. 23, no. 5, pp. 479–
499, 2010.
[26] S. Tangen, “An overview of frequently used performance measures,” Work Study, vol. 52,
no. 7, pp. 347–354, 2003.
[27] S. Tangen, “Demystifying productivity and performance,” Int. J. Product. Perform. Manag.,
vol. 54, no. 1, pp. 34–46, 2005.
[28] A. j. Thomas, R. Barton, and E. g. John, “Advanced manufacturing technology
implementation,” Int. J. Product. Perform. Manag., vol. 57, no. 2, pp. 156–176, Jan. 2008.
[29] M. West, “Essays on Productivity, Flexibility and Manufacturing Networks,” Linköping
Stud. Sci. Technol. Thesis, no. 757, 1999.
[30] B. Gottschalk and R. Kalmbach, Mastering Automotive Challenges. Kogan Page, 2007.

191
[31] K. J. Linker, “The Toyota Way: 14 Management Principles from the World’s Greatest
Manufacturers,” MacGrawHill N. Y., 2004.
[32] V. Phongpetra and L. M. Johri, “Impact of business strategies of automobile manufacturers
in Thailand,” Int. J. Emerg. Mark., vol. 6, no. 1, pp. 17–37, 2011.
[33] A. Hallihan, P. Sackett, and G. M. Williams, “JIT manufacturing: The evolution to
animplementation model founded in current practice,” Int. J. Prod. Res., vol. 35, no. 4, pp.
901–920, 1997.
[34] C. Herron and P. M. Braiden, “Defining the foundation of lean manufacturing in the context
of its origins (Japan),” 2007, vol. 2007, pp. 148–157.
[35] R. Hoskisson, M. Hitt, R. D. Ireland, and J. Harrison, Competing for advantage. Cengage
Learning, 2012.
[36] T. Laosirihongthong and G. S. Dangayach, “A comparative study of implementation of
manufacturing strategies in Thai and Indian automotive manufacturing companies,” J.
Manuf. Syst., vol. 24, no. 2, pp. 131–143, 2005.
[37] D. Pyke, J. Farley, and D. Robb, “Manufacturing Technology and Operations in China:: A
Survey of State-owned Enterprises, Private Firms, Joint Ventures and Wholly-owned
Foreign Subsidiaries,” Eur. Manag. J., vol. 20, no. 4, pp. 356–375, Aug. 2002.
[38] M. Saad and B. Patel, “An investigation of supply chain performance measurement in the
Indian automotive sector,” Benchmarking Int. J., vol. 13, no. 1/2, pp. 36–53, 2006.
[39] “Center for Automotive Research,” Wikipedia, the free encyclopedia. 22-Aug-2014.
[40] “Automotive industry outlook - knoema.com,” Knoema. [Online]. Available:
http://knoema.com/gdwntfe/automotive-industry-outlook.
[41] “Organisation Internationale des Constructeurs d’Automobiles,” 2014.
192
[42] Anonymous, “ADB Annual Report 2008,” Asian Development Bank, 10-Apr-2014.
[Online]. Available: http://www.adb.org/documents/adb-annual-report-2008.
[43] H. J. Harrington, “The new model for improvement: total improvement management,”
Manag. Decis., vol. 33, no. 3, pp. 17–24, 1995.
[44] R. McTavish, A. Gunasekaran, S. Goyal, and P. Yli-Olli, “Establishing a strategic
framework for improving productivity,” Integr. Manuf. Syst., vol. 7, no. 4, pp. 12–21, 1996.
[45] C. Herron and P. M. Braiden, “A methodology for developing sustainable quantifiable
productivity improvement in manufacturing companies,” Int. J. Prod. Econ., vol. 104, no.
1, pp. 143–153, 2006.
[46] H. F. Goodwin, “Improvement must be managed,” J. Ind. Eng., vol. 19, no. 11, p. 538, 1968.
[47] R. A. Sutermeister, People and productivity. McGraw-Hill New York, 1976.
[48] J. C. Hershauer and W. A. Ruch, “A Worker productivity model and its use at Lincoln
Electric,” Interfaces, vol. 8, no. 3, pp. 80–90, 1978.
[49] N. F. Crandall and L. M. Wooton, “Developmental strategies of organizational
productivity,” Calif. Manage. Rev., vol. 21, no. 2, pp. 37–46, 1978.
[50] W. T. Stewart, “A productivity improvement strategy at the firm level,” Manuf. Product.
Front., vol. 4, no. 1, pp. 20–27, 1980.
[51] D. J. Sumanth, Productivity engineering and management: Productivity measurement,
evaluation, planning, and improvement in manufacturing and service organizations.
McGraw-Hill, 1984.
[52] M. Jackson and P. Petersson, “A Model for Development of Future Manufacturing
Systems,” presented at the Proceedings of the 32nd CIRP International Seminar on
Manufacturing Systems, 1999, pp. 449–457.

193
[53] B. E. Thomas and J. P. Baron, “Evaluating Knowledge Worker Productivity: Literature
Review,” Jun. 1994.
[54] I. Ahmed, M. M. Nawaz, N. Iqbal, I. Ali, Z. Shaukat, and A. Usman, “Effects of
motivational factors on employees’ job satisfaction a case study of University of the Punjab,
Pakistan,” Int. J. Bus. Manag., vol. 5, no. 3, pp. 70–80, 2010.
[55] N. Ahsan, Z. Abdullah, D. G. Fie, and S. S. Alam, “A study of job stress on job satisfaction
among university staff in Malaysia: Empirical study,” Eur. J. Soc. Sci., vol. 8, no. 1, pp.
121–131, 2009.
[56] A. Crossman and P. Harris, “Job satisfaction of secondary school teachers,” Educ. Manag.
Adm. Leadersh., vol. 34, no. 1, pp. 29–46, 2006.
[57] J. De Nobile, J. McCormick, and K. Hoekman, “Organizational communication and
occupational stress in Australian Catholic primary schools,” J. Educ. Adm., vol. 51, no. 6,
pp. 744–767, 2013.
[58] S. J. Kass, S. J. Vodanovich, and A. Callender, “State-trait boredom: Relationship to
absenteeism, tenure, and job satisfaction,” J. Bus. Psychol., vol. 16, no. 2, pp. 317–327,
2001.
[59] A. Heshmati, “Productivity Growth, Efficiency and Outsourcing in Manufacturing and
Service Industries,” J. Econ. Surv., vol. 17, no. 1, pp. 79–112, Feb. 2003.
[60] N. T. Khayyat and A. Heshmati, “Production Risk, Energy Use Efficiency and Productivity
of Korean Industries,” 2014.
[61] B. Gold, “Improving industrial performance through integrating quality and productivity
advances,” Technovation, vol. 10, no. 8, pp. 521–530, 1990.

194
[62] S. C. Aggarwal, “A study of productivity measures for improving benefit-cost ratios of
operating organizations,” Int. J. Prod. Res., vol. 18, no. 1, pp. 83–103, 1980.
[63] P. A. C. Miguel and J. M. Andrietta, “Benchmarking Six Sigma application in Brazil: best
practices in the use of the methodology,” Benchmarking Int. J., vol. 16, no. 1, pp. 124–134,
2009.
[64] M. Hitt, R. D. Ireland, and R. Hoskisson, Strategic management cases: competitiveness and
globalization. Cengage Learning, 2012.
[65] I. C. MacMillan and R. G. McGrath, “Discovering new points of differentiation,” Harv.
Bus. Rev., vol. 75, pp. 133–145, 1997.
[66] S. Z. Dawal, Z. Taha, and Z. Ismail, “Effect of job organization on job satisfaction among
shop floor employees in automotive industries in Malaysia,” Int. J. Ind. Ergon., vol. 39, no.
1, pp. 1–6, 2009.
[67] C. C. Markides, “A dynamic view of strategy,” Sloan Manage. Rev., vol. 40, no. 3, pp. 55–
63, 1999.
[68] C. Hill and G. Jones, Strategic management: An integrated approach. Cengage Learning,
2007.
[69] R. K. Zutshi and P. T. Gibbons, “The internationalization process of Singapore government-
linked companies: a contextual view,” Asia Pac. J. Manag., vol. 15, no. 2, pp. 219–246,
1998.
[70] J. Amara, “Military industrialization and economic development: Jordan’s defense
industry,” Rev. Financ. Econ., vol. 17, no. 2, pp. 130–145, 2008.

195
[71] S. Z. Sarwar, N. Ehsan, J. L. Mirza, M. Azeem, and A. Ishaque, “Barriers of Productivity
in Public Sector Automotive Manufacturing Industry of Pakistan,” World Acad. Sci. Eng.
Technol. 65 2010, 2010.
[72] “Economic Survey 2006-07: seven percent growth spurred by agriculture, LSM and
service,” Pakistan Defence. [Online]. Available: http://defence.pk/threads/economic-
survey-2006-07-seven-percent-growth-spurred-by-agriculture-lsm-and-service.5778/.
[73] “Pakistan Bureau of Statistics,” 2014.
[74] J. R. Lincoln and A. L. Kalleberg, “Work organization and workforce commitment: A study
of plants and employees in the US and Japan,” Am. Sociol. Rev., pp. 738–760, 1985.
[75] F. Luthans, H. S. McCaul, and N. G. Dodd, “Organizational commitment: A comparison of
American, Japanese, and Korean employees,” Acad. Manage. J., vol. 28, no. 1, pp. 213–
219, 1985.
[76] L. E. Palich, P. W. Horn, and R. W. Griffeth, “Managing in the international context: Testing
cultural generality of sources of commitment to multinational enterprises,” J. Manag., vol.
21, no. 4, pp. 671–690, 1995.
[77] S. M. Sommer, S.-H. Bae, and F. Luthans, “Organizational commitment across cultures:
The impact of antecedents on Korean employees,” Hum. Relat., vol. 49, no. 7, pp. 977–993,
1996.
[78] A. Azadeh, M. Sheikhalishahi, M. Firoozi, and S. M. Khalili, “An integrated multi-criteria
Taguchi computer simulation-DEA approach for optimum maintenance policy and planning
by incorporating learning effects,” Int. J. Prod. Res., vol. 51, no. 18, pp. 5374–5385, 2013.

196
[79] H. Bülbül, N. Ömürbek, T. Paksoy, and T. Bektaş, “An empirical investigation of advanced
manufacturing technology investment patterns: Evidence from a developing country,” J.
Eng. Technol. Manag., vol. 30, no. 2, pp. 136–156, 2013.
[80] G. s. Dangayach and S. g. Deshmukh, “Advanced manufacturing technology
implementation,” J. Manuf. Technol. Manag., vol. 16, no. 5, pp. 483–496, Jul. 2005.
[81] M. Darbanhosseiniamirkhiz and W. K. Wan Ismail, “Advanced Manufacturing Technology
Adoption in SMEs: an Integrative Model,” J. Technol. Manag. Innov., vol. 7, no. 4, pp. 112–
120, 2012.
[82] A. Efstathiades, S. Tassou, and A. Antoniou, “Strategic planning, transfer and
implementation of Advanced Manufacturing Technologies (AMT). Development of an
integrated process plan,” Technovation, vol. 22, no. 4, pp. 201–212, 2002.
[83] E. Taymaz and G. Saatci, “Technical Change and Efficiency in Turkish Manufacturing
Industries,” J. Product. Anal., vol. 8, no. 4, pp. 461–475, Nov. 1997.
[84] S. Kim, “Identifying and estimating sources of technical inefficiency in Korean
manufacturing industries,” Contemp. Econ. Policy, vol. 21, no. 1, pp. 132–144, 2003.
[85] A. E. Coronado, “A framework to enhance manufacturing agility using information systems
in SMEs,” Ind. Manag. Data Syst., vol. 103, no. 5, pp. 310–323, 2003.
[86] R. M. Solow, “We’d better watch out,” N. Y. Times Book Rev., vol. 36, 1987.
[87] E. Brynjolfsson, “The productivity paradox of information technology,” Commun. ACM,
vol. 36, no. 12, pp. 66–77, 1993.
[88] PMMI, “Review of Performance Improvement Models and Tools January 2006 1,” PMMI,
2006.
197
[89] F. D. Davis, “Perceived usefulness, perceived ease of use, and user acceptance of
information technology,” MIS Q., pp. 319–340, 1989.
[90] F. D. Davis, “User acceptance of information technology: system characteristics, user
perceptions and behavioral impacts,” Int. J. Man-Mach. Stud., vol. 38, no. 3, pp. 475–487,
1993.
[91] V. Venkatesh and F. D. Davis, “A Theoretical Extension of the Technology Acceptance
Model: Four Longitudinal Field Studies,” Manag. Sci., vol. 46, no. 2, pp. 186–204, 2000.
[92] M. Sigala and K. Chalkiti, “Improving performance through tacit knowledge externalisation
and utilisation: preliminary findings from Greek hotels,” Int. J. Product. Perform. Manag.,
vol. 56, no. 5/6, pp. 456–483, 2007.
[93] C. P. Donegani and S. McKay, “Is there a paradox of lower job satisfaction among trade
union members? European evidence,” Transf. Eur. Rev. Labour Res., vol. 18, no. 4, pp.
471–489, 2012.
[94] C. P. Green and J. S. Heywood, “Dissatisfied union workers: sorting revisited,” Br. J. Ind.
Relat., 2014.
[95] I. Theodossiou and A. Zangelidis, “Career prospects and tenure–job satisfaction profiles:
Evidence from panel data,” J. Socio-Econ., vol. 38, no. 4, pp. 648–657, Aug. 2009.
[96] E. A. Locke, The nature and causes of job satisfaction. Handbook of industry and
organizational psychology. Chicago. Ed. Rand McNally College, 1976.
[97] K. D. Scott and G. S. Taylor, “An Examination of Conflicting Findings on the Relationship
Between Job Satisfaction and Absenteeism: A Meta-Analysis,” Acad. Manage. J., vol. 28,
no. 3, pp. 599–612, Sep. 1985.
198
[98] X. Huang and E. Van De Vliert, “Where intrinsic job satisfaction fails to work: National
moderators of intrinsic motivation,” J. Organ. Behav., vol. 24, no. 2, pp. 159–179, 2003.
[99] C. H. Hui, C. Yee, and K. L. Eastman, “The relationship between individualism—
collectivism and job satisfaction,” Appl. Psychol., vol. 44, no. 3, pp. 276–282, 1995.
[100] A. P. Brief, Attitudes in and around organizations, vol. 9. Sage, 1998.
[101] F. Herzberg, B. Mausner, and B. B. Snyderman, “The Motivation to Work, John Wiley &
Sons,” Inc N. Y., 1959.
[102] R. Ruthankoon and S. Olu Ogunlana, “Testing Herzberg’s two‐factor theory in the Thai
construction industry,” Eng. Constr. Archit. Manag., vol. 10, no. 5, pp. 333–341, Oct. 2003.
[103] E. A. Maidani, “Comparative study of Herzberg’s Two-Factor Theory of job satisfaction
among public and private sectors.,” Public Pers. Manag., 1991.
[104] B. E. Wright and B. S. Davis, “Job Satisfaction In The Public Sector The Role of the Work
Environment,” Am. Rev. Public Adm., vol. 33, no. 1, pp. 70–90, 2003.
[105] J. A. Halepota and Z. Irani, “The impact of organisational antecedents on employee job The
impact of organisational antecedents on employee job satisfaction: An empirical evaluation
of public sector employees in Pakistan,” Transform. Gov. People Process Policy, vol. 5, no.
3, pp. 280–294, 2010.
[106] J. W. Creswell, Research design: Qualitative, quantitative, and mixed methods approaches.
Sage, 2013.
[107] A. Bryman and E. Bell, Business Research Methods 3e. Oxford university press, 2011.
[108] J. Corbin and A. Strauss, Basics of qualitative research: Techniques and procedures for
developing grounded theory. Sage, 2008.

199
[109] E. J. Webb, D. T. Campbell, R. D. Schwartz, and L. Sechrest, Unobtrusive measures:
Nonreactive research in the social sciences, vol. 111. Rand McNally Chicago, 1966.
[110] D. Altheide, Qualitative research methods, V. 38. Thousand Oaks, CA: Sage, 1996.
[111] W. L. Neuman and W. L. Neuman, “Social research methods: Qualitative and quantitative
approaches,” 2006.
[112] K. Charmaz, “Grounded theory methods in social justice research,” Sage Thousand Oaks
CA, pp. 359–380, 2011.
[113] P. Bazeley and K. Jackson, Qualitative data analysis with NVivo. Sage Publications
Limited, 2013.
[114] B. G. Glaser and A. L. Strauss, The discovery of grounded theory: Strategies for qualitative
research. Transaction Publishers, 2009.
[115] J. D. Bringer, L. H. Johnston, and C. H. Brackenridge, “Maximizing transparency in a
doctoral thesis1: The complexities of writing about the use of QSR* NVIVO within a
grounded theory study,” Qual. Res., vol. 4, no. 2, pp. 247–265, 2004.
[116] K. Charmaz, Constructing Grounded Theory. SAGE, 2014.
[117] A. J. Hutchison, L. H. Johnston, and J. D. Breckon, “A grounded theory of successful long-
term physical activity behaviour change,” Qual. Res. Sport Exerc. Health, vol. 5, no. 1, pp.
109–126, 2013.
[118] T. Richards and L. Richards, “The way ahead in qualitative computing,” J. Mod. Appl. Stat.
Methods, vol. 2, no. 1, p. 4, 2003.
[119] B. G. Glaser, Emergence vs forcing: Basics of grounded theory analysis. Sociology Press,
1992.
200
[120] T. Laosirihongthong, H. Paul, and M. W. Speece, “Evaluation of new manufacturing
technology implementation: an empirical study in the Thai automotive industry,”
Technovation, vol. 23, no. 4, pp. 321–331, 2003.
[121] J. B. ReVelle, Manufacturing handbook of best practices: An innovation, productivity, and
quality focus. CRC Press, 2001.

201
ANNEXURE A
FORMULAE FOR PRODUCTIVITY MEAUREMENT
OUT QUANTITY = Considered as All Finished Cars produced in the respective Year
GROSS OUTPUT PRICE= Total Number of Product produced in each year x Base Period Ex-
Factory Prices + Prices of Partially Produced Products Obtained from (Difference of Work
in Process Inventory at the beginning and End of Financial Year)
(Consider by multiplying through base period Price into the respective different Product of Cars)
VALUE ADDED OUTPUT= Deflated Gross Output – Deflated Material – Deflated Energy –
Deflated Other expenses
(Counted by subtracting Deflated Material, Deflated Energy and Deflated Other expenses from
Gross Output Price)
OUT CAPACITY= Considered as The output Capacity of the Manufacturing Unit obtained from
Notes to Financial Statement
NUMBER OF EMPLOYEES= Obtained from Financial statement
Counted Number of direct Labour of Permanent Employees of the Company for that specific year
Total No of Man Hours in One Year= 48 Hours per Week (Obtained from Labour Policy of
Pakistan) Out of 52 week we have taken 20 Gazette Holidays and 52 Sunday i-e Off week days
become 12 weeks. Subtracting 2 more weeks of Ramzan from total as in Ramzan working hours
counted as half. So Total 12 weeks are taken out from 52 weeks, making them 40 week of work
per year. (48 Hours per week x 40 weeks= 1920 Hours)
LABOUR MAN HOURS = Number of Employees x 1920 Hours per year
(It has been calculated from the Labour Policy of Pakistan, allowable working hours to the No of
employees and with respective working days in a year.)

202
Annexure A
LABOUR VALUE= Salaries Wages and Benefits from Cost of Sales + Salaries Wages and
Benefits of Distribution and Marketing Cost + Salaries Wages and Benefits of Administrative
Expenses (Extracted from Note to Financial statement, mostly given at Point 23, 24 and 25)
DEF LABOUR VALUE= Deflating Labour value with the Bas value price.
FIXED CAPITAL= Noted as of Book Value of Property Plant and Equipment
WORKING CAPITAL= Capital work in Progress
TOTAL CAPITAL= Fixed Capital + Working Capital
DEFLATED TOTAL CAPITAL= By Adding deflated working and Fixed capital.
MATERIAL= Raw Material consumed + Store and Spares consumed)
(Accounted from point 23 of Notes to Financial Statements with heading of Cost of sales while
reducing it to cost of goods manufactured from the same column Raw Material Consumed and
Stores and spare)
ENERGY= Fuel and Power + Fuel and Power of Distribution and Marketing Cost, +
Administrative Expenses on Fuel and Power
(Counted as Fuel and Power from Cost of Sales, Distribution and Marketing Cost, and
Administrative Expenses)
DEFLATED ENERGY= Deflating Energy with the Base Period
OTHER= Cost of Good Manufactured (from Heading of Cost of Sales) + Distribution and
Marketing Cost + Administrative Expenses + Other Operating Expenses + Finance Cost +
Taxation – {(Raw Material Consumed + Stores and Spares Consumed + Salaries Wages and
Benefits + Fuel Power from Cost of Sales) + (Salaries wages and benefits + Fuel and Power from

203
Annexure A
Distribution and Marketing Costs) + (Salaries wages and benefits + Fuel and Power from
Administration Expenses)}
DEFLATED OTHERS
TOTAL INPUT= Deflated values of Labour + Deflated Working Capital + Deflated Fixed capital
+ Deflated Material + Deflated Energy and Other Expenses
Accounted as Deflated values of Labour, Working and Fixed capital, Material, Energy and Other
Expenses
TOTAL PRODUCTIVITY= 𝐺𝑟𝑜𝑠𝑠 𝑂𝑢𝑡𝑝𝑢𝑡
𝑇𝑜𝑡𝑎𝑙 𝐼𝑛𝑝𝑢𝑡𝑠
Extracted by diving Deflated Gross Output with the Total Inputs
PRODUCTIVITY INDEX=
Partial Productivity of Labor= 𝐺𝑟𝑜𝑠𝑠 𝑂𝑢𝑡𝑝𝑢𝑡
𝐿𝑎𝑏𝑜𝑢𝑟 𝑉𝑎𝑙𝑢𝑒
Extracted by Dividing Deflated Gross Output with Deflated Labor Value
Partial Productivity of Material= 𝐷𝑒𝑓𝑙𝑎𝑡𝑒𝑑 𝐺𝑟𝑜𝑠𝑠 𝑂𝑢𝑡𝑝𝑢𝑡
𝐷𝑒𝑓𝑙𝑎𝑡𝑒𝑑 𝑀𝑎𝑡𝑒𝑟𝑖𝑎𝑙 𝑉𝑎𝑙𝑢𝑒
Extracted by Dividing Deflated Gross Output with Deflated Material Input Value
Partial Productivity of Energy= 𝐷𝑒𝑓𝑙𝑎𝑡𝑒𝑑 𝐺𝑟𝑜𝑠𝑠 𝑂𝑢𝑡𝑝𝑢𝑡
𝐷𝑒𝑓𝑙𝑎𝑡𝑒𝑑 𝐸𝑛𝑒𝑟𝑔𝑦 𝑉𝑎𝑙𝑢𝑒
Extracted by Dividing Deflated Gross Output with Deflated Energy Value
Partial Productivity of Capital = 𝐷𝑒𝑓𝑙𝑎𝑡𝑒𝑑 𝐺𝑟𝑜𝑠𝑠 𝑂𝑢𝑡𝑝𝑢𝑡
𝐷𝑒𝑓𝑙𝑎𝑡𝑒𝑑 𝐶𝑎𝑝𝑖𝑡𝑎𝑙 𝑉𝑎𝑙𝑢𝑒
Extracted by Dividing Deflated Gross Output with Deflated Total Capital
Total Productivity = 𝑂𝑢𝑡𝑝𝑢𝑡
𝐼L + 𝐼 M + 𝐼 F,C+ 𝐼 W,C + 𝐼 E + 𝐼X
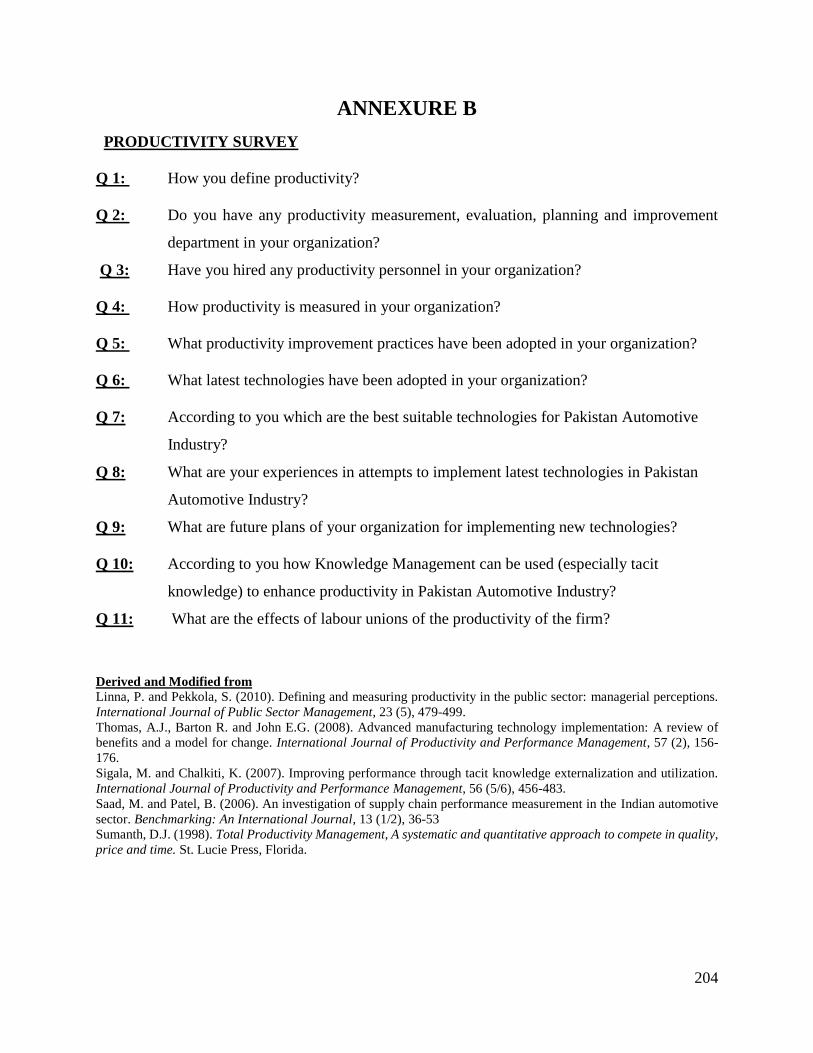
204
ANNEXURE B
PRODUCTIVITY SURVEY
Q 1: How you define productivity?
Q 2: Do you have any productivity measurement, evaluation, planning and improvement
department in your organization?
Q 3: Have you hired any productivity personnel in your organization?
Q 4: How productivity is measured in your organization?
Q 5: What productivity improvement practices have been adopted in your organization?
Q 6: What latest technologies have been adopted in your organization?
Q 7: According to you which are the best suitable technologies for Pakistan Automotive
Industry?
Q 8: What are your experiences in attempts to implement latest technologies in Pakistan
Automotive Industry?
Q 9: What are future plans of your organization for implementing new technologies?
Q 10: According to you how Knowledge Management can be used (especially tacit
knowledge) to enhance productivity in Pakistan Automotive Industry?
Q 11: What are the effects of labour unions of the productivity of the firm?
Derived and Modified from
Linna, P. and Pekkola, S. (2010). Defining and measuring productivity in the public sector: managerial perceptions.
International Journal of Public Sector Management, 23 (5), 479-499.
Thomas, A.J., Barton R. and John E.G. (2008). Advanced manufacturing technology implementation: A review of
benefits and a model for change. International Journal of Productivity and Performance Management, 57 (2), 156-
176.
Sigala, M. and Chalkiti, K. (2007). Improving performance through tacit knowledge externalization and utilization.
International Journal of Productivity and Performance Management, 56 (5/6), 456-483.
Saad, M. and Patel, B. (2006). An investigation of supply chain performance measurement in the Indian automotive
sector. Benchmarking: An International Journal, 13 (1/2), 36-53
Sumanth, D.J. (1998). Total Productivity Management, A systematic and quantitative approach to compete in quality,
price and time. St. Lucie Press, Florida.
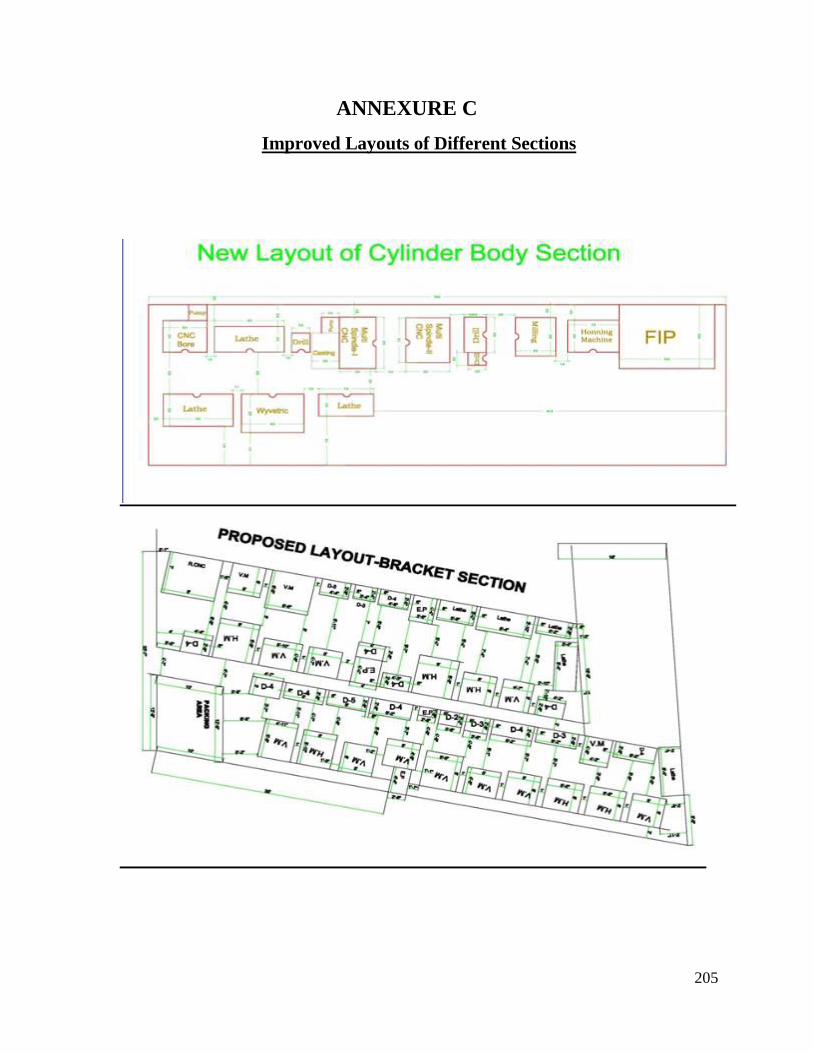
205
ANNEXURE C
Improved Layouts of Different Sections

206
Annexure C

207
CURRICULUM VITAE
Name: Sheikh Zahoor Sarwar
Father’s Name: Sheikh Muhammad Sarwar
Regn. No.: F-08-120
Contact: 0321-5564525
Address: House 27A, Park Road F-8/1 Islamabad
Phone: 0512852566
E-mail (s): [email protected]
Courses Passed:
Name Employer Organization: Institute of Space Technology
Name of the Controlling Officer: VC Engr Imran Rehman
Subject Exam Held in Grade GPA 1 Total Productivity
Management
Fa 08 A 4
2 Manufacturing
Technologies
Fa 08 A 4
3 Seminar in Competitiveness
and Technology
Sp 09 A 4
4 Independent Study
(Research)
Sp 09 S 4
5 Industrial Psychology Su 09 A 4 6 Research Methodology Su 09 V 4 7 Professional Ethics Su 09 S 4 8 Finance for Technical
Managers
Fa 09 A 4
9 Quantitative and Qualitative
Methods
Fa 09 A 4
10 Business Communication Sp 10 A 4 11 Research Methodology for
Engineering Managers
Sp 10 A 4
12 Seminar in Technology,
Governance and
Globalization
Sp 10 A 4
13 Technology, International
Trade and Economic
Development
Su 10 A 4
14 Productivity Engineering
and Management
Su 10 A 4
16 Research Proposal
Development Techniques
Su 10 A 4
17 Dissertation Research
(PhD)
Su 10 S 4
208
PUBLICATIONS
Sheikh Zahoor Sarwar and Dr Danial, S. P. (2013). Identifying Productivity Lapses
of Pakistan Automotive SMEs. J. Basic. Appl. Sci. Res., Vol 3, No 12, pp 8-17.
(HEC Recognized Journal). X Category Journal.
Sheikh Zahoor Sarwar, E. Mirza, N. Ehsan, K. Khan and Huma Hanif. (2012).
Determining Impact of Age and LOS on Job Satisfaction: A Case Study of Pakistan
Automotive Industry. International Journal of Human Resource Management, Vol
24, No 2, pp 415-435. DOI:10.1080/09585192.2012.674960 (HEC Recognized
Journal). X Category Journal.
Asad Ilyas, H. Nasir, F. Hussain, M. R. Malik, Zahoor Sarwar. (2013). Evaluating
Business Schools Service Quality using SERVQUAL Model. J. Basic. Appl. Sci.
Res., Vol 3, No 5, pp 710-716. (HEC Recognized Journal). X Category Journal.
Sheikh Zahoor Sarwar et al. (2013). To Study the Rise in Satisfaction Level of
People due to E-Governance Initiative by Government of Punjab-A Case Study of
Excise and Taxation Department. IOSR Journal Of Humanities And Social
Science, Vol 9, No 5, pp 64-70. DOI: 10.9790/0837-0956470 (HEC Recognized
Journal).
Sheikh Zahoor Sarwar et al. (2012). Productivity Analysis of Honda Atlas and
Indus Motors: Automotive manufacturing companies of Pakistan. International
Journal of Productivity and Performance Management, Vol 61, No 2, pp 173-193.
(HEC Recognized Journal).
Hassan Ali, A. A. Khan, D. S. Pirzada, W. Arif and Zahoor Sarwar. (2012).
Technology spillover impacts on total productivity of the manufacturing sector in

209
Pakistan. African Journal of Business Management, Vol. 6, No 9, pp. 3490-3503.
DOI: 10.5897/AJBM11.2352 ISSN 1993-8233. (HEC Recognized Journal).
Abeer Khan, Dr. N. Ehsan, E. Mirza, Sheikh Zahoor Sarwar. (2012). Integration
between Customer Relationship Management (CRM) and Data Warehousing.
Procedia Technology Vol 1, pp 239 – 249.
H. J. Chughtai, N. Ehsan, E. Mirza, Sheikh Zahoor Sarwar (2012). Database
model for traffic routing and planning parameters in commercial Microwave
networks. Procedia Technology, Vol 1, pp 230 – 238.
Sheikh Zahoor Sarwar et al. (May 2010). Barriers of Productivity in Public Sector
Automotive Industry of Paksitan. World Academy of Science, Engineering and
Technology, Issue 41 (pp. 1191-1195). Tokyo, Japan.
Sheikh Zahoor Sarwar et al. (2011). Is there is relationship between JS and OCB:
A case study of Pakistan Telecom sector. Proceedings of World Academy of
Science, Engineering and Technology (August 2011), pp.887-895.
Arshad, K., Rafique, T., Ishaque, A., Sarwar, Z. and Nisar, A. (2011)
“Developing a Suitable Framework for Appropriate Project Management
Application for IT Industry of Pakistan" Proceedings of 14th Toulon Verona
conference on Excellence in Service, ICQSS 2011, 1-3 September 2011, Alicante,
Spain. I.S.B.N : 978 88904327-1-2 (pp. 111-115)
Sheikh Zahoor Sarwar et al. (2010). Noninvasive Imaging System for Visually
Impaired People. Proceedings of 2010 3rd International Conference on Computer
Science and Information Technology, July 9-11, (pp1-6), Chengdu, China. DOI
10.1109/ICCSIT.2010.5564650.
210
A.Ahmed, S. Ahmed, N.Ehsan, E. Mirza and Sheikh Zahoor Sarwar. (2010). Agile
Software Development: Impact on Productivity and Quality. 5th IEEE Conference
on Management of Innovation and Technology, June 2-5, (pp 287-291), Singapore.
N. Ehsan, S. S. Kakakhel, S. Ashraf, Sheikh Zahoor Sarwar. (2010). Impacts of
Gender Discrimination on the Motivation of Female Employees. Proceedings of
4th International Technology, Education and Development, Conference, INTED,
8-10th March, (pp 1506-1512), Spain. ISBN: 978-84-613-5538-9.
M. W. Bhatti, N. Ehsan, A. Ishaque, F. Hayat, S. A. Phatak, Zahoor Sarwar.
(2010). An Investigation of changing requirements with respect to development
phases of a software project. IEEE International Conference on Computer
Information Systems and Industrial Management Applications October 8-10,
Cracow Poland. DOI:10.1109/CISIM.2010.5643639.
N. Ehsan, G. M. Mir, Zahoor Sarwar, A. Ishaque, E. Mirza, “Manufacturing
Modern Structures: A Drift in Materials and Manufacturing Technologies”,
International Conference on Asia Pacific Business Innovation and Technology
Management, January 24-26, 2010.
ISBN: 978-971-94544-0-3.
N. Ehsan, S.Ahmed, H. Raza, E.Mirza, Zahoor Sarwar, A.Ishaque and A. Akhtar,
“Total Quality through Forecasting and Optimization of Human Resource in Public
Organization”, International Conference on Asia Pacific Business Innovation and
Technology Management, January 24-26, 2010. ISBN: 978-971-94544-0-3.

211
UNDERTAKING
I certify that research work titled “Development of a Productivity Enhancement Model for Private
Sector Automotive Manufacturing Industry of Pakistan” is my own work. The work has not been
presented elsewhere for assessment. Where material has been used from other sources it has been
properly acknowledged/referred.
Sheikh Zahoor Sarwar Registration Number: 10-UET/PhD-CASE-EM-46

212
SUPERVISOR’S COMMENTS
Supervisor Dr Danial Saeed Pirzada Visiting Faculty CASE