department of environmental qualitydeq.state.wy.us/eqc/docket/10-2801 pacificorp/exhibit b. appeal...
TRANSCRIPT

Department of Environmental Quality
To proted, conserve and enhance the quality of Wyoming's environment for the benefit of current and future generations.
John Corra, DIrector
Mr. Robert Arambel Managing Director PacifiCorp P.O. Box 158 Point of Rocks, WY 82942
Dear Mr. Arambel:
December 31, 2009
Permit No. MD-6040 (BART Penn it for the Jim Bridger Plant)
The Division of Air Quality of the Wyoming Department of Environmental Quality has completed final review ofPacifiCorp's application for a Best Available Retrofit Technology (BART) permit for four existing 530-megawatt (MW) coal-fired boilers at the Jim Bridger Power Plant. The Jim Bridger Plant is located in Section 3, T20N, RIO 1 W; approximately four miles north of Point of Rocks in Sweetwater County, Wyoming.
Following the Division's proposed approval of the permit as published June 3, 2009. a 63-day public notice period ran from June 3, 2009 to August 4, 2009, and a public hearing was held on August 4, 2009, at 6 p.m. in Room 1309 at Western Wyoming Community College, located at 2500 College Drive in Rock Springs, Wyoming. Comments were received on the proposed permit and those comments have been considered by the Division in the final permit. Therefore, on the basis of the information provided to the Division, a BART permit is bereby granted pursuant to Chapter 6, Sections 2 and 9 of the Wyoming Air Quality Standards and Regulations (W AQSR) with the tollowing conditions:
I. Authorized representatives of the Division of A ir Quality be given permission to enter and inspect any property, premise or place on or at which an air pollution source is located or is being constructed or installed, for the purpose of investigating actual or potential sources of air pollution, and for detenuining compliance or non-compliance with any rules, standards, penuits or orders.
2. All substantive commitments and descriptions set forth in the application for this permit, unless superseded by a specific condition of this permit, are incorporated herein by this reference and are enforceable as conditions of this permit.
3. That PacifiCorp shan modify their Operating Permit in accordance with Chapter 6, Section 9( e)( vi) and Chapter 6, Section 3 of the W AQSR.
4. All notifications, reports and correspondence associated with this permit shall be submitted to the Stationary Source Compiiance Program Manager, Air Quaiity Division, 122 West 25th Street, Cheyenne, WY 82002 and a copy shall be submitted to the District Engineer, Air Quality#J_~~~!I!!!III_'" Division, 510 Meadowview Drive, Lander, WY 82520. EXHIBIT
I_B_ Herschler Building • 122 West 25th Street • Cheyenne, WY 82002 • http://deq.state.wy.us
*-,. ADMIN/OUTREACH ABANDONED MINES (307) 777·7937 (307) m·6145 FAX 777·3610 FAX 777-<5462
AIR QUAUTY (307) m·7391 FAX m5616
INDUSTRIAL SITING (307) 777·7369 FAX 777·5973
LAND QUAUTY (307) 777·7756 FAX 777·5864
SOUD & HAL WASTE (3D?) 777·7752 FAX 7l7·5973
WATER QUAUTY (307) 777 7181 FAX 777·5973
. . . . , -;;

PaciliCorp Jim Bridger Power Plant Air Quality Permit MD-6040 Pagel
5. Effective upon completion of the performance tests to verify the emission levels below, as required by Condition 6 of this permit, emissions from Jim Bridger Units 1 through 4 shall not exceed the levels below. The NO:" limits shall apply during all operating periods. PMlPMto Iblhr and tpy limits shall apply during all operating periods. PMlPMto IblMMBtu limits shall apply during all operating periods except startup. Startup begins with the introduction of fuel into the boiler and ends no later than the point in time when two (2) pulveri7.ers (coal mills) have been placed into service and the flue gas temperature at the inlet ducts to the electrostatic precipitator reaches a temperature of220 OF, as defmed as the average flue gas oudet temperature from the air preheaters.
Units Pollutant IblMMBt4 IblJ:lr tpy 2,3, &4 NOx 0.26 (3O-day rolling) 1,560 (30-day rolling) 6,833 1,2,3, &4 PMlPMlO(a) 0.030 180 788
t'} .' Filterable portion only
6. That no later than 90 days after pennit issuance:, NO" pe:rformance: tests shall be: cOl1dul,;t~d UII
Units 2-4 and PMlPMto performance tests shall be conducted on Units 1-4 and a written report of the results be submitted. If a maximum design rate is not achieved within 90 days of permit issuance, the Administrator may require testing be done at the rate achieved and again when a maximum rate is achieved.
7. Effective upon completion of the initial performance tests to verify the emission levels below, as required by Condition 8 of this permit, emissions from Jim Bridger Unit I shall not exceed the levels below. The limits shall apply during all operating periods.
Pollutant IblJ\-fMStu I IbIhr tpy ,
NO" 0.26 (30-day rolling) 1,560 (3O-day rolling) 6,833
8. That initial NOx performance tests shall be conducted on Unit 1 after the installation of low NOx burners and separated overfrre air in accordance with Chapter 6, Section 20) of the W AQSR. within 30 days of achieving a maximum design rate but not later than 90 days following initial start-up, and a written report of the results be submitted. If a maximum design rate is not achieved within 90 days of start-up, the Administrator may require testing be done at the rate achieved and again when a maximum rate is achieved.

PacifiCorp Jim Bridger Power Plant Air Quality Permit MD-6040 PageJ
9. Performance tests shall consist of the following:
Coal-fired boilers (Units 1 through 4):
NO!, Emissions - Compliance with the NO" 30-day rolling average shall be detennined using a continuous emissions monitoring system (CEMS) certified in accordance with 40 CFR part 60.
PMlPMlQ Emissions - Testing shall follow 40 CFR 60.46 and EPA Reference Test Methods 1-4 and 5.
Testing required by the Chapter 6, Section 3 Operating Permit may be submitted to satisfy the testing required by this condition.
10. Prior to any testing required by this pennit, a test protocol shall be submitted to the Division for approvaL at least 30 days prior to testing. Notification should be provided to the Division at least 15 days prior to any testing. Results of the tests shall be submitted to this ollie!; within 45 days of completing the tests.
11. PacifiCorp shall comply with all requirements of the Regional S02 Milestone and Backstop Trading Program in accordance with Chapter 14, Sections 2 and 3, of the WAQSR.
12. Compliance with the NOx limits set forth in this permit for the coal-fired boilers (Jim Bridger Units 1-4) shall be detennined with data from the continuous monitoring systems required by 40 eFR Part 75 as follows:
a. Exceedances of the NO" limits shall be defined as follows:
I. Any 30-day rolling average of NO x emissions which exceeds the IblMMBtu limits calculated in accordance with the compliance provisions and monitoring requirements of §60.48Da and §60.49Da. The definition of "boiler operating day" shall be consistent with the definition as specified in 40 CFR part 60, subpart Oa.
ii. Any 30-day rolling average calculated using valid data (output concentration and average hourly volumetric flowrate) from the existing CEM equipment which exceeds the lblhr NO% limit established in this pennit. Valid data shall meet the requirements of W AQSR, Chapter 5, Section 20) and follow the compliance provisions and monitoring requirements of §60.48Da and §60.490a. The 30-day average emission rate shall be calculated as the arithmetic average of hourly emissions with valid data during the previous 30-day period. The defmition of "boiler operating day" shall be consistent with the defmition as specified in 40 eFR part 60, subpart Da.

PacifiCorp Jim Bridger Power Plant Air Quality Permit MD-6040 Page 4
b. PacifiCorp shall comply with all reporting and record keeping requirements as specified in W AQSR, Chapter 5, Section 2(g) and 40 CFR part 60, subpart D. All excess emissions shall be reported using the procedures and reporting format specified in W AQSR, Chapter 5, Section 2(g).
13. PacifiCorp shall use EPA's Clean Air Markets reporting program to convert the monitoring system data to annual emissions. PacifiCorp shall provide substituted data according to the missing data procedures of 40 CFR, Part 75 during any period of time that there is not monitoring data. All monitoring data must meet the requirements of W AQSR, Chapter 5, Section 2(j).
14. Compliance with the PMlPM10 limits set forth in this permit for the coal-frred boilers (Jim Bridger Units 1-4) shall be determined with data from testing for PM conducted annually, or more frequently as specified by the Administrator, following 40 CFR 60.46 and EPA Reference Test Methods 1-4 and 5. Testing required by the Chapter 6, Section 3 Operating Permit may be submitted to satisfy the testing required by this condition.
15. Records required by this permit shall be maintained for a period orat least five (5) years and shall be made available to the Division upon request.
16. PacitiCorp shall install new low NOx burners with separated overtire air on Unit I, in accordance with the Division's BART determination, and conduct the initial performance tests required in Condition 8 no later than December 31,2010.
17. PacifiCorp shall submit a permit application for the installation of selective catalytic reduction (SCR) on Jim Bridger Units 3 and 4 to the Division under the Long-Term Strategy of the Wyoming §308 Regional Haze State Implementation Plan. This application shall address SCR as a system of continuous emissions reduction achieving 0.07 IblMMBtu on a 30-day rolling average as measured by a certified CEM. SCR shall be installed and operational on Jim Bridger Unit 3 by December 31,2015 and on Jim Bridger Unit 4 by December 31,2016.
18. PacifiCorp shall submit a permit application for the installation of additional add-on NO" control on Jim Bridger Units 1 and 2 to the Division no later than January 1,2015, under the Long-Term Strategy of the Wyoming §308 Regional Haze State Implementation Plan. It shall include an analysis of the four statutory factors and the associated visibility impacts from the application of each proposed NOx control and resulting emission levels. The application shall address each addon NO" control as a system of continuous emissions reduction achieving the lowest viable NO" emission, not to exceed a maximum of 0.07 Ib/MMBtu on a 30-day rolling average as measured by a certified CEM. Additional add-on NQ. control shall be installed and operational on both Jim Bridger Unit 1 and Unit 2 no later than December 31,2023.

PacitiCorp Jim Bridger Power Plant Air Quality Permit MD-6040 PageS
It must be noted that this approval does not relieve you of your obligation to comply with all applicable county, state, and federal standards, regulations or ordinances. Special attention must be given to Chapter 6, Section 3 of the Wyoming Air Quality Standards and Regulations, which details the requirements for compliance with condition 3. Attention must be given to Chapter 14, Sections 2 and 3 ofthe Wyoming Air Quality Standards and Regulations, which detail the requirements for compliance with condition II. Any appeal of this pennit as a final action of the Department must be made to the Environmental Quality Council within sixty (60) days of permit issuance per Section 16, Chapter I, General Rules of Practice and Procedure, Department of Environmental Quality.
Ifwe may be of further assistance to you, please feel free to contact this office.
Sincerely,
tJ(~ David A. Finley Administrator Air Quality Division
cc: Tony HoytlAQD Lander
~~ 4fc~:COI Dept. of Environmental Quality

------------------------------------
IN THE MATTER OF A PERLmT APPLICATION (AP-6040) FROM PACIFICORP FOR A BEST AVAILABLE RETROFIT TECHNOLOGY (BART) PERMIT FOR THE JIM BRIDGER POWER PLANT
DECISION
I. Introduction:
The Air Quality Division received a BART permit application from PacifiCorp for the four coalfired boilers that operate at their Jim Bridger Power Plant in Sweetwater County, Wyoming. Regulations governing the BART program have been established by the U.S. EPA in 40 CFR Part 5) - Appendix Y. As stated in the regulations, a source is eligible for BART if it belongs within a particular group of stationary source categories, was not in operation prior to August 7, 1962, was in existence on August 7, 1977, and has the potential to emit 250 tons per year (tpy) or more of any visibility impairing air pollutant. Fossil fuel boilers with more than 250 million Btu (MMBtu) per hour heat input are listed as an eligible source type. Each of the four boilers at the Jim Bridger plant has a heat input of 6,000 MMBtu per hour, and the boilers were in existence on August 7, 1977. Potential emissions from each boiler for two visibility impairing air pollutants, nitrogen oxides (NOx) and sulfur dioxide (S~), exceed 250 tpy and therefore the units are eligible for BART.
The Division conducted an analysis of the BART penn it application for the Jim Bridger plant and on June 3, 2009, published in the Rock Springs Daily Rocket-Miner a public notice and notice of public hearing of the proposed intent to issue BART determinations. Copies of the BART application and the Division's analysis were placed in the Sweetwater County Clerk's office in Green River, Wyoming, in accordance with regulations. A 63-day public notice period ran from June 3, 2009 to August 4,2009, and a public hearing was held on August 4,2009, at 6 p.m. in Room 1309 at Western Wyoming Community College, located at 2500 College Drive in Rock Springs, Wyoming.
The Division received numerous comment letters on the proposed permit during the public comment period: I) a letter dated July 21, 2009 from the USDA Forest Service; 2) a letter dated August 3, 2009 from EPA Region 8; 3) a letter dated August 4,2009 from PacifiCorp; 4) a letter dated August 4, 2009 from the National Park Service; 5) a letter dated August 4, 2009 from the Powder River Basin Resource Council, et al.; 6) a letter received July 20, 2009 from Joanna Taylor; 7) a letter dated July 16, 2009 from Andrew H. Salter; 8) a letter received July 20, 2009 from Evelyn and Marvin Griffin; 9) a letter received July 23,2009 from Mimi McMillen; 10) a letter received July 24, 2009 from William M. Anderson; 11) a letter received July 24, 2009 from Rebekah Smith; 12) a letter dated July 24. 2009 from Mike Shonsey; 13) a letter dated July 24, 2009 from Susie Mohrmann; 14) a letter dated July 28, 2009 from Janice H. Harris; 15) a letter dated July 28, 2009 from M. Christensen; 16) a letter dated July 27, 2009 from Clint Morrison; 17) a letter dated August 3, 2009 from Ann Fuller; 18) a letter dated August 3, 2009 from Mary Fenton; 19) 725 unsigned letters received under a signed cover letter dated July 28, 2009 from Brad Mohrmann, Sierra Club Associate Regional Representative; and 20) 89 signatures received under a signed cover letter dated July 24, 2009 from Brad Mohrmann, Sierra Club Associate Regional Representative. The Division also received a letter aner the dose of the public notice period from the Colorado Department of Public Health and Environment (letter dated September 14, 2009) in support of the Division's BART determinations for the Dave Johnson and Jim Bridger power plants.
Due to the number of public comments with similar concerns, the Division grouped individual comments and developed summary comments and responses. Comments from the EPA, Forest

---------------->-->---
PacifiCorp Jim Bridger Power Plant Decision Document, BART Permit Application, AP-6040 Page 2 of27
Service, National Park Service, Powder River Basin Resource Council, et al., and PacifiCorp are addressed individually. The comments and responses are presented on the following pages. The Division also received positive comments supporting this project. The Division appreciates these comments but they are not included in this document as no response is required.
The Division received numerous comments that were descriptive of environmental impacts other than the impacts from BART-cligihle sources in Wyoming on Class I area visibility. The Division's responses are limited to the comments that dealt with the State's BART analyses.
The Division is also preparing a revised Wyoming State Implementation Plan (SIP) for Regional Haze, and has solicited comments on that SIP. Some comments have been received which were submitted as comments on the Regional Haze SIP, hut were principally directed at the Division's BART analyses. These comments will be addressed by the Division as it prepares the response to comments on the Regional Haze SIP.
II. Analpis of Comments from the USDA Forest Service:
III BART Conclusions for NOI Controls: SCR for Jim Bridger - The Forest Service commented that based on their review of the five statutory BART factors, Selective Catalytic Reduction (SCR) should be BART for NO. control for all units at the Jim Bridger power plant. The Forest Service applauds the proposal to install SCR at the four units at the Jim Bridger plant for a longterm strategy, but SCRs at Jim Bridger should be installed as BART on all units by 2015-2016.
Response - The Division determined BART for NO" control at the Jim Bridger power plant based on consideration of all five statutory BART factors, as required by EPA's Appendix Y BART guidance. No single factor was weighted as being more important than another, because the Division looked at all five statutory factors in their entirety. The BART determination for NO" control on all four units included low NO" burners (LNB) with overfire air (OF A). The Division's BART analysis provides the basis for the BART determination of LNB with OF A as well as why SCR was not determined to be BART.
Regarding the installation of additional control equipment at the Jim Bridger plant, PacifiCorp is required by the BART permit to install SCR on Jim Bridger Unit 3 in 20t5 and Jim Bridger Unit 4 in 2016 as well as add-on NOx control on Units t and 2 no later than 2023. The schedule for installation is based on the incorporation of SCR add-on control on these units under the longterm strategy component of Wyoming's SIP for regional haze as well as PacifiCorp's construction plan for pollution control projects. The schedule for the installation of SCR controls at other plants is uncertain at this point due to the demands on PacifiCorp for compliance with BART and other regulatory programs. PacifiCorp operates 19 coal-fired units, 14 of which are BART -eligible. Additional BART -eligible units are owned or partly owned in Arizona. Colorado, and Montana. Table I presents a summary of the pollution control projects that are included in PacifiCorp's constnlction plan through 2014,

PacifiCorp Jim Bridger Power Plant Decision Document, BART Pennit Application, AP-6040 Page 3 of27
o \
Ct, - t ~i.~+ • • , • + • , ,~_ ,0' c _ •
Table 1; StatUsorpon~tkinCoDtrol prolec'iti~d;..t;k~n byIiacioc~rp ~
Power Plant Hunter 3 Huntington 2 Cholla 4 Jim Bridger 4 lim Bridger 2 Dave Johnston 3
Huntington 1 Jim Bridger 1
Naughton 2
Hunter 2 Jim Bridger 3
Wyodak Dave Johnston 4
Naughton I
Hunter 1 Naughton 3
Location Utah Utah Arizona Wyoming Wyoming Wyoming
Utah Wyoming
Wyoming
Utah Wyoming
Wyoming Wyoming
Wyoming
Utah Wyoming
SOz Scrubbers New=N Upgrade=- U
Installed 2007-N 2oo8-U 2008-U 2009-U 201O-N
2010-U 2010-U
2011-N
201l-U 2011-U
2011-U 2012-N
2012-N
2014-U 2013-U
LNB Installations
2008 2007 2008 2008 2005 2010
2010 2010
2011
2011 2007
20ll 2009
2012
2014 2013
Bagbouse Installations
Installed 2007 2008 n/a n/a
2010
2010 n/a
n/a
2011 nla
2011 2012
nla
2014 2013
SOzlLNB Project Status
Completed Completed Completed Completed Completed Under Construction Pennitted Under Construction Under Construction Permitted Under Construction Permitted Under Construction Under Construction Permitted Permitted
11.2 BART Conclusions Cor SO: Controls: WFGD Cor Jim Bridger - The Forest Service commented that, based on their review of the five statutory factors for BART, wet flue gas desulfurization (WFGD) should be BART for S~ control for all Wlits at the Jim Bridger and Naughton power plants.
Response - WFGD upgrades have already been (or are scheduled to be) installed on all units at the Jim Bridger plant. For the Naughton plant, WFGD is scheduled to be installed on Units 1 and 2 and WFGD is scheduled to be upgraded for Unit 3. BART limits for S~ will not be set because Wyoming is a §309 state participating in the Regional S~ Milestone and Backstop Trading Program. §308(eX2) provides states within the Transport Region addressed by the Grand Canyon Visibility Transport Commission with the option to implement or require participation in an emissions trading program or other alternative measure rather than to require sources subject to BART to install, operate, and maintain additional control technology to meet an established emission limit on a continuous basis.
11.3 NOL Step 5: Visibility Improvement Determination (Class I areas modeled) - The Forest Service commented that all Class I areas within 300 Ian of a given source should be modeled and the cost of each BART alternative divided by the sum of the deciview (dv) improvement at all impacted Class I areas~ If modeling exists for Class ( areas that yield impacts above 0.5 dv just beyond 300 km, those results should be considered also. Savage Run Wilderness Area should also be modeled and considered.
PacifiCorp Jim Bridger Power Plant Decision Document, BART Permit Application, AP-6040 Page 4 of2?
Response - Only those Class I areas most likely to be impacted by sources subject to BART at a given facility were modeled, as determined by source/Class I area locations, distances to each Class I area, and professional judgment considering meteorological and terrain factors. The Division recognizes that more distant Class I areas may yield modeled impacts of some magnitude, but the Division is also satisfied that Class I areas at a greater distance and in directions of less frequent plume transport would not yield modeled impacts greater than those yielded by the Class I areas chosen for BART modeling. The modeling results for the Class I areas chosen for analysis allowed the Division to make an informed decision on the effect on visibility from the various BART control options. Additionally, EPA's Appendix Y BART guidance does not include any requirements for modeling distance.
EPA's Appendix Y BART guidance does mention that "dollars per deciview" ($/dv) is a metric that could be used to evaluate the cost of BART compliance, but by no means identifies $/dv as an essential or required metric. The Division considered capital cost, annual cost, cost effectiveness, and incremental cost effectiveness in the cost evaluation of each proposed BART control option. The Division chose not to use a hybrid metric such as $/dv primarily because of the lack of historical precedent regarding reasonable/acceptable levels for such a metric. Additionally, the use of a hybrid cost metric such as $ldeciview can introduce uncertainty as to how the value was calculated. The value of "/deciview" could be based on the highest modeled value in a given area or the 98th percentile modeled value. It could be based on the 98th percentile value for anyone modeled year or it could be an average for multiple years. It could even be based on an average modeled value across an entire Class I area or the sum of deciview changes across multiple areas. The Division has found that $/dv values are often presented without explanation of the basis for the calculation. To avoid these confounding factors, the Division chose to evaluate and present the cost analyses and visibility analyses separately.
EPA's Regional Haze Rule affects sources that may cause or contribute to visibility impairment at any mandatory, federal Class I Area. Because Savage Run is a state-<iesignated Class I area, the Division was not required to include it in the BART modeling. Additionally, the Division did not include Savage Run in any of its analyses for the State's Regional Haze Visibility SIP. for BART, the Division did model the impacts at several mandatory Class I areas that are located in the same general plume transport direction downwind of Savage Run, including Mt. Zirkel Wilderness, Rawah Wilderness, and Rocky Mountain National Park. Based on the modeling results for these Class I Areas in the proximity of Savage Run, the Division anticipates similar improvements in visibility from the analyzed emission reductions.
11.4 NOLSteo 5: Visibility Improvement Determination (significant impact) - The forest Service commented that it is incorrect to dismiss a control strategy on the basis that the modeled visibility improvement is not perceptible or significant.
Response - The Division used 0.5 dv as the threshold level to exempt a source from BART or to deem modeled impacts as insignificant EPA' s Regional Haze Regulmian~ and Guidelines for Best Available Retrofit Technology (BARl) Determinations (Appendix Y to 40 CfR part 51), suggest that 0.5 dv can represent the level at which a source "contributes" to visibility impairment. This is also consistent with the rules which are being applied by most states in the Western Regional Air Partnership (WRAP) region.

PacifiCorp Jim Bridger Power Plant Decision Document, BART Pennit Application, AP-6040 Page 5 of27
II.S Five Factor Analysis for BART Selection: Coal Composition - The Forest Service commented that PacifiCorp's analysis of coal composition is flawed and it does not meet the requirement for a demonstration of why presumptive limits cannot be reached.
Response - Although the BART emission limit for NO" exceeds the presumptive BART limit for tangential-fired boilers burning sub-bituminous coal, PaciftCorp's analysis of coal composition was not a factor in the Division's detennination. The Division established NO" emission limits for BART at the jim Bridger plant based on consideration of all five statutory factors, as required by EPA's Appendix Y BART guidance. The Division interpreted the presumptive emission levels for NOx and S02 as recommended control levels proposed by EPA after reviewing technical data related to BART. Requiring sources to meet presumptive emission levels was not required as one of the five statutory factors. Conversely, the Division did not automatically detennine emission levels below presumptive levels to be BART, but considered all five statutory factors before making a BART detennination.
11.6 N<k.. Controls: SCR - The Forest Service commented that significant, cumulative visibility improvements modeled for SCR installations at the jim Bridger and Naughton plants indicate that SCR should be BART for all units at those two plants. The Forest Service questions why DEQ chose SCR as BART only for Naughton Unit 3 when SCR costs for other Naughton units and all Jim Bridger units are similar. Also, environmental degradation from the operation of SCR should not be a factor in the BART determinations and energy impacts from SCR should not be a factor because they have already been considered in the cost analysis.
Response - The costs for SCR controls, as described in the Division's BART analyses, were deemed by the Division to be reasonable for all units at the Jim Bridger and Naughton plants, but the Division's BART detenninations for the two plants were based on consideration of all five statutory BART factors, as required by EPA's Appendix Y BART guidance. PacifiCorp proposed a BART limit for NOx emissions from Naughton Unit 3 of 0.37 IbIMMBtu, which would be achieved by tuning the existing LNB/OF A system. For Naughton Units 1 and 2, PacifiCorp proposed a BART limit for NO" of 0.26 IblMMBtu for each unit using new LNB/OF A. Visibility modeling showed that the NO" emission level proposed by PacifiCorp for NaUghton Unit 3 provided less in terms of modeled visibility reductions from baseline as compared to other units at the two plants. For example, Naughton Units I and 2 showed a 72% to 73% reduction in the number of days with predicted impacts of 0.5 dv or more at the nearest Class I area (Bridger Wilderness) for LNB/OFA as compared to baseline. The reduction for NaUghton Unit 3 for LNB/OFA vs. baseline was only 31%. Appendix A includes graphs of the modeled results at the Class I area that yielded the highest modeled impacts for the Jim Bridger and Naughton plants (Bridger Wilderness) and the Class I area that yielded the highest modeled impacts for the Wyodak, Dave Johnston, and Laramie River Station plants (Wind Cave National Park). As shown in the graphs, the LNB/OF A option reduces the 981h percentile result to less than 1.0 dv for every unit with the exception of Naughton Unit 3 (1.4 dv). The predicted number of days above 0.5 dv for the Um/OF A option was 40 for NaUghton Unit 3, and 16 or less for each of the other twelve units. The Division detennined that SCR would be required on Naughton Unit 3 to bring about additional NOx emissions reductions and modeled visibility improvement, and these factors differentiated the NaUghton Unit 3 BART analysis from the others.
[t was the full consideration of all five statutory BART factors, principally the pronounced visibility improvement for LNB/OFA as compared to baseline and the lack of non~air quality

PacifiCorp Jim Bridger Power Plant Decision Document, BART pennit Application, AP-6040 Page 6 of27
environmental impacts that led the Division to conclude that LNB/OF A would be BART for NO" control at the Jim Bridger plant and for Units I and 2 at the Naughton Plant. Modeled visibility impacts for Naughton Unit 3 were reduced to levels comparable to those yielded by LNB/OF A controls on Naughton Units 1 and 2 only through the addition of SCR as BART on Naughton Unit 3. Potential energy losses and environmental impacts from the operation of SCR were mentioned in the Division's BART analysis for both the NaUghton and Jim Bridger plants, but were only part of the larger evaluations that considered all five statutory factors.
II.7 NOLControls: SeR Efficiencies - The Forest Service commented that greater SCR control efficiencies should be factored into the cost and visibility analyses.
Response - The Division conducted a search of the EPA RACTIBACTILAER Clearinghouse (RBLC) to fmd NOx emission limits as BACT associated with SCR control in recently issued permits. Table 2 presents a summary of the Division's RBLC search. Two plants have limits of 0.05 IbfMMBtu NOx with a 12-month rolling average, which is significantly longer than a 3O-day averaamg period. Because the 0.05 IblMMBtu limits are based on a 12-month averaging period, they are not comparable to the 3O-day limits established by the Division. The two plants wi.th 30-day averaging periods will be subjected to either a 0.08 IblMMBtu or 0.07 IblMMBtu limit, and the limits established by the Division meet these lower limits. A spreadsheet compiled by the National Park Service with a summary of nationwide BART determinations shows that both units outside of Wyoming for which SCR is proposed as BART will be subject to a NOx emission limit ofO.07IbfMMBtu, and both will be based on a 30-day averaging period.
The RBLCsearch showed two plants that will be subject to 24-hour NOx limits of less than 0.07 IblMMBtu (0.067 IbIMMBtu), but these limits are for newly constructed plants which have been engineered to meet these levels. BART will require the retrofit of significant controls at plants that were not designed to meet these lower levels. Based on the Division's evaluation, the Division is satisfied that the NOx emission limit of 0.07 IbJMMBtu (30-day rolling average) that was evaluated for SCR control under BART is the most stringent control level likely to be achieved in a retrofit.

------------------------ - --------
PacifiCorp Jim Bridger Power Plant Decision Document, BART Permit Application, AP-{i040 Page 7 of27
--- , - -- - , . , : Tablel: SCR PermIt LimitS' froDl the RoLe',; "-
Size of NO. Pennit Limit(s) for FacilitylLocation Source Source Description SCReontrol John W. Turk Power 600MW 6,000 MMBtuIbr PC Boiler I) 0.067 IbIMMBtu Plant! Arkansas (PRB Coal) (24-hr rolling)
2) 0.05 IblMMBtu (l2-month rolling)
[SCR, BACT] Dry Fork 385MW PC Boiler 0.05 IbIMMBtu StationIWyoming (I2-month rolling)
[SCR,BACn WYGEN3IWyoming 100MW 1,300 MMBtuIbr PC Boiler 0.05 IbIMMBtu
(12-month rolling) [SCR, BACT]
Iatan - PC Boiler 0.08 IblMMBtu StationIMissouri (30-day rolling)
(SCR, BACTj Big Cajun II Power 675MW PC Boiler O.071blMMBtu PlantlLouisiana (annual average)
[SCR,BAcn TSPower 200MW PC Boiler 0.0671blMMBtu PlantlNevada (24-hour rolling)
[SCR,BACT] OPPD - Nebraska -- - 0.07 IblMMBtu City (30-day rolling) StationINebraska [SCR BACTl
Note: "-" mdlcates that thIS value was not provIded m the RBLe
«
Permit Date
Nov 2008
Oct 2007
Feb 2007
Jan 2006
Aug 2005
May 2005
Mar 2005
II.8 S(b Controls (Section 309) - The Forest Service understands the role of Section 309 in exempting the State of Wyoming from making BART determinations for S(h controls based on the demonstration that the benefits from S~ emissions reductions under Section 309 exceed those that would have resulted from BART. Are the existing S~ controls in place at the Jim Bridger and Naughton plants at least equivalent to the control scenario used in the demonstration, Le., are the existing controls needed to accomplish the "Better than BART" demonstration for Section 3091 They also note that the 309 program sunsets in 2018 and added S02 controls may be needed for reasonable progress at that time.
Response - The State of Wyoming submitted a 309 SIP as is allowed by the Regional Haze Rule. Part of the SIP submittal is a "Better than BART" demonstration, required by rule, which does not require that each and every unit demonstrate emission controls that are "Better than BART". The demonstration is a regional demonstration. The Division is aware than the 309 program only establishes milestones through 2018, and that following 2018 another strategy may be necessary to reduce visibility-impairing pollutants. Additional strategies will be addressed in future SIP revisions.
11.9 Visibility Impairment - The Forest Service commented that because EPA BART guidelines state that 0.5 dv "contributes" to visibility impainnent, and 1.0 dv "causes" visibility impainnent, the discussion from Ronald Henry regarding perceptibility in the BART applications from PacifiCorp is irrelevant and used in an improper context

PacifiCorp Jim Bridger Power Plant Decision Document,. BART Permit Application, AP-6040 Page 8 of 27
Response - The Division did not attempt to endorse a particular threshold for human eye "perceptibility" since the level of perceptibility has long been disputed. Instead, the Division has relied on EPA's Appendix Y BART guidance, which suggests a value ofO.S dv as the level that a source "contributes" to visibility impainnent One of the metrics used by the Division to evaluate the relative benefit of a given BART control option was the number of days yielding a modeled impact of 0.5 dv or more.
HI. Analysis of Comment! from EPA Region 8:
mJ Background Ozone Congntration in CALPUFF - EPA Region 8 commented that the Division's visibility modeling used 44 ppb as a background ozone concentration as the default value for periods when measured data was missing. This value appears to be too low based on the average annual concentrations at sites near the facilities (Thunder Basin = 50-55 ppb, Jonah = 55-58 ppb). DEQ should provide an analysis of how higher ozone background concentrations would affect results.
Respoase - The default ozone background concentration is used by CALPUFF as a domain-wide substitute for any hour for which a11 measured ozone concentrations are missing. For the Division's visibility modeling for BART, hourly ozone concentrations measured at seven monitoring stations spaced across the modeling domain were input to CALPUFF. A visual inspection of the ozone files that were input to CALPUFF reveals that at least one valid ozone observation was available for every hour of the modeled period (2001-2003), making it unnecessary for the model to use the default background of 44 ppb.
Although the model did not use the default background value for the BART analyses, the Division calculated annual average concentrations for recent years (2007-2008) and aU available data for 2009 for many of the stations that were used for input to CALPUFF, including Thunder Basin, Jonah, Rocky Mountain National Park, Centennial, and Pinedale. Annual average values forthese stations ranged from 35 ppb to 49 ppb, with an overall average of approximately 40 ppb. The Division is confident that the default background value of 44 ppb was appropriate for the BART modeling, and that there is no need for additional analyses to explore alternate background concentrations.
III.2 Weight of Visibility Modeling Results in BART DeterminatiollS - EPA Region 8 commented that DEQ should provide an explanation of how modeled visibility improvements were weighed in making BART determinations.
Response - The Division's BART determinations were based on consideration of aU five statUtory factors, as required by EPA's Appendix Y BART guidance. The modeled visibility improvements for a given control strategy were one of the five factors that were considered. No single factor was weighted as being more important than another, because the Division looked at aU fIVe statutory factors in their entirety. EPA guidance did not provide a quantification of the amount of modeled visibility improvement that would be acceptable or significant. The Division used two metries that were mentioned in the EPA BART guidance, the 98ib percentile result for a given year and the level at which a source "contributes" to visibility degradation (0.5 MY). to present the results of the BART visibility modeling. Also see the response to USDA Forest Service comment II.6.

PacifiCorp Jim Bridger Power Plant Decision Document, BART Permit Application, AP-6040 Page 9 of27
III.3 Cumulative Modeled Impacts - EPA Region 8 commented that cumulative, modeled Class I impacts from all units at a facility (or combined impacts from multiple facilities) should be presented in addition to the results for individual units.
Response - The visibility impacts from BART -eligible sources are to be modeled separately. As stated in the EPA's Appendix. Y guidance, relative to the use of the CALPUFF model for BART determinations, "We believe that CALPUFF is an appropriate applicationfor States to usefor the particular purposes of this rule, to determine if an individual source is reasonably anticipated to cause or contribute to impairment of visibility in Class I areas, and to predict the degree of visibility improvement which could reasonably be anticipated to result from the use of retrofit technology !!!!!l! individual source. We encourage States to use it for these purposes." [emphasis added]
lIlA Language from BART Determinations - EPA Region 8 commented that the Division should claritY the statements of "3-year average visibility improvements". Are dv improvements calculated for each Class I area added together? If so, what is the meaning of the number? Are three Class I areas sufficient to quantify cumulative impacts? Were all Class I areas within 300 km considered?
Response - To arrive at the "3-year average visibility improvements" that were reported in the Division's BART analyses, the modeled 98th percentile dv change or the number of days above 0.5 dv predicted for a given year of meteorology was averaged with the similar result from the other two years of meteorology. These 3-year average values were determined for each modeled Class I area separately, and were devised to allow a straightforward, direct comparison of one control option to another. Regarding the sufficiency of three modeled Class I areas and the question of other Class I areas within 300 km, see response to USDA Forest Service comment II.3.
D1.S NOLControls - EPA Region 8 commented that the most stringent emission control levels for NO" controls have not been evaluated, resulting in inflated calculated cost effectiveness values. Lower emission limits should be evaluated for selective non-catalytic reduction (SNCR) and SCR.
Response - The Division has analyzed the most stringent levels for SNCR and SCR, and does not agree that the cost effectiveness numbers have been inflated. See response to USDA Forest Service comment II.7. Furthermore, the Division has deemed the costs associated with all analyzed BART NO" control options, including SNCR and SCR, to be reasonable (see the conclusions listed under the section: NOx: EVALUATE L\1PACTS AND DOCUMENT RESULTS in each of the five BART Application Analyses).
III. 6 12-Month Average for NOe EPA Region 8 commented that there is no formula to calculate if the 12 .. mont~ rolling emission 11."Uit has exceeded the penuit condition.. A pennit condition to match condition 12.a.iii from the Laramie River Station analysis should be created.
Response - The BART limits for NOx emissions from the PacifiCorp plants include 30-day rolling limits in terms of IblMMBtu and Iblhr. The ton per year limit is based on a calendar year rather than a rolling average, and therefore the formula associated with the annual BART limit for NO, at the Laramie River Station is not relevant.

PacifiCorp Jim Bridger Power Plant Decision Document, BART Pennit Application, AP-6040 Page 10 of27
IIl.7 PM Controls: Averaging Periods - EPA Region 8 commented that the BART conclusions and the permit conditions should include associated averaging periods for all PMlPMIO limits.
Response - The averaging periods for the PMlPM IO limits are dictated by the performance test requirements in the BART permits. Compliance with the IblMMBtu and lblhr PMlPM IO limits is based on the average of three I-hour tests per 40 CPR 60.46.
UI.8 PM Controls: Control Effectiveness - EPA Region 8 commented that the Division should explain why 0.015 IblMMBtu for baghouse/fabric filter control effectiveness is acceptable, when 0.012 Ib/MMBtu has been approved by the Division for other permits and 0.010 IblMMBtu was approved for the Desert Rock project. The BART determinations should include analyses of electrostatic precipitators (ESPs) and baghouses at lower control levels.
Response - Recent Prevention of Significant Deterioration (PSD) permits issued by the Division did include PMlPM IO limits of 0.012 IblMMBtu for fabric ftlter controls, but those limits (and PMlPM IO limits established for the Desert Rock Project in New Mexico) were determined through Best Available Control Technology (BACT) analyses for new sources. The BART process deals with retrofit controls on existing units, and therefore is not directly comparable to BACT determinations. Additionally. visibility modeling described in the Division's BART analysis for the Jim Bridger plant showed that the addition of a fabric filter to replace an Electrostatic Precipitator (ESP) provided very little in the way of visibility improvement. with predicted cumulative improvements across three Class I areas of only 0.03 to 0.1 ddv for Units 1-4. These results indicate that requiring more stringent control levels for a fabric filter would not provide significant visibility improvement. As described on page 17 of the Division' s BART analysis. ESP performance enhancements using FGC were considered. and will be utilized for BART control for Units 1-4 at the Jim Bridger plant.
111.9 PM Controls: Permit Exemptioq - EPA Region 8 commented that Condition 5 in the proposed EGU BART penn its contains an inappropriate exemption for startup. The exemption from the IblMMBtu PM limit during startup should be removed or it may be appropriate to analyze the need for a startup BART limit.
Response - For each EGU subject to BART in Wyoming, only the BART limits for PMlPM10
that are expressed in IblMMBtu will not apply during startup. The BART limits for PMIPMw that are expressed in Iblhr and tpy (as based on the IbJMMBtu limits) will apply during all operating periods including startup.
The Division considers the BART limits expressed in terms of Iblhr and tpy to be appropriate limits for startup. For the four units at the Jim Bridger plant, PacifiCorp calculated that the particulate emissions from the startup fuel (fuel oil) would be no greater than 10.9 lblhr per unit., conservatively assuming that the ESP controls had zero control efficiency during the startup piOcess. As a compa.-isun, the BART limit that would apply for each unit during startup is 180 ibtnr. further, PacifiCorp has agreed to minimize startup emissions from the four units at the plant by placing the ESPs in service prior to the introduction of coal to the boilers. which is contrary to the manufacturer's recommendation to energize the ESP only after the unit is at full operating temperature and combustion of fuel oil has ceased.
Similarly for Unit I at Wyodak, particulates are controlled by an ESP and startup is accomplished with fuel oil. The maximum emissions estimated for startup (8.9 Iblhr) would be well below the

PacifiCorp Jim Bridger Power Plant Decision Document, BART Pennit Application, AP-6040 Page 11 of27
BART limit of 71 Iblhr. The three units at LRS are also started on fuel oil and controlled with ESPs, and the particulate emissions during startup are expected to be well below the BART limits, which are set at 193 Iblhr to 198 Iblhr for the three units.
For units with baghouse controls for particulate matter such as Dave Johnston Units 3 and 4, emissions from fuel oil during the startup process are also estimated to be well below the allowable lblhr BART limits.
In the case of the Naughton plant, particulate controls will include a mixture of ESPs (Units 1 and 2) and a fabric filter/baghouse (Unit 3). Natural gas is the startup fuel for each of these units, and particulate emissions during startup are expected to be well below the established Iblhr BART limits.
m.l0 PM Controls: FGC - EPA Region 8 commented that flue gas conditioning (FGC) must be applied only after FGD is installed or upgraded to avoid increases in the emissions of sulfuric acid (H2S04) mist. A control option should not be considered as a BART option if it will result in an increase in visibility-reducing pollutants.
Response - The Division has already evaluated the impacts of FOC at the Jim Bridger plant as part of the review of Pac ifiCorp's permit application for permit MD-1552, which was issued on April 9, 2007. Permit MD-1552 authorized new LNB with separated OFA for Units 1,3 and 4 and FGC to enhance the performance of the ESPs on Units 1-4. The permit application included a modeling evaluation of the impacts to Class I area visibility from the FGC, and the impacts were predicted to be insignificant.
III. I I S<b Controls: Reasonable Progress - EPA Region 8 commented that the Division must evaluate the visibility impacts of S02 controls and demonstrate reasonable progress for the Class I areas away from the Colorado Plateau.
Response - Wyoming, along with other 309 states in the WRAP region, evaluated the impact of the 309 program on all Class I areas in the west, even though the requirement by rule was to demonstrate improvement in Class I areas on the Colorado Plateau. The WRAP modeling for sulfates shows that all Class I areas in and around Wyoming sources are benefiting from the sulfur dioxide emission reductions instituted in the 309 program. Sulfate extinction levels show improvement on the 20% worst days and improvement or at least no degradation on the 20% best days. Furthermore, the Regional Haze rule allows a state to take full credit for strategies implemented under 309 when addressing Class I Areas away from the Colorado Plateau (51.309(g)( 4)(i).
III. 12 CALPUFF Visibility Modeling: Otber Class I Areas - EPA Region 8 commented that visibility impacts at Flattops Wilderness Area in Colorado should have been modeled for the Jim Bridger and NaUghton plants.
Response - See response to USDA Forest Service comment 11.3.
III. 13 Presumptive Levels for NO, - EPA Region 8 commented that not enough information has been presented to explain why the proposed BART NO~ limits for the Jim Bridger plant exceed the presumptive BART limits. Jim Bridger should be able to achieve lower limits closer to the

PacifiCorp Jim Bridger Power Plant Decision Document, BART Penn it Application, AP-6040 Page 12 of27
presumptive levels given that two units (2 & 3) are already achieving 0.22 IbfM.\1Btu with LNB/OFA.
Response - A letter from PacifiCorp to the Division dated September 16, 2009 provided information relative to this comment:
"Actual operatioru of the low-NO. burners at the Jim Bridger plant provide additional justification for the 0.26 IblmmBtu limit on a 30-day rolling average. 11rree of the Jim Bridger units have already been modified with the best available low NO" burners and over-fire air technology. On an annual basis, the units have been able to achieve emission rates rangingfrom 0.21 to 0.24 IbllwMBtu. However, actual operating experience has demonstrated that during periods when mill maintenance is performed, or during limes of high coal variability, the units may have difficulty meeting a 30-day rolling average of 0.26 IM"'fMBtu. "
The Division concurs with PacifiCorp's assessmcnt that a limit of 0.26 IblMMBtu on a 30-day rolling average is appropriate as a BART limit for NO" emissions from each unit at the Jim Bridger plant.
1II.14 SCR as BART - EPA Region 8 commented that if 0.07 IblMMBtu NO" is achievable by Jim Bridger Units I & 2 with SCR, it needs to be set as a BART limit rather than postponed under reasonable progress.
Response - See response to Forest Service comment [1.1.
III. IS New Combustion Controls - EPA Region 8 commented that SNCR and SCR cost are higher for Unit 2 than for other units, apparently because new LNB/OFA is not assumed. The State should provide an analysis on why new combustion controls could not be applied.
Response - As described on page 4 of the Division's BART analysis for the Jim Bridger plant, permit MD-1l38 was issued to PacifiCorp on April 1,2005 to authorize the installation of new LNB with separated OF A on Unit 2 at the plant. Because the emissions reductions from baseline with SNCR and SCR that were calculated for Unit 2 already include the operation ofLNB/OFA. the magnitude of the NOx reductions from Unit 2 are lower and the cost per ton of reduction values for Unit 2 are higher than for the other units at the plant.
II1.16 Collateral Impacts - EPA Region 8 commented that PacifiCorp and the Division state that the installation of SNCR or SCR at the lim Bridger plant could impact the "saleability" of fly ash and that SCR could create a "blue plume" if the ammonia injection rate is not well controlled. The fact that injection rates may not be well controlled should not be a reason to eliminate a technology such as SNCR in a modem power plant.
Response - The Division's BART determinations for the Jim Bridger plant were based on consideration of the five statutory factors, including the cost of compliance and the energy and non-air quality environmental impacts of compliance. Potential energy losses and environmental impacts from the operation of SNCR and SCR were mentioned in the Division's BART analysis. but were only part of the larger evaluation that considered all five statutory factors in their entirety.

PacifiCorp Jim Bridger Power Plant Decision Document, BART Pennit Application, AP-6040 Page 13 of27
III. 17 Unit 2 Emissions - EPA Region 8 commented that the Division should explain why calculated NOx emissions reductions from baseline at the Jim Bridger plant are different for Unit 2 vs. Units 1,3, and 4.
Response- See response to EPA Region 8 comment IIU5.
IlI.IS Analysis of SNCR - EPA Region 8 commented that SNCR was not carried forward to Step 5 of the BART analysis. DEQ should complete an analysis of the modeled visibility improvements associated with SNCR.
Response - Pac ifiCorp, at the direction of the Division, modeled the range of anticipated visibility improvements from the company-proposed BART controls (LNB with separated OF A) and the addition of SCR to those controls. While new LNB with OF A + SNCR and existing LNB with ROFA were not individually evaluated in Step 5, the anticipated degree of visibility improvement from applying either of those control options lies within the modeled range of visibility impacts. Since the costs associated with controls were alJ deemed reasonable, the visibility assessment was conducted for the least and most stringent controls.
IV. Analysis of Comments from PacifiCoro:
IV.I General Comments: Cost Metrics - PacifiCorp commented that EPA's Appendix Y BART guidance states that a proper BART evaluation should include "other cost-effectiveness measures (such as $Ideciview)". Thus, any BART determination that is limited to use only cost effectiveness and incremental cost effectiveness may be unacceptably narrow.
Response - EPA's Appendix Y BART guidance does mention that "dollars per deciview" ($ldv) is a metric that could be used to evaluate the cost of BART compliance, but by no means identifies $/dv as an essential or required metric. The Division considered capital cost, annual cost, cost effectiveness, and incremental cost effectiveness in the cost evaluation of each proposed BART control option. The Division chose not to use a hybrid metric such as $/dv primarily because of the lack of historical precedent regarding reasonable/acceptable levels for such a metric. Additionally, the use of a hybrid cost metric such as $ldeciview can introduce uncertainty as to how the value was calculated. The value of "/deciview" could be based on the highest modeled value in a given area or the 9Sth percentile modeled value. It could be based on the 98th percentile value for anyone modeled year or it could be an average for multiple years. It could even be based on an average modeled value across an entire Class I area or the sum of deciview changes across multiple areas. The Division has found that $/dv values are often presented without explanation of the basis for the calculation. To avoid these confounding factors, the Division chose to evaluate and present the cost analyses and visibility analyses separately.
N.2 General Comments: Cost Effectiveness - PacifiCorp commented that any BART determination requiring a source to instaii post-combustion controls like SCR or spend more than $1,500 per ton of NOx removed would be contrary to EPA Appendix Y BART guidance.
Response - The EPA's Appendix Y guidance describes the EPA's selection of presumptive NOx
limits for coal-fired EGUs, and provides approximate cost levels for meeting the presumptive limits with current combustion controls and a somewhat higher cost level for a subset of units that would require advanced combustion controls such as rotating opposed flCe air (ROFA). The EPA
------------------~--~~-------~- - -- -------------
PacifiCorp Jim Bridger Power Plant Decision Document, BART Permit Application, AP-6040 Page 14 of27
guidance does not attempt to establish cost thresholds that would be considered unreasonable for a given control technology, nor does it present the approximate costs associated with the presumptive levels as absolute limits above which cost should be deemed unreasonable. The guidance also states that states may in specific cases find that the use of SCR is appropriate. As stated previously, the Division established NQl( emission limits for BART at the Jim Bridger power plant based on consideration of all five statutory factors in their entirety, as required by the Appendix Y guidance.
IV.3 General Comments: Power Plants More Than 750 MW - PacifiCorp commented that Appendix Y indicates that states must follow Appendix Y guidelines in making BART determinations on a source-by-source basis for 750 MW plants. Wyoming rules impose similar requirements for power plants greater than 750 MW.
Response - The Division followed EPA and State of Wyoming rules for the BART analyses. Specifically, the Division followed WAQSR Chapter 6, §9(c)(ii), which states that power plants with generating capacities greater than seven hundred fifty megawatts shaU comply with EPA Appendix Y, and that Appendix Y should be used as guidance for preparing BART analyses for all other facilities.
IVA General Comments: Post-Combustion Controls - PacifiCorp commented that EPA never contemplated the use of post-combustion controls to meet BART limits for tangentially-fired boilers, and that it is nearly impossible under Appendix Y guidance to show that anything other than combustion controls should be required as BART.
Response - See response to PacifiCorp comment IV.2.
IV.5 General Comm.ents: VISibility Im.provement - PacifiCorp commented that a BART determination that only relied on the 98th percentile, three~year average results from CALPUFF may be too narrow to satisty Appendix Y.
Response - The Division did not rely solely on the three~year average of the 98th percentile CALPUFF results to evaluate the expected visibility changes for the BART control options. The 98111 percentile values and the number of days with predicted results above 0.5 dv were presented in the Division's BART analyses for each of three modeled years, for each Class I area, and for each control option. The three-year average of the 98th percentile results and the number of days above 0.5 dv were chosen for graphical representation and were mentioned prominently in the Division's conclusions because they offered the clearest comparison of one control option to another (see graphs in Appendix A).
IV.6 General Comments: Modeling - PacifiCorp commented that visibility modeling contains inherent bias or exaggeration because it assumes that a particular source will operate at its maximum capacity 100% of the time and that each unit at a facility operates in the same way.
Response - The results trom BART visibility modeling, as required by EPA guidance, are based on daily (24-hour) averages. Reported results for a given control scenario, expressed in units of deciviews, represent the predicted change in visibility as compared to natural background over the course of 24-hour periods of meteorology. The modeled emission rates for a given unit at a power plant should reflect the highest rate that could be achieved over a 24~hour period, and therefore the assumption that a given unit is operating at its maximum operating capacity is

PacifiCorp Jim Bridger Power Plant Decision Document, BART Pennit Application, AP-6040 Page 15 of27
appropriate for each unit at a base-load power plant such as Jim Bridger. Additionally, the conclusions drawn from BART visibility modeling primarily involve comparisons between control scenarios for which the emissions are determined similarly.
rv.7 General Comments: NOI.Emi"ions - PacifiCorp commented that emissions of NO x during the 20% best and 20% worst days at Class I areas in Wyoming are not a significant contributor to regional haze as compared to other emissions, and therefore the Division should consider this before requiring extreme NO" control measures such as SCR as BART.
Response - For the 20% worst days during the years 2000-2004 at the Bridger Wilderness Area, 6.21% of the total visibility degradation was attributable to nitrates. Source apportionment modeling provided by the WRAP showed that 19% of the nitrates come from Wyoming sources. The Division recognizes that pollutants other than nitrates contribute more toward the total visibility degradation at the Bridger Wilderness Area, but the Division has concluded that the contribution from Wyoming sources toward the formation of nitrates at the Bridger Wilderness Area and other Class I areas warrants a full consideration of prospective NO" controls under the BART process.
rv.8 Perceptibility - PacifiCorp commented that credible studies indicate that only changes in visibility as high as 1.5-2.0 dv are perceptible to the human eye. The Division should consider this while drawing conclusions based on the results of the visibility modeling and before requiring extreme NQ. control measures such as SCR.
Response - See response to USDA Forest Service comment II.9.
IV.9 Long-Tenn Strategy - PacifiCorp commented that that the Division has proposed an aggressive schedule for installation of SCR on Jim Bridger Units 1-4 under Long-Term Strategy for the Regional Haze SIP. It is premature to use a BART application analysis to propose emissions reduction requirements under a Long-Term Strategy which has not yet been released.
Response - The BART pennit conditions that are associated with Long-Tenn Strategy have been included in the August 25, 2009 draft of Wyoming's Regional Haze SIP without modification. The particular Long-Term Strategy requirements, in this case add-on NOx controls for Units 1 through 4 at the Jim Bridger plant, are established as enforceable on the source by the Division through inc/usion in the BART penn it.
IV. I 0 Presumptive BART - PacifiCorp commented that the Division's reference in the BART analysis for the Jim Bridger plant to a presumptive BART limit for NOx of 0.15 IblMMBtu is not correct For reasons stated in PacifiCorp's most recent submittals to the Division, primarily an argument regarding coal characteristics, the correct presumptive BART limit for Jim Bridger Units 1-4 is 0.28 Ibl7vfMBtu.
R~ponse - See response to USDf.~ Forest Service comment ItS.

PacifiCorp Jim Bridger Power Plant Decision Document, BART Penn it Application, AP-6040 Page 16 of27
Y. Analysis of Comments from the National Park Service:
V.I NO. Step J: Evaluate Effectiveness of Remaining Control Technologies (SCR capabilities) -The NPS commented that the Division underestimated the ability of SCR to reduce emissions. The proposed NO" limit for SCR (0.07 IbIMMBtu) is not low enough. SCR can achieve greater reductions. NPS suggests 0.06 IbfMMBtu for 30-day limit, 0.05 IblMMBtu or lower for an annual limit.
Response - See response to USDA Forest Service comment 11.7.
V.2 NOx Step 4: Evaluate Impacts and Document ResUlts (SCR costs) - The NPS commented that SCR costs were generally overestimated because the OAQPS Control Cost Manual was not used for cost estimates.
Response - PacifiCorp developed cost estimates for SCR control using a combination of the OAQPS Control Cost Manual, vendor-obtained price quotes, and a database developed by the engineering fum Sargent & Lundy. The degree to which the SCR costs may have been overestimated does not require further review because the Division has concluded that the estimated costs are reasonable and that costs alone would not preclude the use of SCR
Y.3 NOLStep 4: Evaluate Impacts and Document Results (incremental costs Cor SCR) - The NPS commented that the Division over-emphasized the incremental costs for the addition of SCR in the BART determinations. The Division should consider the average costs calculated for combustion controls plus SCR.
Response - See response to PacifiCorp comment IV.I and NPS comment V.2.
VA NOLStep 4: Evaluate Impacts and Document Results (basis Cor costs) - The NPS commented that cost estimates should be documented by vendor or by the EPA Control Cost Manual.
Response - See response to NPS comment V.2.
V.5 NOLStep 5: Visibility Improvement Determination (Class I Areas Modeled) - The NPS commented that the Division should consider visibility impacts at all Class I areas within 300 kilometers (km) of a source.
Response - See response to USDA Forest Service comment IT.3.
V.6 NOLStep 5: Visibility Improvement Determination (incremental benefits orSCR) - The NPS commented that the Division placed too much emphasis on the incremental improvement in visibility that was predicted for the addition of SCR. The total predicted visibility improvement resulting from a combination of control options should have been presented.
Response - The incremental improvement in modeled visibility with the addition of SCR was mentioned prominently in the summary of the Division's BART conclusions, but all visibility modeling results were considered. For more information on the presentation of the visibility modeling results in the Division's BART analyses, see the response to EPA Region 8 comment III.2 and PacifiCorp's comment IV.5.

PacifiCorp Jim Bridger Power Plant Decision Document, BART Pennit Application, AP-6040 Page 17 of27
V.7 N0loStep 5: Visibility Improvement Determination (sulfuric acid mist emissions) - The NPS commented that the modeled sulfuric acid mist emissions increased for the SCR control scenario, and the Division should provide a detailed explanation of how the sulfuric acid mist emissions were calculated by PacifiCorp.
Response - PacifiCorp's consultant, CH2M HILL, used the following methodology to calculate sulfate emissions for SCR for the PacifiCorp coal-fired power plants (as provided in a letter from PacifiCorp that was submitted to the Division on September 16, 2009):
• 1.0% of the S~ in the boiler is converted to S03 • An additional 1.0% of the S~ is converted to S03 in an SCR unit • The S03 is converted to H2S04 mist in the flue gas • 50% of the H2S04 mist is removed in a wet FGD unit • 95% of the H2S04 mist is removed in a dry FGD unit • An SCR unit has 2.0 ppmvd NH3 slip • 50% of the NH3 slip is converted to ammonium sulfate and 50% is converted to
ammonium bisulfate • 50% of the ammonium sulfate and bisulfate are removed in a wet FGD unit and 90% of
the ammonium sulfate and bisulfate are removed in a dry FGD unit • Total sulfate emissions are made up of H2S04 mist, ammonium sulfate and ammonium
bisulfate
V.S BART Conclusions for NOlo Controls: $/dv - The NPS commented that the Division should use $/dv as an additional metric for evaluating BART controls.
Response - See response to PacifiCorp response IV .1.
V.9 BART Conclusions for NO. Controls: Cost Benchmarks - The NPS commented that the Division determined that the costs for SCR were reasonable, yet rejected SCR for BART control. DEQ should explain why and provide the cost benchmarks used to determine reasonable costs.
Respogse - The Division established NOx emission limits for BART based on consideration of all five statutory factors (as required by EPA's Appendix Y BART guidance) and not merely based on cost. The Division relied on past experience with BACT determinations for similar sources/control options to determine the range of control costs that were reasonable.
V.IO BART Conclusions Cor NOlo Controls: Non-Air Quality Impacts - The NPS commented that the Division mentioned non-air quality impacts as reasons to reject SCR for BART controls. Recent PSD permits issued by DEQ and requiring SCR did not mention such impacts. Why were such impacts mentioned in these particular cases? SCR has been used at many facilities with minimal problems with transport and storage of ammonia, why would this be a particular problem for SCR a', BART control?
Response - See response to EPA Region 8 comment III. 16.
V.II BART Conclusions for NO, Controls: Parasitic Power Loss - The NPS commented that the Division mentioned parasitic power loss in association with the operation of OF A and SCR. Parasitic power loss associated with SCR has already been accounted for in the cost analysis for
PacifiCorp Jim Bridger Power Plant Decision D<x:ument, BART Penn it Application, AP-6040 Page 18 of27
NO. and should not be "double-counted" by using it to draw conclusions for BART control unless it would cause a power shortage.
Response - See response to EPA Region 8 comment 1lI.16.
V.12 BART Conclusions for NO,- Controls: Fly Ash Sales - The NPS commented that the Division stated that the operation of SCR could impact the "salability" of fly ash. Evidence should be presented and the economic impact quantified.
Response - See response to EPA Region 8 comment m.16.
V.13 BART Conclusions (or NO]. Controls: Ammonia Injection - The NPS commented that the Division stated that SCR couJd create "blue plume" if the ammonia injection rate is not well controlled. NPS states that it assumes that PacifiCorp can properly control the injection rate.
Response - See response to EPA Region 8 comment III.16.
V.14 BART Conclusions for NO, Controls: SCR Installation - The NPS commented that PacifiCorp states that SCR would take a minimum of six years to plan and install. NPS states that Minnesota Power plans to install SCR, fabric filter, and a new chimney on the 330 MW Boswell Unit #3 in half of that time. PacifiCorp should explain why so much extra time is needed.
Response - A letter provided to the Division by PacifiCorp dated September 16, 2009 provided information on the time needed to plan, design, and install SCR:
• Develop and Pennit 18-24 months • Design: 9-12 months • Procurement: 9-13 months • Construct: 18-24 months • Start, Tune, and Test 4-6 months • Total (including overlap of individual tasks): 60-66 months
V.I5 BART Conclusions for PM~ Controls: Control Effectiveness - The NPS commented that the Division should explain why 0.015 IblMMBtu was acceptable to the Division as a control effectiveness for a ESP/polishing fabric filter combination, when 0.012 IblMMBtu has been approved by the Division for other recent pennits involving fabric filters and limits as low as 0.0 10 IblMMBtu have recently been approved for fabric filters (e.g., Desert Rock Project).
Response - See response to EPA Region 8 comment III.8.

PacifiCorp Jim Bridger Power Plant Decision Docwnent, BART Pennit Application, AP-6040 Page 19 of27
VI. Analysis of Comments from the Powder River Basin Resource Council. et al.:
VI.I Modeled Class I Areas - The Powder River Basin Resource Council, et al. commented that all Class I areas within 300 km of a given source should be modeled for visibility impacts.
Response - See response to USDA Forest Service comment 11.3.
VI.2 SCR as BART - The Powder River Basin Resource Council, et al. commented that SCR is BART and must be required for all units at all coal-fired power plants. DEQ's schedule for SCR installation requires SCR on all four Jim Bridger units by 2023. No specific facts for allowing such an extension beyond the standard five-year BART schedule is given, only an undefined concern for PacifiCorp's "logistical challenge". Because PacifiCorp's visibility modeling for the Jim Bridger plant shows a 2.5 dv improvement across "all 3 most heavily impacted Class I areas" and because costs for SCR were deemed reasonable, SCR should be considered BART. Presumptive BART for NO" at the Jim Bridger plant is 0.15 IblMMBtu, but DEQ determined a BART limit of 0.26 IblMMBtu. DEQ failed to provide adequate justification for such a departure. SCR should be installed on all four Jim Bridger units to meet a NOx limit of 0.07 IblMMBtu in the next five years.
Response - See responses to USDA Forest Service comments II.I, II.5 and 11.6, and EPA Region 8 comment III. 13.
VI.3 Section 309 Milestone Program - The Powder River Basin Resource COlmcil, et al. commented that DEQ should impose BART limits for S02 because participation in the Section 309 program only excuses DEQ from setting BART limits if the State's 309 SIP is approved by the EPA and if the 309 SIP demonstrates that emissions levels would result in greater visibility improvement than source-specific BART limits.
Response - The Regional Haze Rule allows the State of Wyoming to submit a 309 SIP in lieu of establishing BART limits for S02. The 309 SIP submittal includes a "Better than BART' demonstration. The entire submittal is currently undergoing EPA review and the State has no control over how long the EPA takes to review the SIP. The State, however, does not wait for EPA to complete its review before implementing a SIP. All of the 309 statcs have been participating in the 309 program, collecting S02 inventories, allowing independent audits of the information, comparing the regional totals to the milestones, and taking public comment on the regional figures and the comparisons with the milestone figures. The S02 levels have shown compliance with the milestones and continue to demonstrate declining 802 emissions levels. Also see responses to USDA Forest Service comment 11.8 and EPA comment III. I I.
VI.4 Reasonably Attributable Visibility Impairment - The Powder River Basin Resource Council, et aI. commented that because of the magnitude of modeled visibility impacts, DEQ should certii)t that Wyoming power plants are causing reasonabiy attributable visibility impairment, and establish more stringent BART controls. A single source that is responsible for a 1.0 deciview change or more should be considered to "cause" visibility impairment, according to W AQSR Chapter 6, §9(d)(iXA). Because of the reasonably attributable visibility impainnent, BART must be determined under WAQSR Chapter 9, §2(d)(ii) and 40 CFR §51.302(c)(4)(iii). These regulations provide that BART is presumed to be at least at NSPS levels. This would require at least 0.11 Ib/M~rntu for NO. limits, but SCR should be required at 0.07 IblMMBtu.

PacifiCorp Jim Bridger Power Plant Decision Document, BART Permit Application, AP-6040 Page 20 of27
Response - WAQSR Chapter 6, §9(dXi)(A) applies to the detennination of which sources in Wyoming are subject to BART under the regional haze program, and is not relevant to the detennination of reasonably attributable visibility impairment. Since adoption of Wyoming's Visibility SIP and visibility regulations to address reasonably attributable visibility impairment, neither the Federal Land Managers of any Class I area nor the Division has certified that visibility impainnent, attributable to a source or small group of sources, exists in any Wyoming Class I area pursuant to provisions in Cbapter 9, Section 2 of the W AQSR. The provisions of Chapter 9, Section 2 of the WAQSR are therefore not relevant to the Division's BART analyses.
VI.5 BART Conclusions for PM,~ Controls - The Powder River Basin Resource Council, et al. commented that tbe Division should require PacifiCorp to meet, at a minimum, a PM limit 0.015 IblMMBtu at the Jim Bridger plant using full baghouse or polishing baghouse because: I) the plant is causing reasonably attributable visibility impairment in at least four Class I areas, and 2) because BART is supposed to be the "best system of continuous emission reduction" and the Division's analysis identified fabric filters as the most stringent PM control.
Response - The Division established PM/PMIO emission limits for BART at the Jim Bridger plant based on consideration of all five statutory factors, as required by EPA's Appendix Y BART guidance. Various control technologies were evaluated for each source subject to BART, including the most advanced controls. but the BART guidance does not dictate that a state require the control technology with the highest level of control in all cases. Regarding the relevance of reasonably attributable visibility impairment, see response to Powder River Basin Resource Council, et a!. comment VIA.
VII. Analysis of Comments from the Sierra Club and Citizens Associated with tbe Sierra Club:
VII. I Air Quality Laws and Regulations - The Sierra Club commented that it is important that air quality laws and regulations are strictly complied with to preserve park resources for present and future generations.
Response - The Division followed federal regulations and guidance as well as state regulations in assessing the BART applications and for making the BART detennination for all sources eligible for BART in the State of Wyoming. The BART rules and guidance used by the Division included:
• Section 308 of the Regional Haze Rule [40 CFR 51.308(e») • Guidelinesfor BART Determinations Under the Regional Haze Rule [Appendix Y to part
511 • Chapter 6, Section 9 of the Wyoming Air Quality Standards and Regulations (WAQSR),
Best Available Retrofit Technology
VII.2 Regional Haze Rule - The Sierra Club commented that the State of Wyoming can and should do more to protect air quality as the Regional Haze Rule is implemented.
Response - The Division's BART detenninations for Wyoming sources, as well as additional air pollution controls that will be required to further reduce regional haze, will be addressed in the Wyoming State Implementation Plan (SIP) for regional haze. The SIP incorporates the emissions reductions associated with the Long-Tenn Strategy for regional haze.

PacifiCorp Jim Bridger Power Plant Decision Document, BART Permit Application, AP-6040 Page 21 of27
VTT.3 Control or Nitrogen Oxide Emissions - The Sierra Club commented that the State of Wyoming should require the coal plants to install devices that reduce nitrogen oxide emissions.
Response - All of the Division's BART detenninations for coal-fired power plants in the State of Wyoming include pollution control equipment that will substantially reduce nitrogen oxide emissions.
VllA 20-Year Trend - A commenter stated that the amount of air and water pollution has clearly escalated in the past 20 years, with little relief for citizens or for the health of forests and the environment.
Response - The Division's BART determinations and other requirements under the regional haze program will result in large, state-wide emission reductions for three visibility-impairing pollutants; nitrogen oxides (NOJ, particulate matter (PMlPM,o), and sulfur dioxide (S~). As an example, BART controls at the Jim Bridger plant will result in a total annual reduction in potential NOy emissions of approximately 13.500 tons per year.
VII.S Wind Power - A comrnenter stated that Wyoming can readily replace aging coal-ftred power plants with wind power to protect public health and to protect our national parks and wilderness areas.
Response - The BART program is designed to assess Best Available Retrofit Technology on existing sources of air pollution, including the existing power plants in the State. The Division's BART determinations will result in significant reductions in air pollutants from several power plants in Wyoming, but complete replacement of the power plants with an alternate source of energy is well beyond the scope of the BART program.
VII.6 Pollution Reduction from Power Plants - A commenter stated that Wyoming has an obligation to protect treasured public spaces by adhering to federal air quality laws. The State must reduce air pollutants from the old coal plants that are federally required to utilize the most advanced technical developments in ensuring that air pollution is minimized.
Response - The Division determined BART controls based on the five statutoI)' factors developed by the EPA. Various control technologies were evaluated for each source subject to BART, including the "most advanced technical developments", but the ultimate BART detenninations were made based on a full consideration of all five statutoI)' factors in their entirety.
VII.7 SCR Controls - Several commenters stated that BART for NOx control should be SCR for all plants.
Response - See responses to USDA Forest Service comments ILl and IT.6.
VIll. Analysis oCPoblic Comments:
VIII.l SCR Controls - Several commenters stated that BART for NO, control should be SCR for all plants.
Response - See responses to USDA Forest Service comments II. I and 1I.6.

PacifiCorp Jim Bridger Power Plant Decision Document, BART Permit Application, AP·6040 Page 22 of27
IX. Decision:
On the basis of comments received during the public comment period, an analysis of those comments, and representations made by PacifiCorp, the Department of Environmental Quality has detennined that the pennit application filed by PacifiCorp complies with all applicable Wyoming Air Quality Standards and Regulations and that a BART permit will be issued for the Jim Bridger Power Plant. All of the conditions proposed in the Division's analysis will be included in the penn it. No pennit conditions required revision as a result of the public comment period.
Dated this 31 st day of December, 2009.
Da~~ Administrator rector Wyoming Air Quality Division Wyoming Department of Environmental Quality

APPENDIX A
VISIBILITY MODELING RESULTS (Baseline vs. LNB and SCR)

>" ~ ~
Figure 1 Modeled BART Impacts in Bridger Wilderness Area
Naughton and Jim Bridger Power Plants: 98th Percentile (delta-dv) -~----,-----. -,-~------------~,~- ------------------
.'1 Baseline
• LNB/OFA Nau U1 = Naughton Unit 1 (160 MW) Nau U2 = Naughton Unit 2 (210 MW) Nau U3 " Naughton Unit 3 (330 MW)
J8 Ul = Jim Bridger Unit 1 (530 MW) J8 U2 = Jim Bridger Unit 2 (530 MW) J8 U3 = Jim Bridger Unit 3 (530 MW) J8 U4 = Jim Bridger Unit 4 (530 MW) • LNB/OFA + SCR
2.500
2.000 ~ !'t0~f<~r~---------~,-------,~--· -~---~---------~----.----------- ---
1.500
1.000
0.500 -.-
0.000
NauUl NauU2 NauU3 JB Ul JB U2 JB U3 JB U4
(Mod@lIng r@sults represent the thre@·yearaverage using 2001-2003 m@teorologyj

>-"0
~ Q/ e.
Figure 2 Modeled BART Impacts in Wind Cave National Park
Wyodak, Dave Johnston, and Laramie River Station Power Plants: 98'" Percentile (delta-dv)
Wvodak " 335 MW OJ U3 = Dave Johnst01 Unit 3 (230 MW) DJ U4 = Dave Johnsto1 Unit 4 (330 MW)
lRS Ul = laramie River Station Unit 1 (550 MW) lRS U2 = laramie River Station Unit 2 (550 MW) lRS U3 = laramie River Station Unit 3 (550 MW)
2.500 -,---- .. - --.--.
2.000 +1---
1500 +--~--
1.000 ~;,'%----. - --- .---.~-
0.500
---- ~-~---_u-·1
~,1 Baseline .lNB/OFA • lNB/OFA + SCR
0.000 .
Wyodak DJU3 OJ U4 LRS U 1 LRS U2 LRS U3 I (Modeling results represent the tlree-year average us!n! 2001-2003 meteorology) J
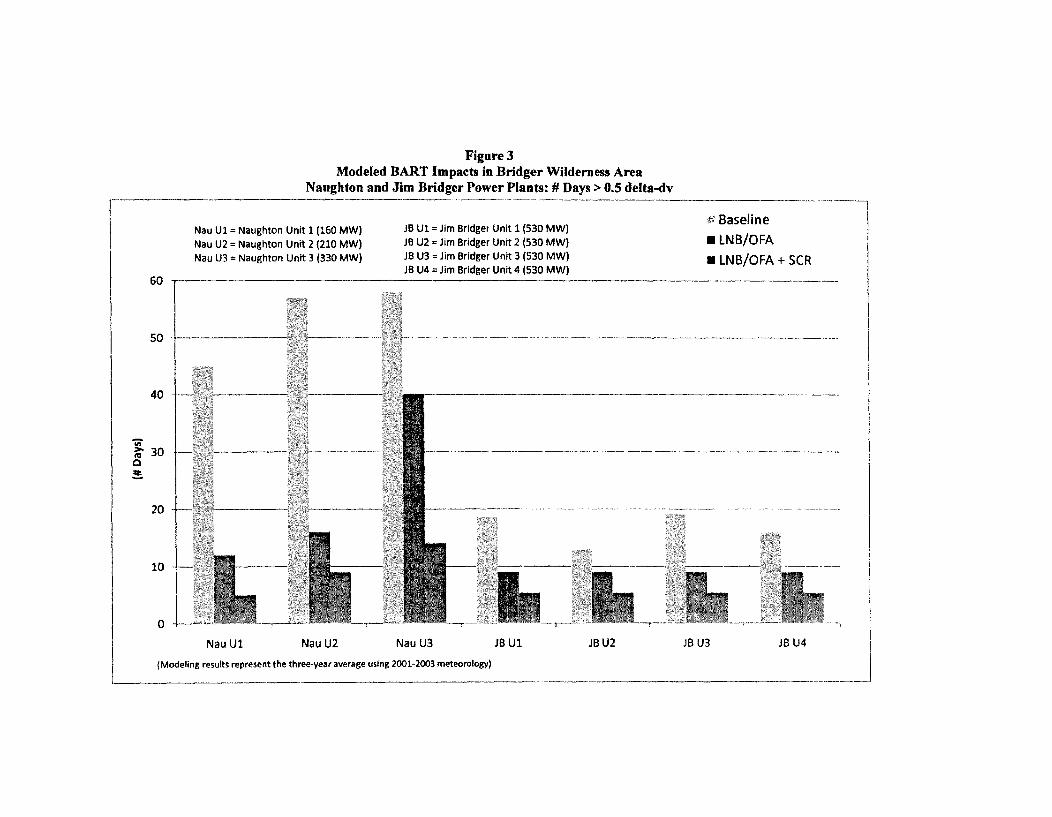
60
so
40
Figure 3 Modeled BART Impacts in Bridger Wilderness Area
Naughton and Jim Bridger Power Plants: # Days> 0.5 delta-dv
Nau U1 '" Naughton Unit 1 (160 MW) Nau U2 = Naughton Unit 2 (210 MW) Nau U3 " Naughton Unit 3 (330 MW)
JB Ul = Jim Bridger Unit 1 (530 MW) JB U2 "Jim Bridger Unit 2 (530 MW) JB U3 = Jim Bridger Unit 3 (530 MW) JB U4 " Jim Bridger Unit 4 (530 MW)
~ 30 n:I o ~
20 +--",!il'i;;l ;ii/'>l;
10
o Nau Ul NauU2 Nau U3 JB Ul JB U2
(Modeling results represent the three-year average using 2001-2003 meteorology)
~~1 Baseline
• LNB/OFA
• LNB/OFA + SCR
JB U3 JB U4
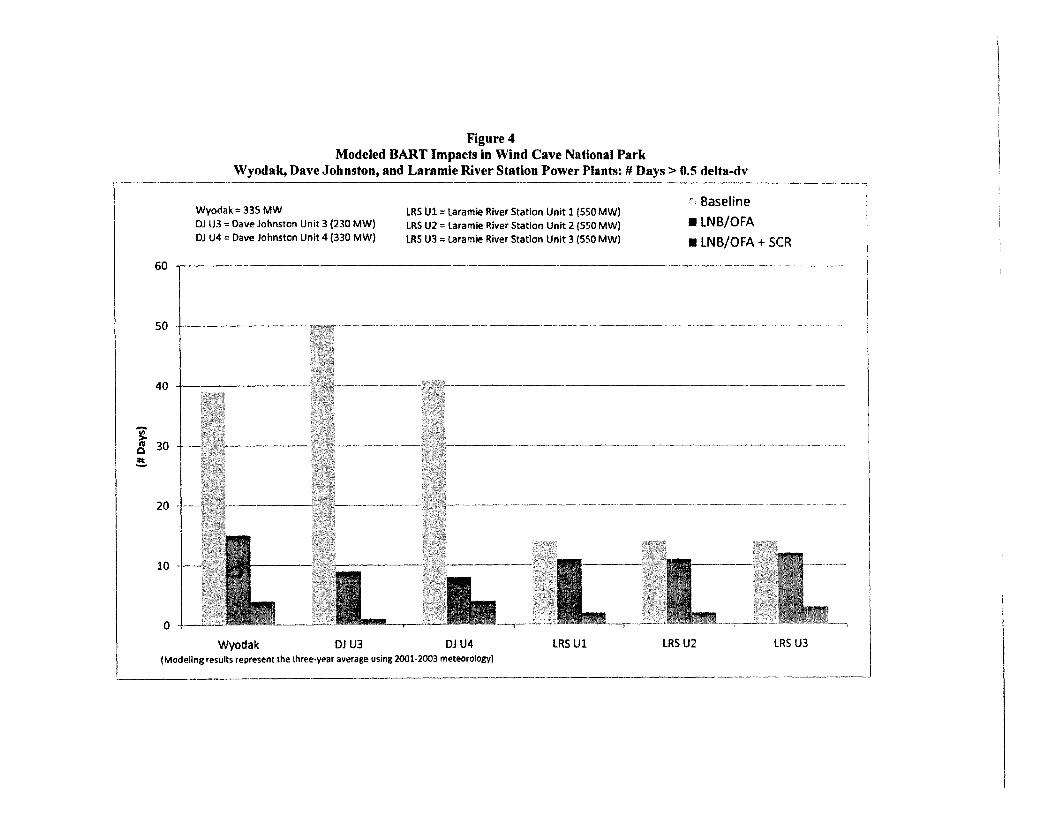
'i
60
Figure 4 Modeled BART Impacts in Wind Cave National Park
Wyodak, Dave Johnston, and Laramie River Station Power Plants: # Days> 0.5 delta-dv
Wyodak = 335 MW OJ U3 ': Dave Johnston Unit 3 (230 MW)
OJ U4" Dave Johnston Unit 4 (330 MW)
lRS Ul = laramie River Station Unit 1 (SSO MW) lRS U2 = laramie River Station Unit 2 (550 MW) lRS U3 = laramie River Station Unit 3 (550 MW)
. Baseline
.lNB/OFA
• lNB/OFA + SCR
-----------------
so -I '7f!_ ----------
40
8 30 ~
20 +---;y~,!3i J.,t----
10
o +1-=:'::';
Wyodak OJ U3 OJ U4 lRS Ul LRS U2 lRS U3 (Modeling results represent the three-year average using 2001-2003 meteorology)