department of technology services performance review
TRANSCRIPT

CountyStat
Department of Technology Services
Performance Review
Steve Emanuel, Director
5/7/2010

CountyStat2
CountyStat Principles
Require Data-Driven Performance
Promote Strategic Governance
Increase Government Transparency
Foster a Culture of Accountability

CountyStat3
Agenda
Performance Review: Headline Performance Measures
Discussion: Cloud Computing Solutions

CountyStat4
Meeting Goal
Determine the impact of DTS work on headline measures and
establish new performance expectations and goals
Evaluate potential for use of IT cloud solutions in Montgomery
County

CountyStat5
Utilizing Cloud IT Solutions to Meet County Business Needs
Cloud computing refers to hosted applications and platforms built on shared infrastructure delivered
via a web browser.
Types of Cloud-Shared Services
– SaaS (Software as a Service) – Delivers software applications as a service over the
Internet, eliminating the need to install and run the application on the customer's own
computers and simplifying maintenance and support.
– PaaS (Platform as a Service) – Facilitates deployment of platform specific applications
without the cost and complexity of buying and managing the underlying hardware and
software layers.
– IaaS (Infrastructure as a Service) – Rather than purchasing servers, software, data center
space or network equipment, clients instead buy those resources as a fully outsourced
service
Public Cloud vs. Private Cloud
– Public cloud - describes cloud computing in the traditional sense, where resources are
dynamically provisioned on defined, self-service basis over the Internet, from an off-site
third-party provider who shares internal and bills on a granular, utility-use basis
– Private cloud - are new structures that some vendors have recently used to describe
offerings that emulate cloud computing, but are contained within existing private networks.
Content provided by DTS

CountyStat6
Utilizing Cloud IT Solutions to Meet County Business Needs
Benefits
Opportunities for cost savings
Potential to add capabilities without new infrastructure and staffing
Flexibility: Enables the County to scale up or down to the level of needed service with relative ease
Mobility: Employees can access information in more locations
Innovation: Alleviates burden placed on DTS for maintenance, allowing them to spend more time on creative solutions
Increased storage abilities
Increased automation
Drawbacks
Issues of privacy and security need to be considered when making choices about migrating to cloud IT services
Change Management for users to adapt to new solutions/methodologies
Reliability may be a concern; County DTS will have less control over downtime outages on cloud systems
Network connection made not be fast enough to meet all County needs
Features can be limited (i.e. Google presentation software v. MS PowerPoint), which impact power users

CountyStat7
Utilizing Cloud IT Solutions to Meet County Business Needs
Plans and Existing Adoption by Montgomery County
Current
Production
Web 2.0 applications being used as Enterprise 2.0
YouTube, Facebook, Twitter
Traditional security team services to the cloud
Deployed cloud-based vertical applications
Department of Fire and Rescue ePCR
OHR - Performance Review and Recruitment
Police Citizen Reporting System (CRS) and Parking/Light Violation
MyMontgomery (Google Maps)
On Demand – Training Instances; Server Instances
Planned *Last 8 months: DTS is reviewing all new application requests for opportunities to
use cloud services. (IT Review has a “cloud option” in the evaluation.)
In Development
W/in 60 days: Small pilot for the RSC Directors to use the Google Apps, or similar application,
for desktop video conferencing in order to leverage their need with a small application testing
and evaluation. Funding may be an issue now with the total freeze on purchases.
W/in 60 days: Google Site Search, replacing on premise hardware
Being Researched and Evaluated
Large Enterprise Applications (Mail, Desktop Applications, Collaboration, Video)
Last 12 months: IT Security is reviewing integration and security issues that could be managed
through this policy.
In Progress - Email Encryption pilot (implementation subject to funding)
Content provided by DTS

CountyStat8
Utilizing Cloud IT Solutions to Meet County Business Needs
Decision Model for Selecting Cloud Solutions
Meets Business Requirements
– Fills a need with “Out of the Box” functionality and capability
– Should require minimal changes to the core solution
– Ability to sustain with long lead time for business-specific enhancements
– Service levels should meet business needs
Fulfills Return on Investment
– Low cost for the initial implementation
– Subscription should cost less than internal support
– Ability to validate cost savings
Sustains Internet Connectivity Requirement
– Business sustainment of robust internet connectivity
• No control on internet congestion or cloud disruptions
– Offline capabilities / Impacts of connectivity loss
Content provided by DTS

CountyStat9
Utilizing Cloud IT Solutions to Meet County Business Needs
Factors that impact will impact cost of migration to cloud services
Scope and timing of migration
– Depends on how extensive the migration is and whether the focus is on applications,
service delivery or platform storage
Reliance on public v. private cloud
– Private clouds typically cost more due to greater security needs and lower utilization rates
Need for privacy and security
– Greater safeguards (secure facilities and personnel with security clearances) raise the cost
of storage and service delivery
File server storage utilization rates
– Higher capacity utilization means more cost savings because the number of file servers
can be reduced after the migration
Potential labor savings
– Ability of the migration to enable personnel re-allocations, avoidance or reductions
translates into savings
Sources: Brookings Institution, IBM Center for The Business of Government

CountyStat10
Utilizing Cloud IT Solutions to Meet County Business Needs
Jurisdiction Uses Details Reported savings
City of Los Angeles, CA
2009 - Email service was migrated to Google
$7.5 million contract provided 5 years of email service for city employees at a cost of $50 per employee
30,000 employees
Analysis demonstrated that the 5-year cost of running the Google system would be $17.5 million, 23.6% less than the $22.9 million for operating their former system
Washington, D.C. 2008 - Email service and office applications were migrated to Google
New email contract with Google
Non-exclusive arrangement, some employees continued to rely on Outlook
Google Apps: $50/user/year
38,000 employees, 86 agencies
48% savings on email expenditures
Cost for Google Apps over previous software was reduced from $96 to$50 per user/year
Miami, Florida 2009 - 311 Management Selected Microsoft Windows Azure for service hosting and mapping
Cloud was essential to meeting Miami’s storage needs. (Original estimate = 4 terabytes, Actual needs = 27 terabytes)
Took advantage of “pay-as-you-go” option
Estimated 75% savings in 1st year between hardware, software, and staff efficiencies
National Aeronautics & Space Administration (NASA)
Infrastructure platform used for mission support, public education, and data communications and storage
Developed Nebula in-house due to internal bandwidth and security needs
$2 million project
Able to share extra capacity with other govt agencies (i.e. OMB), and reuse for other purposes when the project is complete
New type of project for NASA, so there isn’t a good comparison to estimate savings
Staff time and costs to develop Nebula are thought to be much less than time and cost to procure new infrastructure
Use of the Cloud in other jurisdictions and government agencies
Sources: Brookings Institution, IBM Center for The Business of Government
CountyStat11
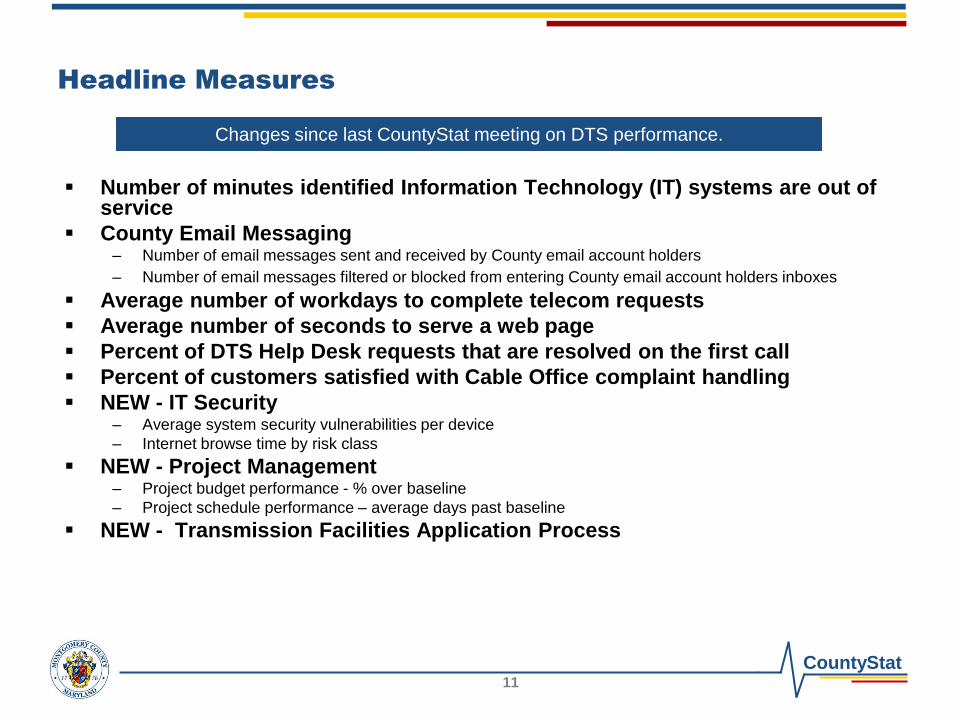
Headline Measures
Number of minutes identified Information Technology (IT) systems are out of service
County Email Messaging– Number of email messages sent and received by County email account holders
– Number of email messages filtered or blocked from entering County email account holders inboxes
Average number of workdays to complete telecom requests
Average number of seconds to serve a web page
Percent of DTS Help Desk requests that are resolved on the first call
Percent of customers satisfied with Cable Office complaint handling
NEW - IT Security– Average system security vulnerabilities per device
– Internet browse time by risk class
NEW - Project Management– Project budget performance - % over baseline
– Project schedule performance – average days past baseline
NEW - Transmission Facilities Application Process
Changes since last CountyStat meeting on DTS performance.

CountyStat12
Headline Measure
Number of minutes identified Information Technology (IT) systems
are out of service
0
500
1,000
1,500
2,000
2,500
3,000
3,500
4,000
4,500
FY08 FY09 FY10 FY11 FY12
Min
ute
s
Measure FY08 Actual FY09 Actual FY10 Estimate FY11 Target FY12 Target
Minutes 4,238 2,039 745 775 775
Measure FY08 Actual FY09 Estimate FY10 Target FY11 Target
As presented in FY10 budget 4,238 825 675 675

CountyStat13
Headline Measure
Number of minutes identified Information Technology (IT) systems
are out of service
SystemFY08
Actual
FY09
Actual
FY10
Estimate
FY11
Target
FY12
Target
Mainframe 1,080 0 0 0 0
CAD 54 457 120 0 0
Email (internal) 108 248 100 250 250
Email (external) 105 0 0 0 0
Internet access 263 283 0 0 0
Network (internal) 2,628 1,051 525 525 525
Critical enterprise systems -- -- -- TBD TBD
Total Minutes 4,238 2,039 745 775 775
Hours 71 34 12 13 13
Identified IT Systems

CountyStat14
Headline Measure: Telecommunications
Average number of workdays to complete telecom requests
0
3
6
9
12
15
FY09 FY10 FY11 FY12
Day
s
Measure FY08 Actual FY09 Actual FY10 Estimate FY11 Target FY12 Target
Average Days -- 6.97 8.30 8.50 9.00
Measure FY08 Actual FY09 Estimate FY10 Target FY11 Target
As presented in FY10 budget -- 6.8 7.2 7.0

CountyStat15
Headline Measure: Telecommunications
Average number of workdays to complete telecom requests
FY08
Actual
FY09
Actual
FY10
Estimate
FY11
Target
FY12
Target
Average Days to Complete Request -- 6.97 8.30 8.50 9.00
# of Closed Requests -- 231 234 240 250
# of Requests Completed Before SLA -- 198 208 190 180
Total # of Requests -- 285 242 300 320
This measure provides telecom services to internal County users. It
remains under development and proposed to include the number of service
requests and align total requests to service delivery metrics.

CountyStat16
Headline Measure: Help Desk
Percent of DTS Help Desk requests that are resolved on the first call
0
10
20
30
40
50
60
70
80
90
100
FY08 FY09 FY10 FY11 FY12
Perc
en
t
Measure FY08 Actual FY09 Actual FY10 Estimate FY11 Target FY12 Target
Percent 94.1 95.2 98.0 95.5 95.5
Number of Calls 31,092 29,592 31,703 32,700 32,100
Measure FY08 Actual FY09 Estimate FY10 Target FY11 Target
% - As presented in FY10 budget 94.1 95.2 95.5 95.5
First Call Resolution –
Service Level Agreement

CountyStat17
Headline Measure
Average number of seconds to serve a web page
0.00
0.10
0.20
0.30
0.40
0.50
0.60
0.70
0.80
0.90
1.00
FY09 FY10 FY11 FY12
Seco
nd
s
Measure FY08 Actual FY09 Actual FY10 Estimate FY11 Target FY12 Target
Seconds -- 0.61 .47 .46 .44
Measure FY08 Actual FY09 Estimate FY10 Target FY11 Target
As presented in FY10 budget -- 0.61 0.57 0.57

CountyStat18
Headline Measure: County Email Messaging
Number of email messages sent and received by County email account holders
Number of email messages filtered or blocked from entering County email account holders inboxes
(In millions)
0
50
100
150
200
250
300
350
FY08 FY09 FY10 FY11 FY12
Me
ss
ag
es
(in
millio
ns
)
Measure FY08 Actual FY09 Actual FY10 Estimate FY11 Target FY12 Target
Sent and Received 68.7 71.6 75.0 80.0 85.0
Filtered/Blocked 43.1 265.2 280.0 295.0 310.0
Measure FY08 Actual FY09 Estimate FY10 Target FY11 Target
FY10- Sent and Received 68.7 80 100 130
FY10- Filtered/Blocked 43.1 70 100 130
CountyStat19
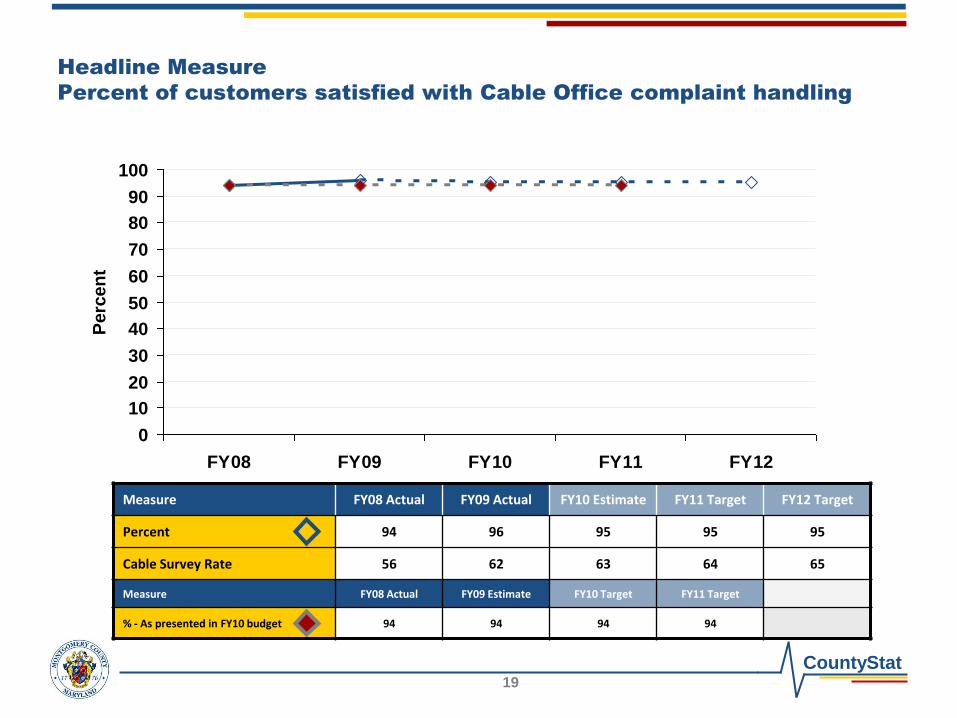
Headline Measure
Percent of customers satisfied with Cable Office complaint handling
0
10
20
30
40
50
60
70
80
90
100
FY08 FY09 FY10 FY11 FY12
Perc
en
t
Measure FY08 Actual FY09 Actual FY10 Estimate FY11 Target FY12 Target
Percent 94 96 95 95 95
Cable Survey Rate 56 62 63 64 65
Measure FY08 Actual FY09 Estimate FY10 Target FY11 Target
% - As presented in FY10 budget 94 94 94 94

CountyStat20
Headline Measure: IT Security
Average security vulnerabilities per device
10
15
20
25
30
35
FY10 FY11 FY12
Vu
lnera
bilit
ies
Measure FY10 Estimate FY11 Target FY12 Target
Average vulnerabilities 29.96 28.00 28.00
No. of devices 11,500 11,500 11,500
This provides the results of the ongoing County effort to minimize the
impact of security vulnerabilities on county devices.
Vulnerability: A weakness in a computing system that can result in harm to the system or its operations, especially
when this weakness is exploited by a hostile person or organization.
Device: Can include PCs, servers, systems, printers, switches, etc.

CountyStat21
Headline Measure: IT Security
Internet browse time by risk class (1 of 2)
This provides the tracking of internet use by County systems relative to the
categorization identified by County-used COTS software*.
0
50,000
100,000
150,000
200,000
250,000
FY09 FY10 FY11 FY12
Ho
urs
Business Usage Potential Personal Usage Bandwidth Usage
Security Risk Legal Liability
Note: Refer to Slide #22 for further detail and risk class definitions.
* - COTS vendor risk classifications may not align completely with County
categorizations, but are based on cross industry interpretation.

CountyStat22
Headline Measure: IT Security
Internet browse time by risk class (2 of 2)
Internet browse by risk class - definitions
Hours
FY09
Actual
FY10
Estimate
FY11
Target
FY12
Target
Business Usage
Definition: Sites that can be unrelated to job function based on employee role (e.g. Finance, Search Engines, Government, Travel)
123,638 180,000 200,000 215,000
Potential Personal Usage
Definition: Sites that are not usually related to job function based average employee position (e.g. News, Internet E-mail, Health, Shopping, Sports)
110,150 150,000 165,000 175,000
Network Bandwidth Usage
Definition: Audio/video downloads and streaming media36,970 45,000 50,000 60,000
Security Risk
Definition: Sites that present a potential security risk to the County 3,744 5,000 5,500 5,750
Legal Liability
Definition: Sites that are blocked for nearly all County users, but are permitted by approved department director specific requests
36 40 45 45Generally
Most Risky
Generally Least Risky
All internet browsing done on County PCs is accounted for through these 5
classes. “Business usage” is generally of the least risk to the County.

CountyStat23
Headline Measure: Project Management
Project schedule performance – average days past baseline
-100
-80
-60
-40
-20
0
20
40
60
80
100
FY10 FY11 FY12
Day
s
Measure FY10 Estimate FY11 Target FY12 Target
Average days past baseline 6 6.6 5.6
This represents the average schedule variance days for all dashboard projects, using last day of
month for each quarter value and including projects completed within that quarter. It compares
actual/projected end date to last approved baseline end date.
Dept Goal: W/in 90 days of
baseline

CountyStat24
Headline Measure: Project Management
Project budget performance - % over baseline
-40%
-30%
-20%
-10%
0%
10%
20%
30%
40%
FY10 FY11 FY12Perc
en
t
Measure FY10 Estimate FY11 Target FY12 Target
Percent over baseline -1.9% 0 0
This represents the average projected project percent budget variance for all dashboard projects. It
compares projected project cost (incurred + estimate to complete) to the authorized budget.
Dept Goal: W/in 10% over
baseline budget

CountyStat25
Headline Measure: Project Management
Tracked Project Details
Source: MCG IT Initiative Dashboard, DTS
ProjectsQ2 FY10 Q3 FY10
Budget Variance Schedule Variance Budget Variance Schedule Variance
TechMod
ERP 0 0 -28
ERP IA/IB -7.4 0 -5.5 0
CRM -3 0 -2.8 0
MCtime 0 0 0 0
IJIS
SAO 0 52 0 0
CRIMS 0 0 0 0
IJIS Core -83 0
PSCS
Station Alerting 0 0
CAD Server 0 0 0 0
DataLink Conversion
0 0 0 0
eJustice 0 0 0 42
Radio Upgrade 0 0 0 0
FRS Data911 0 0 0 0
Departmental Initiatives
OTRS 0 70
HHS FFP 0 0 0 19
BOE Election 0 0 0 0
DGS ICCS QA 0 2
Arc GIS 0 0 0 0
PIO 0 0 0 0
Average -6.23% 5.05 -0.92% 4.36
Yellow = Projects with no budget data, have been removed from overall budget measure
Gray = Period of no activity for project

CountyStat26
Headline Measure: Cable Office
Transmission Facilities Application Process
Level of Effort for Transmission Facilities Application Review and Approval
0
5
10
15
20
25
30
35
40
45
50
FY08 FY09 FY10 FY11 FY12
Days
MeasureFY08
Actual
FY09
Actual
FY10
Estimate
FY11
Target
FY12
Target
Average Days to Process 40 45 45 45 45
This measure demonstrates Cable Office activities on Communication Transmission Facilities
Application Processing. This provides visibility into the efforts to meet application process reviews
and approvals for new transmission facility siting requests.

CountyStat27
Headline Measure: Cable Office
Transmission Facilities Application Process
Level of Effort for Transmission Facilities Application Review and Approval
MeasureFY08
Actual
FY09
Actual
FY10
Estimate
FY11
Target
FY12
Target
Average Days to Process 40 45 45 45 45
Total Undelayed Applications 81 183 165 145 125
Total Applications 112 267 215 200 170

CountyStat28
Wrap-up
Follow-up items