department of water affairs & forestry directorate of ...€¦ · web viewdepartment of water...
TRANSCRIPT
DEPARTMENT OF WATER AFFAIRS & FORESTRY DIRECTORATE OF WATER CONSERVATION AND DEMAND MANAGEMENT
IMPLEMENTATION GUIDELINES FOR WATER CONSERVATION AND WATER DEMAND MANAGEMENT IN AGRICULTURE
DEVELOPMENT OF IRRIGATION WATER MANAGEMENT PLANS (Draft for testing in the Pilot Phase)
CONTENTS:
Part 1: Supporting Guidelines for Agricultural Water Management Plans
1. INTRODUCTION
1.1 THE WATER CONSERVATION AND DEMAND MANAGEMENT INITIATIVES: WHERE IT FITS INTO THE IMPLEMENTATION OF THE NATIONAL WATER ACT 1
1.2 THE CONSULTATION PROCESS TO IMPLEMENT WCDM IN THE AGRICULTURAL SECTOR
1.3 THE WATER MANAGEMENT PLAN APPROACH: STARTING SIMPLE, IMPROVING ANNUALLY
1.4 INTERNATIONAL DEVELOPMENTS
1.5 WHO GETS THE WATER?
2. WHAT IS A WATER MANAGEMENT PLAN?
2.1 WHAT ARE BENCHMARKS FOR IRRIGATION WATER USE?
2.2 WHAT IS WATER ACCOUNTING AND WATER AUDITING?
2.3 WHAT IS A BEST MANAGEMENT PRACTICE? 1
3. CAPACITY BUILDING AND TRAINING FOR WATER CONSERVATION & DEMAND MANAGEMENT IN AGRICULTURE
Part 2: Components of Water Management Plans and the tools for their preparation and implementation
STEP 1. BASIC INFORMATION ON THE WUA
1.1 HISTORY
1.2 OPERATING RULES AND REGULATIONS
1.3 WATER SHORTAGE ALLOCATION POLICIES
STEP 2. BENCHMARKS FOR AGRICULTURAL WATER USE
STEP 3. WATER AUDITING : DISPOSAL REPORT AND WATER ACCOUNT WITH PERFORMANCE INDICATORS
3.1 ANNUAL SUMMARY DISPOSAL REPORT
3.2 LOCATION AND FACILITIES
3.3 WATER MEASUREMENT AND ACCOUNTING PROCEDURES 35 3.4 WATER ACCOUNTING 36 3.5 PERFORMANCE INDICATORS
3.6 WATER AUDITING
STEP 4. BEST MANAGEMENT PRACTICES FOR WATER USER ASSOCIATIONS
4.1 PRIMARY BEST MANAGEMENT PRACTICES FOR WATER USER ASSOCIATIONS
4.2 SECONDARY BEST MANAGEMENT PRACTICES FOR WATER USER ASSOCIATIONS
Part 1
SUPPORTING GUIDELINES FOR AGRICULTURAL WATER MANAGEMENT PLANS
1. INTRODUCTION
1.1 THE WATER CONSERVATION AND DEMAND MANAGEMENT INITIATIVES: WHERE IT FITS INTO THE IMPLEMENTATION OF THE NATIONAL WATER ACT
South Africa is a semi-arid country, where water is a key strategic resource in the development of all sectors of the economy. Efficient management of our limited water resources is therefore an essential element of that development. The Department of Water Affairs and Forestry (DWAF) is in the process of developing a Water Conservation and Water Demand Management (WCDM) strategy for each water use sector, namely, Agriculture, Municipal, Industry, Forestry and Environment. The National Water Conservation and Demand Strategy (NWCDMS) will be incorporated into the National Water Resources Strategy (NWRS), which is a legal requirement of the new National Water Act (Act 36 of 1998). The Catchment Management Strategies of each of the 19 Water Management Areas, the National Pricing Strategy and other strategies currently being developed by DWAF will also contribute to the NWRS. The processes outlined above are illustrated in Figure 1 below.

Figure 1 Overview of water conservation and demand management development processes in South Africa
The Agricultural WCDM Strategy has been circulated for comment and discussed in consultation workshops. Water User Associations will implement the strategy through the drawing up and submission of Water Management Plans.
The focus is on WUAs, because they will be at the heart of agriculture's water management relationships and initiatives. However, wherever this document refers to WUAs, it includes Government Water Schemes and other irrigation water suppliers.
These Water Management Plans will be similar to the Water Services Development Plans currently being developed by Municipalities. WUAs are now required in terms of the law to submit Water Management Plans to their Catchment Management Agency (CMA) and/or the Department of Water Affairs and Forestry (DWAF).
1.2 THE CONSULTATION PROCESS TO IMPLEMENT WCDM IN THE AGRICULTURAL SECTOR
To enable WUAs to comply with the legal requirement to submit Water Management Plans, DWAF has consulted with the agricultural sector to develop guidelines for Water Management Plans that would be practical, fair, effective and affordable.
This approach was strongly supported by participants in five public expert consultations held in March, April and June 2000 to develop a suitable approach and format for Irrigation Water Management Plans in discussion with the agricultural sector.
The workshops in the first round of consultation were held in four irrigation areas that have taken demonstrable steps to conserve water and that are regularly under water stress. Workshops were held in the Breede River valley in the Western Cape, Sundays River in Eastern Cape, Orange/Vaal area in Northern Cape and Olifants River in Northern Province/Mpumalanga.
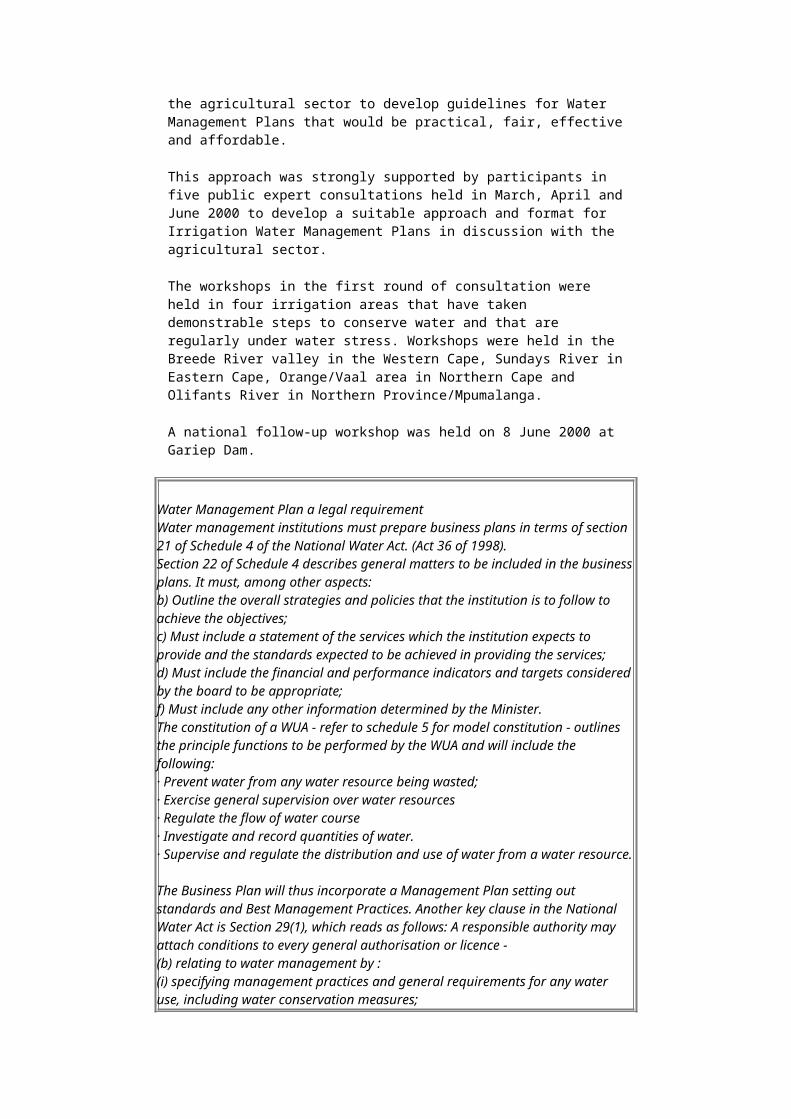
A national follow-up workshop was held on 8 June 2000 at Gariep Dam.
Water Management Plan a legal requirement Water management institutions must prepare business plans in terms of section 21 of Schedule 4 of the National Water Act. (Act 36 of 1998).Section 22 of Schedule 4 describes general matters to be included in the business plans. It must, among other aspects: b) Outline the overall strategies and policies that the institution is to follow to achieve the objectives; c) Must include a statement of the services which the institution expects to provide and the standards expected to be achieved in providing the services; d) Must include the financial and performance indicators and targets considered by the board to be appropriate; f) Must include any other information determined by the Minister. The constitution of a WUA - refer to schedule 5 for model constitution - outlines the principle functions to be performed by the WUA and will include the following:· Prevent water from any water resource being wasted;· Exercise general supervision over water resources· Regulate the flow of water course · Investigate and record quantities of water. · Supervise and regulate the distribution and use of water from a water resource. The Business Plan will thus incorporate a Management Plan setting out standards and Best Management Practices. Another key clause in the National Water Act is Section 29(1), which reads as follows: A responsible authority may attach conditions to every general authorisation or licence - (b) relating to water management by : (i) specifying management practices and general requirements for any water use, including water conservation measures; (ii) requiring the monitoring and analysis of and reporting on every water use and imposing a duty to measure and record aspect of water use, specifying measuring and recording devices to be used; (iii) requiring the preparation and approval of and adherence to, a water management plan.
1.3 THE WATER MANAGEMENT PLAN APPROACH: STARTING SIMPLE, IMPROVING ANNUALLY
The objective of the Water Management Plans is to improve agricultural water management by stimulating self-analysis and forward thinking on the part of farmers, their water suppliers, CMA, officials, consultants and advisors. WUAs will develop and implement their Plans in a progressive manner. The Water Management Plan may be very superficial to start with and may be lacking in certain data, but it will be improved annually when the WUA reviews its Plan.
Essentially, the process aims to conserve water, to improve water supply services to irrigation farmers and to enable them to use irrigation water more efficiently.
Water has to be conserved at all levels - from the source, right through to the points of use. However, the focus at this early stage of the process is on the activities of WUAs and how these are aimed at:
Reducing water losses related to the WUA's storage and water distribution systems and management; and
Enabling farmers to use water more efficiently on-farm.
1.4 INTERNATIONAL DEVELOPMENTS
Due to increasing demands for water and its ongoing depletion globally, water resources management has received considerable attention around the world for many years - and particularly in the last decade. Prominent in policy and strategy thinking are three particular universal trends, all of which are current features of the new South African Water legislation:
Integrated water resources planning and management based on the river basin or catchment.
A balance between policy and regulatory functions of central government and the decentralised management, operation and maintenance of water delivery through participation by the stakeholder and water user.
A shift in the policy of water resource management, away from the development of new systems and infrastructures to provide more water, to the improved management of existing water resources and the improvement of water use efficiency and water conservation. These improvements are often implemented through Water Management Plans, with a focus on Best Management Practices.
A significant step is the decentralisation policy whereby the water users themselves, through the Catchment Management Agency (CMA) and Water User Association (WUA), have an important part to play in the process of planning, management, decision-making and administration. The users directly participate in, and are responsible for, water supply and distribution in their own farming area.
The development of Water Management Plans by the WUAs is central to the whole focus of water conservation and water demand management and this is where we are focussing in this programme. The participants in the workshops highlighted the following expected benefits with Water Management Plans:
A tool firstly for WUAs' own management purposes, and secondly for the purposes of DWAF and the CMAs, such as the development of catchment databases and the National Water Balance.
The Water Management Plan is a basis for planning and measurement, and will demonstrate progress with WCDM.
A mechanism for sharing experience between WUAs. A basis for negotiation with other institutions, including WUAs, CMA,
DWAF etc. and for international water negotiations.
1.5 WHO GETS THE WATER?
Participants in every workshop wanted clarity on what happens to the water savings they manage to accomplish: will they be shooting themselves in the foot by investing money in improved practices, just to lose the benefits of their efforts to other sectors?
From the field visits at leading practitioners it was clear that the economic and management benefits of water conservation have been the most significant incentives for improvement. Such economic benefits may include, depending on the crop type, markets and water supply costs, any of the following:
Improved yields · Improved quality of produce, especially for the export markets which pay large premiums for quality
Reduced water supply costs Easier management, especially with automated systems (although
this requires a higher level and more exacting type of management - there is little margin for error, and therefore increased risk.
Participants were assured that the National Water Act does not allow water to be taken away arbitrarily. The review of water allocations will be a separate process to the water conservation process and care will be taken not to disadvantage those who have invested in using water more productively.
Top
2. WHAT IS A WATER MANAGEMENT PLAN?
In a Water Management Plan, a WUA describes its current irrigation water use and conservation measures and sets out how it plans to implement Best Management Practices (BMPs) to improve its irrigation water supply services and to achieve water conservation and water demand management.
Developing a Water Management Plan and reviewing it regularly is a major stimulus to efficiency, promotes co-ordinated action and facilitates negotiations with the CMA and other stakeholders. The process does not require expensive data gathering, but uses existing data for its initial implementation and then aims to improve the data from year-to-year. Therefore the WUA should be able to develop its own Water Management Plan without the assistance of external consultants, unless the WUA prefers to employ such help.
In its Water Management Plan a WUA goes through the following steps:
Step 1: Describe the WUA, its location and facilities, history, operating rules, etc. (see Part 2: 1). This dovetails with WUAs' current development of their constitutions to be transformed from Irrigation Boards
Step 2: Identify and adopt appropriate Benchmarks for irrigation water use and water management in the WUA area (see section 2 and Part 2: 2).
Step 3: Develop a Water Account of the WUA's water resources and uses for auditing purposes (see section 2.2 and Part 2: 3).
Step 4: Review progress and show plans for the implementation of Primary and Secondary BMPs for the WUA (see section 2.3 and Part 2: 4).
Step 5: In later reviews of their WMPs, WUAs will have to motivate which "Secondary" BMPs they should not have to implement, through performing a Net Benefit Analysis. This is an analysis of the impact of the BMPs on the environment, possible third parties and any indirect economic impacts on the farmers and others.
2.1 WHAT ARE BENCHMARKS FOR IRRIGATION WATER USE?
The primary benchmarks for irrigation water use are firstly the crop water requirement of a specific crop (ETcrop) in a specific area at a specific time of year. ETcrop does not take irrigation efficiency factors into account.
Secondly, the ETcrop benchmark can be used to calculate the irrigation water requirements for a specific crop in a specific area and at a specific time of year by adjusting the crop water requirement for appropriate irrigation efficiency factors such as leaching requirements, irrigation application
efficiency, effective rainfall and reasonable transmission losses (mainly evaporation). This Benchmark is not the "quota" or water allocation for irrigation, but rather a management tool for decision-making within a WUA.
These benchmarks can, in turn, be used to calculate the expected irrigation water requirements for the WUA as a whole (Equation 1 below).
The WUA should therefore make all reasonable effort:
To calculate the irrigation water requirement for each crop grown in the WUA district, and
To estimate, as closely as possible, the area of each crop grown, preferably averaged over more than one year, in the WUA district, and
Using the above to calculate the monthly and annual irrigation requirements for the WUA.
Applying the calculated requirements as a water management tool.
These calculations need to be viewed as guidelines for irrigation water requirements and may need to be tempered by local experience.
2.1.1 Calculation of irrigation water requirement
Research on crop water use and irrigation requirements for a wide range of commercial crops in different climatic regions and on different soil types has been ongoing in South Africa for over 25 years. The results of this research have been effectively applied in many irrigation areas for almost as long a period. The agricultural sector in South Africa may therefore be well ahead of other sectors with regard to the establishment of benchmarks and operating guidelines for crop water use and irrigation requirements.
Despite this progress there remain many gaps in the information/data pool and the initiatives have been adversely affected by inconsistencies in approaches, duplication and uncoordinated effort.
The sector is, however, now in a position to focus on a standard approach to establishing benchmarks for crop water use and irrigation requirements for the many agro-climatic zones in which irrigation is practised in South Africa.
The standard approach to be applied universally is based on the following two components:
The Penman-Monteith method of estimating reference evapotranspiration (ETo) in any given zone and
The FAO method of linking reference evapotranspiration to any given crop by way of a standard crop factor (Kc) for any given period during the growing season of the crop. This method is described in the FAO Irrigation and Drainage Paper No. 56 (FAO 1998).
In contrast to the crop factors used with A-pan, reference evaporation, Kc can be adjusted consistently and with confidence to accommodate differences in climatic zone and farming practice. Because the short grass reference evapotranspiration already accounts for many of the implications of differences in climate, it is often possible to use a single set of crop coefficients for different climatic zones. The ET0 - Kc approach has become a widely accepted international standard and has therefore been accepted by DWAF as a basis for establishing crop water requirement and irrigation requirement benchmarks.
The computer programme SAPWAT, which has recently become available, is structured in accordance with the principles outlined in FAO 56. SAPWAT is therefore available as an integral support tool for benchmarking. (Crosby C P (2000); Crosby C P (1999); FAO (1992)).
The Pricing Strategy of the Department of Water Affairs and Forestry (DWAF) requires that SAPWAT be used as the procedure to calculate crop water requirements and irrigation requirements where new benchmarks are required. The Water Resource Planning Directorate also uses SAPWAT for basin studies and in the Water Balance Model. Furthermore the Directorate of Water Utilisation is using SAPWAT as a tool in the registration of water use. It is therefore logical that SAPWAT should be adopted as the primary tool for the calculation of the above benchmarks in the implementation of WC/DM in agriculture.
A major advantage of SAPWAT in this regard is its flexibility in accommodating best management practices that are specific to areas and situations.
Examples of practices that can be accommodated in the SAPWAT model include:
Double cropping. Ensure that both summer and winter crops are accounted for. This should be evident in the calculation tables.
Season length. Ensure that this is adjusted for the crop cultivars selected, local adaptability, frost etc.
Irrigation method. Select the correct efficiency factor for the irrigation method used. Improved efficiencies should be targeted.
Leaching requirement. Ensure that this is accounted for, and at the correct level for local conditions.
Pre-plant irrigation. If it is a standard practice, build it into irrigation water requirements.
Unusual climatic effects. For example, persistent drying winds. Special management features such as allowing for the use of water
for frost protection, cooling etc. Special agronomic practices such as row spacing, population density
etc. Increase in irrigation application to allow for the variance in irrigation
distribution and soil characteristics.
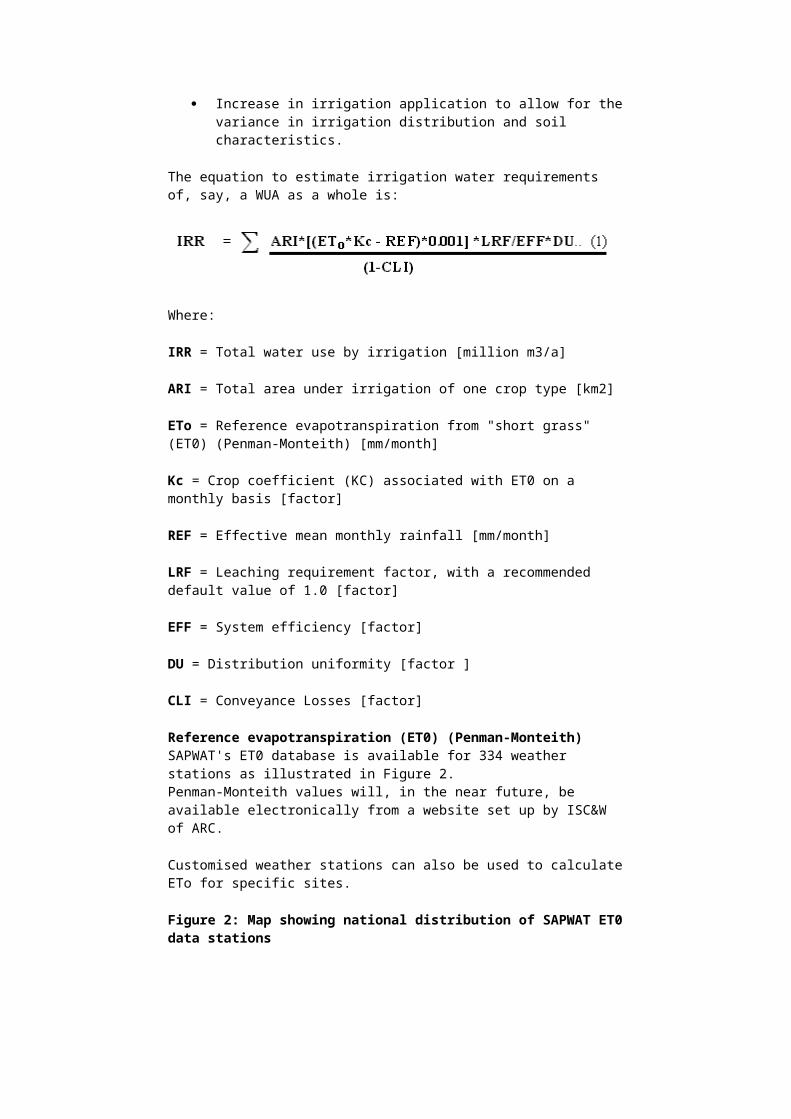
The equation to estimate irrigation water requirements of, say, a WUA as a whole is:
Where:
IRR = Total water use by irrigation [million m3/a]
ARI = Total area under irrigation of one crop type [km2]
ETo = Reference evapotranspiration from "short grass" (ET0) (Penman-Monteith) [mm/month]
Kc = Crop coefficient (KC) associated with ET0 on a monthly basis [factor]
REF = Effective mean monthly rainfall [mm/month]
LRF = Leaching requirement factor, with a recommended default value of 1.0 [factor]
EFF = System efficiency [factor]
DU = Distribution uniformity [factor ]
CLI = Conveyance Losses [factor]
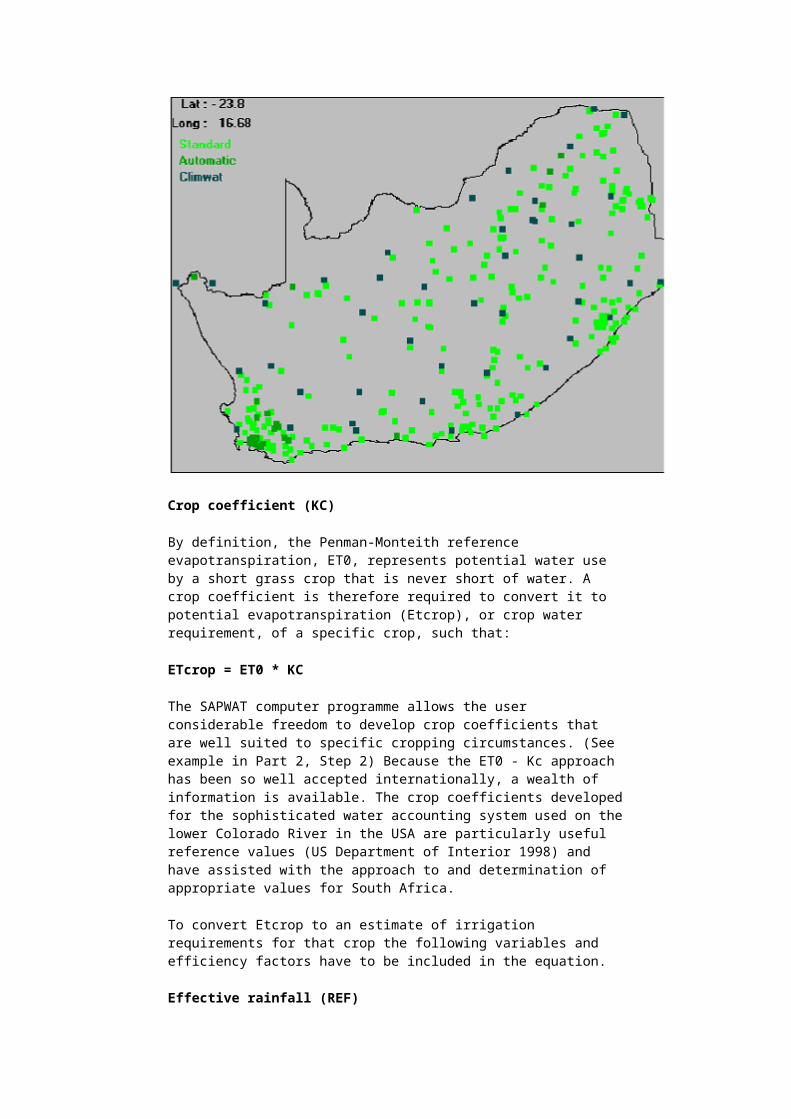
Reference evapotranspiration (ET0) (Penman-Monteith) SAPWAT's ET0 database is available for 334 weather stations as illustrated in Figure 2.Penman-Monteith values will, in the near future, be available electronically from a website set up by ISC&W of ARC.
Customised weather stations can also be used to calculate ETo for specific sites.
Figure 2: Map showing national distribution of SAPWAT ET0 data stations
Crop coefficient (KC)
By definition, the Penman-Monteith reference evapotranspiration, ET0, represents potential water use by a short grass crop that is never short of water. A crop coefficient is therefore required to convert it to potential evapotranspiration (Etcrop), or crop water requirement, of a specific crop, such that:
ETcrop = ET0 * KC
The SAPWAT computer programme allows the user considerable freedom to develop crop coefficients that are well suited to specific cropping circumstances. (See example in Part 2, Step 2) Because the ET0 - Kc approach has been so well accepted internationally, a wealth of information is available. The crop coefficients developed for the sophisticated water accounting system used on the lower Colorado River in the USA are particularly useful reference values (US Department of Interior 1998) and have assisted with the approach to and determination of appropriate values for South Africa.
To convert Etcrop to an estimate of irrigation requirements for that crop the following variables and efficiency factors have to be included in the equation.
Effective rainfall (REF)
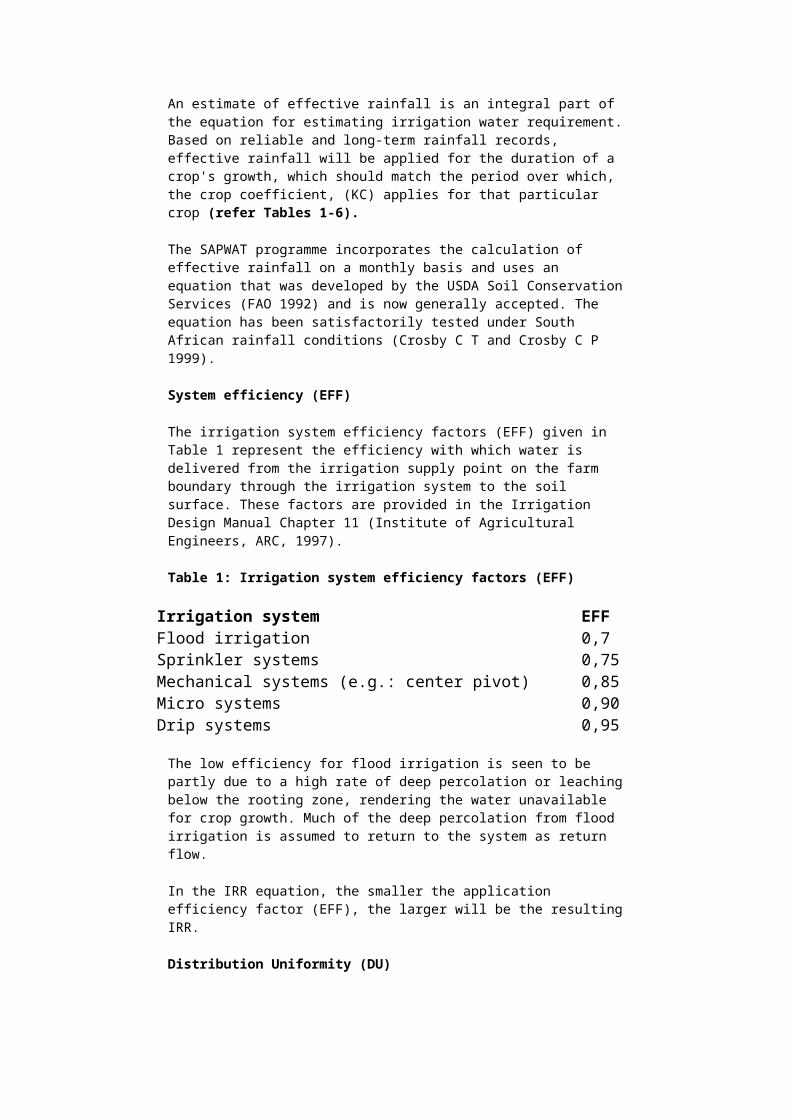
An estimate of effective rainfall is an integral part of the equation for estimating irrigation water requirement. Based on reliable and long-term rainfall records, effective rainfall will be applied for the duration of a crop's growth, which should match the period over which, the crop coefficient, (KC) applies for that particular crop (refer Tables 1-6).
The SAPWAT programme incorporates the calculation of effective rainfall on a monthly basis and uses an equation that was developed by the USDA Soil Conservation Services (FAO 1992) and is now generally accepted. The equation has been satisfactorily tested under South African rainfall conditions (Crosby C T and Crosby C P 1999).
System efficiency (EFF)
The irrigation system efficiency factors (EFF) given in Table 1 represent the efficiency with which water is delivered from the irrigation supply point on the farm boundary through the irrigation system to the soil surface. These factors are provided in the Irrigation Design Manual Chapter 11 (Institute of Agricultural Engineers, ARC, 1997).
Table 1: Irrigation system efficiency factors (EFF)
Irrigation system EFFFlood irrigation 0,7Sprinkler systems 0,75Mechanical systems (e.g.: center pivot) 0,85Micro systems 0,90Drip systems 0,95
The low efficiency for flood irrigation is seen to be partly due to a high rate of deep percolation or leaching below the rooting zone, rendering the water unavailable for crop growth. Much of the deep percolation from flood irrigation is assumed to return to the system as return flow.
In the IRR equation, the smaller the application efficiency factor (EFF), the larger will be the resulting IRR.
Distribution Uniformity (DU)
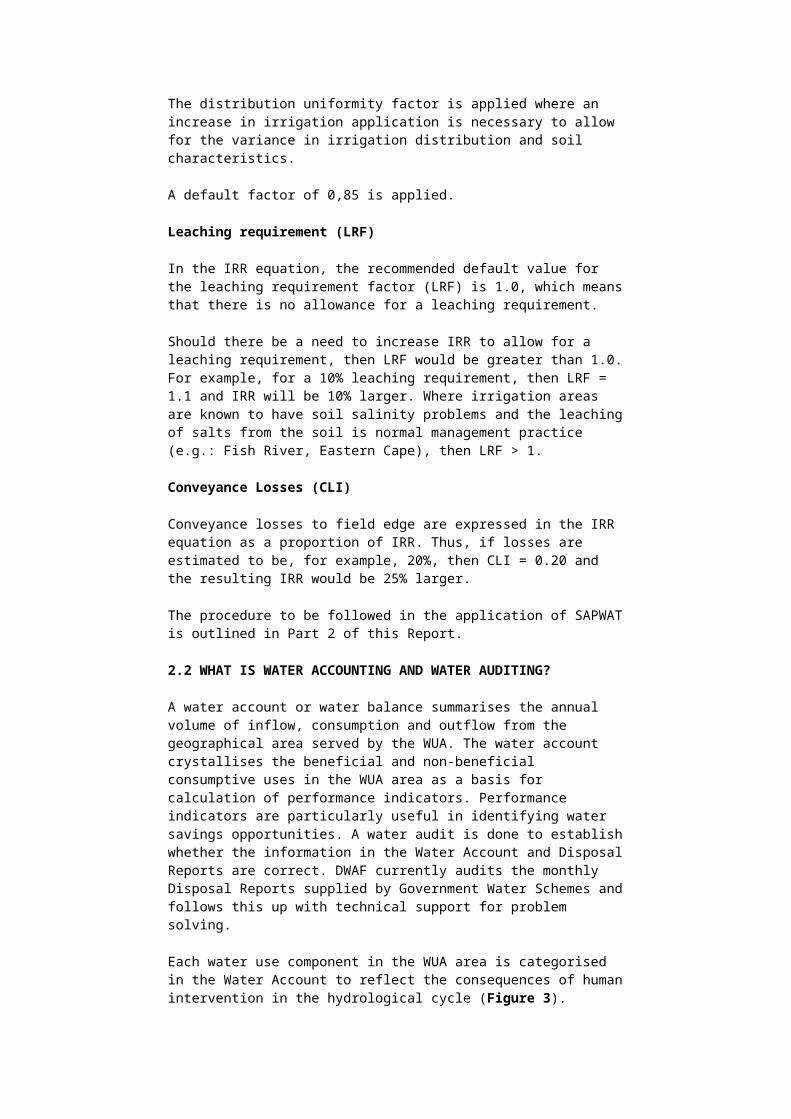
The distribution uniformity factor is applied where an increase in irrigation application is necessary to allow for the variance in irrigation distribution and soil characteristics.
A default factor of 0,85 is applied.
Leaching requirement (LRF)
In the IRR equation, the recommended default value for the leaching requirement factor (LRF) is 1.0, which means that there is no allowance for a leaching requirement.
Should there be a need to increase IRR to allow for a leaching requirement, then LRF would be greater than 1.0. For example, for a 10% leaching requirement, then LRF = 1.1 and IRR will be 10% larger. Where irrigation areas are known to have soil salinity problems and the leaching of salts from the soil is normal management practice (e.g.: Fish River, Eastern Cape), then LRF > 1.
Conveyance Losses (CLI)
Conveyance losses to field edge are expressed in the IRR equation as a proportion of IRR. Thus, if losses are estimated to be, for example, 20%, then CLI = 0.20 and the resulting IRR would be 25% larger.
The procedure to be followed in the application of SAPWAT is outlined in Part 2 of this Report.
2.2 WHAT IS WATER ACCOUNTING AND WATER AUDITING?
A water account or water balance summarises the annual volume of inflow, consumption and outflow from the geographical area served by the WUA. The water account crystallises the beneficial and non-beneficial consumptive uses in the WUA area as a basis for calculation of performance indicators. Performance indicators are particularly useful in identifying water savings opportunities. A water audit is done to establish whether the information in the Water Account and Disposal Reports are correct. DWAF currently audits the monthly Disposal Reports supplied by Government Water Schemes and follows this up with technical support for problem solving.
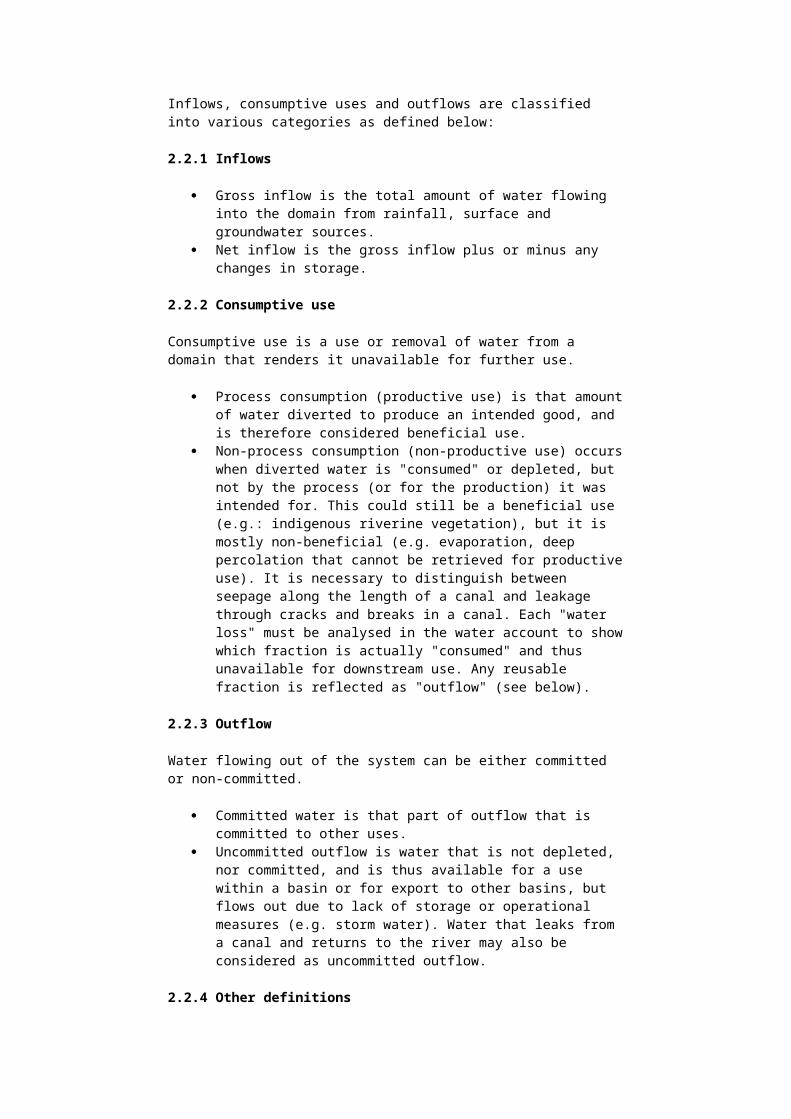
Each water use component in the WUA area is categorised in the Water Account to reflect the consequences of human intervention in the hydrological cycle (Figure 3). Inflows, consumptive uses and outflows are classified into various categories as defined below:
2.2.1 Inflows
Gross inflow is the total amount of water flowing into the domain from rainfall, surface and groundwater sources.
Net inflow is the gross inflow plus or minus any changes in storage.
2.2.2 Consumptive use
Consumptive use is a use or removal of water from a domain that renders it unavailable for further use.
Process consumption (productive use) is that amount of water diverted to produce an intended good, and is therefore considered beneficial use.
Non-process consumption (non-productive use) occurs when diverted water is "consumed" or depleted, but not by the process (or for the production) it was intended for. This could still be a beneficial use (e.g.: indigenous riverine vegetation), but it is mostly non-beneficial (e.g. evaporation, deep percolation that cannot be retrieved for productive use). It is necessary to distinguish between seepage along the length of a canal and leakage through cracks and breaks in a canal. Each "water loss" must be analysed in the water account to show which fraction is actually "consumed" and thus unavailable for downstream use. Any reusable fraction is reflected as "outflow" (see below).
2.2.3 Outflow
Water flowing out of the system can be either committed or non-committed.
Committed water is that part of outflow that is committed to other uses.
Uncommitted outflow is water that is not depleted, nor committed, and is thus available for a use within a basin or for export to other basins, but flows out due to lack of storage or operational measures (e.g. storm water). Water that leaks from a canal and returns to the river may also be considered as uncommitted outflow.
2.2.4 Other definitions
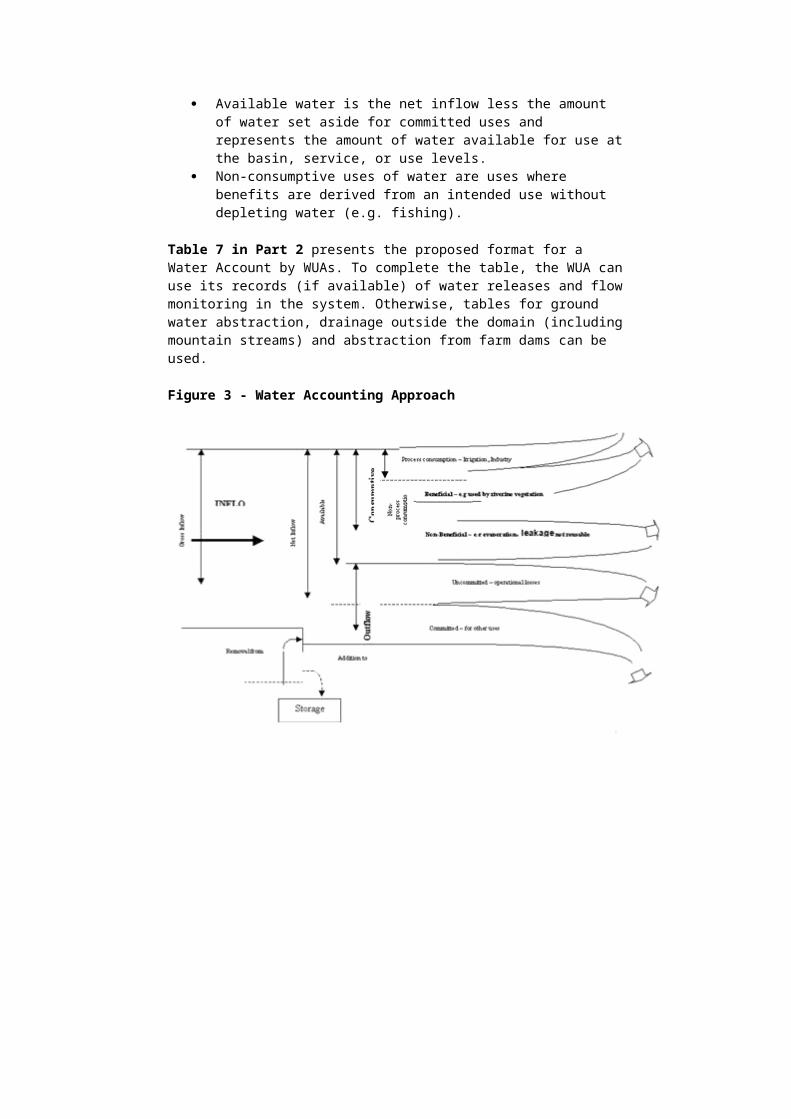
Available water is the net inflow less the amount of water set aside for committed uses and represents the amount of water available for use at the basin, service, or use levels.
Non-consumptive uses of water are uses where benefits are derived from an intended use without depleting water (e.g. fishing).
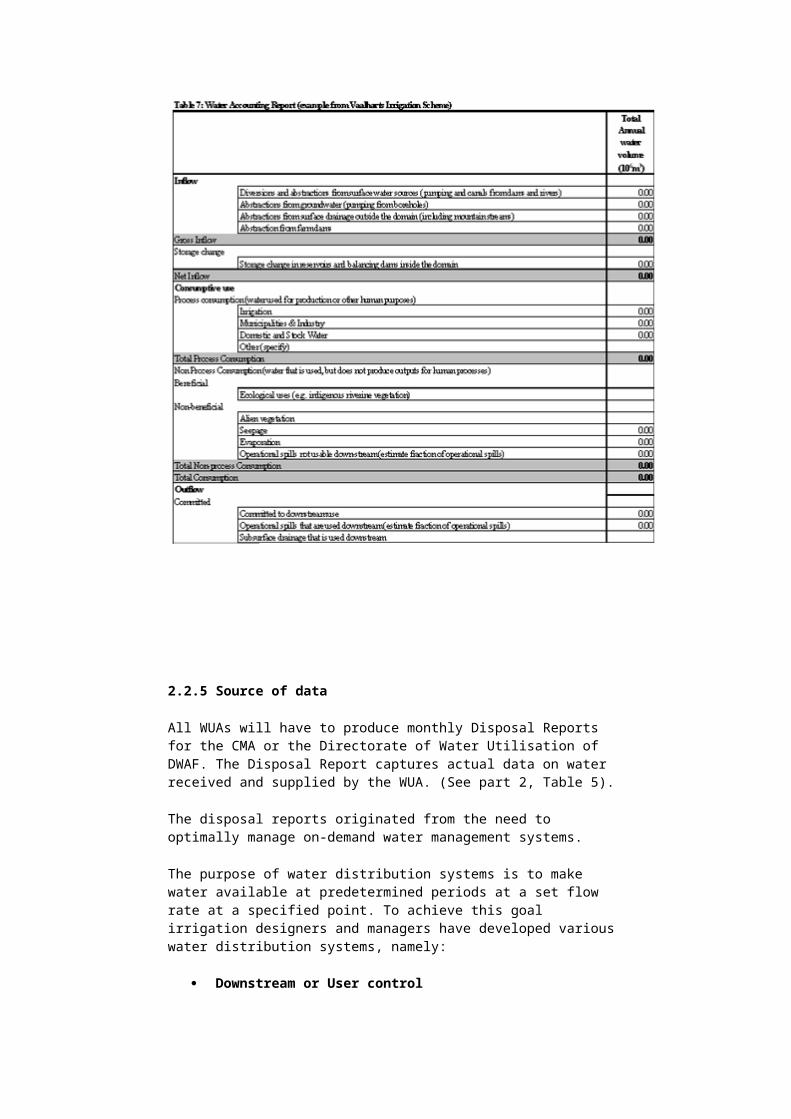
Table 7 in Part 2 presents the proposed format for a Water Account by WUAs. To complete the table, the WUA can use its records (if available) of water releases and flow monitoring in the system. Otherwise, tables for ground water abstraction, drainage outside the domain (including mountain streams) and abstraction from farm dams can be used.
Figure 3 - Water Accounting Approach
2.2.5 Source of data
All WUAs will have to produce monthly Disposal Reports for the CMA or the Directorate of Water Utilisation of DWAF. The Disposal Report captures actual data on water received and supplied by the WUA. (See part 2, Table 5).
The disposal reports originated from the need to optimally manage on-demand water management systems.
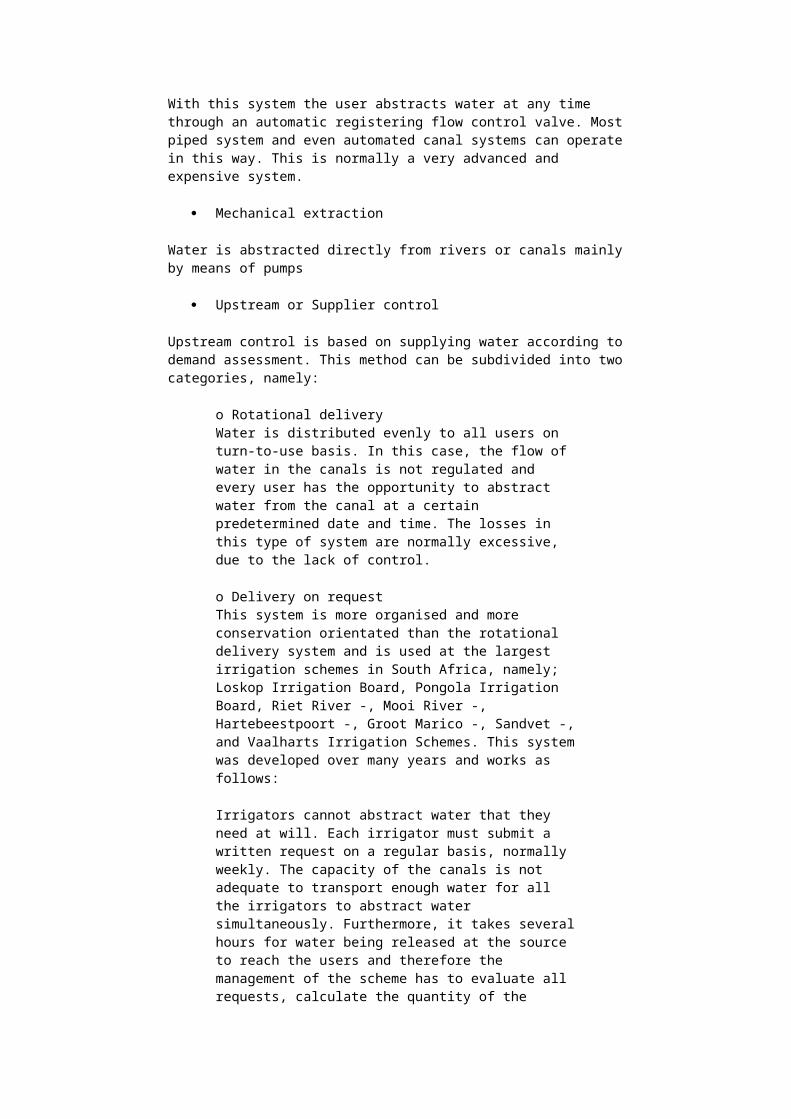
The purpose of water distribution systems is to make water available at predetermined periods at a set flow rate at a specified point. To achieve this goal irrigation designers and managers have developed various water distribution systems, namely:
Downstream or User control
With this system the user abstracts water at any time through an automatic registering flow control valve. Most piped system and even automated canal systems can operate in this way. This is normally a very advanced and expensive system.
Mechanical extraction
Water is abstracted directly from rivers or canals mainly by means of pumps
Upstream or Supplier control
Upstream control is based on supplying water according to demand assessment. This method can be subdivided into two categories, namely:
o Rotational deliveryWater is distributed evenly to all users on turn-to-use basis. In this case, the flow of water in the canals is not regulated and every user has the opportunity to abstract water from the canal at a certain predetermined date and time. The losses in this type of system are normally excessive, due to the lack of control.
o Delivery on request This system is more organised and more conservation orientated than the rotational delivery system and is used at the largest irrigation schemes in South Africa, namely; Loskop Irrigation Board, Pongola Irrigation Board, Riet River -, Mooi River -, Hartebeestpoort -, Groot Marico -, Sandvet -, and Vaalharts Irrigation Schemes. This system was developed over many years and works as follows:
Irrigators cannot abstract water that they need at will. Each irrigator must submit a written request on a regular basis, normally weekly. The capacity of the canals is not adequate to transport enough water for all the irrigators to abstract water simultaneously. Furthermore, it takes several hours for water being released at the source to reach the users and therefore the management of the scheme has to evaluate all requests, calculate the quantity of the release and determine the dates, times and volumes of the release to each irrigator.
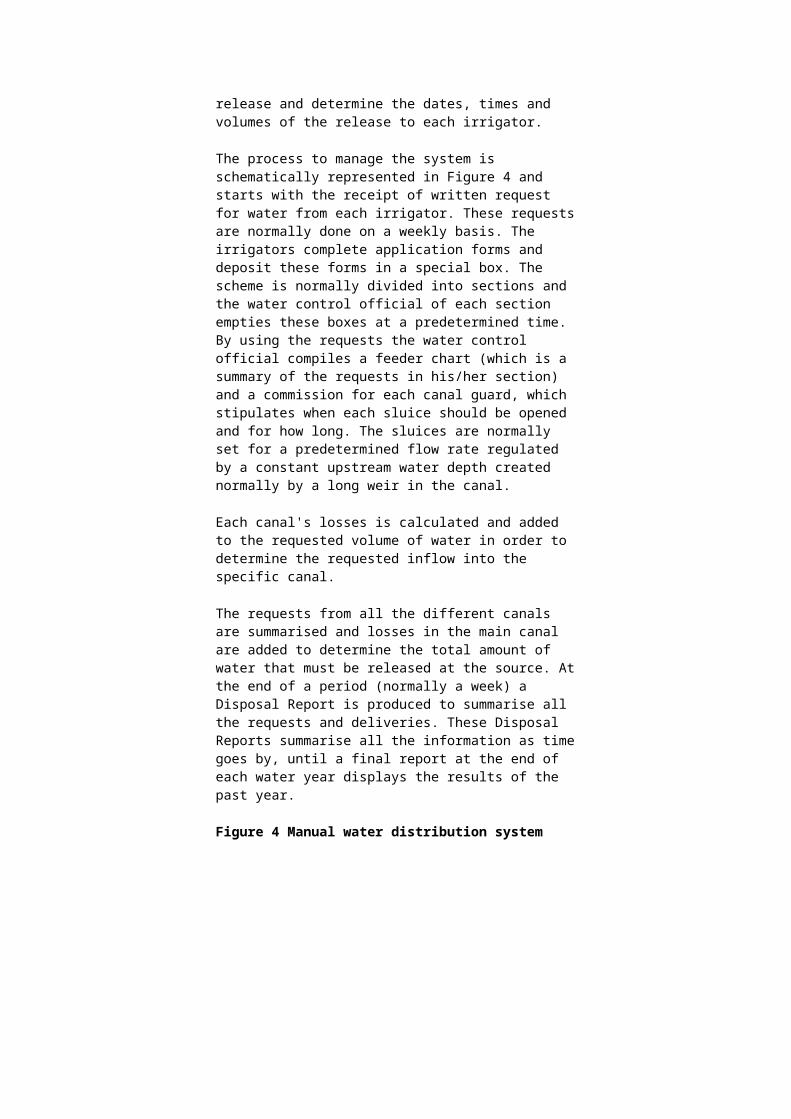
The process to manage the system is schematically represented in Figure 4 and starts with the receipt of written request for water from each irrigator. These requests are normally done on a weekly basis. The irrigators complete application forms and deposit these forms in a special box. The scheme is normally divided into sections and the water control official of each section empties these boxes at a predetermined time. By using the requests the water control official compiles a feeder chart (which is a summary of the requests in his/her section) and a commission for each canal guard, which stipulates when each sluice should be opened and for how long. The sluices are normally set for a predetermined flow rate regulated by a constant upstream water depth created normally by a long weir in the canal.
Each canal's losses is calculated and added to the requested volume of water in order to determine the requested inflow into the specific canal.
The requests from all the different canals are summarised and losses in the main canal are added to determine the total amount of water that must be released at the source. At the end of a period (normally a week) a Disposal Report is produced to summarise all the requests and deliveries. These Disposal Reports summarise all the information as time goes by, until a final report at the end of each water year displays the results of the past year.
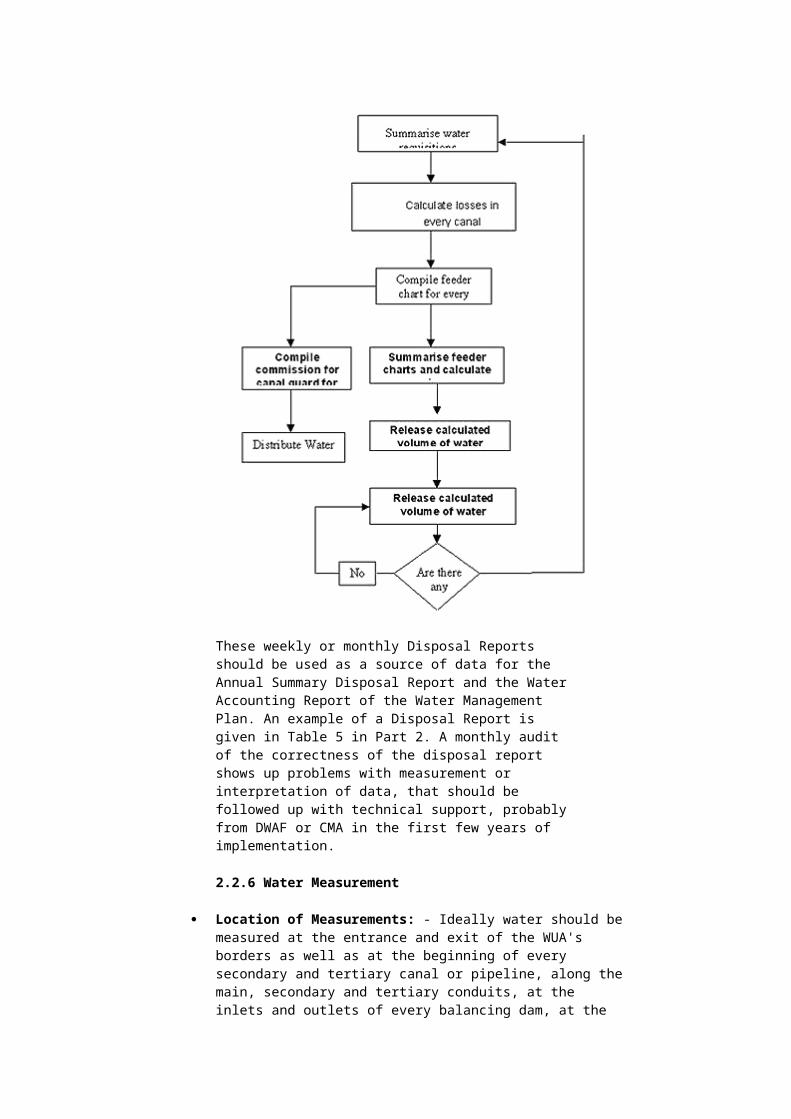
Figure 4 Manual water distribution system
These weekly or monthly Disposal Reports should be used as a source of data for the Annual Summary Disposal Report and the Water Accounting Report of the Water Management Plan. An example of a Disposal Report is given in Table 5 in Part 2. A monthly audit of the correctness of the disposal report shows up problems with measurement or interpretation of data, that should be followed up with technical support, probably from DWAF or CMA in the first few years of implementation.
2.2.6 Water Measurement
Location of Measurements: - Ideally water should be measured at the entrance and exit of the WUA's borders as well as at the beginning of every secondary and tertiary canal or pipeline, along the main, secondary and tertiary conduits, at the inlets and outlets of every balancing dam, at the end of every conduit and at the farm turnout. The first objective of water measurement is to manage the water distribution system, but also to analyse management problems
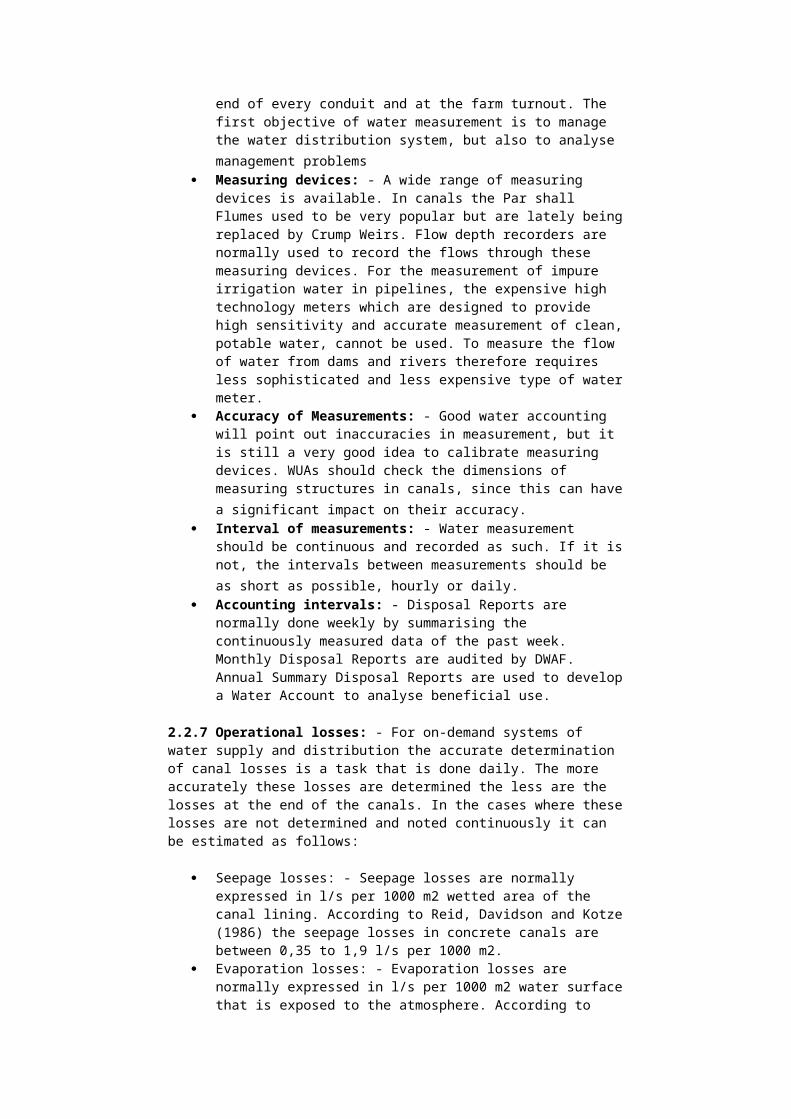
Measuring devices: - A wide range of measuring devices is available. In canals the Par shall Flumes used to be very popular but are lately being replaced by Crump Weirs. Flow depth recorders are normally used to record the flows through these measuring devices. For the measurement of impure irrigation water in pipelines, the
expensive high technology meters which are designed to provide high sensitivity and accurate measurement of clean, potable water, cannot be used. To measure the flow of water from dams and rivers therefore requires less sophisticated and less expensive type of water meter.
Accuracy of Measurements: - Good water accounting will point out inaccuracies in measurement, but it is still a very good idea to calibrate measuring devices. WUAs should check the dimensions of measuring structures in canals, since this can have a significant impact on their accuracy.
Interval of measurements: - Water measurement should be continuous and recorded as such. If it is not, the intervals between measurements should be as short as possible, hourly or daily.
Accounting intervals: - Disposal Reports are normally done weekly by summarising the continuously measured data of the past week. Monthly Disposal Reports are audited by DWAF. Annual Summary Disposal Reports are used to develop a Water Account to analyse beneficial use.
2.2.7 Operational losses: - For on-demand systems of water supply and distribution the accurate determination of canal losses is a task that is done daily. The more accurately these losses are determined the less are the losses at the end of the canals. In the cases where these losses are not determined and noted continuously it can be estimated as follows:
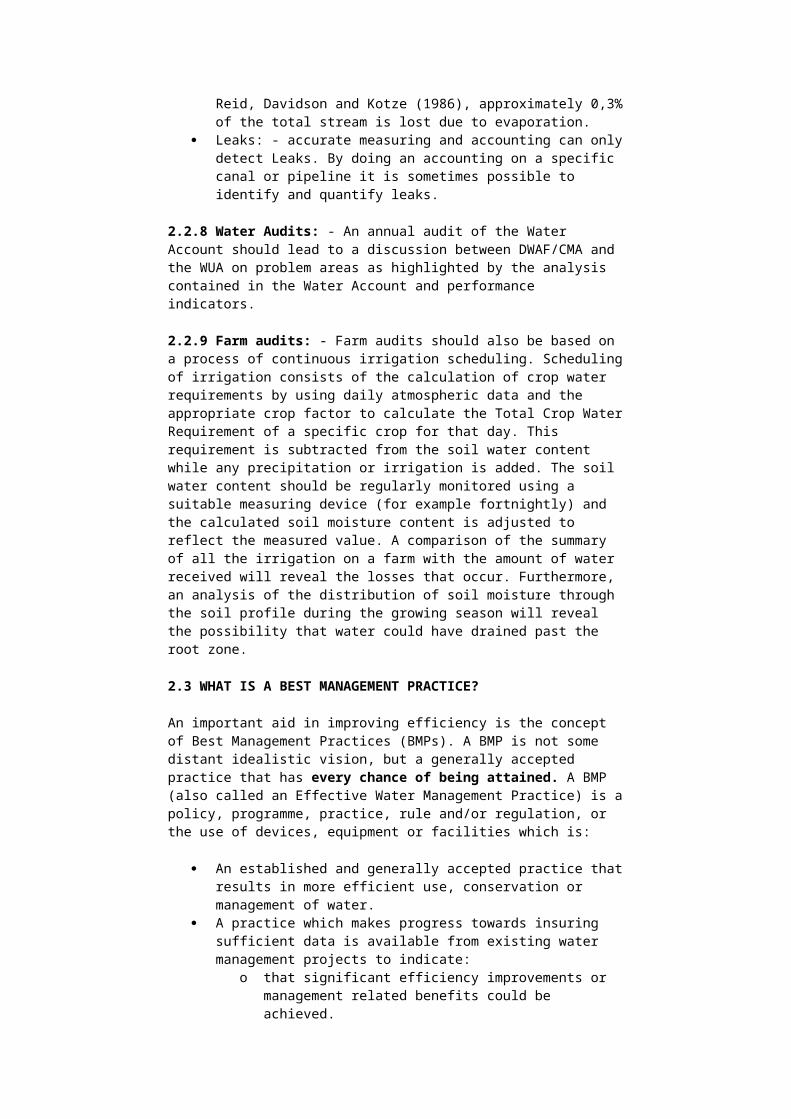
Seepage losses: - Seepage losses are normally expressed in l/s per 1000 m2 wetted area of the canal lining. According to Reid, Davidson and Kotze (1986) the seepage losses in concrete canals are between 0,35 to 1,9 l/s per 1000 m2.
Evaporation losses: - Evaporation losses are normally expressed in l/s per 1000 m2 water surface that is exposed to the atmosphere. According to Reid, Davidson and Kotze (1986), approximately 0,3% of the total stream is lost due to evaporation.
Leaks: - accurate measuring and accounting can only detect Leaks. By doing an accounting on a specific canal or pipeline it is sometimes possible to identify and quantify leaks.
2.2.8 Water Audits: - An annual audit of the Water Account should lead to a discussion between DWAF/CMA and the WUA on problem areas as highlighted by the analysis contained in the Water Account and performance indicators.
2.2.9 Farm audits: - Farm audits should also be based on a process of continuous irrigation scheduling. Scheduling of irrigation consists of the calculation of crop water requirements by using daily atmospheric data and the appropriate crop factor to calculate the Total Crop Water Requirement of a specific crop for that day. This requirement is subtracted from the soil water content while any precipitation or irrigation is added. The soil water content should be regularly monitored using a suitable measuring device (for example fortnightly) and the calculated soil moisture content is adjusted to reflect the measured value. A comparison of the summary of all the irrigation on a farm with the amount of water received will reveal the losses that occur. Furthermore, an analysis of the distribution of soil moisture through the soil profile during the growing season will reveal the possibility that water could have drained past the root zone.
2.3 WHAT IS A BEST MANAGEMENT PRACTICE?
An important aid in improving efficiency is the concept of Best Management Practices (BMPs). A BMP is not some distant idealistic vision, but a generally accepted practice that has every chance of being attained. A BMP (also called an Effective Water Management Practice) is a policy, programme, practice, rule and/or regulation, or the use of devices, equipment or facilities which is:
An established and generally accepted practice that results in more efficient use, conservation or management of water.
A practice which makes progress towards insuring sufficient data is available from existing water management projects to indicate:
o that significant efficiency improvements or management related benefits could be achieved.
o that the practice is technically and economically reasonable and not socially or environmentally unacceptable, and
o that the practice is not otherwise unreasonable for most WUAs to carry out.
Two lists of BMPs are being developed nationally:
Primary BMPs, and Secondary BMPs.
Some BMPs are high priority and are generally applicable to all WUAs - "Primary" BMPs. However, since priorities and conditions differ from one area to another, we also need a list of "Secondary" BMPs, all of which may not be applicable to any specific WUA. BMPs, therefore, do not imply standardisation and no BMP should be introduced unless it has been thoroughly evaluated to ensure that it would be beneficial to and sustainable by the WUA.
{Note: WUAs are required to implement all Primary and Secondary BMPs, except those secondary BMPs they can show are not applicable, achievable or desirable in their circumstances.}
2.3.1 Primary BMPs Primary
BMPs have to be addressed by all WUAs:
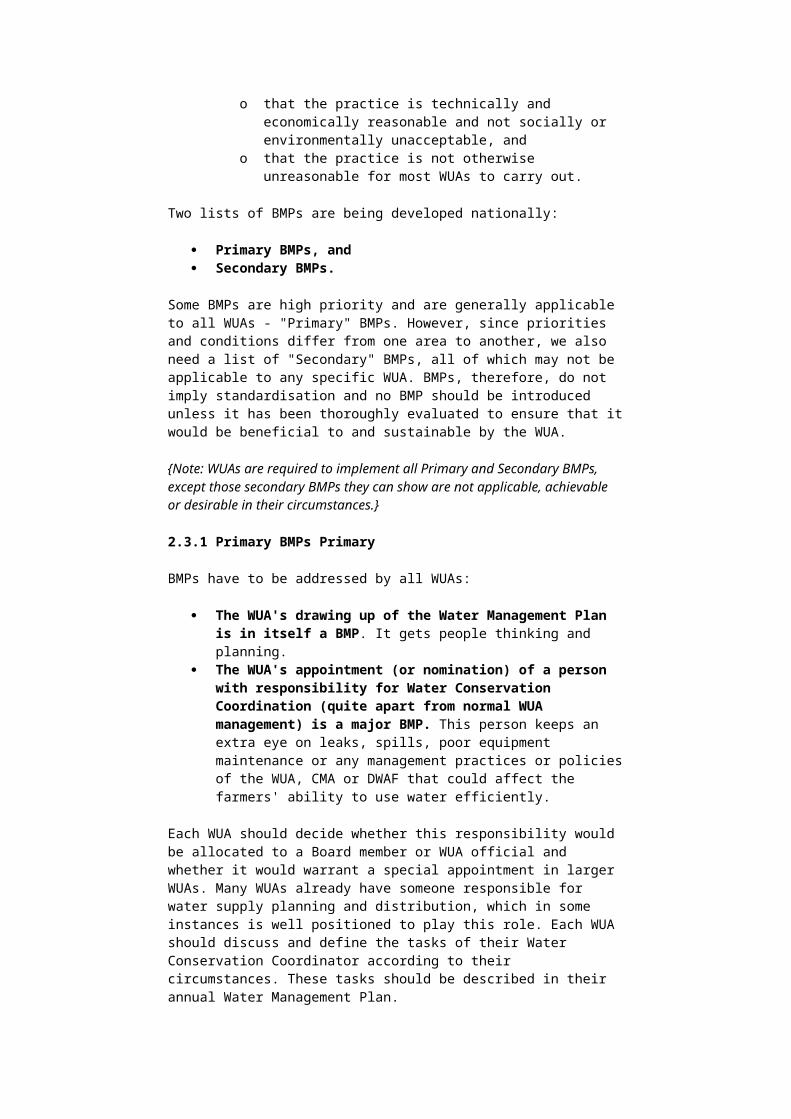
The WUA's drawing up of the Water Management Plan is in itself a BMP. It gets people thinking and planning.
The WUA's appointment (or nomination) of a person with responsibility for Water Conservation Coordination (quite apart from normal WUA management) is a major BMP. This person keeps an extra eye on leaks, spills, poor equipment maintenance or any management practices or policies of the WUA, CMA or DWAF that could affect the farmers' ability to use water efficiently.
Each WUA should decide whether this responsibility would be allocated to a Board member or WUA official and whether it would warrant a special appointment in larger WUAs. Many WUAs already have someone responsible for water supply planning and distribution, which in some instances is well positioned to play this role. Each WUA should discuss and define the tasks of their Water Conservation Coordinator according to their circumstances. These tasks should be described in their annual Water Management Plan.
The Water Conservation Coordinator could also be responsible for interaction with the Water Conservation Coordinators of other WUAs and of the CMA..
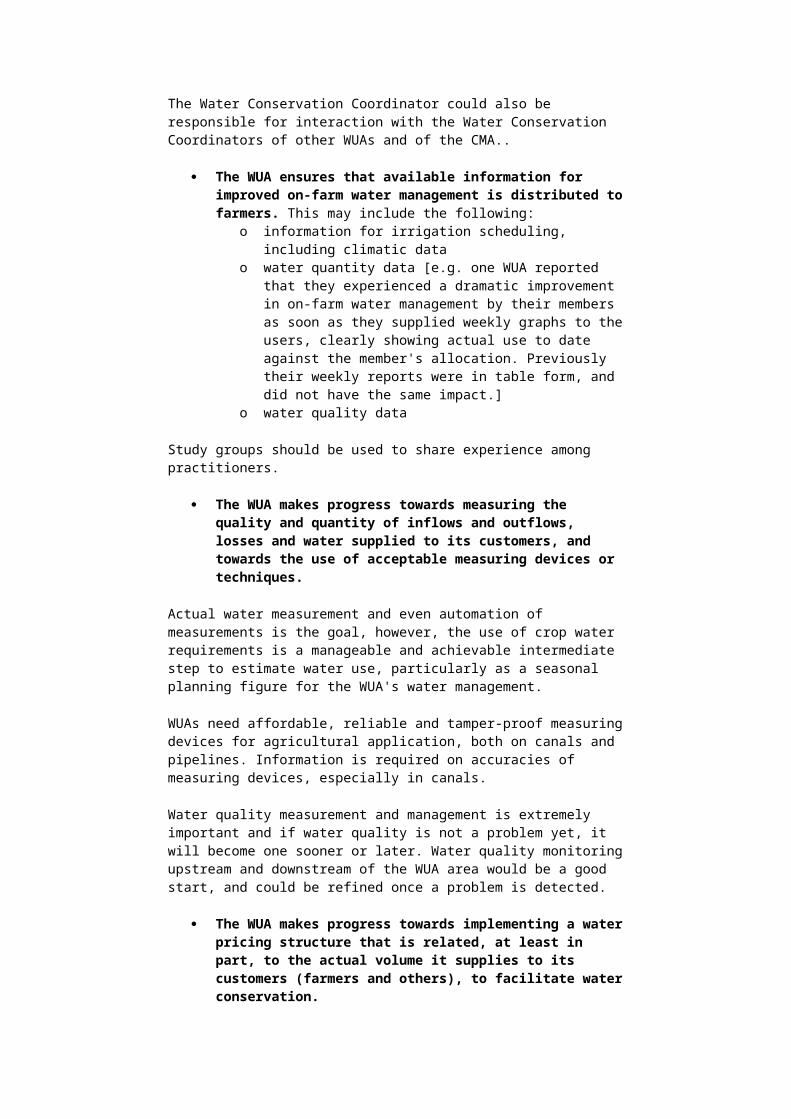
The WUA ensures that available information for improved on-farm water management is distributed to farmers. This may include the following:
o information for irrigation scheduling, including climatic data o water quantity data [e.g. one WUA reported that they
experienced a dramatic improvement in on-farm water management by their members as soon as they supplied weekly graphs to the users, clearly showing actual use to date against the member's allocation. Previously their weekly reports were in table form, and did not have the same impact.]
o water quality data
Study groups should be used to share experience among practitioners.
The WUA makes progress towards measuring the quality and quantity of inflows and outflows, losses and water supplied to its customers, and towards the use of acceptable measuring devices or techniques.
Actual water measurement and even automation of measurements is the goal, however, the use of crop water requirements is a manageable and achievable intermediate step to estimate water use, particularly as a seasonal planning figure for the WUA's water management.
WUAs need affordable, reliable and tamper-proof measuring devices for agricultural application, both on canals and pipelines. Information is required on accuracies of measuring devices, especially in canals.
Water quality measurement and management is extremely important and if water quality is not a problem yet, it will become one sooner or later. Water quality monitoring upstream and downstream of the WUA area would be a good start, and could be refined once a problem is detected.
The WUA makes progress towards implementing a water pricing structure that is related, at least in part, to the actual volume it supplies to its customers (farmers and others), to facilitate water conservation.
Innovative pricing structures could have a great impact on the productive use of water, especially where used in conjunction with voluntary, temporary water transfers between members of the WUA (see Secondary BMP: WUA facilitates voluntary water transfers). WUAs should explain their pricing models clearly in their Water Management Plans, since this could facilitate valuable sharing of experience and cross-fertilisation between WUAs.
Stepped tariff system already exists where a minimum annual charge covers the basic operational expenses of the WUA, even in wet, low irrigation years. Subsequent steps in the tariff generate income for a reserve fund for capital improvements, installation of measuring devices, etc.
The WUA maintains and improves its infrastructure, according to a long-term maintenance plan, supported by a financial plan.
The WUA positively promotes good communication between all concerned in water management. This could include reviews of
DWAF or CMA procedures and policies on water supply and management and their influences on on-farm water use efficiency.
The WUA endeavours to prevent unlawful withdrawals of surface and groundwater.
This is a legal duty of WUAs. This is also a principle function of WUAs as described in the National Water Act, Act No. 36, 1998, Schedule 5, Section 4.
Review of the Current Status and Progress with Primary BMPs
In its Water Management Plan, a WUA should review its BMPs, for example:
Is there someone with specific responsibility for Water Conservation Co-ordination?
What support services are available to farmers and WUA management?
Does the WUA measure the water supplied to its customers? Are the WUA's accounts to its customers based on actual water use? Is there dialogue between DWAF, the CMA and the WUA -- and what
makes it work? What is planned for the future?
2.3.2 Secondary BMPs
All WUAs must address Secondary BMPs, unless a WUA can show that a specific Secondary BMP is not applicable, affordable or desirable to its circumstances.
The WUA facilitates the availability of support services to enable farmers to use water more efficiently on-farm and for other people involved operationally (e.g. irrigation scheduling services and access to mobile labs. for farmers to have their on-farm equipment checked, or to have full on-farm water audits done). This does not mean that the WUA has to supply all these services itself, but that it should facilitate access to these services so that they are available to the WUA and its irrigation farmers. WUA may even consider the idea of including a small charge on all its members to subsidise scheduling services in its area.
Coordinate the evaluation of energy and water efficiency of pumps and distribution and irrigation systems belonging to WUAs or private irrigators. WUAs or their clients may unknowingly be incurring excessive energy bills and reduced pumping efficiencies as a result of worn pump impellers, for example. A simple test can detect this and the cost of repairs is quickly made up from savings in the diesel or electricity bill.
The suitability of specific irrigation methods and crops to an area. What do people regard as being BMPs that could be promoted? [e.g. movable overhead sprinkler systems are no longer used on table grape vineyards in Western Cape].
Reduction of losses by lining canals, balancing dams etc Better management procedures for water bailiffs and other
management staff. Training of WUA personnel. The WUA should train its personnel in
water distribution and management. A Water Bailiff's course is already available from DWAF, and WUA's personnel can participate in these courses if they cover their own travel expenses.
Facilitate the financing of capital improvements for on-farm irrigation systems. This BMP is applicable mainly for the support of resource-poor small farmers. In the case of the bigger WUAs farmers
should approach financial institutions directly and it might be inappropriate for WUAs to get involved in such a sensitive issue.
Facilitate voluntary water transfers This a powerful tool to maximise productive use of the annual allocations to the WUA. The role of the WUA to ensure that this remains a regulated process and within the capacity of the WUA's water distribution system is very important.
Eradication of invasive alien plants Practice of adequate soil conservation and drainage measures
Evaluating BMPs - Net Benefit Analysis
Each Secondary BMP should be evaluated in terms of its impact on the environment and third parties and any indirect effect it may have on the economic viability of the WUA, individual farmers or others.
Who takes responsibility for the facilitation or implementation of BMPs is not yet clear in all instances. It is one of the objectives of the Pilot Implementation Phase of this programme to clarify these issues.
Top
3. CAPACITY BUILDING AND TRAINING FOR WATER CONSERVATION & DEMAND MANAGEMENT IN AGRICULTURE
The focus of the Water Conservation and Demand Management Strategy is to establish an approach and a system in which there is a balance between centralised (top down) and decentralised (bottom up) water delivery management. For this bold "self-regulation" approach to succeed will require empowerment of all role-players in irrigation.
Empowerment, in turn, implies capacity building and training. Therefore an essential element of the strategy will have to be a systematic and long-term initiative of enabling irrigators and the various levels of regulatory authorities to improve water use efficiency.
The main levels of intervention should be:
DWAF management and staff Catchment Management Agency (CMA) management and staff Water User Association (WUA) management and staff Farmer (Irrigator) and on-farm water managers Technician and Labourers
At all the workshops the emphasis was placed on the WUA as the key area for capacity building and training.
Furthermore new WUAs - particularly those involving resource-poor farmers - should receive special attention and support with respect to
Exposure to alternative types of irrigation Record keeping and financial management skills Making appropriate measuring devices available (with costs possibly
subsidised) Guidance in drawing up Water Management Plans and related best
management practices (including repair and maintenance of infrastructure and equipment)
Training in understanding the National Water Act
Sharing of experience and knowledge with established, commercial WUAs
Introduction of computerised water management systems such as the Water Administrative System (WAS) as soon as possible
Establishment of multi-purpose Information Centres in communities which could be used by WUA for information transfer and communication
Training should preferably be conducted in the vernacular and where possible training material should be available in the language of choice.
On the established schemes the above capacity building elements are equally important with greater emphasis on water audits and best management practices. Participants stressed the need to keep the guidelines for the Water Management Plans as simple as possible in the early years, to minimise initial training requirements.
Training and motivation of government officials involved at "grass roots" will be an essential element of the overall strategy.
The Steering Committee for this study recommended that the training programme development and the preparation of appropriate training manuals should commence on the completion of this report. That process has begun and will be completed by the end of August 2000. These capacity building tools will then be tested during the pilot project phase of this programme.
Other interventions in the implementation of the strategy could include the setting up of local, national and occasional Discussion Forums that will allow free exchange of ideas, experience and knowledge in the subject of irrigation water conservation. It was clear from the workshops that there is a wealth of experience and practical knowledge within the sector, which could be shared and spread through discussion between WUAs.
A strategy to formalise and fund these Discussion Forums will be addressed during the Pilot Phase.
REFERENCES
1. Basson MS, Van Niekerk PH and Van Rooyen JA. (1997). Overview of water resources availability and utilisation in South Africa. Department of Water Affairs and Forestry, Pretoria.
2. Benade N, Annandale J and Van Zijl H. (1997). The Development of a computerized Management system for Irrigation Schemes. Water Reaserch Project Report No. 513/1/97. Water Research Commission, Pretoria, South Africa.
3. Benade N. (1993). The Development of a computerized water distribution system for the optimisation of irrigation canal system management. Report No. 367/1/93. Water Research Commission, Pretoria, South Africa.
4. Benade N, Engelbrecht RJ and Annandale GW. (1990). The Optimisation of the Management of Irrigation Canal Systems. Report No 176/1/90. Water Research Commission, Pretoria South Africa.
5. California Urban Water Conservation Council. (1998). Memorandum of Understanding Regarding Urban Water Conservation.
6. Chapman C. (1997). Water Management: Crucial for any Water Supply Authority A joint project between Rand Water, Odi Retail and
the SABS: Together we can make water work. IMIESA, Vol. 22, No. 9, p 3,5 - 7,9.
7. Cori KA. Auditing a Water Distribution System Points to Improvements. Water Engineering and Management, Vol 132, No. 11, p. 25-27.
8. Crosby CP. (2000). Penman-Monteith reference evapotranspiration values and suitable crop coefficients for the National Water Balance Model. Unpublished personal communication.
9. Crosby CT and Crosby CP. (1999). SAPWAT: A computer programme for establishing irrigation requirements and scheduling strategies in South Africa. A Water Research Commission Project, Pretoria
10. David F R. (1999). Strategic Management Concepts & Cases. Prentice Hall International, Inc. Upper Saddle River, New Jersey
11. Department of Water Affairs and Forestry. -. Personal communications with DWAF programming department.
12. FAO. (1998). Crop evaporation. Guidelines for computing crop water requirements. FAO Irrigation and Drainage Paper No. 56. Food and Agriculture Organisation of the United Nations.
13. FAO. (1992). CROPWAT. A computer programme for irrigation planning and management. FAO Irrigation and Drainage Paper No. 46. Food and Agriculture Organisation of the United Nations
14. Government Gazette No. 20615. (12 November 1999) 15. Green GC (Ed). (1985). Estimated irrigation requirements of crops.
Department of Agriculture and Water Supply, Pretoria. 16. Internet: Software "bank". http://www.netlib.org/ 17. Jensen, Burman and Allen. (1989). Evapotranspiration and
irrigation water requirements. ASCE Manuals and Reports on Engineering Practice No. 70.
18. Jensen ME. (1998). Coefficients for vegetative evapotranspiration and open water evaporation for the Lower Colorado River Accounting System. USDA Bureau of Reclamation, Nevada, USA.
19. Keller A, Keller J and Seckler D. (1996). Integrated Water Resource Systems: Theory and Policy Implications. Research Project 3. Colombo, Sri Lanka: International Irrigation Management Institute.
20. Laudon KC and Laudon J P. (1998). Management Information Systems New approaches to Organization & Technology. Prentice Hall International, Inc. Upper Saddle River, New Jersey
21. Loxton Venn and Associates. (1997). Orange River Re-planning Project: Re-planning Study. Pre-feasibility Phase. Evaluation of irrigation water use. Volume 1: Present water demand. Department of Water Affairs and Forestry Report No. P D000/00/4897.
22. Loxton Venn and Associates. (1999). Vaal River Irrigation Study. Directorate Water Resources Planning, Department of Water Affairs and Forestry, Pretoria.
23. Mckenzie R. (1999). Development of a standardized approach to evaluate burst and background losses in water distribution systems in South Africa. South African Water Research Commission, Pretoria.
24. Mckenzie RS and Bhagwan JN. (1999). Managing unaccounted for water in potable distribution systems: Recent software Developments through the Water Research Commission. S.A. Water Research Commission, P.O. Box 624, Pretoria, 0001.
25. Merry DJ. (1996). Institutional Design Principles for Accountability in large Irrigation Systems. Research Report 8. Colombo, Sri Lanka: International Irrigation Management Institute.
26. Midgley DC, Pitman WV and Middleton. (1994). Surface Water Resources of South Africa 1990. Water Research Commission Report No. 298/1.2/94. Water Research Commission, Pretoria.
27. Molden D. (1997) Accounting for water Use and Productivity. SWIM Paper 1. Colombo, Sri Lanka: International Irrigation Management Institute.
28. Owen-Joyce SJ and Raymond LH. (1996). An accounting system for water and consumptive use along the Colorado River, Hoover Dam to Mexico. Water Supply Paper No. 2407.
29. Reid PCM, Davidson DCR and Kotze T. (1986). Verliese in Besproeingskanale. Water SA, April 1986
30. Small H and Stimie C. (1999). An investigation into water use at the Arabie-Olifants Scheme. Colombo, Sri Lanka: IWMI. Iii, 41p (South Africa working paper no 4)
31. United States Department of Agriculture. (1970). Irrigation water requirement. USDA-SCS Technical Release No. 21.
32. United States Department of the Interior. (1998). Lower Colorado River Accounting System. Demonstration of Technology. Calander Year 1996. Bureau of Reclamation, Lower Colorado Regional Office, Boulder City, Nevada.
33. Van Lier HN, Pereira LS and Steiner FR (Ed). - CIGR Handbook of Agricultural Engineering. Volume 1: Land and Water Engineering. American Society of Agricultural Engineers.
34. National Water Act No. 36 (1998). Government Gazette No. 19182 of August 1998.
35. Heyns P J. (1997). Irrigation Design Manual. Chapter 11. Institute of Agricultural Engineering, an Institute of the Agricultural Research Council of South Africa.
Top
Part 2
COMPONENTS OF WATER MANAGEMENT PLANS AND THE TOOLS FOR THEIR PREPARATION AND IMPLEMENTATION
INTRODUCTION
For the effective development of a Water Management Plan the following key "tools" and practices are essential. They are:
Benchmarks for Agricultural Water Use Disposal Reports, Water Accounting and Water Audits Best Management Practices
Part 2 of this report provide draft pro-format for the application of those tools and practices in the development of Water Management Plans by Irrigation Water Suppliers like Water User Associations (WUAs).
STEP 1. BASIC INFORMATION ON THE WUA
1.1 HISTORY
Water User Association Name:.......................................................................................
Date WUA formed: Original Size: ...................................................................................
1.2 OPERATING RULES AND REGULATIONS
Describe the WUA's water supply policy ........................................................................
Provide the official and actual lead times necessary for water orders and shut-off ...............
Describe the WUA's policies on return-flows and drainage................................................
Describe the WUA's policies on water transfers by the WUA and its customers ................
1.3 WATER SHORTAGE ALLOCATION POLICIES
Describe (or attach) the WUA's water shortage policies that include how reduced water supplies are allocated and how provision is made for priority needs during times of shortage.
...........................................................................................................................
........
Describe (or attach) WUA policies that address wasteful use of water. Include information on enforcement methods. .............................................................................................
STEP 2. BENCHMARKS FOR AGRICULTURAL WATER USE
Benchmarks are used to predict and to monitor actual irrigation water use
Typical benchmarks applicable to irrigated agriculture are:
Scheme/canal design capacity vs. allocation Irrigation water requirement benchmarks per crop per homogenous
area Canal management losses Irrigation efficiencies of different irrigation systems Productivity of water use, measured as crop returns per unit volume
of water used. These can be expressed as R/m3 or kg/m3 Assured yield changes over time
As a starting point, WUAs will be required to focus on irrigation water requirement benchmarks per crop in their first Water Management Plan. Irrigation water requirement benchmarks per crop are used as follows:
By the WUA to calculate and plan before the season for potential water supply to users throughout the season. To monitor members' actual water use against the accepted norm or benchmark.
By farmers, to plan on-farm water management and crop production and to monitor their own actual water use efficiency against the generally accepted benchmark for the season
The Pricing Strategy of the Department of Water Affairs and Forestry requires that the SAPWAT computer program be used as the accepted procedure to calculate crop water requirements (ETcrop) and crop irrigation requirements. In the interests of uniformity of approach, SAPWAT should be used to calculate crop irrigation benchmarks when WUAs develop their Water Management Plans. Assistance in the development of crop irrigation
benchmarks with SAPWAT will be available through the DWAF regional offices. This service may in future also be provided through the Provincial Departments of Agriculture for smallholder schemes.
For details of the SAPWAT Programme and its regular updating and refining (including crop coefficients and efficiency factors) see the website www.wrc.org.za/sapwat/default.htm.
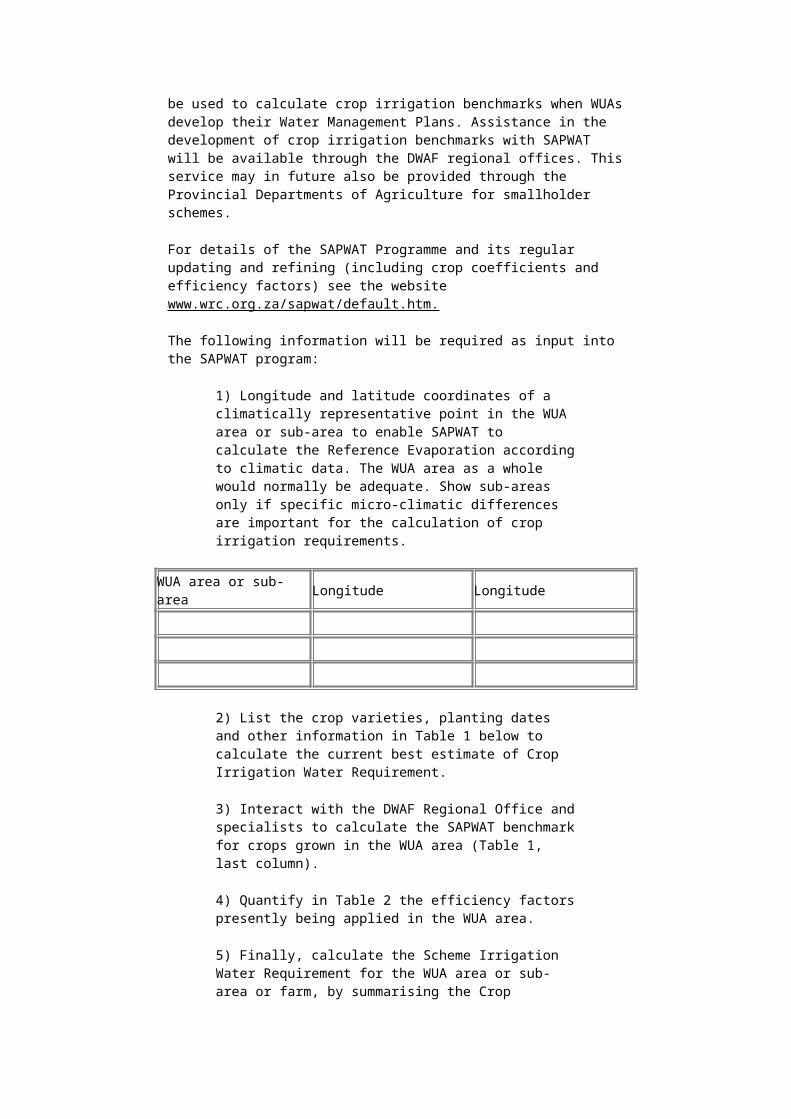
The following information will be required as input into the SAPWAT program:
1) Longitude and latitude coordinates of a climatically representative point in the WUA area or sub-area to enable SAPWAT to calculate the Reference Evaporation according to climatic data. The WUA area as a whole would normally be adequate. Show sub-areas only if specific micro-climatic differences are important for the calculation of crop irrigation requirements.
WUA area or sub-area Longitude Longitude
2) List the crop varieties, planting dates and other information in Table 1 below to calculate the current best estimate of Crop Irrigation Water Requirement.
3) Interact with the DWAF Regional Office and specialists to calculate the SAPWAT benchmark for crops grown in the WUA area (Table 1, last column).
4) Quantify in Table 2 the efficiency factors presently being applied in the WUA area.
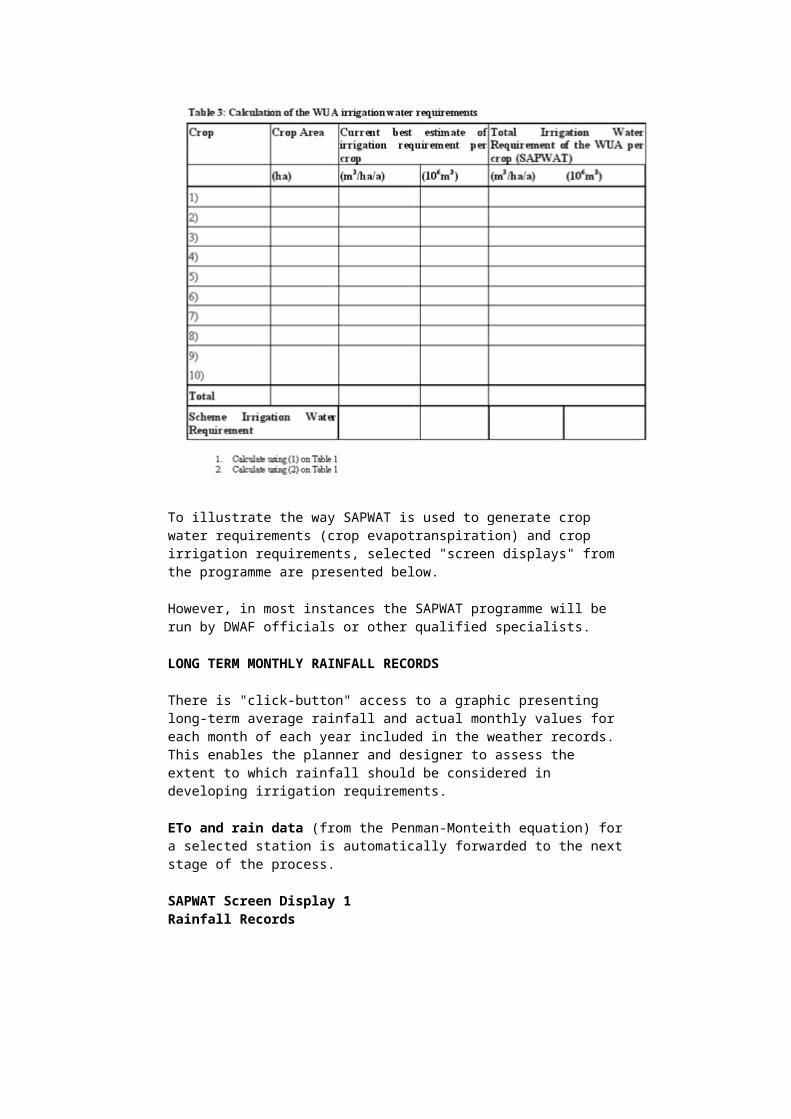
5) Finally, calculate the Scheme Irrigation Water Requirement for the WUA area or sub-area or farm, by summarising the Crop Irrigation Water Requirements for all the crops and the sub-areas of the WUA (Table 3).
To illustrate the way SAPWAT is used to generate crop water requirements (crop evapotranspiration) and crop irrigation requirements, selected "screen displays" from the programme are presented below.
However, in most instances the SAPWAT programme will be run by DWAF officials or other qualified specialists.
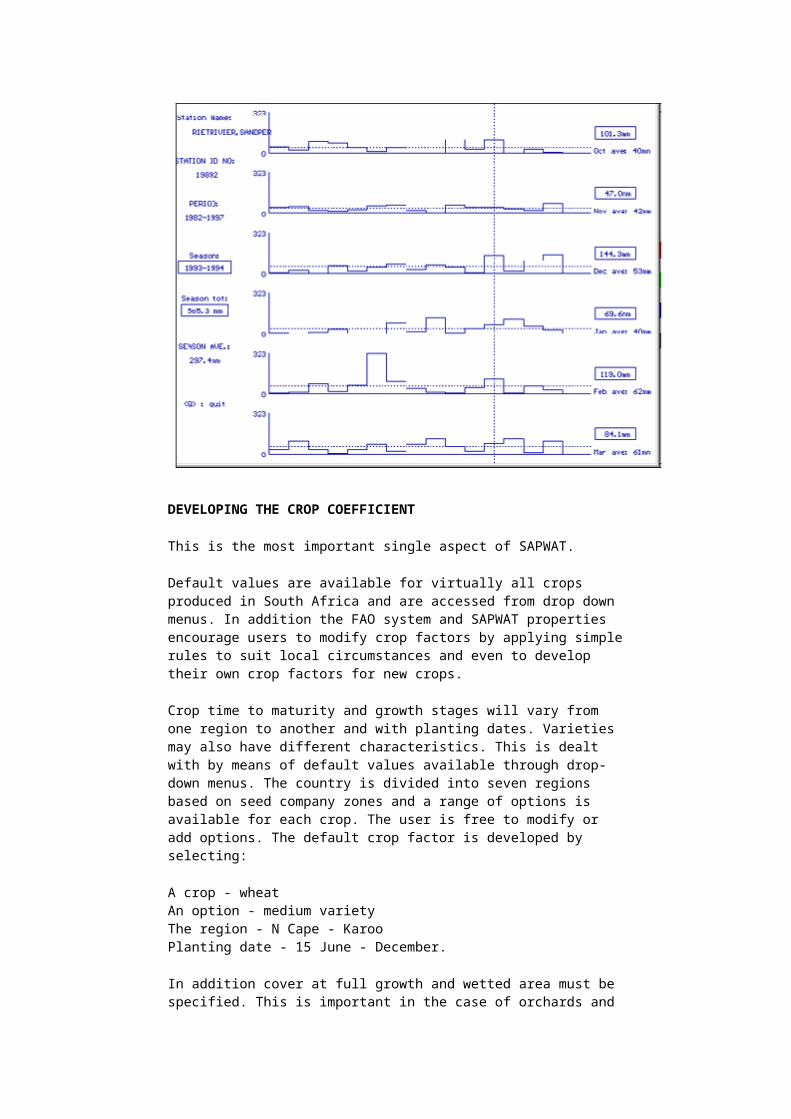
LONG TERM MONTHLY RAINFALL RECORDS
There is "click-button" access to a graphic presenting long-term average rainfall and actual monthly values for each month of each year included in the weather records. This enables the planner and designer to assess the extent to which rainfall should be considered in developing irrigation requirements.
ETo and rain data (from the Penman-Monteith equation) for a selected station is automatically forwarded to the next stage of the process.
SAPWAT Screen Display 1Rainfall Records
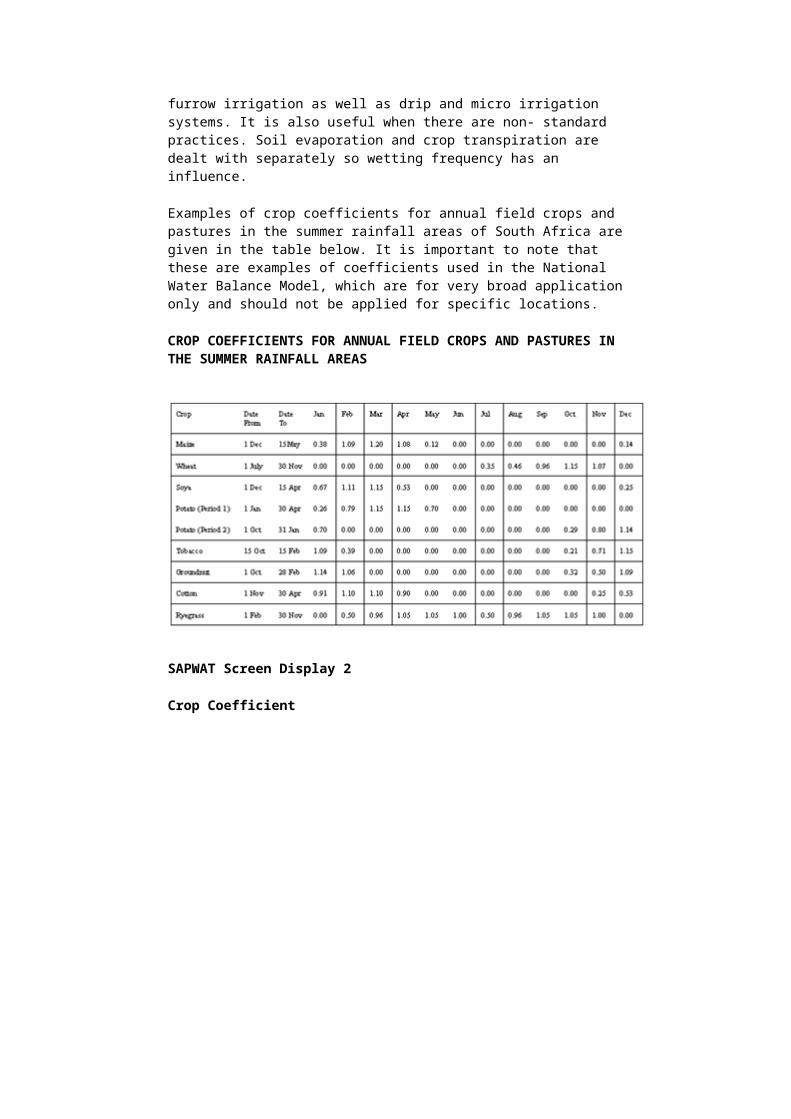
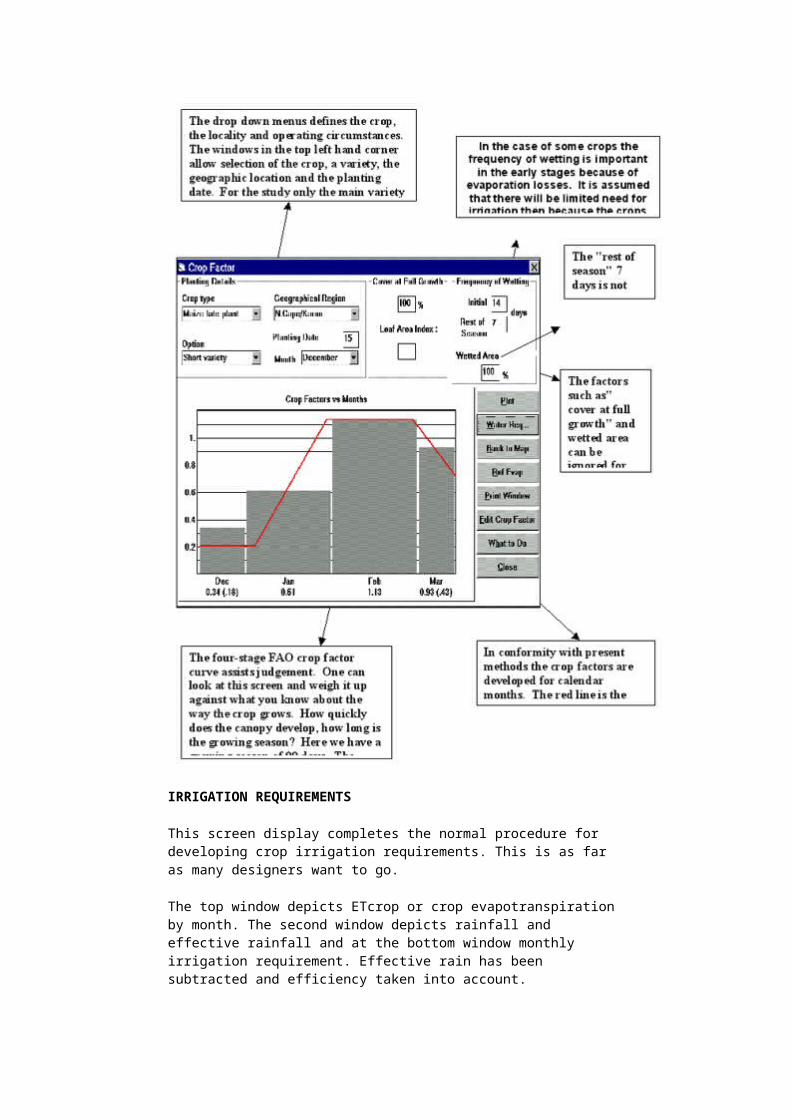
DEVELOPING THE CROP COEFFICIENT
This is the most important single aspect of SAPWAT.
Default values are available for virtually all crops produced in South Africa and are accessed from drop down menus. In addition the FAO system and SAPWAT properties encourage users to modify crop factors by applying simple rules to suit local circumstances and even to develop their own crop factors for new crops.
Crop time to maturity and growth stages will vary from one region to another and with planting dates. Varieties may also have different characteristics. This is dealt with by means of default values available through drop-down menus. The country is divided into seven regions based on seed company zones and a range of options is available for each crop. The user is free to modify or add options. The default crop factor is developed by selecting:
A crop - wheat An option - medium varietyThe region - N Cape - Karoo Planting date - 15 June - December.
In addition cover at full growth and wetted area must be specified. This is important in the case of orchards and furrow irrigation as well as drip and micro irrigation systems. It is also useful when there are non- standard practices. Soil evaporation and crop transpiration are dealt with separately so wetting frequency has an influence.
Examples of crop coefficients for annual field crops and pastures in the summer rainfall areas of South Africa are given in the table below. It is important to note that these are examples of coefficients used in the National
Water Balance Model, which are for very broad application only and should not be applied for specific locations.
CROP COEFFICIENTS FOR ANNUAL FIELD CROPS AND PASTURES IN THE SUMMER RAINFALL AREAS
SAPWAT Screen Display 2
Crop Coefficient
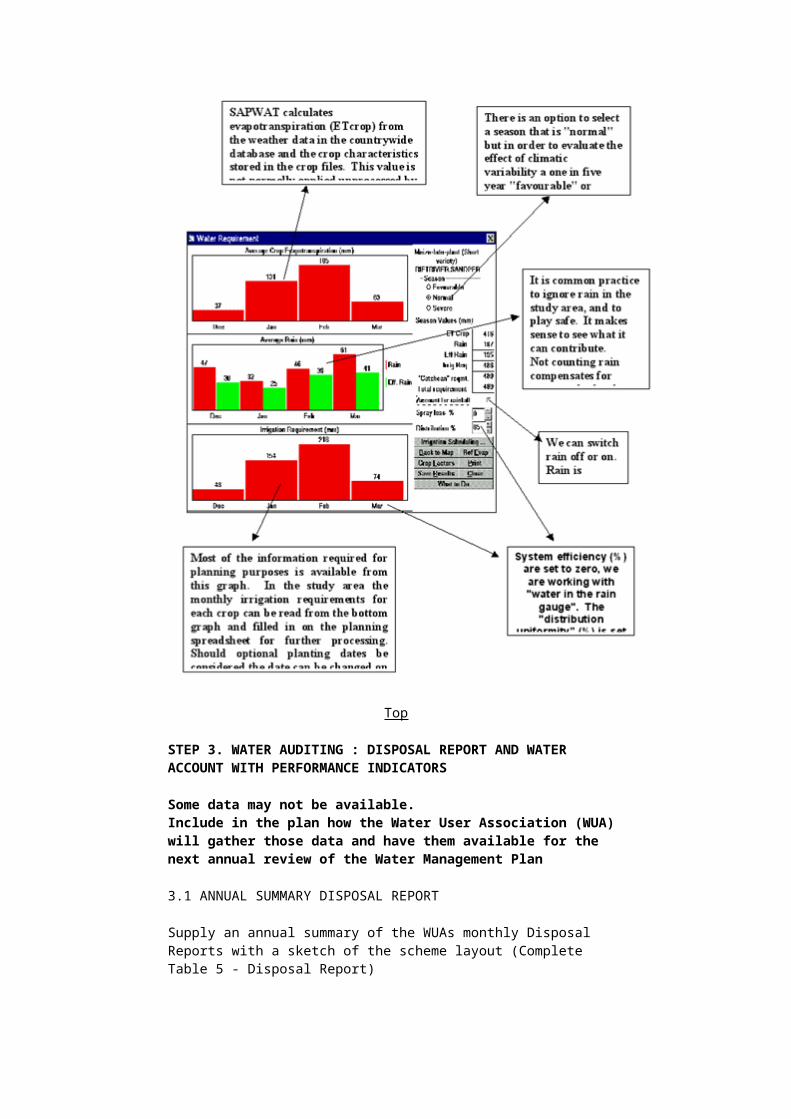
IRRIGATION REQUIREMENTS
This screen display completes the normal procedure for developing crop irrigation requirements. This is as far as many designers want to go.
The top window depicts ETcrop or crop evapotranspiration by month. The second window depicts rainfall and effective rainfall and at the bottom window monthly irrigation requirement. Effective rain has been subtracted and efficiency taken into account.
Provision is made for favourable, normal and severe seasons on a one in five-year basis. Both ETo and rain are taken into account. The figures are on the right-hand side of the screen reflect the position for the season as a whole and may differ from the total obtained by adding the individual months.
It is unlikely that each month in a season will be SEVERE or NORMAL or FAVOURABLE.
There are three additional buttons. Efficiency can be included or left out and is divided into spray losses that include run off and any losses experienced on farm before reaching field edge. These would include losses due to pipe leakage and supply furrow seepage and distribution that includes deep percolation and the lack of uniformity in system distribution or field variation.
The output is transferred automatically to the next screen when the scheduling button is activated. This section deals with planning and evaluating scheduling and management.
SAPWAT Screen Display 3
Irrigation Requirement
Top
STEP 3. WATER AUDITING : DISPOSAL REPORT AND WATER ACCOUNT WITH PERFORMANCE INDICATORS
Some data may not be available. Include in the plan how the Water User Association (WUA) will gather those data and have them available for the next annual review of the Water Management Plan
3.1 ANNUAL SUMMARY DISPOSAL REPORT
Supply an annual summary of the WUAs monthly Disposal Reports with a sketch of the scheme layout (Complete Table 5 - Disposal Report)
Describe changes made following comments by DWAF and CMA regarding the Monthly Disposal Reports.................................................................................
List comments by DWAF and the CMA that has not been acted on and explain the reasons.............................................................................................................
3.2 LOCATION AND FACILITIES
Source of irrigation waterState the source of irrigation water
StorageDescribe the WUA's storage facilities (regulating reservoirs, etc.), including capacity and location ..........................................................................................................
Conveyance System State the length of the different conveyance systems that are being used by the WUA
Unlined canal (km) Lined canal (km) Pipes (km) Other (km)
Spill Recovery SystemDescribe the WUA's spill recovery system..................................................................
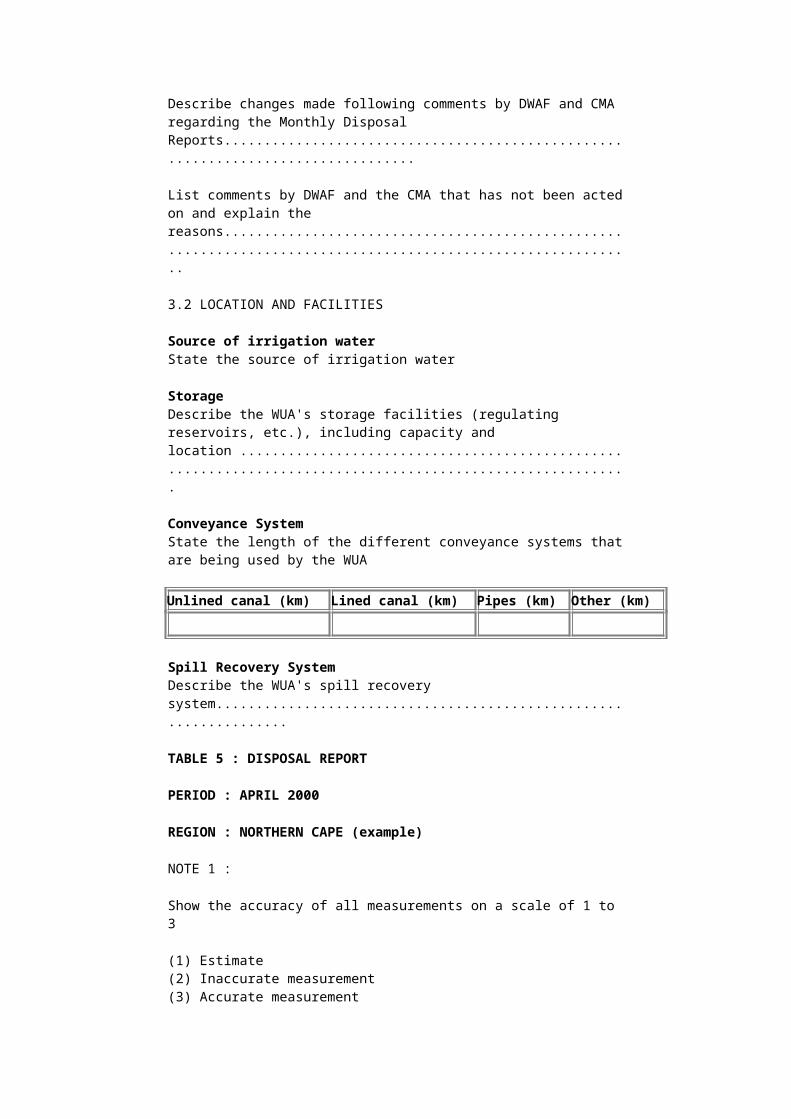
TABLE 5 : DISPOSAL REPORT
PERIOD : APRIL 2000
REGION : NORTHERN CAPE (example)
NOTE 1 :
Show the accuracy of all measurements on a scale of 1 to 3
(1) Estimate (2) Inaccurate measurement(3) Accurate measurement
NOTE 2 :
Operational loss = Water delivered - requested
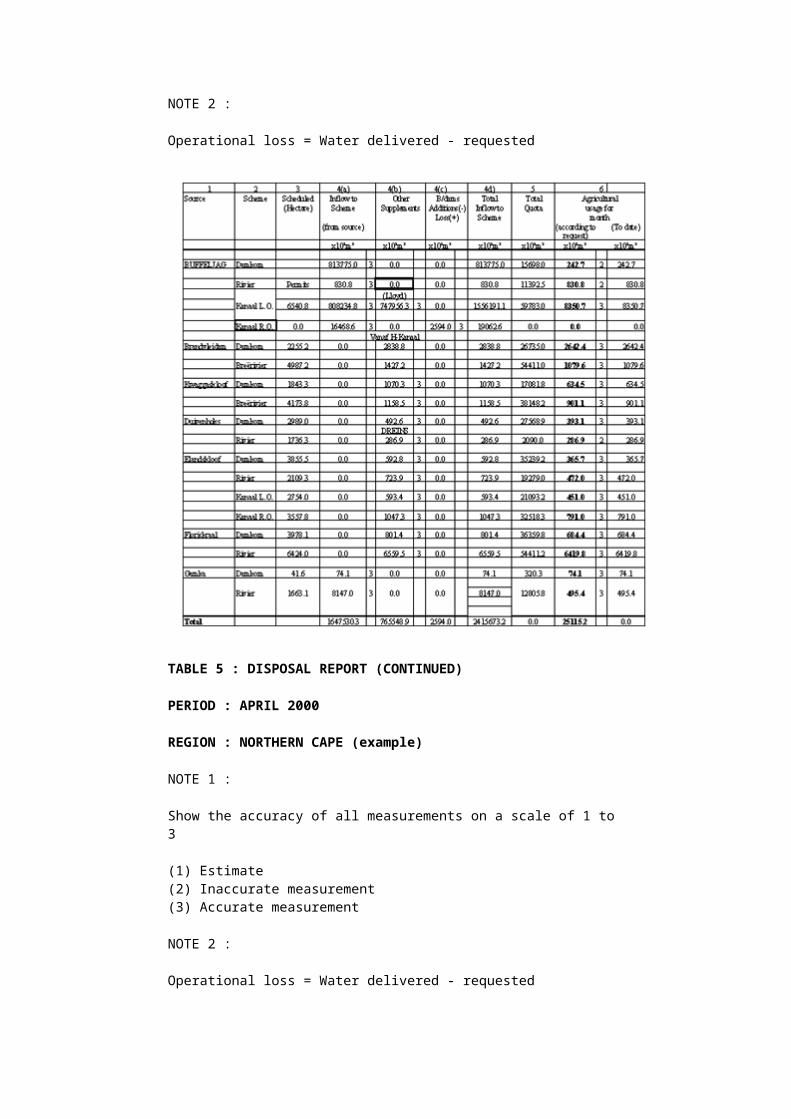
TABLE 5 : DISPOSAL REPORT (CONTINUED)
PERIOD : APRIL 2000
REGION : NORTHERN CAPE (example)
NOTE 1 :
Show the accuracy of all measurements on a scale of 1 to 3
(1) Estimate (2) Inaccurate measurement(3) Accurate measurement
NOTE 2 :
Operational loss = Water delivered - requested
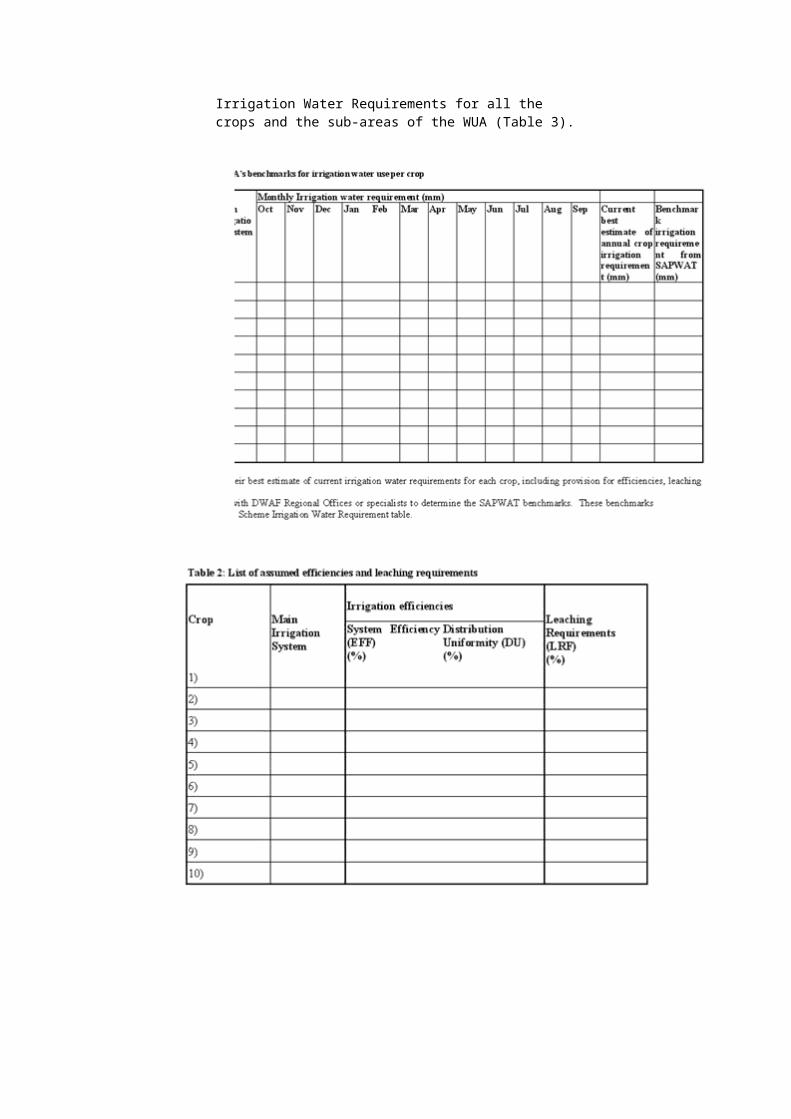
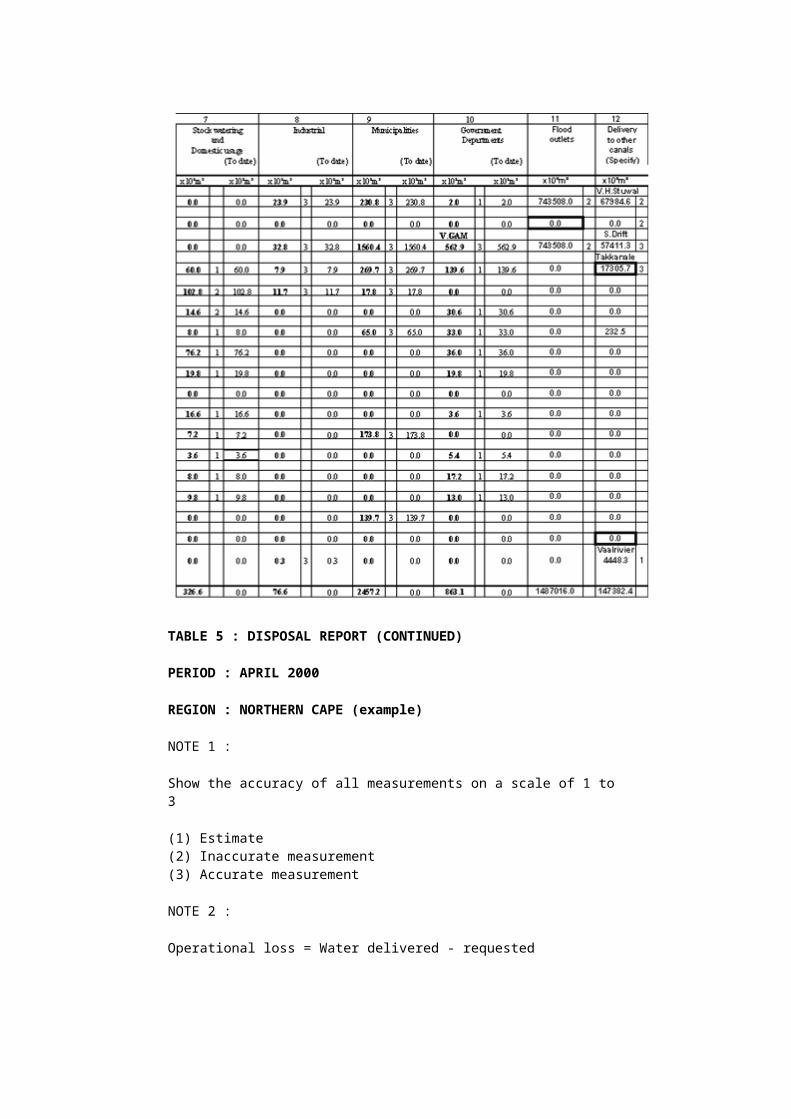
TABLE 5 : DISPOSAL REPORT (CONTINUED)
PERIOD : APRIL 2000
REGION : NORTHERN CAPE (example)
NOTE 1 :
Show the accuracy of all measurements on a scale of 1 to 3
(1) Estimate (2) Inaccurate measurement(3) Accurate measurement
NOTE 2 :
Operational loss = Water delivered - requested
COMMENTS : Graphs removed due to flood at Lloyd and Schmidtsdrift
COMPILED BY ................... RANK...................... DATE ........................CONTROLED BY ............... RANK...................... DATE ........................SCHEME/REGIONAL MANAGER............................... DATE ........................
Delivery System OperationDescribe whether the delivery system provides immediate, scheduled, rotation, or other delivery method ..........................................................................................................
Describe any restrictions on the WUA's water source(s)
Restriction Agency imposing restriction Effect on WUA operations
Proposed changes or additions to WUA facilities and operations for 2000 - 2005
...........................................................................................................................
.......
3.3 WATER MEASUREMENT AND ACCOUNTING PROCEDURES
Total number of users ...................... Total number of measured users .......................Provide the number of each type of measurement device used by the WUA and maintenance schedule
Type Number Accuracy(%) Reading(days) Calibration (months)
Maintenance (months)
TOTAL
Describe the WUA's water-use data accounting procedures, including how records are kept and archived, availability of water use data to customers, and how many years of customer water use records are available....................................................................
3.4 WATER ACCOUNTING
Complete Table 7. Water Accounting Report. Some data may not be available.Include in the plan how the WUA will gather those data and have them available for the next annual review of the Water Management Plan The structure of the water accounting report may be modified to meet the needs of specific WUAs.
3.4.1 Inflow
Diversions and abstractions from surface water sources (pumping and canals from dams and rivers). This information should be carried over from the Annual Summary Disposal Report (Table 5) to Water Accounting Report (Table 7).
Abstractions from Groundwater (pumping from boreholes) . Describe any ground water basin(s) that underlie the WUA area
Name Size (km2) Usable capacity (m3) Safe yield (m3/a)
Provide a map locating WUA operated boreholes. If there is conjunctive use of surface and ground water, describe it......................................................................................
For managed ground water basins, attach a copy of the management plan.
The volume of water abstracted from the subsurface resources should be measured and recorded regularly. Using the recorded abstractions, complete the second column of Table 6: Other Water Resources. The annual total volume of water abstracted should be entered into Table 7 : Water Accounting Report.
Abstractions from surface drainage outside the WUA area including mountain streams Describe the surface drainage sources in the table below
Source Method of abstraction Amount (m3/a)
The volume of water abstracted from the surface drainage should be measured and recorded regularly if possible, but should at least be estimated. Using the recorded abstractions, complete the second column of Table 6. Other Water Resources. The annual total volume of water abstracted should be entered into Table 7. Water accounting Report.
Abstractions from farm dams. The volume of water abstracted from the surface drainage should be measured and recorded regularly if possible, but should at least be estimated. Using the recorded abstractions, complete the second column of Table 6 : Other Water Resources. The annual total volume of water abstracted should be entered into Table 7: Water accounting Report. Reductions of water volumes of dams due to evaporation, seepage and leakage should be added to the non-beneficial losses in the Water Accounting Report.
3.4.2 Storage change
Storage change in reservoirs and balancing dams inside the domain. This information should be carried over from the Annual Summary Disposal Report (Table 5) to the Water Accounting Report (Table 7).
3.4.3 Consumptive use
Process consumption (water used for production or other human purposes) This information should be carried over from the Annual Summary Disposal Report (Table 5) to the Water Accounting Report (Table 7).
Non Process Consumption (water that is used , but does not produce outputs for human consumption). This is divided into two groups namely Beneficial and non-beneficial consumption;
o Beneficial Ecological uses (e.g. indigenous riverine vegetation)
WUA's should calculate the annual volume of water consumed and enter it into Table 7. Water Accounting Report. Calculation must be shown.
o Non-beneficial Alien vegetation WUA's should calculate the annual
volume of water consumed and enter it into Table 7. Water Accounting Report. Calculation must be shown.
Evaporation This information should be carried over from the Annual Summary Disposal Report (Table 5) to the Water Accounting Report (Table 7).
Seepage not usable downstream This information should be carried over from the Annual Summary Disposal Report (Table 5) to the Water Accounting Report (Table 7).
Leakage This information should be carried over from the Annual Summary Disposal Report (Table 5) to the Water Accounting Report (Table 7).
Operational spills not usable downstream (estimate fraction of operational spills) The operational spills that are given in the Disposal Report should be divided into two portions. The portion that cannot be used by downstream users should be entered under this heading in table 7. The rest, that is, the portion that can be used by downstream users, should be regarded as outflow as described below.
3.4.4. Outflow
Committed outflow o Committed to downstream use. This information should be
carried over from the Annual Summary Disposal Report (Table 5) to the Water Accounting Report (Table 7).
o Operational spills that are used downstream (estimate fraction of operational spills). The operational spills that are given in the Disposal Reports less the portion that are not regarded as beneficial to downstream users. This annual volume of water should be entered into table 7.
Table 6 : Other Sources
Period: Mar-92 Water User Association
Month Volume of Water abstracted
Groundwater (106m3)
Surface drainage from outside the WUA area (106m3)
Farm dams (106m3)
April May June July August September October November December January February March Total
Note : See # 3.4.1 for the completion of this table
3.4.5 Source Water Quality Monitoring Practices
Describe any surface water or ground water quality problems, and how the quality problems limit the use of the water or affect customer use decisions. .....................
Describe any water quality monitoring programmes for surface water
Analyses performed
Concentrations FrequencyRange Average
Describe any water quality monitoring programmes for ground water.
Analyses performed
Concentrations FrequencyRange Average
Identify which agencies conduct the water testing and describe the WUA's role in the
programme..............................................................................................................
3.5 PERFORMANCE INDICATORS
Water accounting performance indicators are presented in the form of fractions, and in terms of productivity of water use.
Depleted fraction (DF) is that part of the inflow that is depleted by both process and non-process uses. Depletion fraction can be defined in terms of net, gross, and available water.
Performance Indicators must be calculated in Table 8.
Table 8: Performance Indicators (example)
PERFORMANCE INDICATORS
Depletion Fraction Net DFnet Consumption/ Net Inflow 0.97Depletion Fraction Gross DFgross Consumption/ Gross Inflow 0.97Depletion Fraction Available DFavailable Consumption/Available Water 1.00
Process Fraction Depleted PFdepleted Process Consumption/Total Consumption 0.19
Process Fraction Available PFavailable Process Consumption/Available Water 0.19
3.6 WATER AUDITING
Catchments Management Agencies or DWAF will perform regular water audits. The purpose of the audits is not only to establish whether the Disposal Report and the Water Accounting Report are correct, but also to provide technical assistance to WUAs for problem analysis, especially with water measurement. DWAF is already providing this service to 109 Government Water Schemes.
Top
STEP 4. BEST MANAGEMENT PRACTICES FOR WATER USER ASSOCIATIONS
The forms for Step 4 may not provide enough fill-in space for all of the necessary information if filled out by hand. Use additional sheets as necessary.
If the form is filled out on computer, you can type all the information directly into the form.
If the WUA wants to develop a Water Management Plan using its own format, only the essential "starting information" needs to be filled out in the spaces on this form.
4.1 PRIMARY BEST MANAGEMENT PRACTICES FOR WATER USER ASSOCIATIONS
4.1.1. The WUA nominates the following person responsible for Water Conservation Coordination in the WUA, including facilitating development and implementation of the water management plan:
Full name ................................... Title .....................................
Address ..................................................................................
Telephone............... Fax ................. E-mail ............................
Is this person:
A member of the WUA? Y/N
A member of the WUA Management Committee? Y/N
Existing staff? Y/N
A new appointment? Y/N
Each WUA should decide on the tasks that the water conservation co-ordinator is expected to undertake under the prevailing circumstances.
The functions of the Water Conservation Coordinator are given in Table 4.1.1.
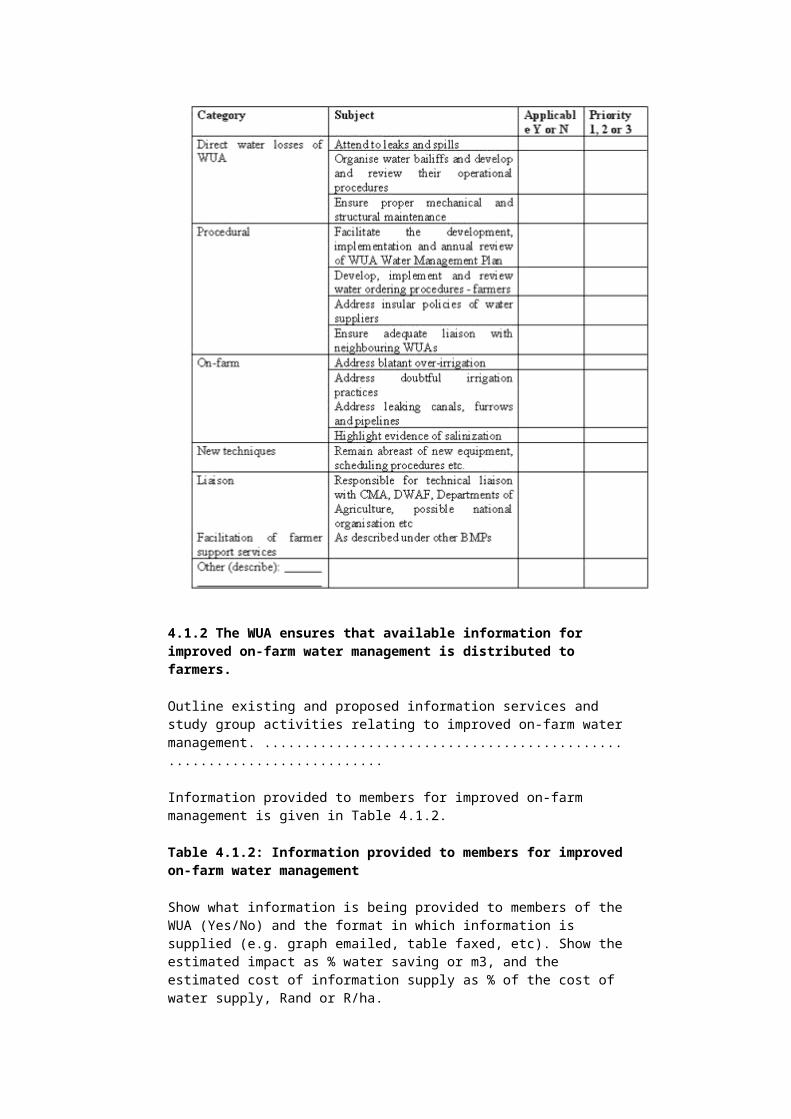
Table 4.1.1 : Functions of the Water Conservation Coordinator
Show which tasks are applicable and indicate their priority (1=highest). Add other tasks as applicable.
4.1.2 The WUA ensures that available information for improved on-farm water management is distributed to farmers.
Outline existing and proposed information services and study group activities relating to improved on-farm water management. ........................................................................
Information provided to members for improved on-farm management is given in Table 4.1.2.
Table 4.1.2: Information provided to members for improved on-farm water management
Show what information is being provided to members of the WUA (Yes/No) and the format in which information is supplied (e.g. graph emailed, table faxed, etc). Show the estimated impact as % water saving or m3, and the estimated cost of information supply as % of the cost of water supply, Rand or R/ha.
Attach one example each of the types of information supplied to members of the WUA.
4.1.3 The development and implementation of irrigation and water management strategies
For example, are farmers provided pre-season with schedules of the estimated weekly crop irrigation requirements, particularly when new varieties or crops are introduced? Similarly are they provided during the season with estimates of the impact of climatic variations on crop water use? Indicate how the information is, or shall be, developed and distributed. .......................................................................................................
4.1.4 Water quantity data throughout the season
This is applicable to the quantity of water used by individual farmers compared to their allocation as well as the water supply situation from the available water sources.
One WUA reported that they experienced a dramatic improvement in on-farm water management by their members as soon as they supplied weekly graphs to users, clearly showing actual use to date against the member's allocation. Previously the weekly reports were in table form, and did not have the same impact.
Indicate how farmer water use is estimated and recorded and the format in which this information is transmitted to the individual farmer. Please attach an example...............
Water quality data throughout the season
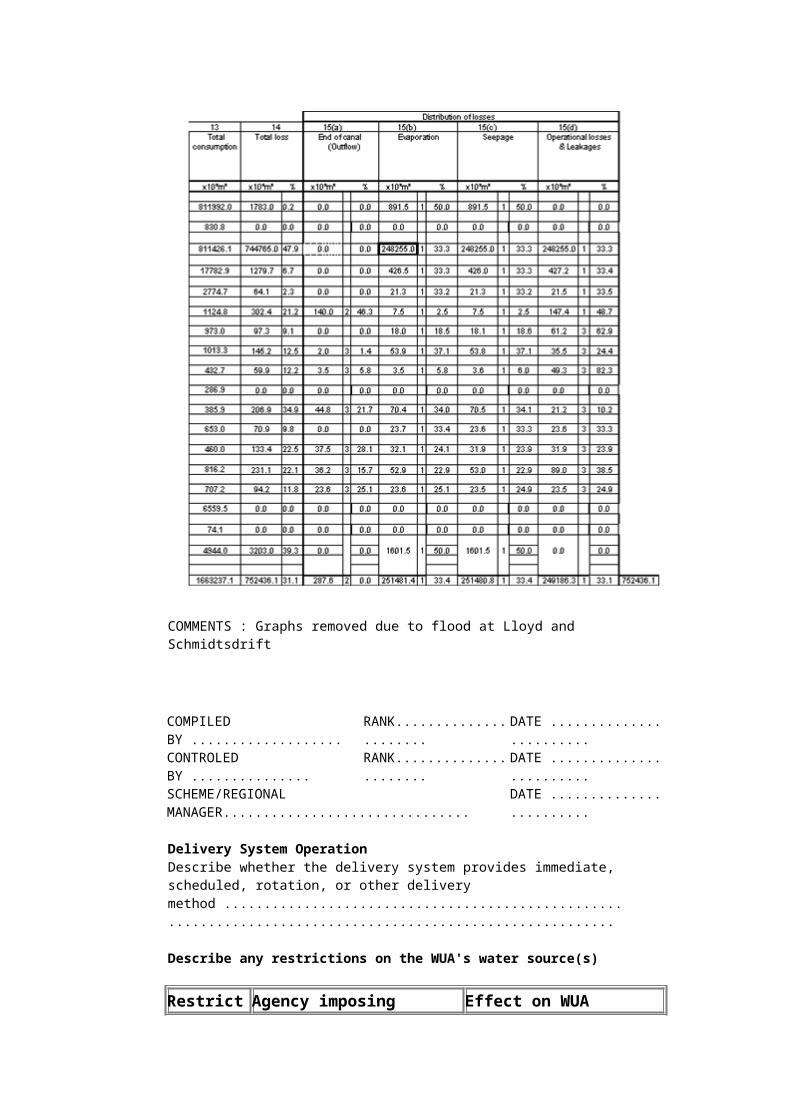
Deterioration in water quality during the season is important information. Is this information being obtained and transmitted to the farmers?.........................................
The WUA makes progress towards measuring the quality and quantity of inflows and outflows, losses and water supplied to its customers, and towards the use of acceptable measuring devices or techniques.
Actual water measurement is the goal but there is still a shortage of affordable reliable and tamper-proof measuring devices both on canals and pipelines. Until appropriate approved equipment becomes available it is necessary to utilise acceptable estimation techniques to promote more effective management.
The circumstances of the WUAs vary greatly and must be taken into account. In order to achieve satisfactory balances it is important that the supply to the WUA from source be accurately measured, that the losses in the distribution system be estimated within realistic limits, that the management of the distribution system is such that spills can be quantified, that the losses on-farm are minimised and that the efficiency of the application systems realistically estimated. Some elements are difficult to measure, like return flow, evaporation from canals and rivers and transpiration from riverine vegetation, but good estimates are possible.
Table 4.1.4 : The measurement of water quantities to, on and from Water User Associations
a) Attach copies of the WUA's monthly Disposal Reports for the past water year, showing a diagrammatic layout of the scheme, flow and quantity measurements and current accuracy of measuring points. Also refer to Step 3.
b) Indicate which measuring points or actions are a priority and the expected impact on water conservation and demand management.
Question Answer PriorityY or N
Impact on efficiency %
Is a bulk quota or allocation applicable? What kind / type of measuring equipment is used? Who is responsible for the measuring?
Who is responsible for the measuring? Not applicable.
Is the measuring equipment officially approved and calibrated?
At what intervals are inspections done? Are there time lags in providing information required for facilitating distribution management?
How is water metered to farmers? Are the meters or structures effective, tamper proof and affordable?
Are they officially approved, calibrated, certified and regularly inspected?
Is any financial and technical support available? Are outflows from the WUA measured? How,
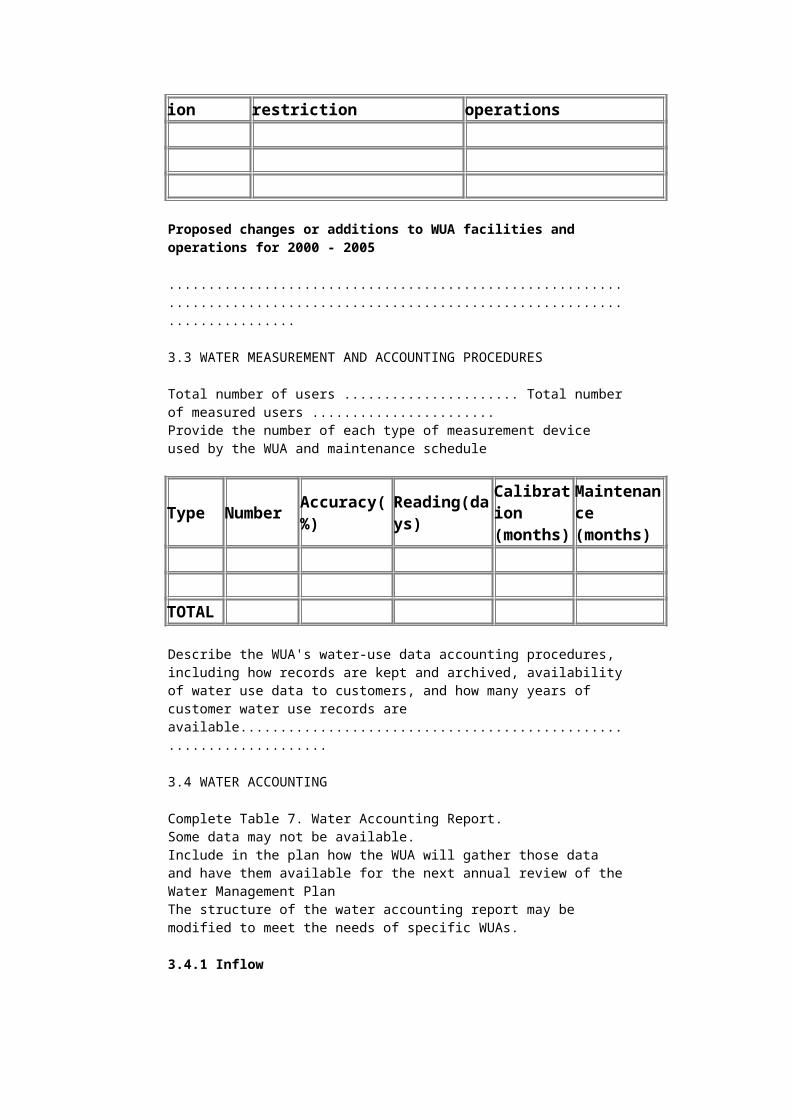
and who is responsible?Is drainage gauged?
c) Describe the installation programme of measuring devices on the WUA distribution system
Total # of accurate measuring points (rated to have a maximum error of ± six percent) [Code 3 on Disposal Report]
Total # of inaccurate measuring points [Code 2 on Disposal Report]
Total # of estimated measurements (unmeasured points) [Code 1 on Disposal Report]
Number of measuring devices installed in 1999 Number of measuring devices installed in 2000 Number of measuring devices to be installed in 2001
Types of measuring devices to be installed on the WUA's distribution system
Accuracy Total to be installed
d) Describe the installation programme of measuring devices at farm turnouts
Total number of unmeasured farm turnouts
Number of measuring devices installed in 1999
Number of measuring devices installed in 2000
Number of measuring devices to be installed in 2001
Types of measuring devices to be installed at farm turnouts Accuracy Total to be
installed
e) In the instance where measuring devices at farm turnouts have not yet been installed, describe the procedure followed for determining the total quantity supplied to each farm. Attach any supporting information. Also refer to Step 2 - Benchmarks.........................
Water quality measurement:
Describe the WUA's surface, ground and drainage water quality monitoring programme, and list any cooperating agencies. Also refer to Step 3.................................................
4.1.5 The WUA makes progress towards implementing a water pricing structure that is related, at least in part, to the actual volume it supplies to its customers (farmers and others).
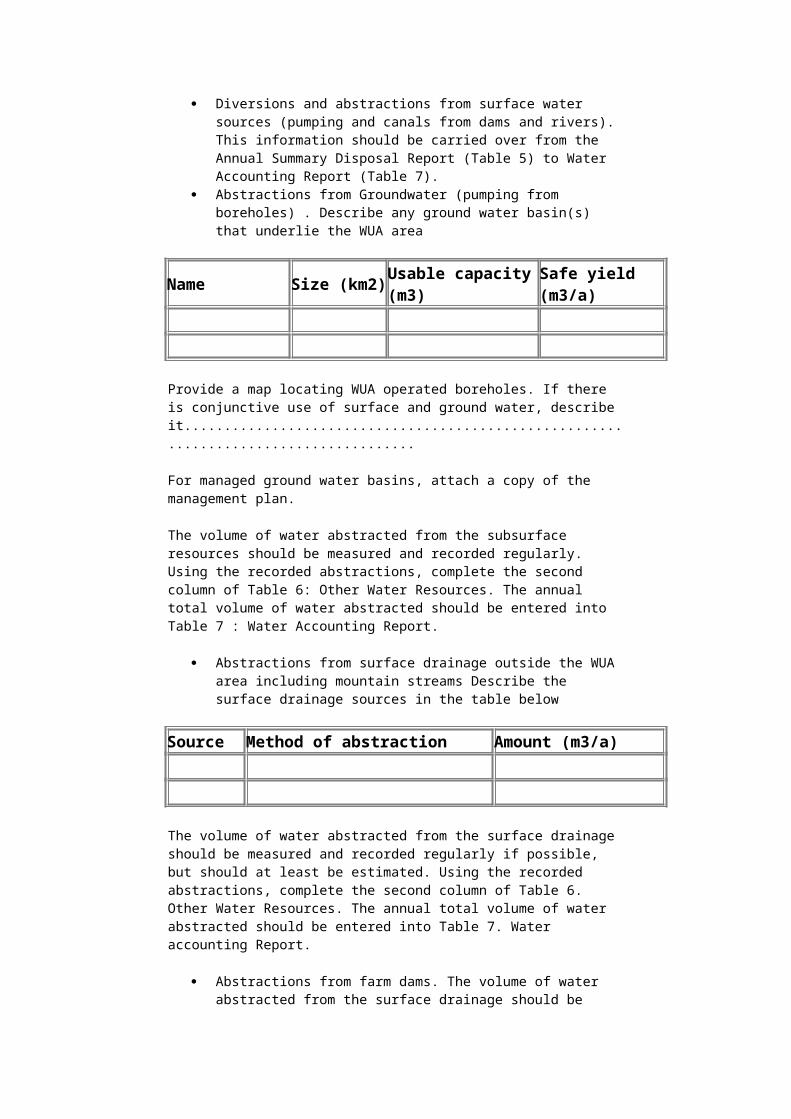
The pricing strategy for water use charges, gazetted by the Department of Water Affairs and Forestry on 12th November 1999, sets out how the bulk supplies charges for WUAs will be determined. All charges levied on the WUA will have to be apportioned to members on a fair and equitable basis. The National Water Act now makes it possible for WUAs to use innovative pricing structures when they calculate tariffs for their members. One of the most important objectives is to apply pricing structures that promote the efficient use of water, rather than a flat rate charge according to the quota. Note that some WUAs, like Douglas, are already applying some of these principles.
Important innovations are stepped pricing structures that can be coupled to temporary water transfers
between members should a member exceed the allocation. Allowance for assurance of supply is an important aspect of the bulk water pricing strategy (i.e. water supplied to the WUA) and similar adjustments could be made applicable to individual members. If a water pricing structure based at least in part on quantity delivered is not in place, describe the proposed or newly adopted quantity based water pricing structure and when it was or will be implemented. What are the penalty payments for users exceeding quotas? Describe how the WUA will apply the funds derived from stepped pricing structures to achieve water conservation and water demand management. (The description of the WUA's water pricing structure should be detailed enough to share experience with other WUAs.) ..................................................................................
4.1.6 The WUA endeavours to prevent unlawful withdrawals of surface and groundwater.
This is a principal function of WUAs as described in the National Water Act, Schedule 5, section 4.
Describe measures to control unlawful withdrawals, including incentives and mechanisms for members to promptly report unlawful withdrawals to the WUA or Water Conservation Coordinator. ...........................................................................................
4.1.7 The WUA maintains and improves its infrastructure, according to a long-term maintenance plan, supported by a financial plan
The financing of a maintenance and improvement programme is a major issue that is very closely integrated with some of the secondary BMPs following below. The affordability of rebuilding or lining canals should be discussed in relation to the long-term objectives with the scheme.
Describe the WUA's long-term maintenance and infrastructure improvement plan, showing implementation priorities over the next five years............................................
Attach a copy of the supporting financial plan for the implementation of the long-term maintenance and improvement plan............................................................................
Describe incentives for members to promptly report leaks and system faults (including faulty measuring devices) to the Water Conservation Coordinator. ............................
4.1.8 The WUA positively promotes good communication between all concerned in water management.
Describe actions of the WUA to promote regular good communication with DWAF, the CMA, neighbouring WUAs and others involved in water management.
Describe current policies or operational procedures of other water management institutions (DWAF, CMA, WUAs, Water Boards, municipalities, etc) that impact the ability of the WUA or its members to conserve water or manage water demand. Describe suggestions for future improvements in national policy and institutional changes that could allow more flexibility in water delivery and carry-over storage. ......................
Describe WUA policies that limit improved end-user water management........................
Describe actions the WUA can take to overcome these limitations................................
Is the WUA member of a coordinating structure between WUAs in the Catchment, province or nationally? Would there be merit in initiating a coordinating body and if so, who should take the initiative? ....................................................................................
4.2 SECONDARY BEST MANAGEMENT PRACTICES FOR WATER USER ASSOCIATIONS
4.2.1 The WUA facilitates the availability of support services to enable farmers to use water more efficiently
It is a reality that irrigation farmers receive very little support at this stage. The high value commodity organizations are probably most active, followed by commercial organisations such as seed companies and fertiliser suppliers and cooperatives that provide considerable support sometimes even including scheduling services. In all cases these services must be self-supporting.
Government departments play a limited role. In the past, the role of the Department of Water Affairs and Forestry was mainly concentrated on managing water supplies and their interest and influence stopped at the farm gate. Following the registration process and the application of the pricing strategy, this may change in future. It is not the official policy of the departments of agriculture to play a major role in the support of commercial farmers, where the service could be obtained from private service providers.
There has been an upsurge in the role that scheduling consultants play. They provide a valuable support to farmers, but the services required are intensive and some consultants are finding that the activity is not commercially viable. The companies marketing irrigation equipment have a considerable influence but their task is to supply and maintain equipment. There is a very real need for co-ordination and consolidation of the services provided to irrigation farmers.
These services include soil analysis and the determination of water retention curves, water quality analysis, pre-season irrigation and fertigation strategy planning, monitoring of climatic conditions during the season, determination of atmospheric demand for irrigation water, scheduling in a form suited to the
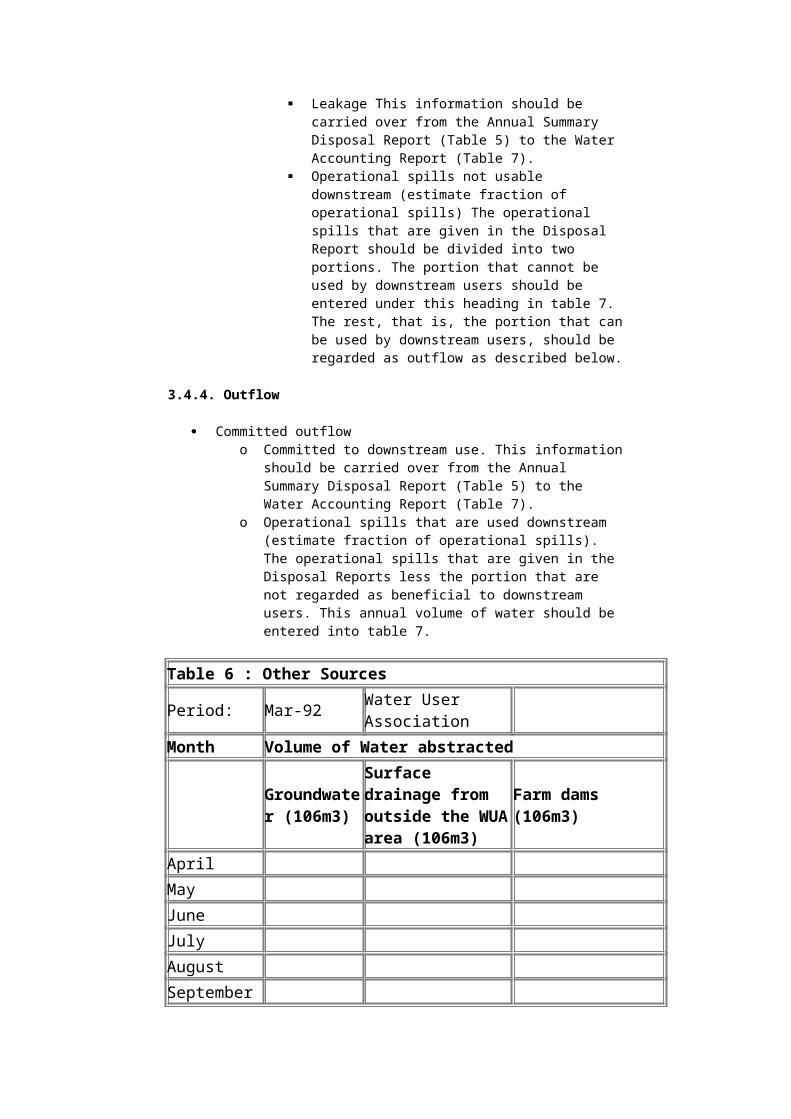
prevailing circumstances, evaluation of the effectiveness and efficiency of irrigation methods, the mechanical condition of equipment, the water housekeeping in the soil profile including deep percolation and salinization, the need for drainage and the volumes of return flow.
These irrigation related services must be seen in the context of normal agricultural practices including plant nutrition, insect and a disease control, tillage, crop varieties and yield. Above all is the overall need to be profitable in the global context, despite high interest rates, uncertain markets and a variable climate.
The workshops have shown that farmers are capable of dealing with the situation. What is required is the establishment of support services that in time will lead to the acceptance of even higher standards of efficiency than those that have been attained to date, and ensuring the achievement of these standards by an ever-increasing percentage of WUAs and irrigators. The Water User Associations will be the best organisations to drive the process and in the course of time, in accordance with the requirements of the new National Water Act, will progressively develop generally accepted and supported standards of efficiency.
Table 4.2.1 provides the framework for recording the provision of services to farmers.
Table 4.2.1 : The provision of services to farmers
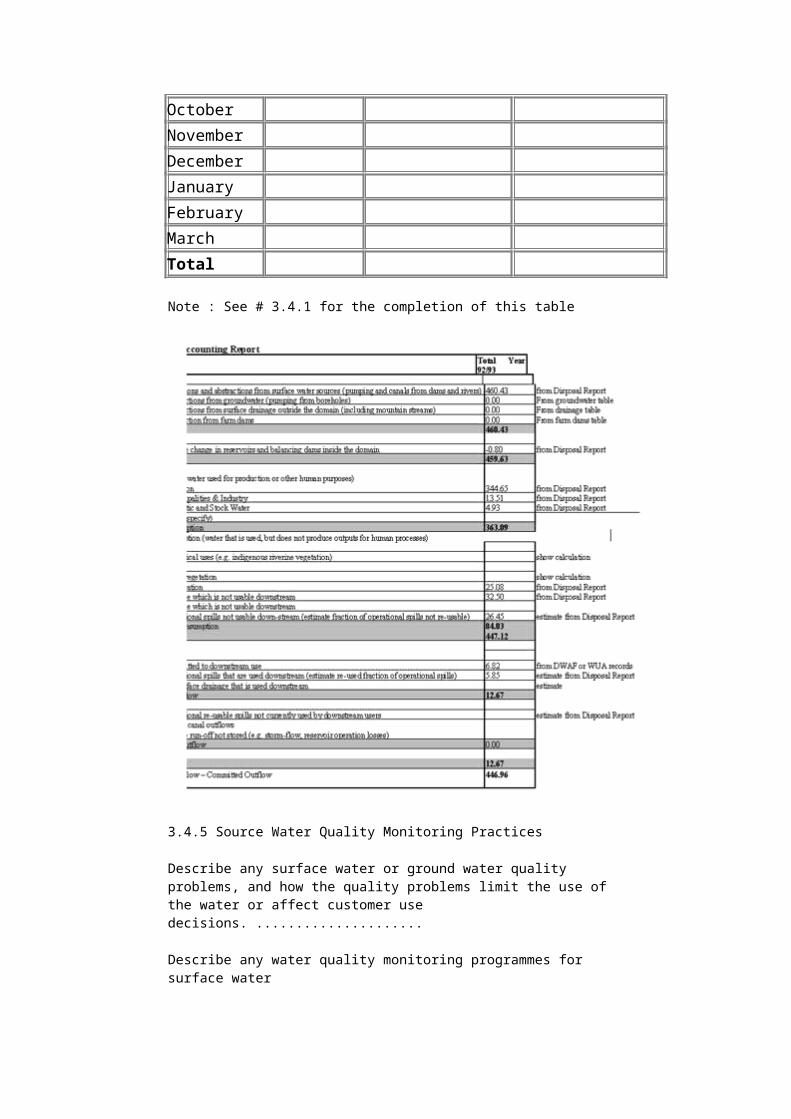
a) On-farm irrigation and drainage system evaluations (e.g. Mobile Labs)
Total number of irrigated hectares Number of irrigated hectares to be evaluated per year by on-farm irrigation evaluations
Total number of farms Number of farms to be evaluated per year by on-farm irrigation & drainage evaluations
Describe the extent to which WUA on-farm irrigation and drainage system evaluation recommendations are implemented by growers.........................................................
b) The WUA coordinates the evaluation of WUA and private pumps, evaluating both energy and water efficiency.
Describe the pump efficiency evaluation programme and the role of the WUA and participating agencies in the programme.....................................................................
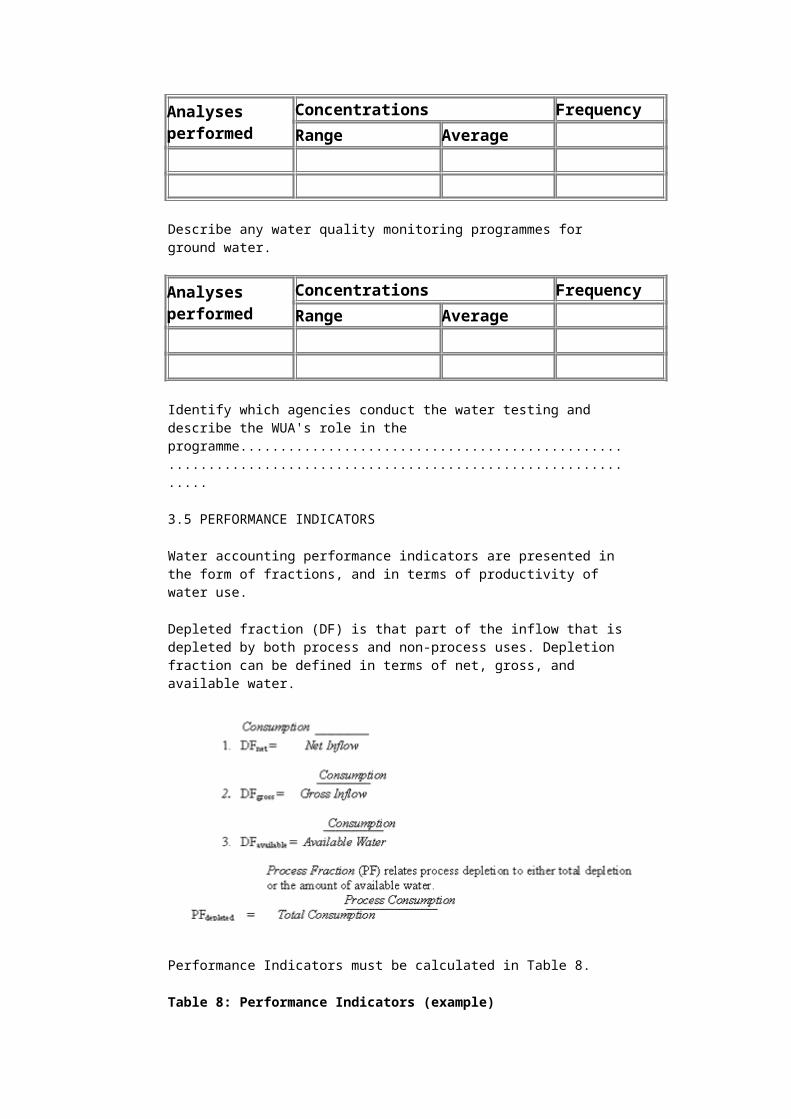
4.2.2 The suitability of specific irrigation methods and crops to the WUA area.
The suitability of crops is often a function of market requirements on the one hand, and the availability of appropriate varieties on the other. Development in agriculture is largely evolutionary and this is also true of irrigation methods and systems. Management plays an important role and efficient management so often depends on experience. South Africa has shown significant change and improvement in recent years. Technically we are on a par with any country in the world. What is now required is a critical evaluation of methods and crops, the promotion of proven improvements and the development of realistic best management practices for specific areas.
Table 4.2.2 provides for the recording of the extent and impact of irrigation methods on water conservation.
Table 4.2.2 : Extent (hectare) and impact of irrigation methods on water conservation (% or m3)
Show the types of irrigation systems in the WUA area and their impact on water conservation
4.2.3 Reduction of losses by lining canals, balancing dams, etc.
Reduction of losses by lining canals, balancing dams, etc.
This is a logical development and generally will be a valid best management practice. As with all best management practices the overall improvement that can be achieved must be weighed up in context. Is the expenditure warranted, are the water savings significant? The Water Account and Performance Indicators in Step 3 may disclose that seepage from a canal is not a loss to the catchment as a whole.
This Best Management Practice should be discussed in relation to the long-term maintenance plan described in BMP#6 above, dealing with the on going up-dating of the distribution system to promote operational efficiencies and water savings.
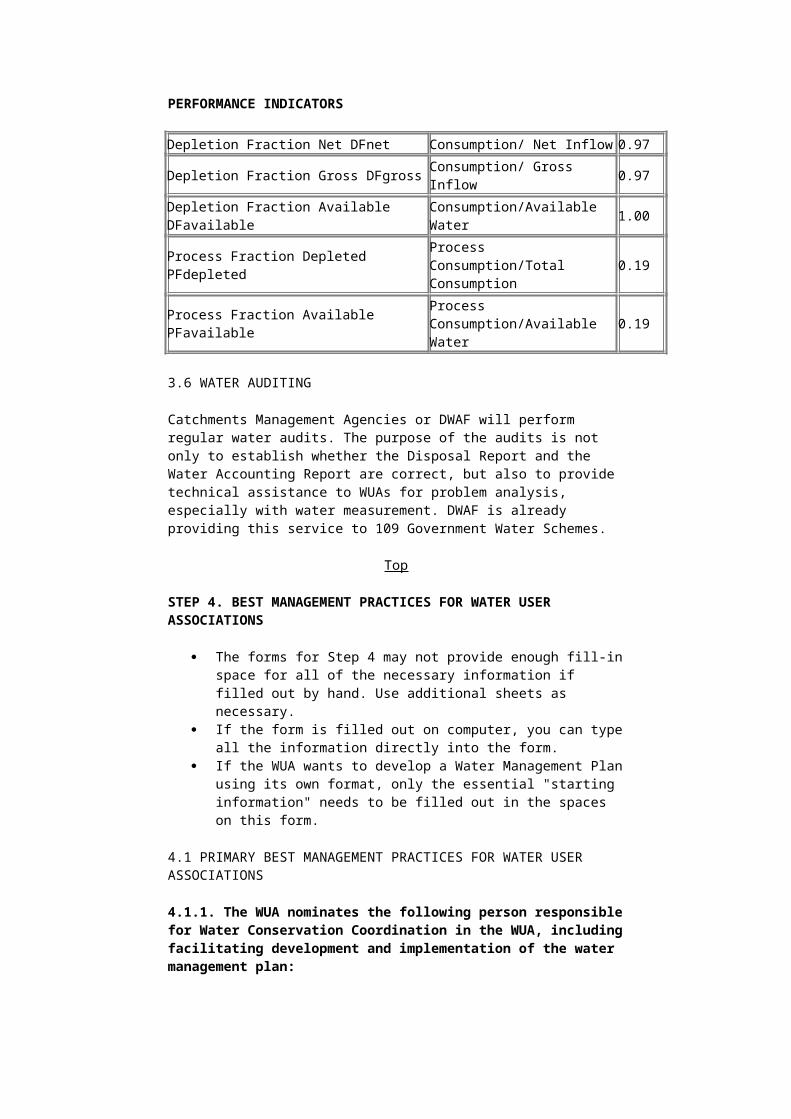
Reduction of losses by improving distribution system
Sketch the distribution system showing pipelines, canals, balancing dams, measuring devices etc with notes on materials and construction methods. Refer to the Disposal Report and Diagrammatic Layout in Step 3.
What would you like to see upgraded in order to improve the service to members?................................................................................................
Can you reconcile farmer requests for deliveries that promote on-farm efficiency with reductions in distribution losses? ...............................................................
Can you estimate what improvements would cost and can you quantify the benefits?..................................................................................................
Could improvements be phased in over a period of years, make suggestions?............................................................................................
Table 4.2.3 provides for the recording of estimated losses and potential improvements.
Table 4.2.3: Estimated losses and potential improvements (% or m^3)
Estimate annual operation spills. Estimate annual water savings (m3/a) resulting from the evaluated projects.
Aspect Seepage/leaks Spills On-farm losses due to unsatisfactory delivery
Sum of losses
Estimate of potential savings by upgrading
Distribution control
Balancing dams
Canals Pipelines
4.2.4 Better management procedures for water bailiffs and other water management staff.
Describe current management procedures for water bailiffs and other water management staff. Describe recent changes that had a significant impact. Describe any plans or suggestions for future improvements? ............................................................................
4.2.5 Training of WUA personnel
What training programmes are currently available for WUA personnel, from the WUA or other agencies? Are any of the courses offered by DWAF
attended by WUA staff? Do you have any suggestions for improvement?.............................................................
Describe training requirements for which courses are not currently available. Who should provide this training?.....................................................................................................
Does the WUA, its staff or members have any training requirements related to the development and implementation of Water Management Plans or other aspects related to the National Water Act? Please be as specific as possible. Who should provide this training? How could this training be provided in the most cost effective way that would reach a large number of people?................................................................................
4.2.6 Facilitate the financing of capital improvements for on-farm irrigation systems.
Describe provisions of the WUA to facilitate financing for improvement of on-farm irrigation systems, especially for small-scale farmers. Which financing agencies are cooperating with the WUA in this regard? ................................................................
4.2.7 Facilitate voluntary water transfers. Describe the WUA's policies and management of voluntary water transfers between its members, to maximise beneficial water use in the WUA. Is the current arrangement satisfactory or are their plans for improvement? ................................................................................................................................
4.2.8 Eradication of invasive alien plants.
Please describe the extent of invasive alien vegetation in the WUA area and the impact on available water? ....................................................................................................
Describe the WUA's programme for eradication of invasive plants over the next five years, indicating WUA staff and budget allocated to this task. Describe the role and contribution of cooperating agencies, such as the CMA, DWAF, the Working for Water program, etc...............................................................................................................
4.2.9 Practice of adequate soil conservation and drainage measures.
Describe the WUA's monitoring, planning and implementation of drainage. ................
Describe current WUA soil conservation works and the maintenance programme for these structures over the next five years, including WUA staff and budget allocated to this task ...................................................................................................................
What soil conservation works need to be constructed in the next five years? Please describe the planned activities and budget allocations for this period.........................
Top