departmental management - department of … · dm - 45 12-15 justification of program and...
TRANSCRIPT
U.S. DEPARTMENT OF COMMERCE
DEPARTMENTAL MANAGEMENT
FY 2018 CONGRESSIONAL SUBMISSION


Department of Commerce Departmental Management
Budget Estimates, Fiscal Year 2018
Congressional Submission
Table of Contents
Exhibit Description Page
2 Organization Chart. . . . . . . . . . . . . . . . . . . . . . . . . . . . . . . . . . . . . . . . . . . . . . . . . . . . . . . . . . . . . . . . . . . . . . . . . . . . . . . . . . . . . . . . DM - 1
3 Executive Summary. . . . . . . . . . . . . . . . . . . . . . . . . . . . . . . . . . . . . . . . . . . . . . . . . . . . . . . . . . . . . . . . . . . . . . . . . . . . . . . . . . . . . . . DM - 3
4a Program Increaes/Decreases/Terminations. . . . . . . . . . . . . . . . . . . . . . . . . . . . . . . . . . . . . . . . . . . . . . . . . . . . . . . . . . . . . . . . . . . . . DM - 5
Salaries and Expenses: 5 Summary of Resource Requirements: Direct Obligations. . . . . . . . . . . . . . . . . . . . . . . . . . . . . . . . . . . . . . . . . . . . . . . . . . . . . . . . . . DM - 7
6 Summary of Reimbursable Obligations. . . . . . . . . . . . . . . . . . . . . . . . . . . . . . . . . . . . . . . . . . . . . . . . . . . . . . . . . . . . . . . . . . . . . . . . DM - 9
7 Summary of Financing. . . . . . . . . . . . . . . . . . . . . . . . . . . . . . . . . . . . . . . . . . . . . . . . . . . . . . . . . . . . . . . . . . . . . . . . . . . . . . . . . . . . . DM - 10
9 Justification of Adjustments-to-Base. . . . . . . . . . . . . . . . . . . . . . . . . . . . . . . . . . . . . . . . . . . . . . . . . . . . . . . . . . . . . . . . . . . . . . . . . . DM - 11
10 Program and Performance: Direct Obligations. . . . . . . . . . . . . . . . . . . . . . . . . . . . . . . . . . . . . . . . . . . . . . . . . . . . . . . . . . . . . . . . . . . DM - 14
12-15 Justification of Program and Performance - Salaries and Expenses Overview. . . . . . . . . . . . . . . . . . . . . . . . . . . . . . . . . . . . . . . . . . DM - 15
12-15 Justification of Program and Performance - Investigations and Threat Management Division. . . . . . . . . . . . . . . . . . . . . . . . . . . . . . DM - 20
12-15 Justification of Program and Performance - Operations and Administration . . . . . . . . . . . . . . . . . . . . . . . . . . . . . . . . . . . . . . . . . . . . DM - 24
16 Summary of Requirements by Object Class. . . . . . . . . . . . . . . . . . . . . . . . . . . . . . . . . . . . . . . . . . . . . . . . . . . . . . . . . . . . . . . . . . . . . DM - 26
32 Justification of Proposed Language Changes. . . . . . . . . . . . . . . . . . . . . . . . . . . . . . . . . . . . . . . . . . . . . . . . . . . . . . . . . . . . . . . . . . . DM - 28
33 Appropriation Language and Code Citation . . . . . . . . . . . . . . . . . . . . . . . . . . . . . . . . . . . . . . . . . . . . . . . . . . . . . . . . . . . . . . . . . . . . DM - 29
34 Advisory and Assistance Services. . . . . . . . . . . . . . . . . . . . . . . . . . . . . . . . . . . . . . . . . . . . . . . . . . . . . . . . . . . . . . . . . . . . . . . . . . . . DM - 30
35 Periodicals, Pamphlets, and Audiovisual Products . . . . . . . . . . . . . . . . . . . . . . . . . . . . . . . . . . . . . . . . . . . . . . . . . . . . . . . . . . . . . . . DM - 31
36 Average Grade and Salaries. . . . . . . . . . . . . . . . . . . . . . . . . . . . . . . . . . . . . . . . . . . . . . . . . . . . . . . . . . . . . . . . . . . . . . . . . . . . . . . . DM - 32
HCHB Renovation and Modernization: 5 Summary of Resource Requirements: Direct obligations. . . . . . . . . . . . . . . . . . . . . . . . . . . . . . . . . . . . . . . . . . . . . . . . . . . . . . . . . . . DM - 33
7 Summary of Financing. . . . . . . . . . . . . . . . . . . . . . . . . . . . . . . . . . . . . . . . . . . . . . . . . . . . . . . . . . . . . . . . . . . . . . . . . . . . . . . . . . . . . DM - 35
9 Justification of Adjustments to Base. . . . . . . . . . . . . . . . . . . . . . . . . . . . . . . . . . . . . . . . . . . . . . . . . . . . . . . . . . . . . . . . . . . . . . . . . . DM - 36
10 Program and Performance: Direct Obligations. . . . . . . . . . . . . . . . . . . . . . . . . . . . . . . . . . . . . . . . . . . . . . . . . . . . . . . . . . . . . . . . . . . DM - 37
12-15 Justification of Program and Performance - HCHB Renovation and Modernization. . . . . . . . . . . . . . . . . . . . . . . . . . . . . . . . . . . . . . DM - 38
16 Summary of Requirements by Object Class. . . . . . . . . . . . . . . . . . . . . . . . . . . . . . . . . . . . . . . . . . . . . . . . . . . . . . . . . . . . . . . . . . . . . DM - 39
33 Appropriation Language and Code Citation. . . . . . . . . . . . . . . . . . . . . . . . . . . . . . . . . . . . . . . . . . . . . . . . . . . . . . . . . . . . . . . . . . . . . DM - 41
36 Average Grade and Salaries. . . . . . . . . . . . . . . . . . . . . . . . . . . . . . . . . . . . . . . . . . . . . . . . . . . . . . . . . . . . . . . . . . . . . . . . . . . . . . . . DM - 42
Working Capital Fund: 5 Summary of Resource Requirements: Reimbursable obligations. . . . . . . . . . . . . . . . . . . . . . . . . . . . . . . . . . . . . . . . . . . . . . . . . . . . DM - 43
9 Justification of Adjustments-to-Base. . . . . . . . . . . . . . . . . . . . . . . . . . . . . . . . . . . . . . . . . . . . . . . . . . . . . . . . . . . . . . . . . . . . . . . . . . DM - 45
12-15 Justification of Program and Performance - WCF Overview. . . . . . . . . . . . . . . . . . . . . . . . . . . . . . . . . . . . . . . . . . . . . . . . . . . . . . . . DM - 49
16 Summary of Requirements by Object Class. . . . . . . . . . . . . . . . . . . . . . . . . . . . . . . . . . . . . . . . . . . . . . . . . . . . . . . . . . . . . . . . . . . . . DM - 52
WCF Direct costs by Office. . . . . . . . . . . . . . . . . . . . . . . . . . . . . . . . . . . . . . . . . . . . . . . . . . . . . . . . . . . . . . . . . . . . . . . . . . . . . . . . . DM - 54
WCF Direct costs by Bureau. . . . . . . . . . . . . . . . . . . . . . . . . . . . . . . . . . . . . . . . . . . . . . . . . . . . . . . . . . . . . . . . . . . . . . . . . . . . . . . . DM - 55
34 Advisory and Assistance Services . . . . . . . . . . . . . . . . . . . . . . . . . . . . . . . . . . . . . . . . . . . . . . . . . . . . . . . . . . . . . . . . . . . . . . . . . . . DM - 56
36 Average Grade and Salaries. . . . . . . . . . . . . . . . . . . . . . . . . . . . . . . . . . . . . . . . . . . . . . . . . . . . . . . . . . . . . . . . . . . . . . . . . . . . . . . . DM - 57
APP/APR: Summary of Goals, Objectives and Performance Measures. . . . . . . . . . . . . . . . . . . . . . . . . . . . . . . . . . . . . . . . . . . . . . . . . . . . . . . . DM - 59

[This page intentionally left blank]

U.S. DEPARTMENT OF COMMERCE
SECRETARY
Deputy Secretary
ASSISTANT SECRETARY FOR LEGISLATIVE AND
INTERGOVERNMENTAL AFFAIRS
UNDER SECRETARY FOR INDUSTRY AND SECURITY
BUREAU OF INDUSTRY AND SECURITY
UNDER SECRETARY
FOR INTERNATIONAL TRADE
DEPUTY UNDER SECRETARY FOR INTERNATIONAL TRADE
ADMINISTRATION
UNDER SECRETARY FOR INTELLECTUAL PROPERTY
AND DIRECTOR
UNITED STATES PATENT AND TRADEMARK OFFICE
UNDER SECRETARY FOR STANDARDS AND
TECHNOLOGY NATIONAL INSTITUTE OF
STANDARDS AND TECHNOLOGY
DIRECTOR NATIONAL TECHNICAL
INFORMATION SERVICE
ASSISTANT SECRETARY FOR ECONOMIC DEVELOPMENT
ECONOMIC DEVELOPMENT ADMINISTRATION
GENERAL COUNSEL
CHIEF FINANCIAL OFFICER AND ASSISTANT SECRETARY FOR ADMINISTRATION
INSPECTOR GENERAL
OFFICE OF PUBLIC AFFAIRS
OFFICE OF BUSINESS LIAISON
OFFICE OF POLICY AND STRATEGIC PLANNING
OFFICE OF WHITE HOUSE LIAISON
CHIEF INFORMATION OFFICER
ASSISTANT SECRETARY FOR EXPORT
ADMINISTRATION
ASSISTANT SECRETARY FOR EXPORT
ENFORCEMENT
NATIONAL DIRECTOR
MINORITY BUSINESS DEVELOPMENT AGENCY
ASSISTANT SECRETARY FOR COMMUNICATIONS AND
INFORMATION
NATIONAL TELECOMMUNICATIONS
AND INFORMATION ADMINISTRATION
EXECUTIVE SECRETARIAT
Chief of Staff
UNDER SECRETARY AND ADMINISTRATOR
NATIONAL OCEANIC AND ATMOSPHERIC ADMINISTRATION
ASSISTANT SECRETARY FOR CONSERVATION
AND MANAGEMENT/ DEPUTY
ADMINISTRATOR
ASSISTANT SECRETARY FOR ENVIRONMENTAL
OBSERVATION AND PREDICTION/DEPUTY
ADMINISTRATOR
CHIEF SCIENTIST
UNDER SECRETARY FOR ECONOMIC AFFAIRS
ECONOMIC AND STATISTICS
ADMINISTRATION
CHIEF ECONOMIST
DIRECTOR BUREAU OF
THE CENSUS
DIRECTOR BUREAU OF ECONOMIC
ANALYSIS
ASSISTANT SECRETARY FOR ENFORCEMENT AND
COMPLIANCE
DEPUTY ASSISTANT SECRETARY FOR
ENFORCEMENT AND COMPLIANCE
ASSISTANT SECRETARY FOR INDUSTRY AND
ANALYSIS
DEPUTY ASSISTANT SECRETARY FOR INDUSTRY
AND ANALYSIS
DIRECTOR GENERAL OF THE U.S. AND FOREIGN COMMERCIAL
SERVICE AND ASSISTANT SECRETARY FOR GLOBAL
MARKETS
DEPUTY DIRECTOR GENERAL OF THE U.S. AND FOREIGN
COMMERCIAL SERVICE
DEPUTY UNDER SECRETARY FOR
INDUSTRY AND SECURITY
DM - 1

[This page intentionally left blank]
DM - 2

Department of CommerceDepartmental Management
Executive Summary
The mission of the Department of Commerce (DOC) is to create the conditions for economic growth and opportunity. The Department works with businesses, universities, communities, and the Nation’s workers to promote job creation, economic growth, sustainable development, and improved standards of living for Americans.
The DOC Strategic Plan for Fiscal Years (FY) 2014-2018 provides a broad foundation for economic growth and opportunity by focusing on five key priorities:
• Trade and Investment. Expanding the U.S. economy through increased exports and foreign direct investment that leads to more and better American jobs.
• Innovation. Fostering a more innovative U.S. economy—one that is better at inventing, improving, and commercializing products and technologies that lead to higher productivity and competitiveness.
• Data. Improve government, business, and community decisions and knowledge by transforming Department data capabilities and supporting a data-enabled economy.
• Environment. Ensuring communities and businesses have the necessary information, products, and services to prepare for and prosper in a changing environment.
• Operational Excellence. Delivering better services, solutions, and outcomes that benefit the American people.
The full DOC Strategic Plan for FY 2014-2018 can be accessed via: http://www.osec.doc.gov/bmi/budget/
Departmental Management’s (DM) objective is to develop and provide policies and procedures for administrative planning, oversight, coordination, direction, and guidance to ensure implementation of the Department’s mission.
DM is comprised of the following:
• The Salaries and Expenses appropriation provides funding for the development and implementation of Departmental policies, coordinates the bureaus’ program activities to accomplish the Departmental mission, provides funds for the development and implementation of the Department’s internal policies, procedures, and other administrative guidelines. In FY 2018, DM is seeking an increase that would:
o Support the staffing and associated costs to expand investigations and threat management activities within the Office of Security’s Investigations and Threat Management Division.
• The Working Capital Fund is a reimbursable fund providing necessary centralized services to the client bureaus. These services include the Office of General Counsel, Chief Information Officer, Executive Direction, Security, Human Resources Management, Civil Rights, Financial Management, Facilities and Environmental Quality, Acquisition Management, Enterprise Services, and Privacy and Open Government.
• The Herbert C. Hoover Building (HCHB) Renovation and Modernization account provides no-year funding for the Department’s expenses associated with the renovation and
DM - 3

modernization of HCHB. Renovation and modernization of the Department’s headquarters by the General Services Administration (GSA) will extend the building’s useful life through infrastructure upgrades, security upgrades, and historic preservation of some features.
A full-year 2017 appropriation was not enacted at the time the FY 2018 Budget was prepared; therefore, the Budget assumes the Department is operating under the Further Continuing Appropriations Act, 2017 (P.L. 114–254). The amounts included for 2017 reflect the annualized level provided by the continuing resolution.
SUMMARY OF REQUESTED APPROPRIATIONS (Dollar amounts in thousands)
2017
CR (Annualized)
2018
Estimate
Increase (+)
Decrease (-)
Appropriation
Salaries and Expenses
HCHB Renovation and Modernization
Pos./ Approp. FTE
Pos./ Approp. FTE
Personnel Amount
200 57,890 158
5 19,026 5
Personnel Amount
220 63,000 178
5 1,000 5
Personnel Amount
20 5,110 20
0 (18,026) 0
Total Budget Authority Pos./ Approp. FTE
205 163
76,916 225 183
64,000 20 20
(12,916)
DM - 4
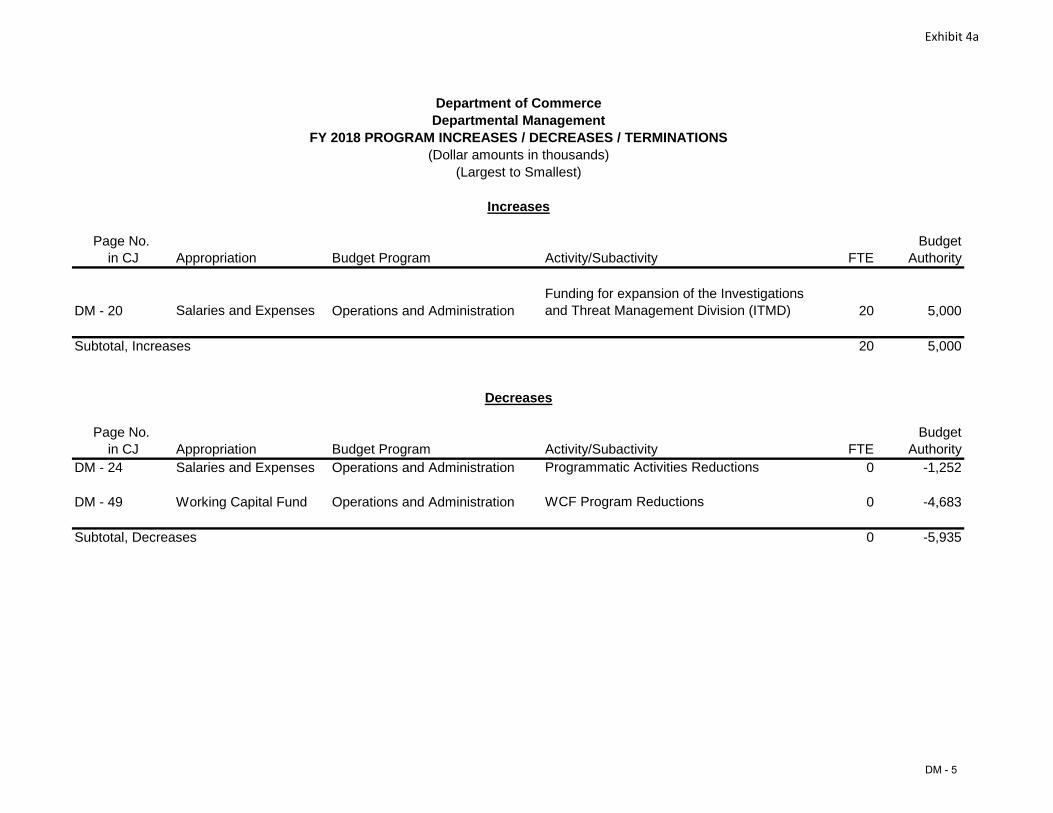
Exhibit 4a
Department of Commerce Departmental Management
FY 2018 PROGRAM INCREASES / DECREASES / TERMINATIONS (Dollar amounts in thousands)
(Largest to Smallest)
Increases
Page No. Budget in CJ Appropriation Budget Program Activity/Subactivity FTE Authority
Funding for expansion of the Investigations DM - 20 Salaries and Expenses Operations and Administration and Threat Management Division (ITMD) 20 5,000
Subtotal, Increases 20 5,000
Decreases
Page No. Budget in CJ Appropriation Budget Program Activity/Subactivity FTE Authority
DM - 24 Salaries and Expenses Operations and Administration Programmatic Activities Reductions 0 -1,252
DM - 49 Working Capital Fund Operations and Administration WCF Program Reductions 0 -4,683
Subtotal, Decreases 0 -5,935
DM - 5

[This page intentionally left blank]
DM - 6

Exhibit 5
Department of Commerce Departmental Management
Salaries and Expenses
(Dollar amounts in thousands) SUMMARY OF RESOURCE REQUIREMENTS
2017 CR (Annualized) less: Obligations from prior years plus: 2018 Adjustments to base
2018 Base plus: 2018 Program Changes
2018 Estimate
Positions 200
0 200 20 220
FTE 158
0 158 20 178
Budget Authority
57,890 0
1,362 59,252 3,748
63,000
Direct Obligations
61,697 (3,807) 1,362
59,252 3,748
63,000
Comparison by activity: Personnel
2016 Actual
Amount
2017 CR (Annualized)
Personnel Amount
2018 Base
Personnel Amount
2018 Estimate
Personnel Amount
Increase/(Decrease) Over 2018 Base
Personnel Amount
Operations and Administration Pos./BA FTE/Obl.
199 158
61,750 60,491
200 158
57,890 61,697
200 158
59,252 220 178
63,000 20 20
3,748
TOTALS Pos./BA FTE/Obl.
199 158
61,750 60,491
200 158
57,890 61,697
200 158
59,252 220 178
63,000 20 20
3,748
Adjustments to Obligations: Unobligated balance, start of year Unobligated balance, transferred Unobligated balance, end of year Unobligated balance, expiring
(257) (2,650) 3,807
359
(3,807)
Financing from Transfers: Transfer from other accounts (-) Transfer to other accounts (+)
(3,750)
Appropriation 58,000 57,890 59,252 63,000 3,748
DM - 7

[This page intentionally left blank]
DM - 8

DM - 9
SUMMARY OF REIMBURSABLE OBLIGATIONS
Department of Commerce Departmental Management
Salaries and Expenses
(Dollar amounts in thousands)
Exhibit 6
Operations and Administration Pos./BA FTE/Obl.
TOTALS Pos./BA FTE/Obl.
Adjustments to Obligations: Recoveries (COMMITS) Unobligated balance, start of year (COMMITS)
Unobligated balance, transferred Unobligated balance, end of year Unobligated balance, expiring
2016 Actual
Personnel
81 81
81 81
Amount
89,226
89,226
(22) (1,016)
138
2017 CR (Annualized)
Personnel
81 81
81 81
Amount
93,648
93,648
(138)
2018 Base
Personnel
81 81
81 81
Amount
93,510
93,510
2018 Estimate
Personnel
81 81
81 81
Amount
93,510
93,510
Increase/(Decrease) Over 2018 Base
Personnel Amount
0 0 0
0 0 0
Financing from Transfers: Transfer from other accounts (-) Transfer to other accounts (+)
Reimbursable Authority 88,326 93,510 93,510 93,510 0
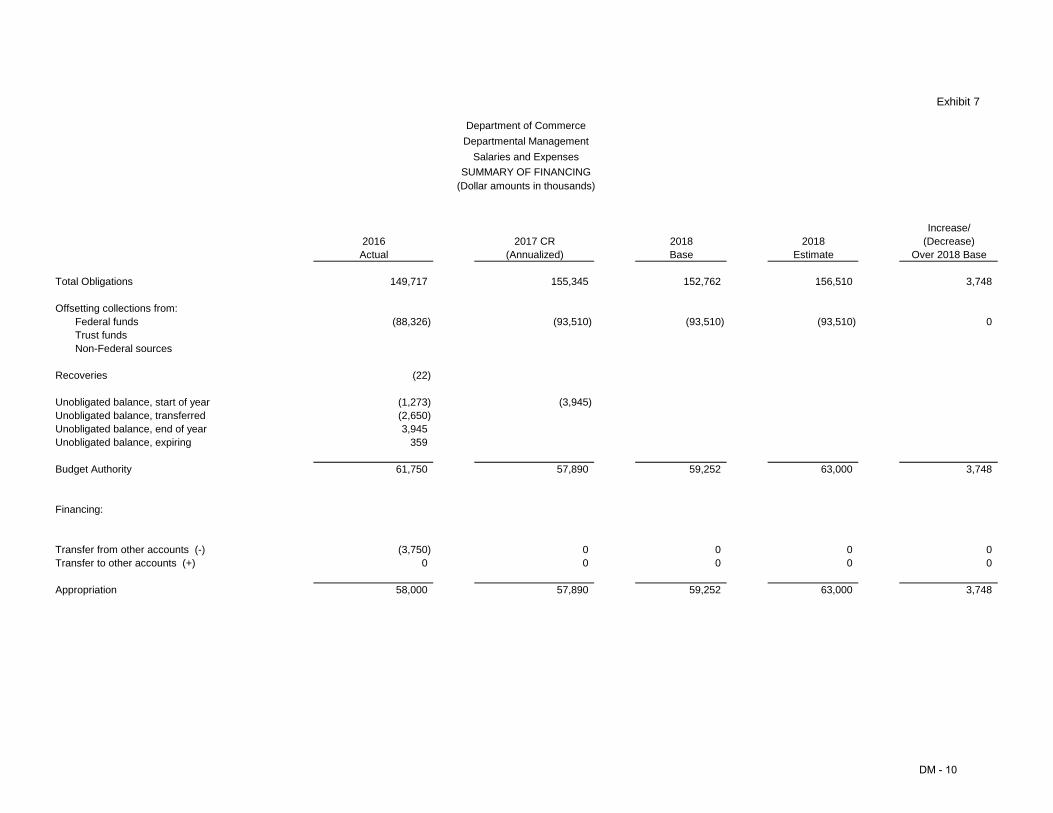
Exhibit 7
Department of Commerce Departmental Management
Salaries and Expenses
(Dollar amounts in thousands) SUMMARY OF FINANCING
2016 Actual
2017 CR (Annualized)
2018 Base
2018 Estimate
Increase/ (Decrease)
Over 2018 Base
Total Obligations 149,717 155,345 152,762 156,510 3,748
Offsetting collections from: Federal funds Trust funds Non-Federal sources
(88,326) (93,510) (93,510) (93,510) 0
Recoveries (22)
Unobligated balance, start of year Unobligated balance, transferred Unobligated balance, end of year Unobligated balance, expiring
(1,273) (2,650) 3,945
359
(3,945)
Budget Authority 61,750 57,890 59,252 63,000 3,748
Financing:
Transfer from other accounts (-) Transfer to other accounts (+)
(3,750) 0
0 0
0 0
0 0
0 0
Appropriation 58,000 57,890 59,252 63,000 3,748
DM - 10
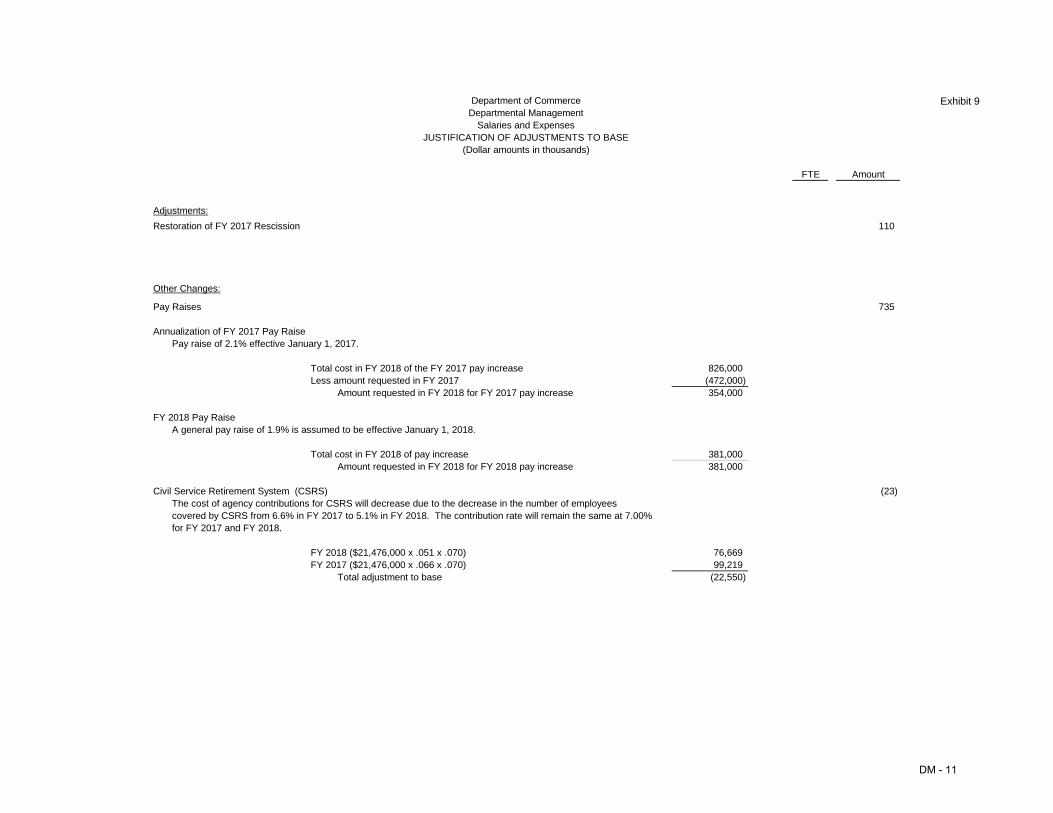
Department of Commerce Exhibit 9 Departmental Management
Salaries and Expenses JUSTIFICATION OF ADJUSTMENTS TO BASE
(Dollar amounts in thousands)
FTE Amount
Adjustments: Restoration of FY 2017 Rescission 110
Other Changes:
Pay Raises 735
Annualization of FY 2017 Pay Raise Pay raise of 2.1% effective January 1, 2017.
Total cost in FY 2018 of the FY 2017 pay increase 826,000 Less amount requested in FY 2017 (472,000)
Amount requested in FY 2018 for FY 2017 pay increase 354,000
FY 2018 Pay Raise A general pay raise of 1.9% is assumed to be effective January 1, 2018.
Total cost in FY 2018 of pay increase 381,000 Amount requested in FY 2018 for FY 2018 pay increase 381,000
Civil Service Retirement System (CSRS) (23) The cost of agency contributions for CSRS will decrease due to the decrease in the number of employees covered by CSRS from 6.6% in FY 2017 to 5.1% in FY 2018. The contribution rate will remain the same at 7.00% for FY 2017 and FY 2018.
FY 2018 ($21,476,000 x .051 x .070) 76,669 FY 2017 ($21,476,000 x .066 x .070) 99,219
Total adjustment to base (22,550)
DM - 11

(Dollar amounts in thousands)
Department of Commerce Departmental Management
Salaries and Expenses JUSTIFICATION OF ADJUSTMENTS TO BASE
FTE Amount
Exhibit 9
Federal Employees' Retirement System (FERS) The estimated percentage of payroll for employees covered by FERS will increase from 93.4% in 2017 to 94.9% in FY 2018. The contribution rate will remain the same at 13.7% for FY 2017 and FY 2018.
FY 2018 ($21,476,000 x .949 x .137) 2,792,159 FY 2017 ($21,476,000 x .934 x .137) 2,748,026
Total adjustment to base 44,133
Thrift Savings Plan (TSP) The cost of agency contributions for TSP will increase from 93.4% in 2017 to 94.9% in FY 2018. The contribution rate has will remain the same at 4.4% for FY 2017 and FY 2018.
FY 2018 ($21,476,000 x .949 x .044) 896,752 FY 2017 ($21,476,000 x .934 x .044) 882,578
Total adjustment to base 14,174
Federal Insurance Contributions Act (FICA) - OASDI The annual salary subject to the OASDI tax will increase from $127,200 in FY 2017 to $130,950 in FY 2018. The percent of salaries below the cap will increase from 93.4% in FY 2017 to 94.9% in FY 2018. The total salaries taxable by OASDI will decrease from 90.6% for FY 2017 to 89.7% in FY 2018. The OASDI tax rate remains the same 6.2% in FY 2018. The combination of the above adjustments results in a net increase of $6,945.
FERS payroll subject to FICA tax in FY 2018 ($21,476,000 x .949 x .897 x .062) 1,133,454 FERS payroll subject to FICA tax in FY 2017 ($21,476,000 x .934 x .906 x .062) 1,126,731
Subtotal 6,723
Other payroll subject to FICA tax in FY 2018 ($450,000 x .949 x .897 x .062) 23,750 Other payroll subject to FICA tax in FY 2017 ($450,000 x .934 x .906 x .062) 23,609
Subtotal 141
Total adjustment to base 6,864
Health Insurance Effective January 2016, the cost of the U.S. Government's contribution to the Federal employee's health insurance premium increased by 5.2%. Applied against the FY 2017 estimate of $1,578,000 the additional amount required is $82,056.
Employee Compensation The Employees Compensation Fund is based on an actual billing from the Department of Labor.
44
14
7
82
(30)
DM - 12

(Dollar amounts in thousands)
Department of Commerce Departmental Management
Salaries and Expenses JUSTIFICATION OF ADJUSTMENTS TO BASE
FTE Amount
Exhibit 9
Travel, Per Diem GSA has established standard travel per diem rates for destinations within the Continental United States resulting in a 1.4% increase. This percentage applied against the FY 2017 estimate of $228,000 results in an increase of $3,192.
Rental Payments to GSA GSA rates are projected to increase in FY 2018. An additional $68,972 is required to fund this increase.
Printing and Reproduction There is an estimated rate increase of 2.0% for printing and reproduction. This percentage was applied to the FY 2017 estimate of $131,000 to arrive at an increase of $2,620.
Working Capital Fund An estimate of $96,000 is requested to fund cost increases in Departmental Management's Working Capital Fund.
General Pricing Level Adjustment
This request applies OMB economic assumptions for FY 2018 of 2.0% to sub-object classes where the prices that the Government pays are established through the market system. Factors are applied to communications, utilities, and miscellaneous charges (excluding postage & FTS) ($4,780); rental payments to others ($0); other services ($238,791); supplies and materials ($5,920); and equipment ($2,760), for a total increase of $252,251.
3
69
3
96
252
Subtotal, Other Changes
Total FY 2018 Adjustments to Base
0
0
1,252
1,362
DM - 13

Exhibit 10
Department of Commerce Departmental Management
Salaries and Expenses
(Dollar amounts in thousands) PROGRAM AND PERFORMANCE: DIRECT OBLIGATIONS
Compare by activity:
Operations and Administration
TOTALS
Pos./BA FTE/Obl.
Pos./BA FTE/Obl.
2016 Actual
Personnel
199 158
199 158
Amount
61,750 60,491
61,750 60,491
2017 CR (Annualized)
Personnel Amount
200 57,890 158
200 57,890 158 61,697
2018 Base
Personnel
200 158
200 158
Amount
59,252 0
59,252
2018 Estimate
Personnel
220 178
220 178
Amount
63,000 0
63,000
Increase/(Decrease) Over 2018 Base
Personnel Amount
20 3,748 20 0
20 3,748 20
DM - 14

Exhibit 12 – 15
Department of Commerce Departmental Management
Salaries and Expenses
$ M
illion
s
$70
$60
$50
$40
$30
$20
$10
$0
$57.890 $63.000
FY 2017 CR (Annualized) FY 2018 DOC Request
FY 2017 CR (Annualized) FY 2018 Request
APPROPRIATION ACCOUNT: Salaries and Expenses
BUDGET PROGRAM: Operations and Administration
For FY 2018, Departmental Management (DM) requests a total of $63,000,000 and 178 FTE for Salaries and Expenses (S&E) (including inflationary adjustments). This funding includes a net increase of $5,110,000 and 20 FTE, with programmatic changes of $5,000,000 and 20 FTE and a decrease of $1,252,000 in programmatic reduction, and an increase of $1,362,000 in inflationary adjustments.
PROGRAM JUSTIFICATION:
Salaries and Expenses Overview
DM provides Departmental policies, planning, and administrative guidance to ensure the efficient and effective implementation of the Department’s mission statement. DM develops and implements policy affecting U.S. and international activities as well as internal goals and operations of the Department. DM serves as the primary liaison with the executive branch, for legislative affairs, and private sector groups. Furthermore, DM is the management and administrative control point for the Department. The S&E Appropriation funds the senior officials and support staff responsible for providing leadership in ensuring the accomplishment of the Department’s mission.
S&E Operations and Administration funding supports coordination of bureau program activities and development and implementation of the Department’s internal policies, procedures, and other administrative guidelines. Functions include the oversight, direction and coordination of the Department’s many activities and the representation of the Administration before the public, the business community, the Congress and other executive agencies and departments. This funding is also used to assist the Secretary in planning, supervising, and directing resources and programs and executing his obligations under law, providing consistency in the bureaus’ administrative operations. Activities of DM S&E relate to DOC’s Performance Goal of identifying and effectively managing human and material resources critical to the success of the Department’s strategic goals.
DM - 15
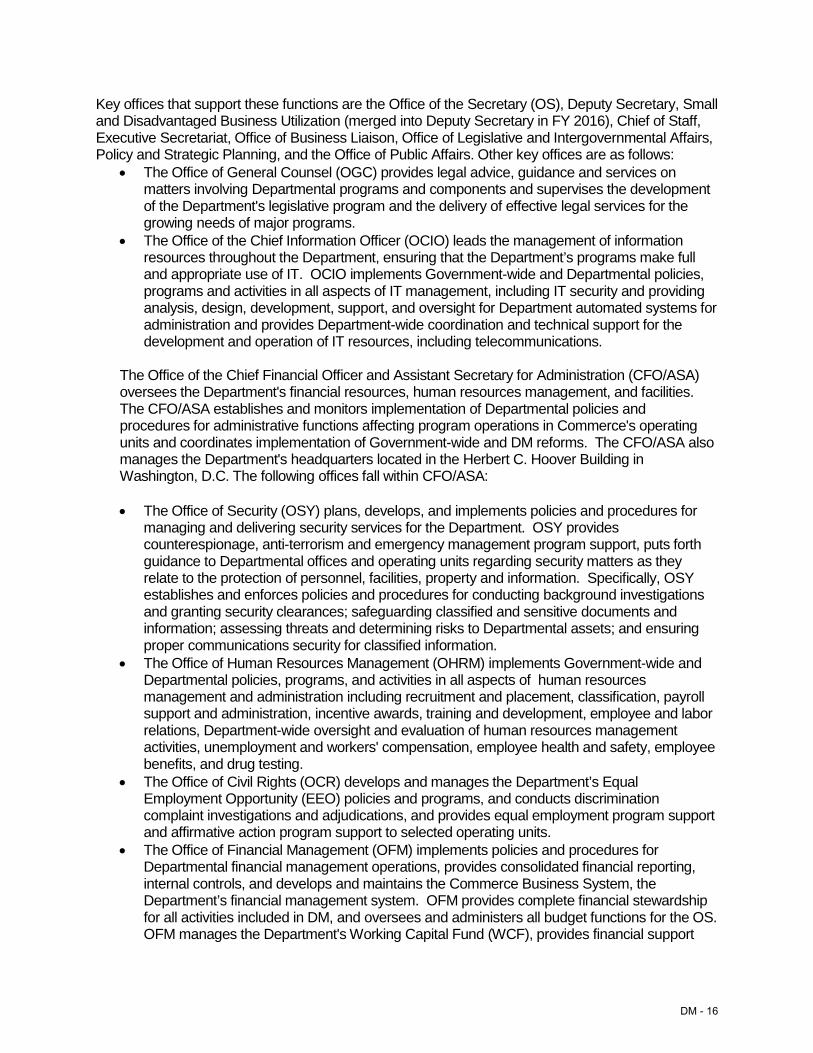
Key offices that support these functions are the Office of the Secretary (OS), Deputy Secretary, Small and Disadvantaged Business Utilization (merged into Deputy Secretary in FY 2016), Chief of Staff, Executive Secretariat, Office of Business Liaison, Office of Legislative and Intergovernmental Affairs, Policy and Strategic Planning, and the Office of Public Affairs. Other key offices are as follows: • The Office of General Counsel (OGC) provides legal advice, guidance and services on
matters involving Departmental programs and components and supervises the development of the Department's legislative program and the delivery of effective legal services for the growing needs of major programs.
• The Office of the Chief Information Officer (OCIO) leads the management of information resources throughout the Department, ensuring that the Department’s programs make full and appropriate use of IT. OCIO implements Government-wide and Departmental policies, programs and activities in all aspects of IT management, including IT security and providing analysis, design, development, support, and oversight for Department automated systems for administration and provides Department-wide coordination and technical support for the development and operation of IT resources, including telecommunications.
The Office of the Chief Financial Officer and Assistant Secretary for Administration (CFO/ASA) oversees the Department's financial resources, human resources management, and facilities. The CFO/ASA establishes and monitors implementation of Departmental policies and procedures for administrative functions affecting program operations in Commerce's operating units and coordinates implementation of Government-wide and DM reforms. The CFO/ASA also manages the Department's headquarters located in the Herbert C. Hoover Building in Washington, D.C. The following offices fall within CFO/ASA:
• The Office of Security (OSY) plans, develops, and implements policies and procedures for managing and delivering security services for the Department. OSY provides counterespionage, anti-terrorism and emergency management program support, puts forth guidance to Departmental offices and operating units regarding security matters as they relate to the protection of personnel, facilities, property and information. Specifically, OSY establishes and enforces policies and procedures for conducting background investigations and granting security clearances; safeguarding classified and sensitive documents and information; assessing threats and determining risks to Departmental assets; and ensuring proper communications security for classified information.
• The Office of Human Resources Management (OHRM) implements Government-wide and Departmental policies, programs, and activities in all aspects of human resources management and administration including recruitment and placement, classification, payroll support and administration, incentive awards, training and development, employee and labor relations, Department-wide oversight and evaluation of human resources management activities, unemployment and workers' compensation, employee health and safety, employee benefits, and drug testing.
• The Office of Civil Rights (OCR) develops and manages the Department’s Equal Employment Opportunity (EEO) policies and programs, and conducts discrimination complaint investigations and adjudications, and provides equal employment program support and affirmative action program support to selected operating units.
• The Office of Financial Management (OFM) implements policies and procedures for Departmental financial management operations, provides consolidated financial reporting, internal controls, and develops and maintains the Commerce Business System, the Department’s financial management system. OFM provides complete financial stewardship for all activities included in DM, and oversees and administers all budget functions for the OS. OFM manages the Department's Working Capital Fund (WCF), provides financial support
DM - 16

and guidance Department-wide, and provides Departmental-level management of travel, personal property and fleet motor vehicles.
• The Office of Facility and Environmental Quality (OFEQ) provides Department-level management of real property, energy, and environmental programs. OFEQ provides management of the following HCHB programs and services: publications; printing; mail; messenger and distribution services; space management and use; building management including operations, maintenance, repairs, and renovations; labor services; historic preservation; and shipping/receiving.
• The Office of Acquisition Management (OAM) develops, coordinates, and maintains the Department’s acquisition regulations, policies, and procedures. OAM provides contracting technical services, including acquisition strategies and guidance for the procurement of products and services in support of the OS, selected special projects and related administrative support. Also, OAM performs federal assistance administrative duties and responsibilities to ensure that federal assistance actions comply with Departmental procedures and manages Competitive Sourcing A-76/FAIR Act Program. OAM also develops and oversees implementation of integrated, enterprise-wide policies, procedures, and strategies for assessing and managing risk, and conducts evaluations of programs, processes, and administrative functions to identify opportunities for enhancing effectiveness and efficiency across the Department.
• The Office of Privacy and Open Government (OPOG) develops and manages Departmental compliance with privacy policies as per the Privacy Act of 1974, the E-Government Act of 2002, and the Federal Information Security Management Act. The office also coordinates the Department’s response to incidents involving personally identifiable information, administers the Departmental Freedom of Information Act (FOIA) program, administers and coordinates the Departmental transparency and open government activities, manages the Department’s numerous Federal Advisory Committee Act advisory committees, and manages the Department’s directives system and relevant Executive Orders used to prescribe the basic management structure and organizational arrangements of the Department.
• The Office of Budget's (OB) primary responsibility is helping to prepare and defend the Department's annual budget request. The Office also supports long-range planning, conducts Department-level budget execution activities, supports development of performance measures and annual performance plans, and helps bureaus implement Commerce budget procedures and policies.
SIGNIFICANT INFLATIONARY ADJUSTMENTS:
DM requests an increase of $1,362,000 and 0 FTE above the FY 2017 CR annualized level to fund inflationary adjustments for base program activities. The increase will fund the estimated 2018 Federal pay raise of 1.9 percent. The increase will also provide inflationary increases for General Pricing Level Adjustments (non-labor activities, including service contracts, utilities, field office lease payments, rent charges from the General Service Administration). In addition, this increase includes inflationary costs for the Departmental Working Capital Fund.
PROGRAM CHANGE(S):
S&E: Commerce is requesting an increase of $5,000,000 and 20 FTE for investigations and threat management activities.
DM - 17
Additionally, DM proposes a net decrease of $1,252,000 and 0 FTE. Departmental Management performed an assessment of its offices to determine where reductions. This decrease is achievable primarily due to the reduction of programmatic activities that provided businesses and communities with information about and referrals to relevant Federal, State, and local government programs.
These program changes align and support the Department’s strategic plan by providing the staffing, tools and knowledge needed to accomplish the Department’s mission, while fostering a more customer-oriented culture.
Statement of Need and Economic Benefits – Cost Benefit Analysis
The Department continues to find alternative solutions to work smarter with fewer resources while increasing efficiency with existing resources.
Performance Goals and Measurement Data:
Performance goals will continue to be met in each DM program.
DM - 18

PROGRAM CHANGE DETAIL BY OBJECT CLASS (Dollars in thousands)
Budget Program: Salaries and Expenses/Operations and Administration
FY 2018 Object Class Increase
11 Personnel compensation 11.1 Full-time permanent $2,259 11.3 Other than full-time permanent 0 11.5 Other personnel compensation 510 11.8 Special personnel services payments 0 11.9 Total personnel compensation 2,769 12 Civilian personnel benefits 1,230 13 Benefits for former personnel 0 21 Travel and transportation of persons 88 23.1 Rental payments to GSA 85 23.2 Rental Payments to others 0 23.3 Communications, utilities and miscellaneous charges 30 24 Printing and reproduction 4 25.1 Advisory and assistance services (66) 25.2 Other services (492) 25.3 Purchases of goods & services from Gov't accounts (22) 25.4 Operation and maintenance of facilities 0 25.5 Research and development contracts 0 25.6 Medical care 0 25.7 Operation and maintenance of equipment 0 25.8 Subsistence and support of persons 0 26 Supplies and materials 24 31 Equipment 98 32 Lands and structures 0 33 Investments and loans 0 41 Grants, subsidies and contributions 0 42 Insurance claims and indemnities 0 43 Interest and dividends 0 44 Refunds 0 99 Total obligations 3,748
DM - 19

Exhibit 12 – 15
APPROPRIATION ACCOUNT: Salaries and Expenses
BUDGET PROGRAM: Operations and Administration/Office of Security/ Investigations and Threat Management Division
For FY 2018, the Office of Security (OSY) requests a total of $5,000,000 and 20 FTE for the Investigations and Threat Management Expansion. This funding includes an increase of $5,000,000 and 20 FTE in S&E.
PROGRAM JUSTIFICATION:
Investigations and Threat Management Division (ITMD) Expansion Overview
ITMD cross-cuts all Commerce operating units in order to detect critical threats to the Department’s U.S. economic advancement mission, and is the sole U.S. Government agency with this focus. The program’s investigative findings directly inform key decision-makers (including senior U.S. Government and Secretarial officials) and stakeholders (NSS, ODNI, DOJ) about serious threats to national security or public safety, and enable OSY to target and refine its security services against rapidly emerging threats which would have remained unidentified by other government agencies. The program fulfills U.S. national strategic requirements involving counterintelligence, transnational organized crime, and counterterrorism.
PROGRAM CHANGE(S):
Investigations and Threat Management Division ($5,000,000, 20 FTE) An increase of $5,000,000 and 20 FTE is anticipated to address critical staffing shortfalls commensurate with workload demands from previous expansions that were never fully implemented. Additional personnel and infrastructure is expected to directly reduce risk posed by new and backlogged investigative matters and enhance ITMD’s ability to address mission-critical threats across the Department of Commerce enterprise through continued strategic investigations. The increase also devotes resources to requirements levied by Executive Order 13587 (Insider Threat), Executive Order 13773 (Transnational Organized Crime), and national strategies for counterintelligence. This program was previously in the Working Capital Fund.
Using a strategic approach to identify, assess, and manage these threats, ITMD has uncovered matters associated with the Department’s mission that went unrecognized by other government agencies. Ultimately, ongoing and anticipated casework is expected to directly decrease the ability of hostile intelligence services to exploit Departmental policy/research and weaken American competitiveness; decrease the ability of organized crime figures to divert Department objectives, corrupt markets, and destabilize U.S. geopolitical interests. Casework will also decrease the ability of persons motivated by ideological or psychologically driven violence whose unimpeded actions may result in loss of life or destruction of Department property.
Funds will be used to recruit additional Criminal Investigators (special agents) to investigate mission critical threats to the Department and its assets, to acquire contract support, to effectively upgrade the case management tool, and to refresh and modernize ITMD’s technical gear and forensic equipment. In addition, funds will be used to obtain other support materials to facilitate ITMD personnel travelling to and from the Division’s five field offices within the National Capital region and Boulder, CO.
DM - 20

Statement of Need and Economic Benefits – Cost Benefit Analysis
Preventing mission-critical threats from undermining Administration and Secretarial initiatives is key to the Department’s effective performance. Without this increase, the Department’s ability to effectively execute its mission, achieve important Administration objectives, and support United States national security interest in the near, mid, and long terms is jeopardized. Currently, 35% of ITMD’s full investigations represent a high risk to the Department per Office of Program Evaluation and Risk Management (OPERM) standards (priority management attention required, with current controls having significant uncertainties or will not prevent the specific risks), and involve consequences such as death or permanent injury, statutory or major regulatory non-compliance, financial impacts of greater than $50 million, failure to reach major Departmental goals, and reputation damaged and never fully recoverable. Also, based on historical data it is estimated that 5.1% of ITMD’s intakes and inquiries have become full investigations, which leaves up to 23 potentially high risk matters presently in inventory that have yet to be fully addressed. Of 31 investigative matters that are or could be high risk to the Department, ITMD currently has sufficient staff to fully investigate only 6 cases, which leaves 81% not being worked in a timely manner after initial triage. Based on previously uncovered matters, these threats are anticipated to have a direct impact to the Department’s major strategic interests. This enhancement directly enables Objective 5.1 of the Department’s FY1418 Strategic Plan, and indirectly supports all other Plan objectives.
Schedule and Milestones:
November 2017: Case management contract in place November 2017: Contract support in place October 2017 - April 2018: Hire and onboard five new 1811 Criminal Investigator FTEs
Deliverables:
Investigative findings Strategic threat briefings Threat management services
Performance Goals and Measurement Data:
Performance Goal: Measure 1
FY 2016 Est.
FY 2017
Target
FY 2018
Target
FY 2019
Target
FY 2020
Target
FY 2021
Target
FY 2022
Target With Change 34% 41% 48% 55% 62% Without Change 42% 49% 56% 63% 70% 77% Description: Objective is to reduce high risk to key Department activities, which at present accounts for 35% of ITMD’s overall investigative caseload. Without the additional resources requested, in FY17 ITMD will remain incapable of adequately addressing 81% of these high risk investigations. Additionally, future high risk investigations are projected to grow approximately 7% per fiscal out-year. Formula is based on a projection of the number of high risk investigative matters and ITMD’s current capacity against the enhancement.
DM - 21

PROGRAM CHANGE PERSONNEL DETAIL
Budget Program: Operations and Administration/Office of Security Sub-program: Investigations and Threat Management Division Program Change: Expansion
Number Annual Total Title: Location Grade of Positions Salary Salaries Supervisory Criminal Investigator Washington, D.C. ZA-V 1 $160,590 $160,590 Supervisory Criminal Investigator Washington, D.C. ZA-IV 1 $126,958 $126,958 Supervisory Criminal Investigator Washington, D.C. ZA-IV 1 $126,488 $126,488 Criminal Investigator Washington, D.C. ZA-IV 1 $125,147 $125,147 Criminal Investigator Washington, D.C. ZA-IV 1 $119,246 $119,246 Criminal Investigator Washington, D.C. ZA-IV 1 $117,513 $117,513 Criminal Investigator Washington, D.C. ZA-IV 1 $115,688 $115,688 Criminal Investigator Boulder, CO ZA-IV 1 $115,719 $115,719 Criminal Investigator Boulder, CO ZA-III 1 $99,940 $99,940 Criminal Investigator Washington, D.C. ZA-III 1 $103,635 $103,635 Criminal Investigator Washington, D.C. ZA-III 1 $100,736 $100,736 Criminal Investigator Washington, D.C. ZA-III 1 $93,008 $93,008 Intelligence & Research Specialist Washington, D.C. ZA-IV 1 $111,421 $111,421 Intelligence & Research Specialist Washington, D.C. ZA-IV 1 $94,797 $94,797 Security Specialist Washington, D.C. ZA-IV 1 $120,398 $120,398 Supervisory Criminal Investigator Washington, D.C. ZA-IV 2 $126,958 $253,916 Criminal Investigator Washington, D.C. ZA-IV 2 $126,958 $253,916 Criminal Investigator Washington, D.C. ZA-III 1 $90,350 $90,350
Subtotal 20 $2,329,466 Less Lapse 0 $0 Total Full-time permanent: 20 $2,329,466 2018 Pay Adjustment 1.4% $33,195 2018 Pay Banding Increases $71,825 Total 20 $2,434,486
Personnel Data Number
Full-time Equivalent Employment Full-time permanent 20 Other than full-time permanent 0 Total 20
Authorized Positions: Full-time permanent 20 Other than full-time permanent 0 Total 20
DM - 22

PROGRAM CHANGE DETAIL BY OBJECT CLASS (Dollars in thousands)
Budget Program: Operations and Administration/Office of Security Program Change: Investigations and Threat Management Division Expansion
FY 2018 Object Class Increase
11 Personnel compensation 11.1 Full-time permanent $2,434 11.3 Other than full-time permanent 0 11.5 Other personnel compensation 35 11.8 Special personnel services payments 482 11.9 Total personnel compensation 2,951 12 Civilian personnel benefits 1,284 13 Benefits for former personnel 0 21 Travel and transportation of persons 96 22 Transportation of things 33 23.1 Rental payments to GSA 85 23.2 Rental Payments to others 0 23.3 Communications, utilities and miscellaneous charges 40 24 Printing and reproduction 10 25.1 Advisory and assistance services 0 25.2 Other services 313 25.3 Purchases of goods & services from Gov't accounts 52 25.4 Operation and maintenance of facilities 0 25.5 Research and development contracts 0 25.6 Medical care 0 25.7 Operation and maintenance of equipment 0 25.8 Subsistence and support of persons 0 26 Supplies and materials 38 31 Equipment 98 32 Lands and structures 0 33 Investments and loans 0 41 Grants, subsidies and contributions 0 42 Insurance claims and indemnities 0 43 Interest and dividends 0 44 Refunds 0 99 Total obligations 5,000
DM - 23

Exhibit 12 – 15
APPROPRIATION ACCOUNT: Salaries and Expenses
BUDGET PROGRAM: Operations and Administration
For FY 2018, Departmental Management (DM) proposes a decrease of $1,252,000 and 0 FTE.
PROGRAM JUSTIFICATION:
Operations and Administration Overview
S&E Operations and Administration funding supports coordination of bureau program activities and development and implementation of the Department’s internal policies, procedures, and other administrative guidelines. Functions include the oversight, direction and coordination of the Department’s many activities and the representation of the Administration before the public, the business community, the Congress and other executive agencies and departments. This funding is also used to assist the Secretary in planning, supervising, and directing resources and programs and executing his obligations under law, providing consistency in the bureaus’ administrative operations. Activities of DM S&E relate to DOC’s Performance Goal of identifying and effectively managing human and material resources critical to the success of the Department’s strategic goals.
PROGRAM CHANGE(S):
Operations and Administration (-$1,252,000, 0 FTE) Departmental Management proposes a decrease of $1,252,000 and 0 FTE. Departmental Management performed an assessment of its offices to determine where reductions could be made. This decrease is achievable primarily due to the reduction of programmatic activities that provided businesses and communities with information about and referrals to relevant Federal, State, and local government programs.
DM - 24

PROGRAM CHANGE DETAIL BY OBJECT CLASS (Dollars in thousands)
Budget Program: Operations and Administration Program Change: Operations and Administration
FY 2018 Object Class Decrease
11 Personnel compensation 11.1 Full-time permanent $0 11.3 Other than full-time permanent 0 11.5 Other personnel compensation 0 11.8 Special personnel services payments 0 11.9 Total personnel compensation 0 12 Civilian personnel benefits 0 13 Benefits for former personnel 0 21 Travel and transportation of persons (41) 22 Transportation of things 0 23.1 Rental payments to GSA 0 23.2 Rental Payments to others 0 23.3 Communications, utilities and miscellaneous charges (10) 24 Printing and reproduction (6) 25.1 Advisory and assistance services (66) 25.2 Other services (923) 25.3 Purchases of goods & services from Gov't accounts (192) 25.4 Operation and maintenance of facilities 0 25.5 Research and development contracts 0 25.6 Medical care 0 25.7 Operation and maintenance of equipment 0 25.8 Subsistence and support of persons 0 26 Supplies and materials (14) 31 Equipment 0 32 Lands and structures 0 33 Investments and loans 0 41 Grants, subsidies and contributions 0 42 Insurance claims and indemnities 0 43 Interest and dividends 0 44 Refunds 0 99 Total obligations (1,252)
DM - 25
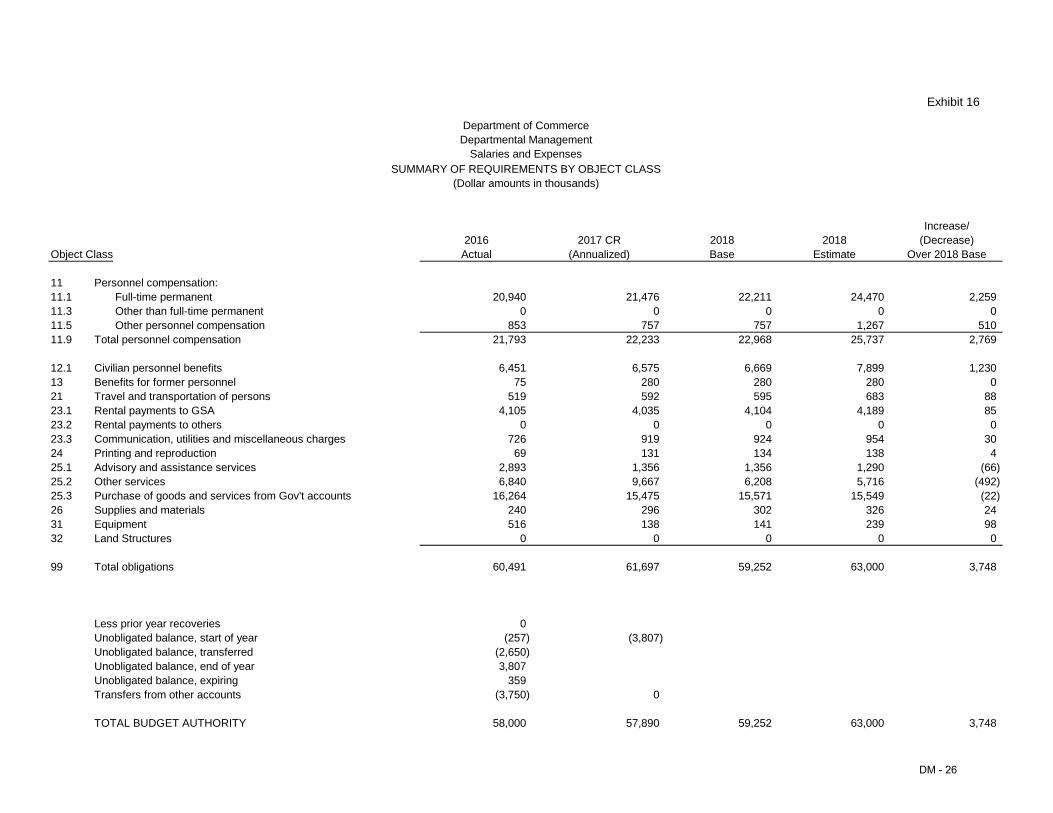
Exhibit 16
Department of Commerce Departmental Management
Salaries and Expenses
(Dollar amounts in thousands) SUMMARY OF REQUIREMENTS BY OBJECT CLASS
Object Class 2016
Actual 2017 CR
(Annualized) 2018 Base
2018 Estimate
Increase/ (Decrease)
Over 2018 Base
11 11.1 11.3 11.5 11.9
Personnel compensation: Full-time permanent Other than full-time permanent Other personnel compensation
Total personnel compensation
20,940 0
853 21,793
21,476 0
757 22,233
22,211 0
757 22,968
24,470 0
1,267 25,737
2,259 0
510 2,769
12.1 13 21 23.1 23.2 23.3 24 25.1 25.2 25.3 26 31 32
Civilian personnel benefits Benefits for former personnel Travel and transportation of persons Rental payments to GSA Rental payments to others Communication, utilities and miscellaneous charges Printing and reproduction Advisory and assistance services Other services Purchase of goods and services from Gov't accounts Supplies and materials Equipment Land Structures
6,451 75
519 4,105
0 726 69
2,893 6,840
16,264 240 516
0
6,575 280 592
4,035 0
919 131
1,356 9,667
15,475 296 138
0
6,669 280 595
4,104 0
924 134
1,356 6,208
15,571 302 141
0
7,899 280 683
4,189 0
954 138
1,290 5,716
15,549 326 239
0
1,230 0
88 85 0
30 4
(66) (492) (22) 24 98 0
99 Total obligations 60,491 61,697 59,252 63,000 3,748
Less prior year recoveries Unobligated balance, start of year Unobligated balance, transferred Unobligated balance, end of year Unobligated balance, expiring Transfers from other accounts
0 (257)
(2,650) 3,807
359 (3,750)
(3,807)
0
TOTAL BUDGET AUTHORITY 58,000 57,890 59,252 63,000 3,748
DM - 26
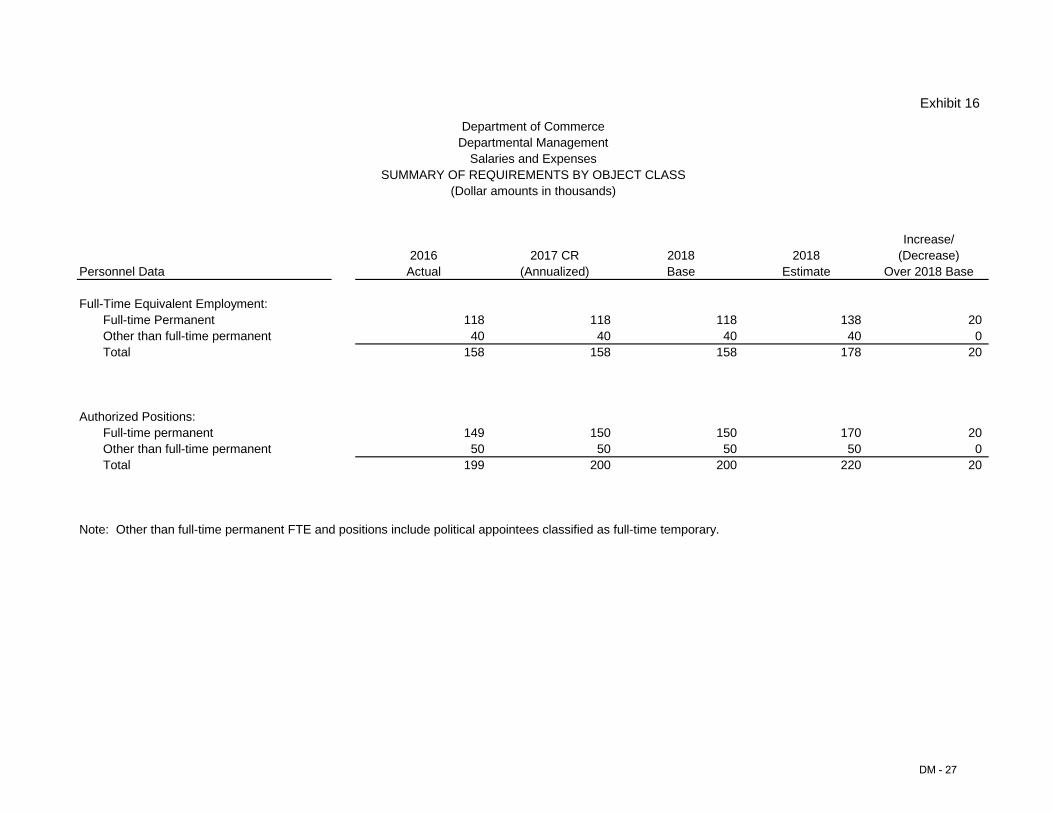
Exhibit 16
Department of Commerce Departmental Management
Salaries and Expenses SUMMARY OF REQUIREMENTS BY OBJECT CLASS
(Dollar amounts in thousands)
Increase/ 2016 2017 CR 2018 2018 (Decrease)
Personnel Data Actual (Annualized) Base Estimate Over 2018 Base
Full-Time Equivalent Employment: Full-time Permanent 118 118 118 138 20 Other than full-time permanent 40 40 40 40 0 Total 158 158 158 178 20
Authorized Positions: Full-time permanent 149 150 150 170 20 Other than full-time permanent 50 50 50 50 0 Total 199 200 200 220 20
Note: Other than full-time permanent FTE and positions include political appointees classified as full-time temporary.
DM - 27

Exhibit 32 Department of Commerce
Departmental Management Salaries and Expenses
Justification of Proposed Language Changes
For necessary expenses for the management of the Department of Commerce provided for by law, including not to exceed $4,500 for official reception and representation, [$58,000,000] $63,000,000[: Provided, That within amounts provided, the Secretary of Commerce may use up to $2,500,000 to engage in activities to provide businesses and communities with information about and referrals to relevant Federal, State, and local government programs] . Note.—A full-year 2017 appropriation for this account was not enacted at the time the budget was prepared; therefore, the budget assumes this account is operating under the Further Continuing Appropriations Act, 2017 (P.L. 114-254). The amounts included for 2017 reflect the annualized level provided by the continuing resolution.
DM - 28
Exhibit 33 Department of Commerce
Departmental Management Salaries and Expenses
Appropriation Language and Code Citations
FY 2018:
Salaries and Expenses
1. For expenses necessary for the Departmental Management of the Department of Commerce provided for by law.
15 U.S.C. 1501
15 U.S.C. 1501 provides that: "There shall be...the Department of Commerce, and a Secretary of Commerce, who shall be the head thereof…" The sections which follow 15 U.S.C. 1501 establish various Assistant Secretaries and define general powers and duties of the Department.
2. Including not to exceed $4,500 for official entertainment.
No Specific Authority
5 U.S.C. 5536 prohibits additional pay or allowance to employees unless the appropriation therefore specifically states that it is for the additional pay or allowance.
DM - 29
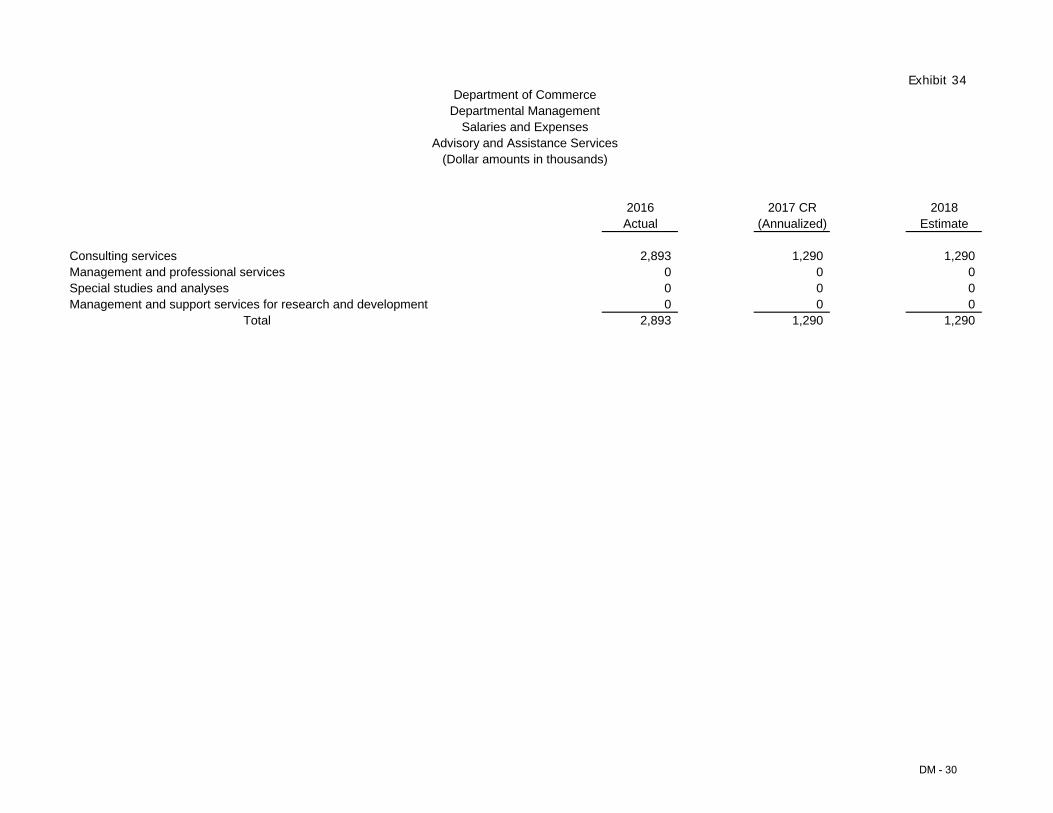
Exhibit 34 Department of Commerce
Departmental Management Salaries and Expenses
Advisory and Assistance Services (Dollar amounts in thousands)
2016 2017 CR 2018 Actual (Annualized) Estimate
Consulting services 2,893 1,290 1,290 Management and professional services 0 0 0 Special studies and analyses 0 0 0 Management and support services for research and development 0 0 0
Total 2,893 1,290 1,290
DM - 30
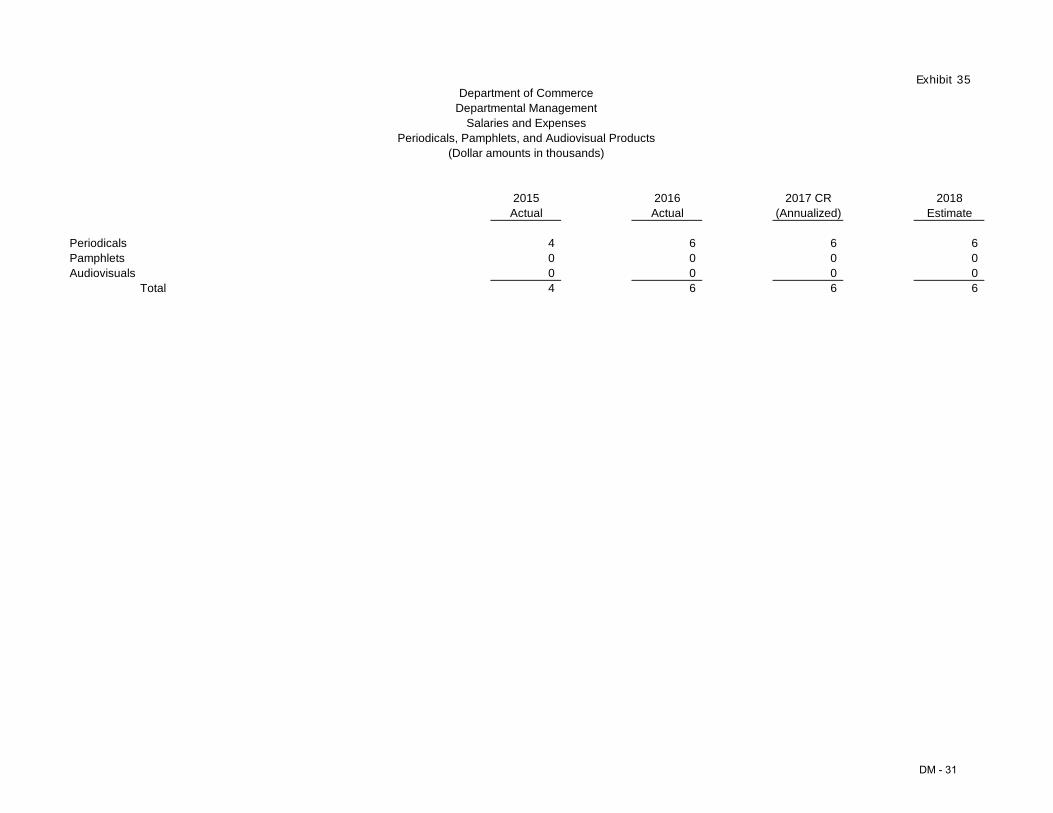
Department of Commerce Departmental Management
Salaries and Expenses Periodicals, Pamphlets, and Audiovisual Products
(Dollar amounts in thousands)
Exhibit 35
2015 Actual
2016 Actual
2017 CR (Annualized)
2018 Estimate
Periodicals Pamphlets Audiovisuals
Total
4 0 0 4
6 0 0 6
6 0 0 6
6 0 0 6
DM - 31

Exhibit 36 Department of Commerce
Departmental Management Salaries and Expenses
Average Grade and Salaries
2016 2017 CR 2018 Actual (Annualized) Estimate
Average GS/GM Grade 12.73 12.73 12.73 Average GS/GM Salary $109,910 $112,218 $114,350
DM - 32

Department of Commerce Departmental Management
Renovation and Modernization SUMMARY OF RESOURCE REQUIREMENTS
(Dollar amounts in thousands)
Exhibit 5
2017 CR (Annualized) less: Obligations from prior years less: 2018 Adjustment to Base
2018 Base
Positions 5
0 5
FTE 5
0 5
Budget Authority
19,026 0
(18,026) 1,000
Direct Obligations
19,026 (635)
(17,391) 1,000
plus: 2018 Program Changes 2018 Estimate
0 5
0 5
0 1,000
0 1,000
Comparison by activity:
2016 Actual
Personnel Amount
2017 CR (Annualized)
Personnel Amount
2018 Base
Personnel Amount
2018 Estimate
Personnel Amount
Increase/(Decrease) Over 2018 Base
Personnel Amount
HCHB Renovation Pos./BA FTE/Obl.
5 5
19,062 19,497
5 5
19,026 19,661
5 5
1,000 1,000
5 5
1,000 1,000
0 0
0 0
TOTALS Pos./BA FTE/Obl.
5 5
19,062 19,497
5 5
19,026 19,661
5 5
1,000 1,000
5 5
1,000 1,000
0 0
0 0
Adjustments to Obligations: Recoveries Unobligated balance, start of year Unobligated balance, end of year
(197) (873) 635
(635)
Financing from Transfers: Transfer from other accounts (-) Transfer to other accounts (+)
Appropriation 19,062 19,026 1,000 1,000 0
DM - 33

[This page intentionally left blank]
DM - 34
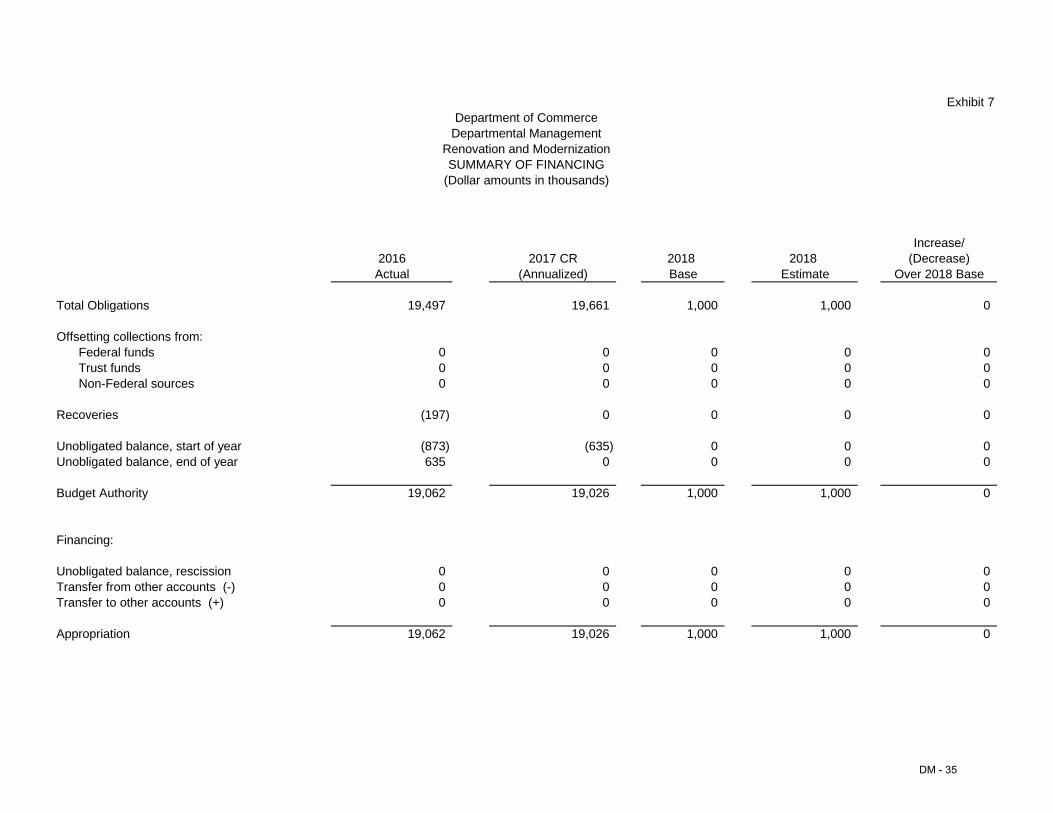
Exhibit 7 Department of Commerce
Departmental Management Renovation and Modernization SUMMARY OF FINANCING
(Dollar amounts in thousands)
Increase/ 2016 2017 CR 2018 2018 (Decrease)
Actual (Annualized) Base Estimate Over 2018 Base
Total Obligations 19,497 19,661 1,000 1,000 0
Offsetting collections from: Federal funds 0 0 0 0 0 Trust funds 0 0 0 0 0 Non-Federal sources 0 0 0 0 0
Recoveries (197) 0 0 0 0
Unobligated balance, start of year (873) (635) 0 0 0 Unobligated balance, end of year 635 0 0 0 0
Budget Authority 19,062 19,026 1,000 1,000 0
Financing:
Unobligated balance, rescission 0 0 0 0 0 Transfer from other accounts (-) 0 0 0 0 0 Transfer to other accounts (+) 0 0 0 0 0
Appropriation 19,062 19,026 1,000 1,000 0
DM - 35

Exhibit 9 Department of Commerce
Departmental Management Renovation and Modernization
JUSTIFICATION OF ADJUSTMENTS TO BASE (Dollar amounts in thousands)
FTE Amount Adjustments:
Non-recurring Construction Costs 0 (18,049) * Note: Due to the nature of the renovation and modernization phases, each year this account has non-recurring construction
program costs. Only the personnel funding will be retained in the base.
Other Changes:
Pay Raises 18
Annualization of FY 2017 Pay Raise Pay raise of 2.1% effective January 1, 2017.
Total cost in FY 2018 of the FY 2017 pay increase 15,750 Less amount requested in FY 2017 (9,000)
Amount requested in FY 2018 for FY 2017 pay increase 6,750
FY 2018 Pay Raise A general pay raise of 1.9% is assumed to be effective January 1, 2018.
Total cost in FY 2018 of pay increase 11,000 Amount requested in FY 2018 for FY 2018 pay increase 11,000
Health Insurance 1 Effective January 2016, the cost of the U.S. Government's contribution to the Federal employee's health insurance premium increased by 5.2%. Applied against the FY 2017 estimate of $27,000 the additional amount required is $1,404.
General Pricing Level Adjustment 4
This request applies OMB economic assumptions for FY 2018 of 2.0% to sub-object classes where the prices that the Government pays are established through the market system. Factors are applied to other services, ($3,980).
Subtotal, Other Changes 0 23
Total FY 2018 Adjustments to Base 0 (18,026)
DM - 36
DM - 37
Exhibit 10
Department of Commerce Departmental Management
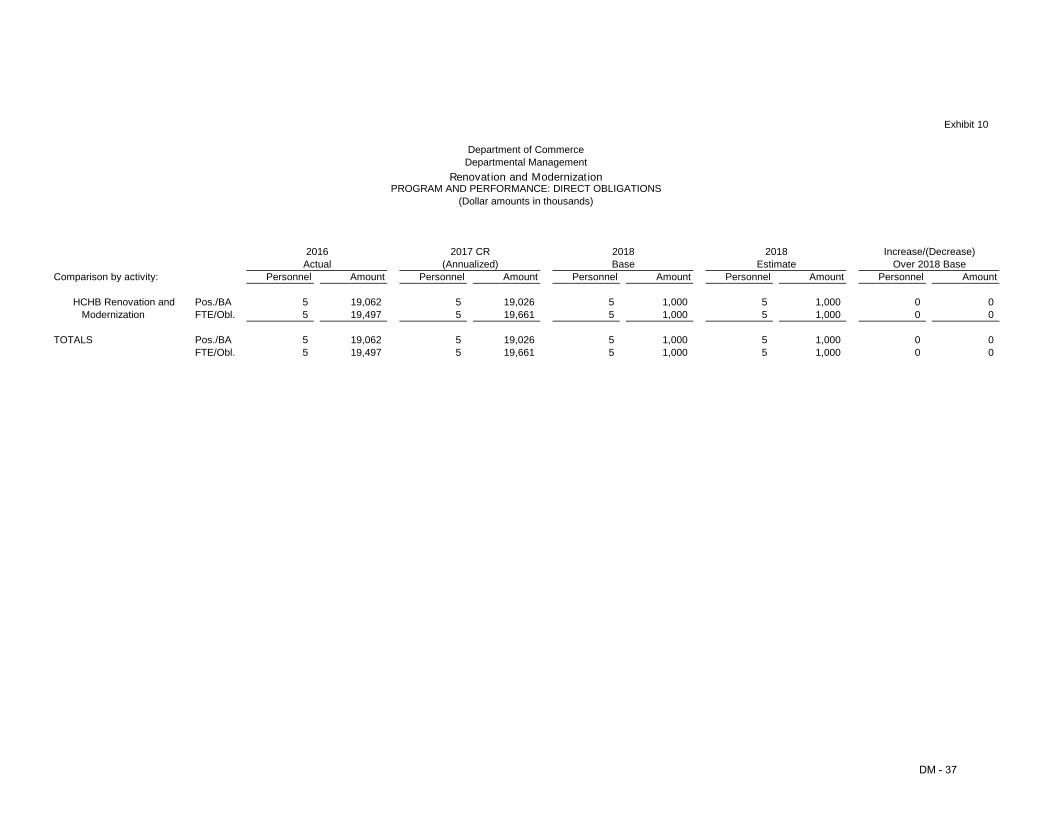
Renovation and Modernization PROGRAM AND PERFORMANCE: DIRECT OBLIGATIONS
(Dollar amounts in thousands)
Comparison by activity:
2016 Actual
Personnel Amount
2017 CR (Annualized)
Personnel Amount
2018 Base
Personnel Amount
2018 Estimate
Personnel Amount
Increase/(Decrease) Over 2018 Base
Personnel Amount
HCHB Renovation and Modernization
Pos./BA FTE/Obl.
5 5
19,062 19,497
5 5
19,026 19,661
5 5
1,000 1,000
5 5
1,000 1,000
0 0
00
TOTALS Pos./BA FTE/Obl.
5 5
19,062 19,497
5 5
19,026 19,661
5 5
1,000 1,000
5 5
1,000 1,000
0 0
0 0
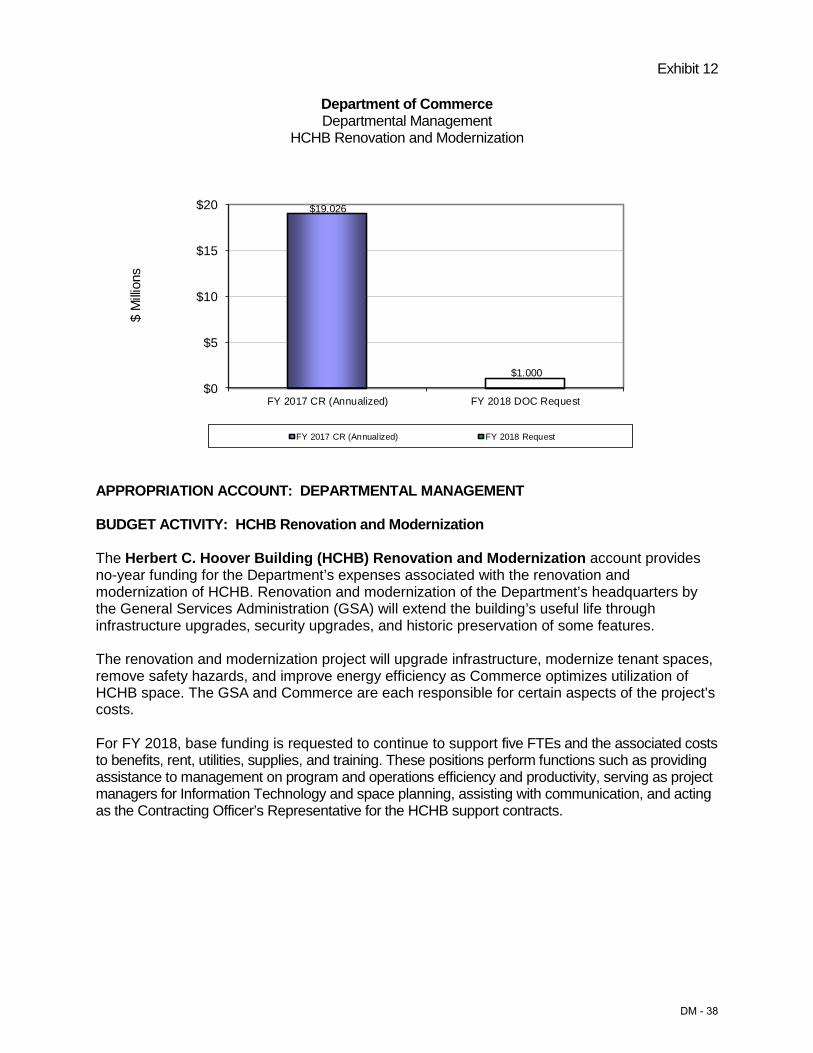
Exhibit 12
Department of Commerce Departmental Management
HCHB Renovation and Modernization $
Milli
ons
$20
$15
$10
$5
$0
$19.026
$1.000
FY 2017 CR (Annualized) FY 2018 DOC Request
FY 2017 CR (Annualized) FY 2018 Request
APPROPRIATION ACCOUNT: DEPARTMENTAL MANAGEMENT
BUDGET ACTIVITY: HCHB Renovation and Modernization
The Herbert C. Hoover Building (HCHB) Renovation and Modernization account provides no-year funding for the Department’s expenses associated with the renovation and modernization of HCHB. Renovation and modernization of the Department’s headquarters by the General Services Administration (GSA) will extend the building’s useful life through infrastructure upgrades, security upgrades, and historic preservation of some features.
The renovation and modernization project will upgrade infrastructure, modernize tenant spaces, remove safety hazards, and improve energy efficiency as Commerce optimizes utilization of HCHB space. The GSA and Commerce are each responsible for certain aspects of the project's costs.
For FY 2018, base funding is requested to continue to support five FTEs and the associated costs to benefits, rent, utilities, supplies, and training. These positions perform functions such as providing assistance to management on program and operations efficiency and productivity, serving as project managers for Information Technology and space planning, assisting with communication, and acting as the Contracting Officer’s Representative for the HCHB support contracts.
DM - 38
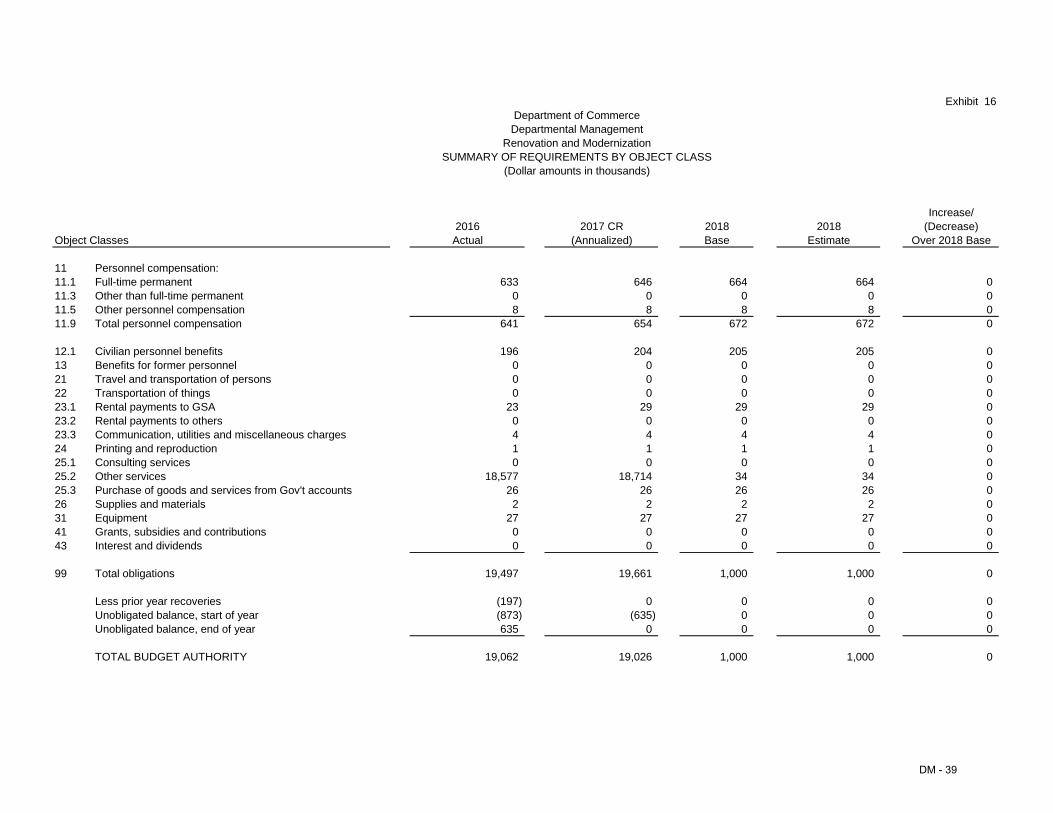
Exhibit 16 Department of Commerce Departmental Management
Renovation and Modernization SUMMARY OF REQUIREMENTS BY OBJECT CLASS
(Dollar amounts in thousands)
Object Classes 2016 Actual
2017 CR (Annualized)
2018 Base
2018 Estimate
Increase/ (Decrease)
Over 2018 Base
11 11.1 11.3 11.5 11.9
Personnel compensation: Full-time permanent Other than full-time permanent Other personnel compensation Total personnel compensation
633 0 8
641
646 0 8
654
664 0 8
672
664 0 8
672
0 0 0 0
12.1 13 21 22 23.1 23.2 23.3 24 25.1 25.2 25.3 26 31 41 43
Civilian personnel benefits Benefits for former personnel Travel and transportation of persons Transportation of things Rental payments to GSA Rental payments to others Communication, utilities and miscellaneous charges Printing and reproduction Consulting services Other services Purchase of goods and services from Gov't accounts Supplies and materials Equipment Grants, subsidies and contributions Interest and dividends
196 0 0 0
23 0 4 1 0
18,577 26 2
27 0 0
204 0 0 0
29 0 4 1 0
18,714 26 2
27 0 0
205 0 0 0
29 0 4 1 0
34 26 2
27 0 0
205 0 0 0
29 0 4 1 0
34 26 2
27 0 0
0 0 0 0 0 0 0 0 0 0 0 0 0 0 0
99 Total obligations 19,497 19,661 1,000 1,000 0
Less prior year recoveries Unobligated balance, start of year Unobligated balance, end of year
(197) (873) 635
0 (635)
0
0 0 0
0 0 0
0 0 0
TOTAL BUDGET AUTHORITY 19,062 19,026 1,000 1,000 0
DM - 39

Exhibit 16 Department of Commerce
Departmental Management Renovation and Modernization
SUMMARY OF REQUIREMENTS BY OBJECT CLASS (Dollar amounts in thousands)
Increase/ 2016 2017 CR 2018 2018 (Decrease)
Personnel Data Actual (Annualized) Base Estimate Over 2018 Base
Full-Time Equivalent Employment: Full-time permanent 5 5 5 5 0 Other than full-time permanent 0 0 0 0 0 Total 5 5 5 5 0
DM - 40
Authorized Positions: Full-time permanent 5 5 5 5 0 Other than full-time permanent 0 0 0 0 0 Total 5 5 5 5 0
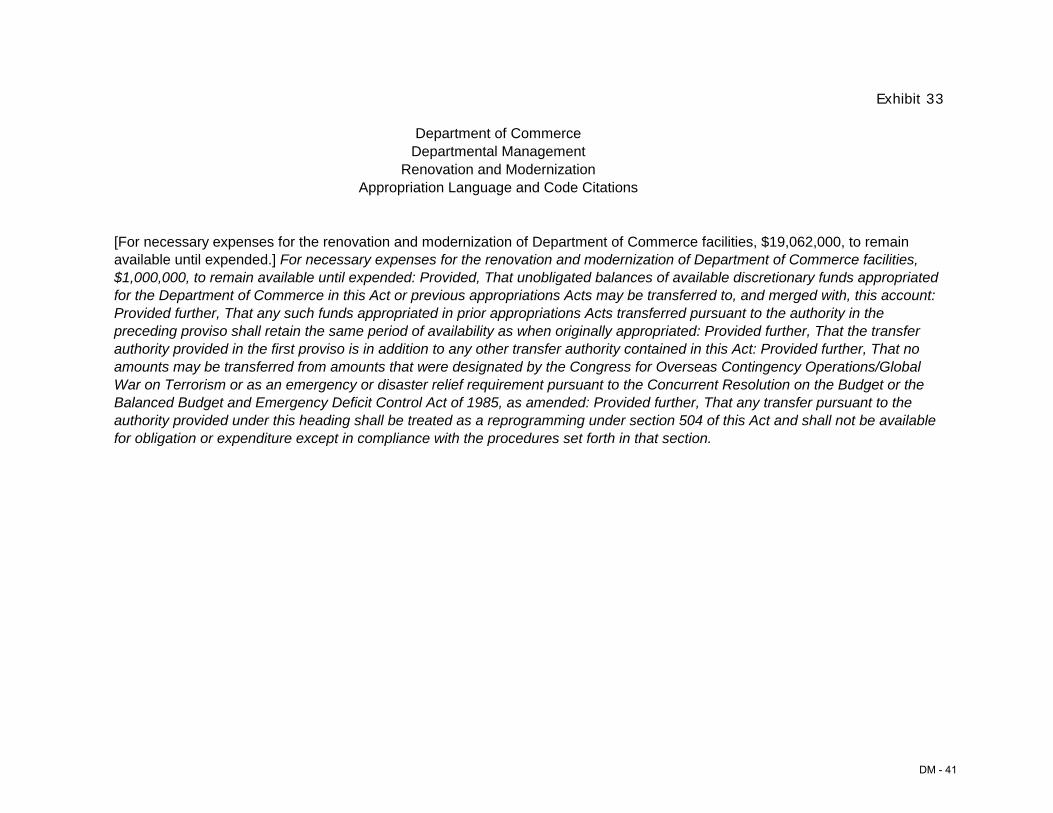
Exhibit 33
Department of Commerce Departmental Management
Renovation and Modernization Appropriation Language and Code Citations
[For necessary expenses for the renovation and modernization of Department of Commerce facilities, $19,062,000, to remain available until expended.] For necessary expenses for the renovation and modernization of Department of Commerce facilities, $1,000,000, to remain available until expended: Provided, That unobligated balances of available discretionary funds appropriated for the Department of Commerce in this Act or previous appropriations Acts may be transferred to, and merged with, this account: Provided further, That any such funds appropriated in prior appropriations Acts transferred pursuant to the authority in the preceding proviso shall retain the same period of availability as when originally appropriated: Provided further, That the transfer authority provided in the first proviso is in addition to any other transfer authority contained in this Act: Provided further, That no amounts may be transferred from amounts that were designated by the Congress for Overseas Contingency Operations/Global War on Terrorism or as an emergency or disaster relief requirement pursuant to the Concurrent Resolution on the Budget or the Balanced Budget and Emergency Deficit Control Act of 1985, as amended: Provided further, That any transfer pursuant to the authority provided under this heading shall be treated as a reprogramming under section 504 of this Act and shall not be available for obligation or expenditure except in compliance with the procedures set forth in that section.
DM - 41
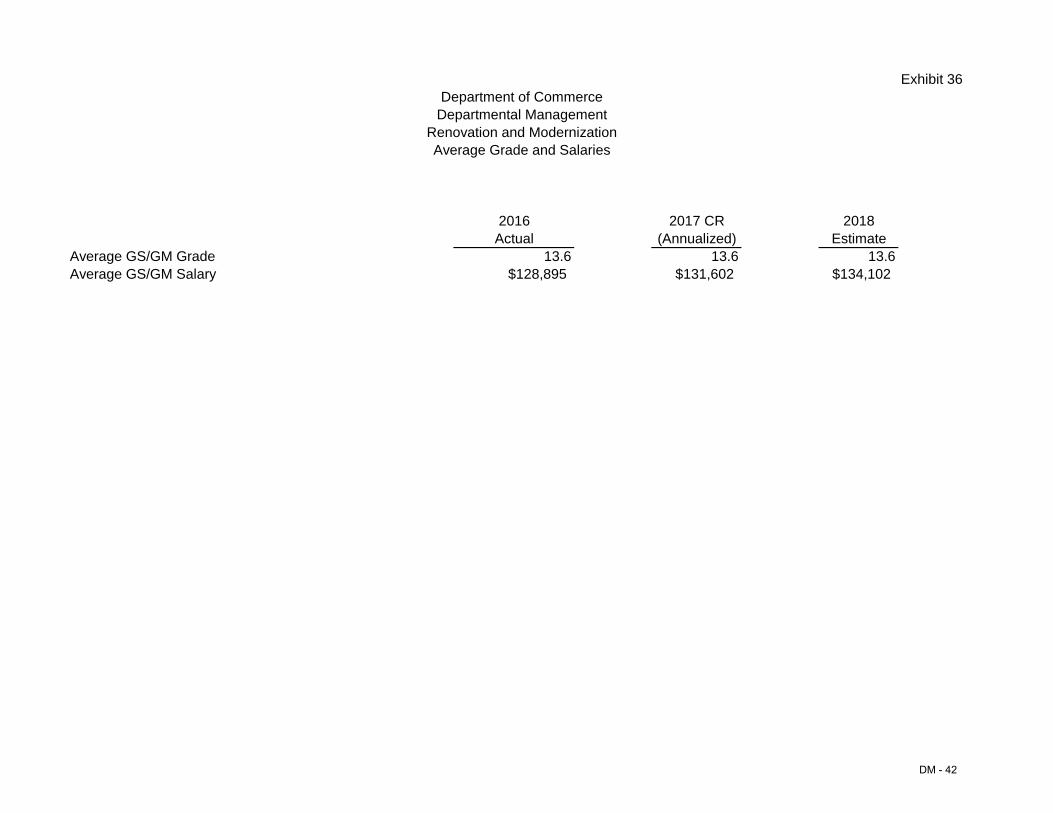
Exhibit 36 Department of Commerce
Departmental Management Renovation and Modernization Average Grade and Salaries
2016 2017 CR 2018 Actual (Annualized) Estimate
Average GS/GM Grade 13.6 13.6 13.6 Average GS/GM Salary $128,895 $131,602 $134,102
DM - 42
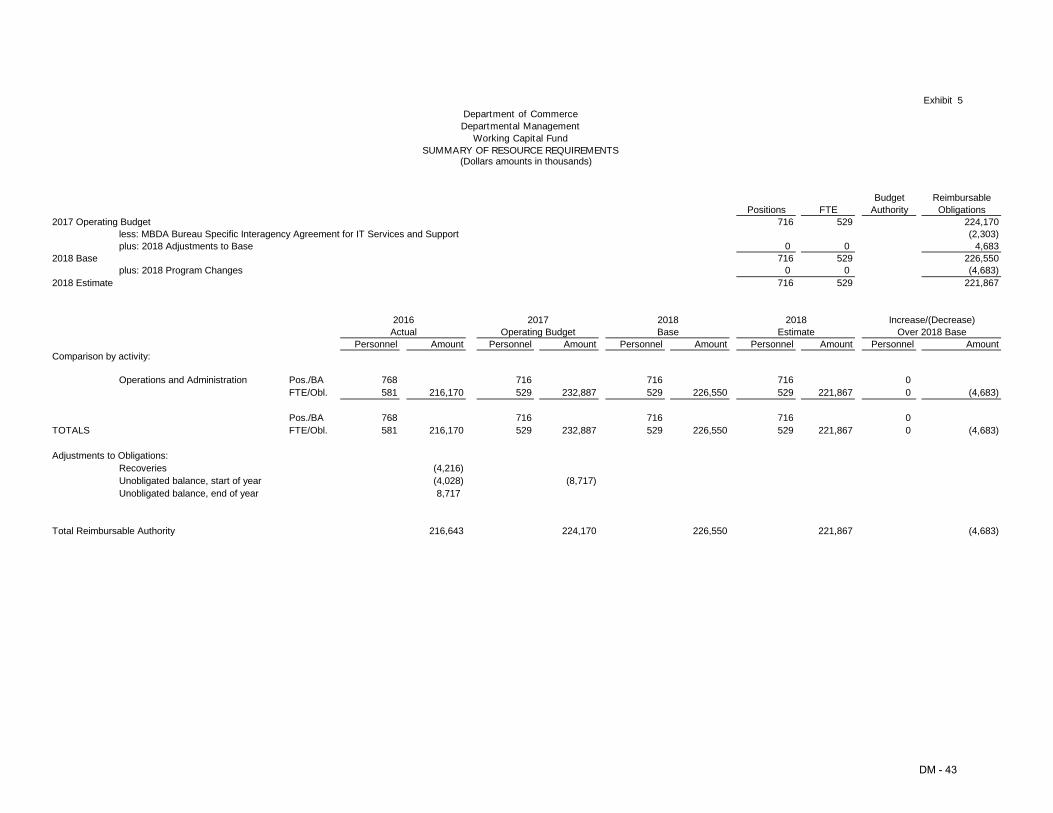
Department of Commerce Departmental Management
Working Capital Fund SUMMARY OF RESOURCE REQUIREMENTS
(Dollars amounts in thousands)
Exhibit 5
2017 Operating Budget less: MBDA Bureau Specific Interagency Agreement for IT Services and Support plus: 2018 Adjustments to Base
2018 Base plus: 2018 Program Changes
2018 Estimate
Positions 716
0 716
0 716
FTE 529
0 529
0 529
Budget Authority
Reimbursable Obligations
224,170 (2,303)
4,683 226,550 (4,683)
221,867
Comparison by activity:
2016 Actual
Personnel Amount
2017 Operating Budget
Personnel Amount
2018 Base
Personnel Amount
2018 Estimate
Personnel Amount
Increase/(Decrease) Over 2018 Base
Personnel Amount
Operations and Administration Pos./BA FTE/Obl.
768 581 216,170
716 529 232,887
716 529 226,550
716 529 221,867
0 0 (4,683)
TOTALS Pos./BA FTE/Obl.
768 581 216,170
716 529 232,887
716 529 226,550
716 529 221,867
0 0 (4,683)
Adjustments to Obligations: Recoveries Unobligated balance, start of year Unobligated balance, end of year
(4,216) (4,028) 8,717
(8,717)
Total Reimbursable Authority 216,643 224,170 226,550 221,867 (4,683)
DM - 43

[This page intentionally left blank.]
DM - 44

Department of Commerce Departmental Management
Working Capital Fund JUSTIFICATION OF ADJUSTMENTS TO BASE
(Dollar amounts in thousands)
Exhibit 9
Adjustments:
Minority Business Development Agency (MBDA) Interagency Agreement (IAA): Bureau specific IT Services and Support. These services will no longer be needed by MBDA due to its proposed termination.
Other Changes: Pay Raise
Annualization of FY 2017 Pay Raise The 2017 President's Budget assumed a pay raise of 1.6% effective Jan. 1, 2017. The 2017 pay raise has been increased from 1.6% to 2.1% effective Jan. 1, 2017.
Total cost in FY 2018 of the FY 2017 pay increase 1,935,500 Less amount requested in FY 2017 (1,106,000)
Amount requested in FY 2018 for FY 2017 pay increase 829,500
FTE
0
Amount
(2,303)
2,163
FY 2018 Pay Raise A general pay raise of 1.9% is assumed to be effective Jan. 1, 2018.
Total cost in FY 2018 of pay increase Amount requested in FY 2018 for FY 2018 pay increase
1,333,000 1,333,000
DM - 45

Exhibit 9 Department of Commerce
Departmental Management Working Capital Fund
JUSTIFICATION OF ADJUSTMENTS TO BASE (Dollar amounts in thousands)
FTE Amount Adjustments:
Civil Service Retirement System (CSRS) ... (72) The cost of agency contributions for CSRS will decrease due to the decrease in the number of employees covered by CSRS from 6.6% in FY 2017 to 5.1% in FY 2018 for regular employees. The contribution rate will remain the same at 7% for regular employees.
Regular: FY 2018 ($68,139,305 x .051 x .07) 243,257 FY 2017 ($68,139,305 x .066 x .07) 314,804
Total adjustment to base (71,547)
Federal Employees' Retirement System (FERS) ... The cost of agency contributions for FERS will increase due to the increase in the number of employees covered by FERS from 93.4% in FY 2017 to 94.9% in FY 2018 for regular employees. The estimated percentage of payroll for law enforcement employees covered by FERS will remain the same in FY 2018. The contribution rate will remain the same 13.7% for regular employees and 30.1% for law enforcement employees.
Regular: FY 2018 ($68,139,305 x .949 x .137) 8,858,995 FY 2017 ($68,139,305 x .934 x .137) 8,718,969
Total adjustment to base 140,026 Law Enforcement:
FY 2018 ($2,643,695 x 1.0 x .301) 795,752 FY 2017 ($2,643,695 x 1.0 x .301) 795,752
Total adjustment to base 0
Total adjustment to base 140,026
DM - 46
140
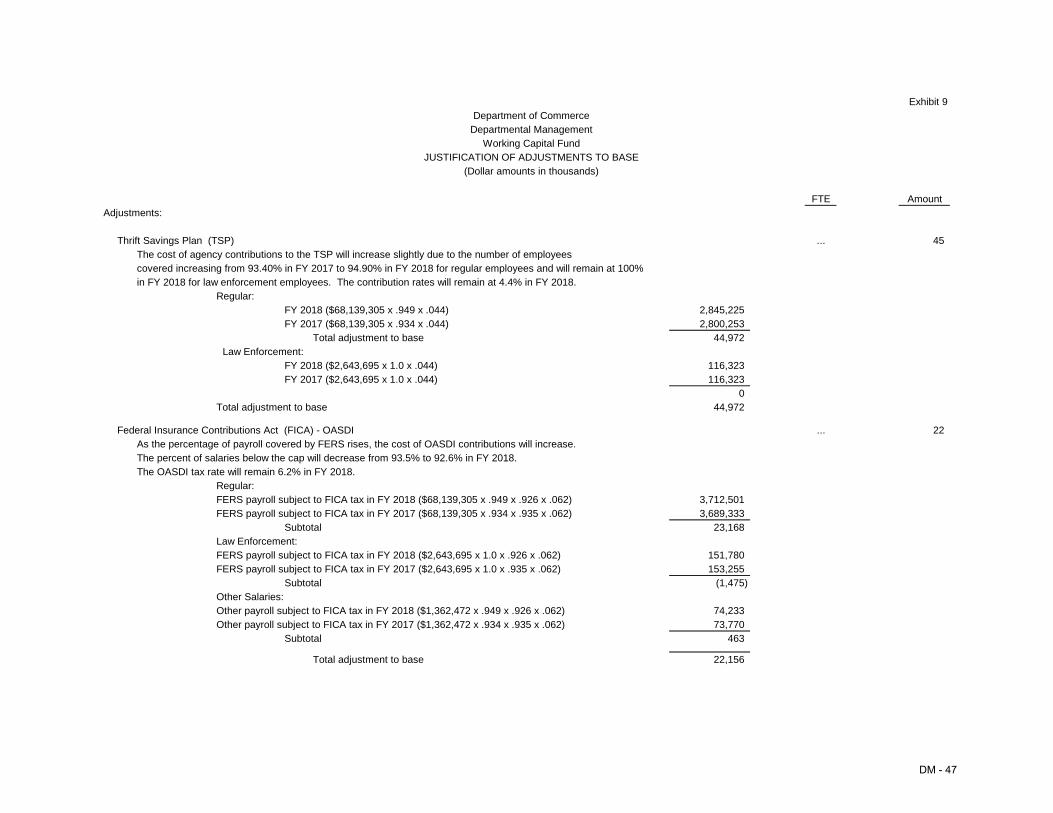
Exhibit 9 Department of Commerce
Departmental Management Working Capital Fund
JUSTIFICATION OF ADJUSTMENTS TO BASE (Dollar amounts in thousands)
FTE Amount Adjustments:
Thrift Savings Plan (TSP) ... 45 The cost of agency contributions to the TSP will increase slightly due to the number of employees covered increasing from 93.40% in FY 2017 to 94.90% in FY 2018 for regular employees and will remain at 100% in FY 2018 for law enforcement employees. The contribution rates will remain at 4.4% in FY 2018.
Regular: FY 2018 ($68,139,305 x .949 x .044) 2,845,225 FY 2017 ($68,139,305 x .934 x .044) 2,800,253
Total adjustment to base 44,972 Law Enforcement:
FY 2018 ($2,643,695 x 1.0 x .044) 116,323 FY 2017 ($2,643,695 x 1.0 x .044) 116,323
0 Total adjustment to base 44,972
Federal Insurance Contributions Act (FICA) - OASDI ... 22 As the percentage of payroll covered by FERS rises, the cost of OASDI contributions will increase. The percent of salaries below the cap will decrease from 93.5% to 92.6% in FY 2018. The OASDI tax rate will remain 6.2% in FY 2018.
Regular: FERS payroll subject to FICA tax in FY 2018 ($68,139,305 x .949 x .926 x .062) 3,712,501 FERS payroll subject to FICA tax in FY 2017 ($68,139,305 x .934 x .935 x .062) 3,689,333
Subtotal 23,168 Law Enforcement: FERS payroll subject to FICA tax in FY 2018 ($2,643,695 x 1.0 x .926 x .062) 151,780 FERS payroll subject to FICA tax in FY 2017 ($2,643,695 x 1.0 x .935 x .062) 153,255
Subtotal (1,475) Other Salaries: Other payroll subject to FICA tax in FY 2018 ($1,362,472 x .949 x .926 x .062) 74,233 Other payroll subject to FICA tax in FY 2017 ($1,362,472 x .934 x .935 x .062) 73,770
Subtotal 463
Total adjustment to base 22,156
DM - 47
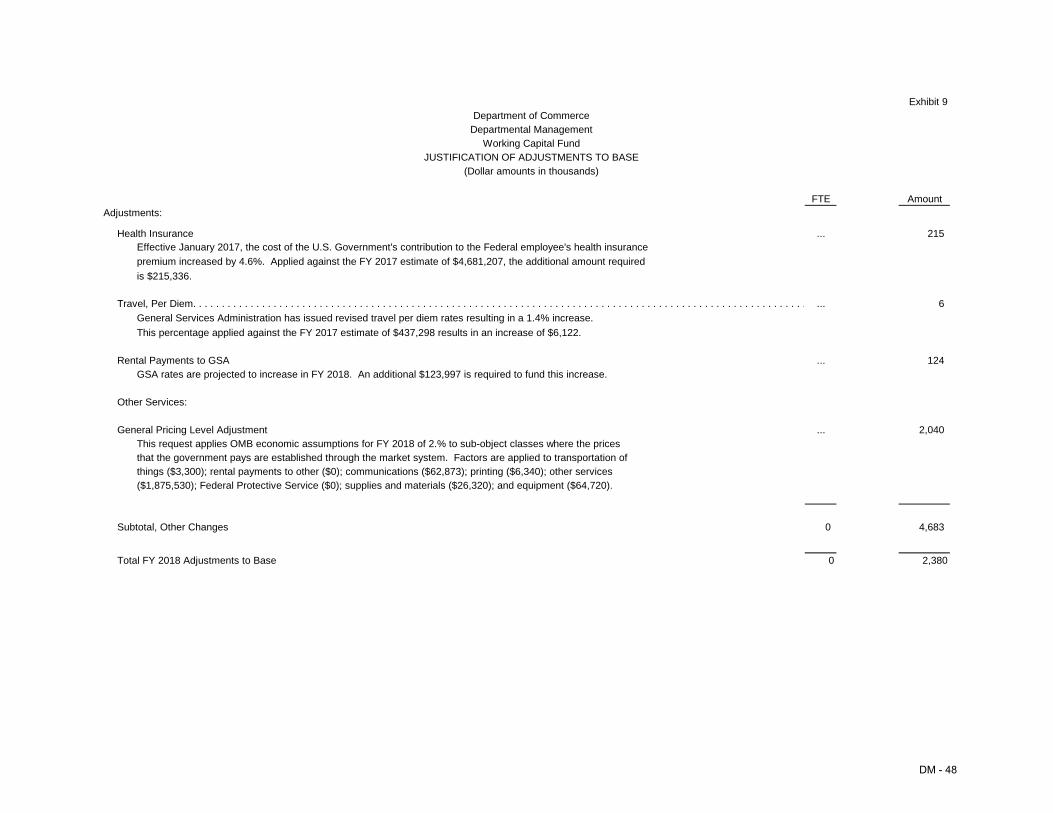
Exhibit 9 Department of Commerce
Departmental Management Working Capital Fund
JUSTIFICATION OF ADJUSTMENTS TO BASE (Dollar amounts in thousands)
FTE Amount Adjustments:
Health Insurance ... 215 Effective January 2017, the cost of the U.S. Government's contribution to the Federal employee's health insurance premium increased by 4.6%. Applied against the FY 2017 estimate of $4,681,207, the additional amount required is $215,336.
Travel, Per Diem. . . . . . . . . . . . . . . . . . . . . . . . . . . . . . . . . . . . . . . . . . . . . . . . . . . . . . . . . . . . . . . . . . . . . . . . . . . . . . . . . . . . . . . . . . . . . . . . . . . . . . . . . . . ... 6 General Services Administration has issued revised travel per diem rates resulting in a 1.4% increase. This percentage applied against the FY 2017 estimate of $437,298 results in an increase of $6,122.
Rental Payments to GSA ... 124 GSA rates are projected to increase in FY 2018. An additional $123,997 is required to fund this increase.
Other Services:
General Pricing Level Adjustment ... 2,040 This request applies OMB economic assumptions for FY 2018 of 2.% to sub-object classes where the prices that the government pays are established through the market system. Factors are applied to transportation of things ($3,300); rental payments to other ($0); communications ($62,873); printing ($6,340); other services ($1,875,530); Federal Protective Service ($0); supplies and materials ($26,320); and equipment ($64,720).
Subtotal, Other Changes 0 4,683
Total FY 2018 Adjustments to Base 0 2,380
DM - 48
$ M
illion
s
$250
$200
$150
$100
$50
$0
Exhibit 12 – 15
Department of Commerce Departmental Management
Working Capital Fund 224.170 221.867
FY 2017 Operating Budget FY 2018 DOC Request
FY 2017 Operating Budget FY 2018 Request
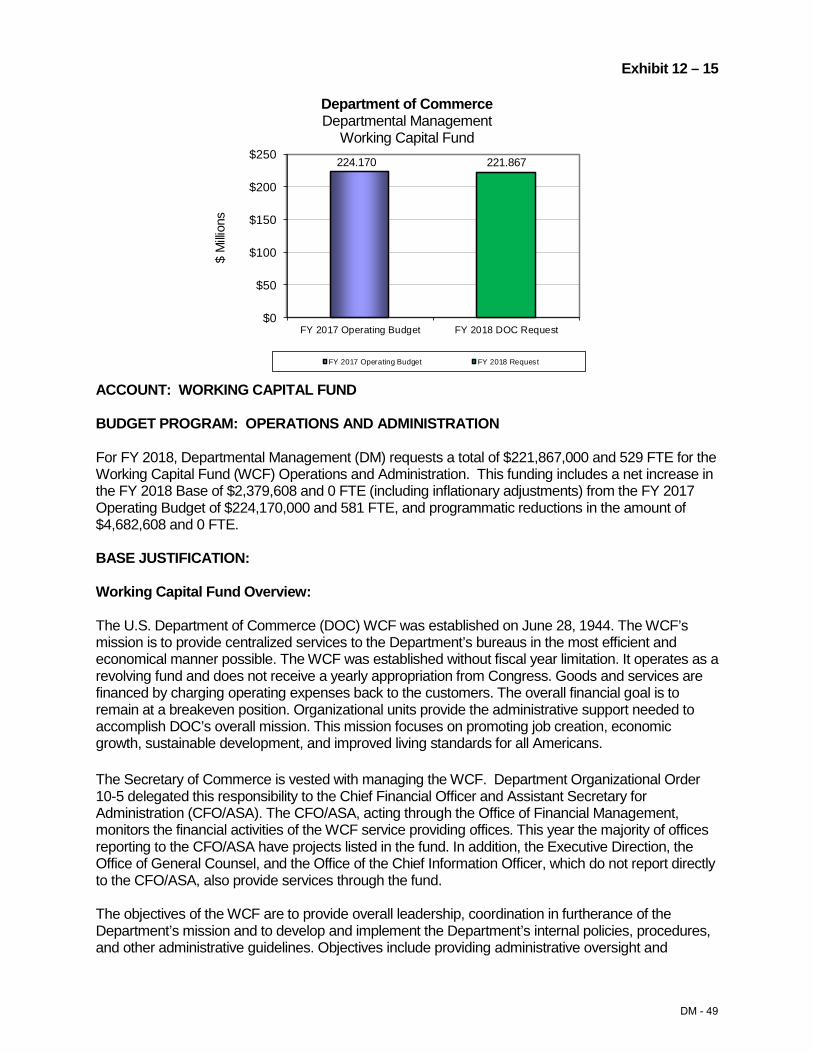
ACCOUNT: WORKING CAPITAL FUND
BUDGET PROGRAM: OPERATIONS AND ADMINISTRATION
For FY 2018, Departmental Management (DM) requests a total of $221,867,000 and 529 FTE for the Working Capital Fund (WCF) Operations and Administration. This funding includes a net increase in the FY 2018 Base of $2,379,608 and 0 FTE (including inflationary adjustments) from the FY 2017 Operating Budget of $224,170,000 and 581 FTE, and programmatic reductions in the amount of $4,682,608 and 0 FTE.
BASE JUSTIFICATION:
Working Capital Fund Overview:
The U.S. Department of Commerce (DOC) WCF was established on June 28, 1944. The WCF’s mission is to provide centralized services to the Department’s bureaus in the most efficient and economical manner possible. The WCF was established without fiscal year limitation. It operates as a revolving fund and does not receive a yearly appropriation from Congress. Goods and services are financed by charging operating expenses back to the customers. The overall financial goal is to remain at a breakeven position. Organizational units provide the administrative support needed to accomplish DOC’s overall mission. This mission focuses on promoting job creation, economic growth, sustainable development, and improved living standards for all Americans.
The Secretary of Commerce is vested with managing the WCF. Department Organizational Order 10-5 delegated this responsibility to the Chief Financial Officer and Assistant Secretary for Administration (CFO/ASA). The CFO/ASA, acting through the Office of Financial Management, monitors the financial activities of the WCF service providing offices. This year the majority of offices reporting to the CFO/ASA have projects listed in the fund. In addition, the Executive Direction, the Office of General Counsel, and the Office of the Chief Information Officer, which do not report directly to the CFO/ASA, also provide services through the fund.
The objectives of the WCF are to provide overall leadership, coordination in furtherance of the Department’s mission and to develop and implement the Department’s internal policies, procedures, and other administrative guidelines. Objectives include providing administrative oversight and
DM - 49
operational support in the recruitment, training, retention, and management of a diverse and highly effective workforce with the skills and abilities required to achieve the Department’s mission. In addition, the WCF provides administrative oversight and operational support to ensure effective management of fiscal resources and business processes by which the Department carries out its responsibilities and providing administrative oversight and operational support to ensure the effective management and security of the facilities and property used to administer the Department’s programs.
The services are provided by: The Office of General Counsel (OGC); Executive Direction; Office of the Chief Information Officer (OCIO); Office of Human Resources Management (OHRM); Office of Civil Rights (OCR); Office of Financial Management (OFM); Office of Acquisition Management (OAM); Office of Privacy and Open Government (OPOG); Office of Security (OSY); Enterprise Services (ES) and Office of Facilities and Environmental Quality (OFEQ).
A key focus of the Operational Excellence section of the Department of Commerce’s (DOC) FY 2014 - 2018 Strategic Plan is to ensure that customers across DOC have access to high quality mission enabling services in the core functional areas of Human Resources (HR), Acquisition, Financial Management (FM), and Information Technology (IT). The Department’s Management Council (DMC) has evaluated alternative governance and service delivery models for mission enabling services and identified Enterprise Services as a best practice and effective strategy for improving these services across the Department.
Significant Adjustments-to-Base (ATBs):
DM requests an increase of $4,682,608 and 0 FTE above the FY 2017 CR annualized level to fund inflationary adjustments for base program activities. The increase will fund the estimated 2018 Federal pay raise of 1.9 percent and increases for non-labor activities, including service contracts, utilities and rent charges from the General Service Administration. The ATBs will be offset by program reductions within the WCF account.
PROGRAM CHANGE FOR FY 2018: Program Reductions (Program Change: 0 FTE (0 POS) and -$4.683 million): Departmental Management proposes a decrease of $4.7 million and 0 FTE to fund the Adjustments to Base. The reductions include filling positions at lower grades, reducing contracts, supplies and overtime.
Proposed Actions:
A reduction of $4.7 million and 0 FTE is being proposed. As the Department continues to find alternative solutions to work smarter with less while increasing efficiency with existing resources, Departmental Management assessed priorities and programs to identify areas for reduction. A review of the organization’s activities along with prioritization of functions was made resulting in identification of areas for reduction. The reductions include vacancies left unfilled (but not removed – may be filled at a later date depending on greatest need), filling positions at lower grades, reduction of travel expenses, reduction of supplies and equipment, and reducing non-critical contracts such as administrative support and technical support.
Statement of Need and Economic Benefits:
The benefits to these reductions reside with the bureaus. As a result of these reductions, the bureaus will be able to reduce their overall funding requirement or reinvest the savings in high priority programs that support the Department’s mission.
DM - 50

PROGRAM CHANGE DETAIL BY OBJECT CLASS (Dollars in thousands)
Budget Program: Operations and Administration Program Change: Program Reductions
FY 2018 Object Class Increase/(Decrease)
11 Personnel compensation 11.1 Full-time permanent ($2,131) 11.3 Other than full-time permanent (32) 11.5 Other personnel compensation 0 11.8 Special personnel services payments 0 11.9 Total personnel compensation (2,163) 12 Civilian personnel benefits (328) 13 Benefits for former personnel 0 21 Travel and transportation of persons (6) 22 Transportation of things 0 23.1 Rental payments to GSA 0 23.2 Rental Payments to others 0 23.3 Communications, utilities and miscellaneous charges 0 24 Printing and reproduction (6) 25.1 Advisory and assistance services 0 25.2 Other services (1,401) 25.3 Purchases of goods & services from Gov't accounts (687) 25.4 Operation and maintenance of facilities 0 25.5 Research and development contracts 0 25.6 Medical care 0 25.7 Operation and maintenance of equipment 0 25.8 Subsistence and support of persons 0 26 Supplies and materials (27) 31 Equipment (65) 32 Lands and structures 0 33 Investments and loans 0 41 Grants, subsidies and contributions 0 42 Insurance claims and indemnities 0 43 Interest and dividends 0 44 Refunds 0 99 Total obligations (4,683)
DM - 51

Department of Commerce Departmental Management
SUMMARY OF REQUIREMENTS BY OBJECT CLASS (Dollar amounts in thousands)
Exhibit 16
Object Classes
2016
Actual
2017 Operating
Budget
2018
Base
2018
Estimate
Increase/ (Decrease)
Over 2018 Base
11 11.1 11.3 11.5 11.9
Personnel compensation: Full-time permanent Other than full-time permanent Other personnel compensation Total personnel compensation
64,903 940
2,315 68,158
69,772 1,011 2,467
73,250
71,832 1,040 2,540
75,413
69,701 1,008 2,540
73,250
-2,131 -32
0 -2,163
12.1 Civilian personnel benefits 21,839 23,069 23,397 23,069 -328
13 Benefits for former personnel 52 55 77 77 0
21 22 23.1 23.2
Travel and transportation of persons Transportation of things Rental payments to GSA Rental payments to others
621 69
7,476 0
899 165
7,470 0
905 168
7,594 0
899 168
7,594 0
-6 0 0 0
23.3 24
Communication, utilities and miscellaneous charges Printing and reproduction
3,906 229
4,608 317
4,671 323
4,671 317
0 -6
25.1 25.2 25.3
Advisory and assistance services Other services Purchase of goods and services from Gov't accounts
2,244 64,390 38,463
2,454 79,768 36,281
2,494 72,200 34,664
2,494 70,799 33,977
0 -1,401
-687
25.7 26 31 41 43
Operation and maintenance of equipment Supplies and materials Equipment Grants, subsidies and contributions Interest and dividends
0 2,645 6,075
0 3
0 1,316 3,236
0 0
0 1,343 3,301
0 0
0 1,316 3,236
0 0
0 -27 -65
0 0
99 Total obligations 216,170 232,887 226,550 221,867 -4,683
Prior year recoveries Unobligated balance, start of year Unobligated balance, end of year
(4,216) (4,028)
8,717
0 (8,717)
0
0 0 0
0 0 0
0 0 0
TOTAL REIMBURSABLE AUTHORITY 216,643 224,170 226,550 221,867 -4,683 DM - 52

Exhibit 16 Department of Commerce Departmental Management
SUMMARY OF REQUIREMENTS BY OBJECT CLASS (Dollar amounts in thousands)
2016 2017 2018 2018 Increase/
(Decrease)
Personnel Data Actual Operating Budget Base Estimate Over 2018 Base
Full-Time Equivalent Employment: Full-time permanent Other than full-time permanent Total
547 34
581
495 34
529
495 34
529
495 34
529
0 0 0
Authorized Positions: Full-time permanent Other than full-time permanent Total
724 44
768
672 44
716
672 44
716
672 44
716
0 0 0
DM - 53
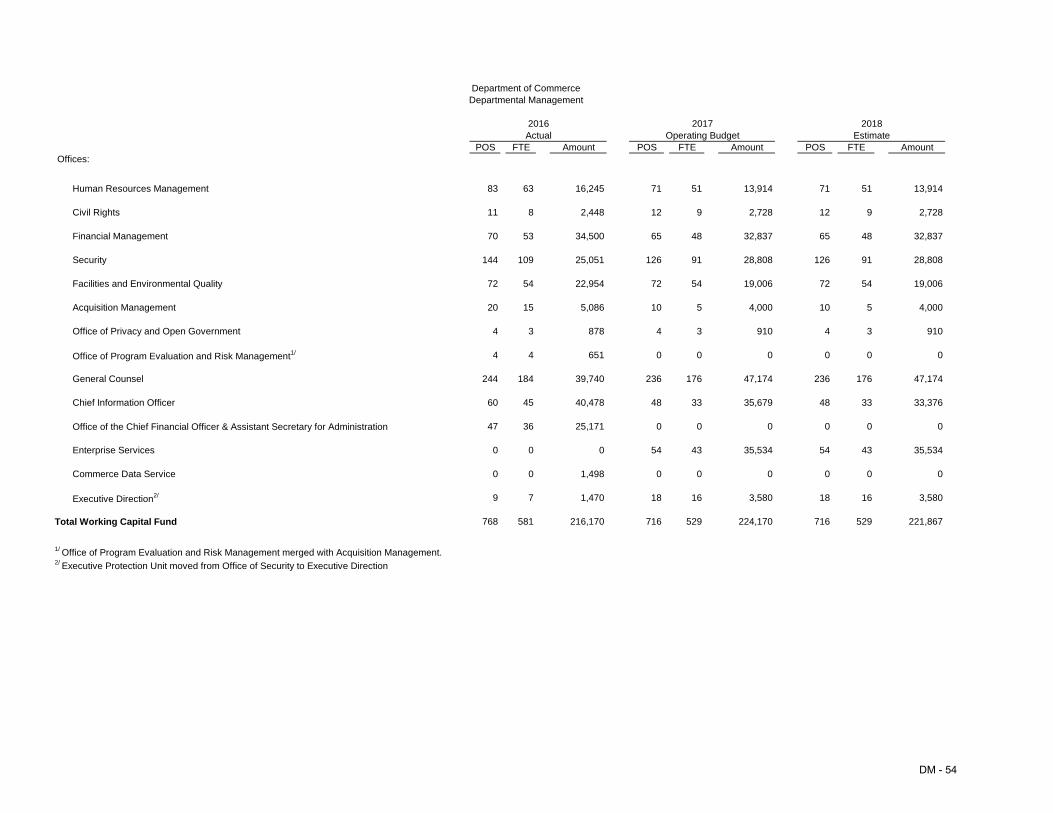
Department of Commerce Departmental Management
2016 2017 2018 Actual Operating Budget Estimate
POS FTE Amount POS FTE Amount POS FTE Amount Offices:
Human Resources Management 83 63 16,245 71 51 13,914 71 51 13,914
Civil Rights 11 8 2,448 12 9 2,728 12 9 2,728
Financial Management 70 53 34,500 65 48 32,837 65 48 32,837
Security 144 109 25,051 126 91 28,808 126 91 28,808
Facilities and Environmental Quality 72 54 22,954 72 54 19,006 72 54 19,006
Acquisition Management 20 15 5,086 10 5 4,000 10 5 4,000
Office of Privacy and Open Government 4 3 878 4 3 910 4 3 910
Office of Program Evaluation and Risk Management1/ 4 4 651 0 0 0 0 0 0
General Counsel 244 184 39,740 236 176 47,174 236 176 47,174
Chief Information Officer 60 45 40,478 48 33 35,679 48 33 33,376
Office of the Chief Financial Officer & Assistant Secretary for Administration 47 36 25,171 0 0 0 0 0 0
Enterprise Services 0 0 0 54 43 35,534 54 43 35,534
Commerce Data Service 0 0 1,498 0 0 0 0 0 0
Executive Direction2/ 9 7 1,470 18 16 3,580 18 16 3,580
Total Working Capital Fund 768 581 216,170 716 529 224,170 716 529 221,867
1/ Office of Program Evaluation and Risk Management merged with Acquisition Management. 2/ Executive Protection Unit moved from Office of Security to Executive Direction
DM - 54
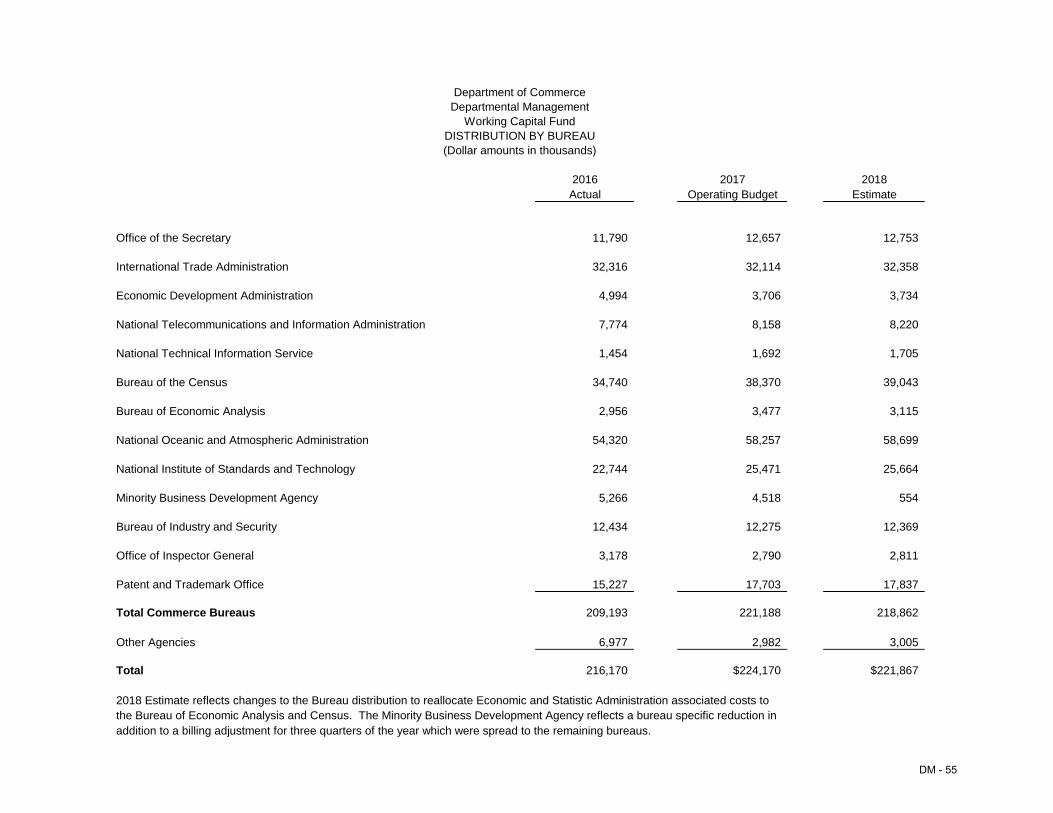
Department of Commerce Departmental Management
Working Capital Fund DISTRIBUTION BY BUREAU (Dollar amounts in thousands)
2016 2017 2018 Actual Operating Budget Estimate
Office of the Secretary 11,790 12,657 12,753
International Trade Administration 32,316 32,114 32,358
Economic Development Administration 4,994 3,706 3,734
National Telecommunications and Information Administration 7,774 8,158 8,220
National Technical Information Service 1,454 1,692 1,705
Bureau of the Census 34,740 38,370 39,043
Bureau of Economic Analysis 2,956 3,477 3,115
National Oceanic and Atmospheric Administration 54,320 58,257 58,699
National Institute of Standards and Technology 22,744 25,471 25,664
Minority Business Development Agency 5,266 4,518 554
Bureau of Industry and Security 12,434 12,275 12,369
Office of Inspector General 3,178 2,790 2,811
Patent and Trademark Office 15,227 17,703 17,837
Total Commerce Bureaus 209,193 221,188 218,862
Other Agencies 6,977 2,982 3,005
Total 216,170 $224,170 $221,867
2018 Estimate reflects changes to the Bureau distribution to reallocate Economic and Statistic Administration associated costs to the Bureau of Economic Analysis and Census. The Minority Business Development Agency reflects a bureau specific reduction in addition to a billing adjustment for three quarters of the year which were spread to the remaining bureaus.
DM - 55

Exhibit 34 Department of Commerce
Departmental Management Working Capital Fund
Advisory and Assistance Services (Dollar amounts in thousands)
2016 2017 2018 Actual Operating Budget Estimate
Consulting services 2,244 2,454 2,494 Management and professional services 0 0 0 Special studies and analyses 0 0 0 Management and support services for research and development 0 0 0
Total 2,244 2,454 2,494
DM - 56

Exhibit 36 Department of Commerce
Departmental Management Working Capital Fund
Average Grade and Salaries
2016 2017 CR 2018 Actual (Annualized) Estimate
Average GS/GM Grade 13.6 13.7 13.7 Average GS/GM Salary $112,675 $115,042 $117,227
DM - 57

[This page intentionally left blank]
DM - 58

—
FY 2018 Performance Planning and FY 2016 Reporting Backup
Strategic Goals and Objectives
The Department’s Strategic Plan for Fiscal Years 2014 to 2018 provides a broad foundation for economic growth and opportunity by focusing on the following five strategic goals and their corresponding objectives:
Trade and Investment: Expand the U.S. economy through increased exports and inward foreign investment that lead to more and better American jobs 1.1. Increase opportunities for U.S. companies by opening markets globally ITA, NOAA, NTIA, USPTO, 1.2. Increase U.S. exports BIS, EDA, ESA, ITA, MBDA, NIST, DM 1.3. Increase high-impact inward foreign direct investment into the United States EDA, ESA, ITA 1.4. Strengthen fair competition in international trade for U.S. firms and workers ITA Innovation: Foster a more innovative U.S. economy one that is better at inventing, improving, and commercializing products and technologies 2.1. Accelerate advanced manufacturing EDA, NIST 2.2. Strengthen the Nation’s digital economy ITA, NIST, NTIA, USPTO 2.3. Catalyze innovation ecosystems EDA, ESA, ITA, MBDA, NIST, USPTO, DM Environment: Help communities and businesses have the necessary information, products, and services to prepare for and prosper in a changing environment 3.1. Advance the understanding and prediction of changes in the environment NIST, NOAA, 3.2. Build a Weather-Ready Nation ESA, NOAA 3.3. Strengthen the resiliency of communities and regions EDA, ESA, NIST, NOAA 3.4. Foster healthy and sustainable marine resources, habitats, and ecosystems NOAA 3.5. Enable U.S. businesses to adapt and prosper by developing environmental and climate-
informed solutions ESA, ITA, NIST, NOAA,
Data: Maximize the positive impacts of Commerce data on society 4.1. Deliver increasing amounts of data to governments, businesses, and the public in formats
that are easier to access and use DM, All Bureaus
4.2. Position the Department of Commerce to meet society’s future data needs ESA 4.3. Create a data-driven government EDA, ESA, ITA, MBDA Operational Excellence: Strengthen the Department’s capacity to achieve its objectives, maximize return on program investments, and deliver quality, timely service 5.1. Empower and engage Commerce employees DM, All Bureaus 5.2 Support a service-oriented culture that responds to the needs of external and internal
customers DM, All Bureaus
5.3 Manage for results DM, All Bureaus 5.4 Improve facilities, support services, and information technology products and services to drive
mission success DM, All Bureaus
DM - 59
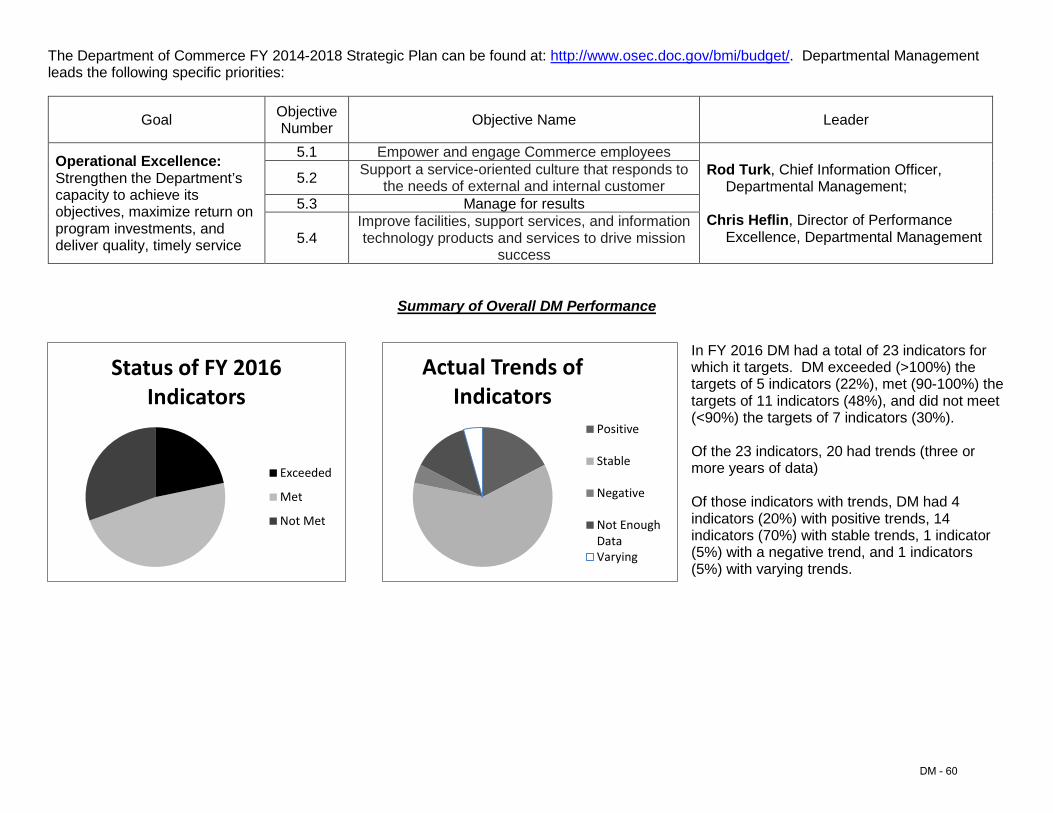
The Department of Commerce FY 2014-2018 Strategic Plan can be found at: http://www.osec.doc.gov/bmi/budget/. Departmental Management leads the following specific priorities:
Goal Objective Number Objective Name Leader
Operational Excellence: Strengthen the Department’s capacity to achieve its objectives, maximize return on program investments, and deliver quality, timely service
5.1 Empower and engage Commerce employees Rod Turk, Chief Information Officer,
Departmental Management;
Chris Heflin, Director of Performance Excellence, Departmental Management
5.2 Support a service-oriented culture that responds to the needs of external and internal customer
5.3 Manage for results
5.4 Improve facilities, support services, and information technology products and services to drive mission
success
Status of FY 2016 Indicators
Exceeded
Met
Not Met
Summary of Overall DM Performance
Actual Trends of Indicators
Positive
Stable
Negative
Not Enough Data Varying
In FY 2016 DM had a total of 23 indicators for which it targets. DM exceeded (>100%) the targets of 5 indicators (22%), met (90-100%) the targets of 11 indicators (48%), and did not meet (<90%) the targets of 7 indicators (30%).
Of the 23 indicators, 20 had trends (three or more years of data)
Of those indicators with trends, DM had 4 indicators (20%) with positive trends, 14 indicators (70%) with stable trends, 1 indicator (5%) with a negative trend, and 1 indicators (5%) with varying trends.
DM - 60
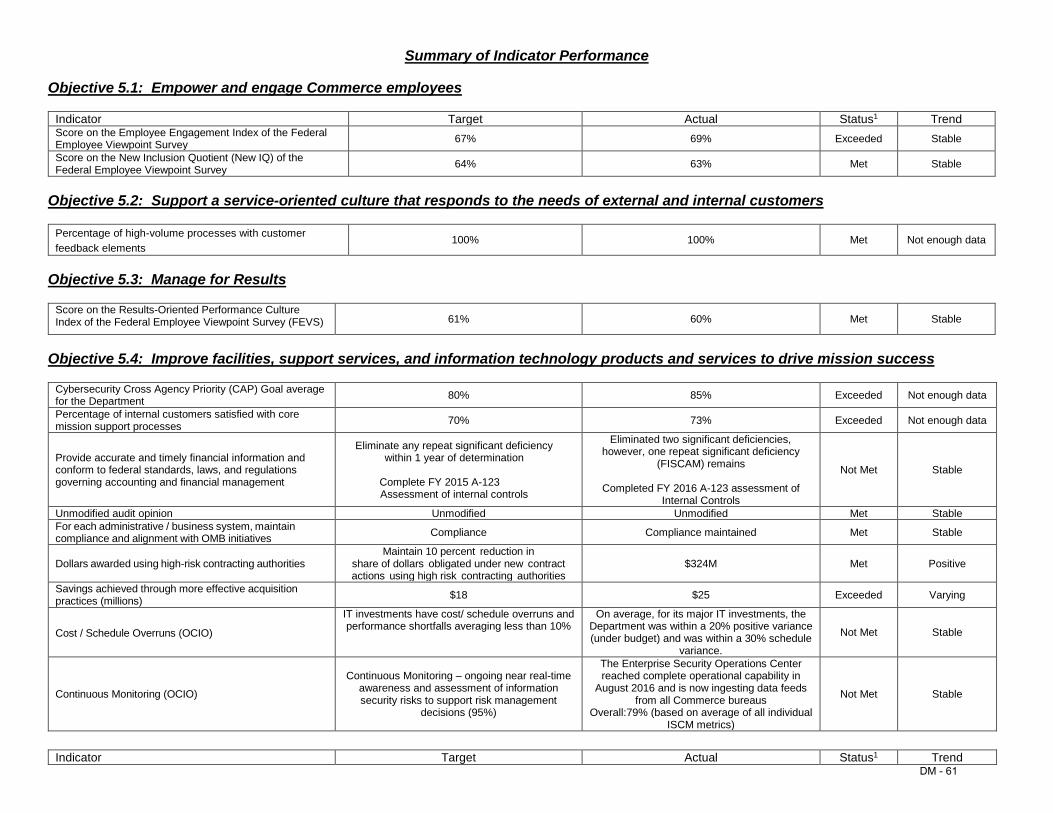
Summary of Indicator Performance
Objective 5.1: Empower and engage Commerce employees
Indicator Target Actual Status1 Trend Score on the Employee Engagement Index of the Federal Employee Viewpoint Survey 67% 69% Exceeded Stable
Score on the New Inclusion Quotient (New IQ) of the Federal Employee Viewpoint Survey 64% 63% Met Stable
Objective 5.2: Support a service-oriented culture that responds to the needs of external and internal customers
Percentage of high-volume processes with customer feedback elements
100% 100% Met Not enough data
Objective 5.3: Manage for Results
Score on the Results-Oriented Performance Culture Index of the Federal Employee Viewpoint Survey (FEVS) 61% 60% Met Stable
Objective 5.4: Improve facilities, support services, and information technology products and services to drive mission success
Cybersecurity Cross Agency Priority (CAP) Goal average for the Department 80% 85% Exceeded Not enough data
Percentage of internal customers satisfied with core mission support processes 70% 73% Exceeded Not enough data
Provide accurate and timely financial information and conform to federal standards, laws, and regulations governing accounting and financial management
Eliminate any repeat significant deficiency within 1 year of determination
Complete FY 2015 A-123 Assessment of internal controls
Eliminated two significant deficiencies, however, one repeat significant deficiency
(FISCAM) remains
Completed FY 2016 A-123 assessment of Internal Controls
Not Met Stable
Unmodified audit opinion Unmodified Unmodified Met Stable For each administrative / business system, maintain compliance and alignment with OMB initiatives Compliance Compliance maintained Met Stable
Dollars awarded using high-risk contracting authorities Maintain 10 percent reduction in
share of dollars obligated under new contract actions using high risk contracting authorities
$324M Met Positive
Savings achieved through more effective acquisition practices (millions) $18 $25 Exceeded Varying
Cost / Schedule Overruns (OCIO)
IT investments have cost/ schedule overruns and performance shortfalls averaging less than 10%
On average, for its major IT investments, the Department was within a 20% positive variance (under budget) and was within a 30% schedule
variance.
Not Met Stable
Continuous Monitoring (OCIO)
Continuous Monitoring – ongoing near real-time awareness and assessment of information security risks to support risk management
decisions (95%)
The Enterprise Security Operations Center reached complete operational capability in
August 2016 and is now ingesting data feeds from all Commerce bureaus
Overall:79% (based on average of all individual ISCM metrics)
Not Met Stable
Indicator Target Actual Status1 Trend DM - 61
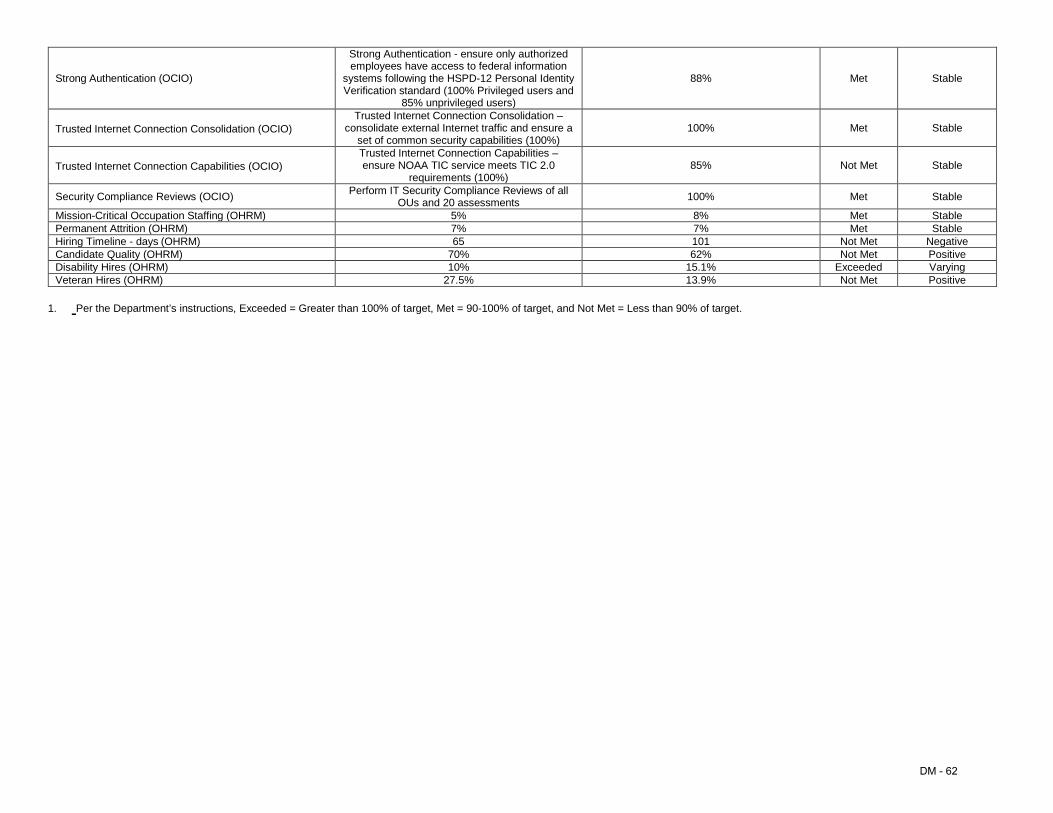
Strong Authentication (OCIO)
Strong Authentication - ensure only authorized employees have access to federal information
systems following the HSPD-12 Personal Identity Verification standard (100% Privileged users and
85% unprivileged users)
88% Met Stable
Trusted Internet Connection Consolidation (OCIO) Trusted Internet Connection Consolidation –
consolidate external Internet traffic and ensure a set of common security capabilities (100%)
100% Met Stable
Trusted Internet Connection Capabilities (OCIO) Trusted Internet Connection Capabilities – ensure NOAA TIC service meets TIC 2.0
requirements (100%) 85% Not Met Stable
Security Compliance Reviews (OCIO) Perform IT Security Compliance Reviews of all OUs and 20 assessments 100% Met Stable
Mission-Critical Occupation Staffing (OHRM) 5% 8% Met Stable Permanent Attrition (OHRM) 7% 7% Met Stable Hiring Timeline - days (OHRM) 65 101 Not Met Negative Candidate Quality (OHRM) 70% 62% Not Met Positive Disability Hires (OHRM) 10% 15.1% Exceeded Varying Veteran Hires (OHRM) 27.5% 13.9% Not Met Positive
1. Per the Department’s instructions, Exceeded = Greater than 100% of target, Met = 90-100% of target, and Not Met = Less than 90% of target.
DM - 62
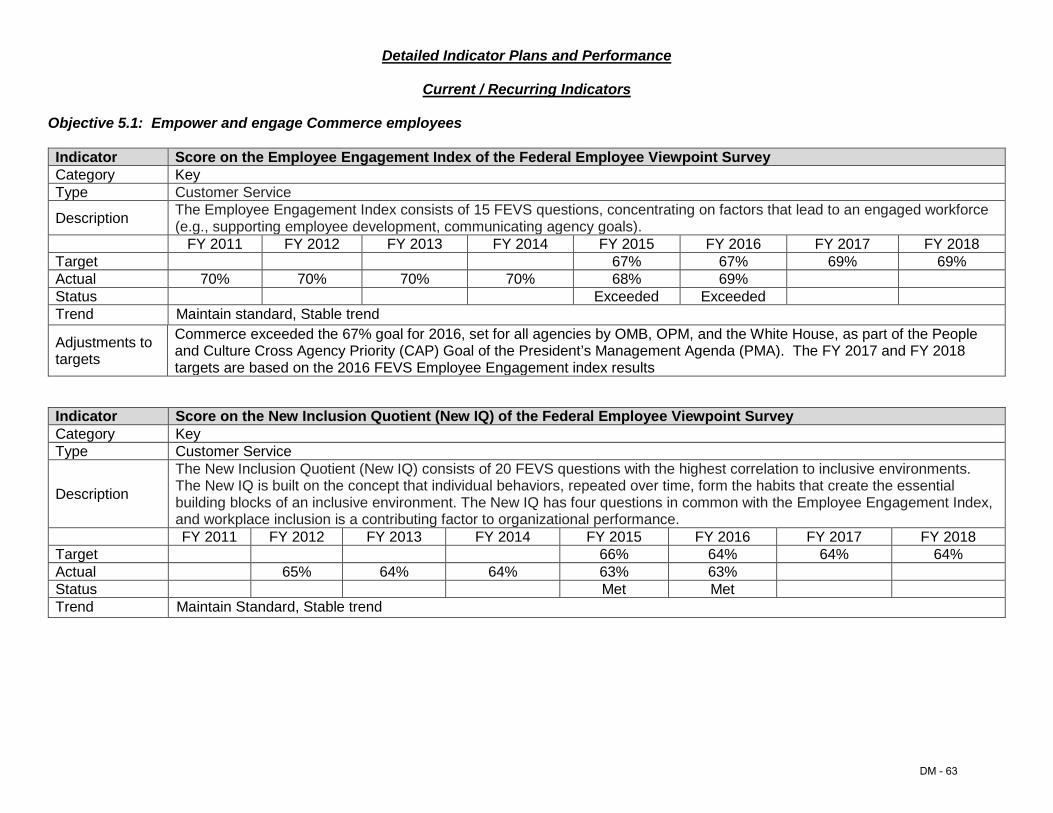
Detailed Indicator Plans and Performance
Current / Recurring Indicators
Objective 5.1: Empower and engage Commerce employees
Indicator Score on the Employee Engagement Index of the Federal Employee Viewpoint Survey Category Key Type Customer Service
Description The Employee Engagement Index consists of 15 FEVS questions, concentrating on factors that lead to an engaged workforce (e.g., supporting employee development, communicating agency goals).
FY 2011 FY 2012 FY 2013 FY 2014 FY 2015 FY 2016 FY 2017 FY 2018 Target 67% 67% 69% 69% Actual 70% 70% 70% 70% 68% 69% Status Exceeded Exceeded Trend Maintain standard, Stable trend
Adjustments to targets
Commerce exceeded the 67% goal for 2016, set for all agencies by OMB, OPM, and the White House, as part of the People and Culture Cross Agency Priority (CAP) Goal of the President’s Management Agenda (PMA). The FY 2017 and FY 2018 targets are based on the 2016 FEVS Employee Engagement index results
Indicator Score on the New Inclusion Quotient (New IQ) of the Federal Employee Viewpoint Survey Category Key Type Customer Service
Description
The New Inclusion Quotient (New IQ) consists of 20 FEVS questions with the highest correlation to inclusive environments. The New IQ is built on the concept that individual behaviors, repeated over time, form the habits that create the essential building blocks of an inclusive environment. The New IQ has four questions in common with the Employee Engagement Index, and workplace inclusion is a contributing factor to organizational performance. FY 2011 FY 2012 FY 2013 FY 2014 FY 2015 FY 2016 FY 2017 FY 2018
Target 66% 64% 64% 64% Actual 65% 64% 64% 63% 63% Status Met Met Trend Maintain Standard, Stable trend
DM - 63

Objective 5.2: Support a service-oriented culture that responds to the needs of external and internal customers
Indicator Percentage of high-volume processes with customer feedback elements Category Key Type Process
Description Complete and effective customer feedback loops will be identified for the Department’s 20 highest volume externally facing processes. Process owners must demonstrate how customer feedback is used to inform operational improvements and decisions before the loop will be counted as complete. FY 2011 FY 2012 FY 2013 FY 2014 FY 2015 FY 2016 FY 2017 FY 2018
Target 100% 100% 100% Actual 100% Status Met Trend Not enough data to determine a trend
Notes
The Federal Digital Strategy Team identified four DoC processes with high volume customer contacts (patents, trademarks, weather information and the 2020 Census). All four get feedback from advisory groups and two get on-going feedback from customers. The approaches for all four will be upgraded in FY 2016/2017. In addition, the universe for this indicator will be expanded in FY 2016 to include all high volume customer service processes of DoC.
Objective 5.3: Manage for Results
Indicator Score on the Results-Oriented Performance Culture Index of the Federal Employee Viewpoint Survey (FEVS) Category Key Type Customer Service
Description This index is made up of 13 FEVS questions, which taken together indicate the extent to which employees believe their organizational culture promotes improvement in processes, products and services, and organizational outcomes.
FY 2011 FY 2012 FY 2013 FY 2014 FY 2015 FY 2016 FY 2017 FY 2018 Target 61% 61% 61% 61% Actual 61% 61% 61% 61% 60% 60% Status Met Met Trend Maintain standard, Stable trend
Actions to be taken
DoC will incorporate the Strategic Plan and performance management briefings into a new on-boarding program for employees. News about the Strategic Plan will be on pages of the intranet, as well as opportunities to serve on teams that are executing strategies. DoC is developing a new recognition program for innovation in plan implementation.
Notes DoC is using a new process to identify priorities for developing additional evidence of program performance.
DM - 64
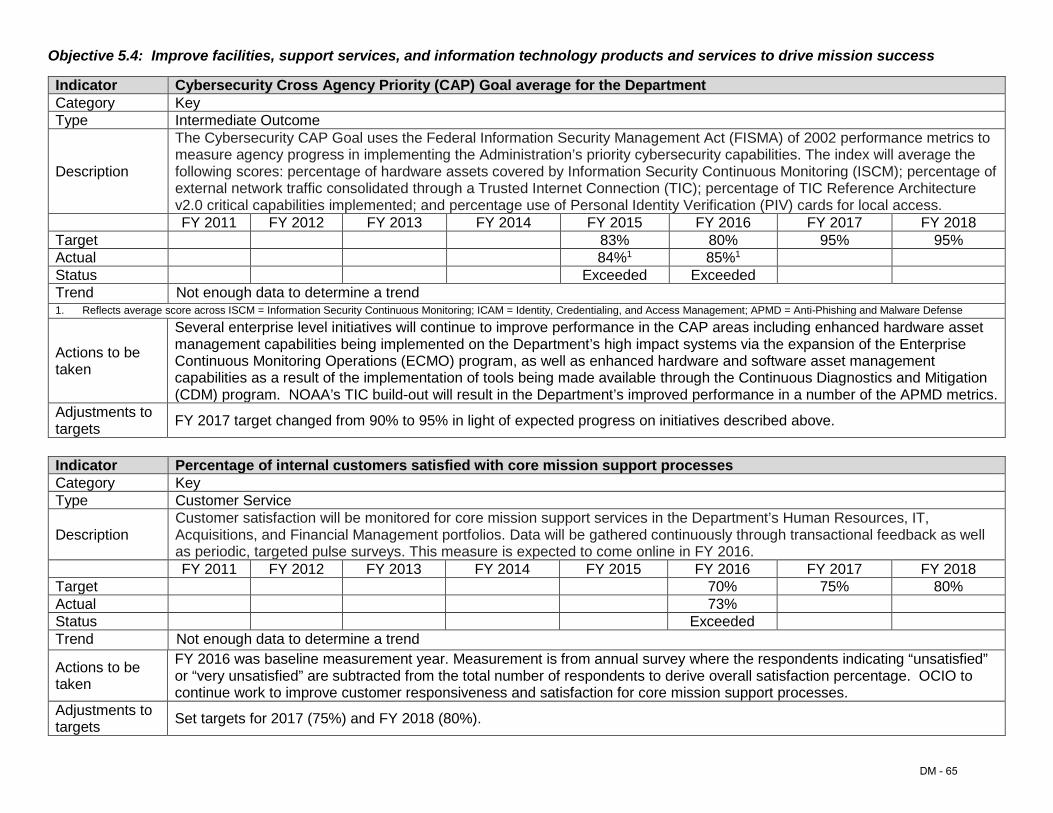
Objective 5.4: Improve facilities, support services, and information technology products and services to drive mission success
Indicator Cybersecurity Cross Agency Priority (CAP) Goal average for the Department Category Key Type Intermediate Outcome
Description
The Cybersecurity CAP Goal uses the Federal Information Security Management Act (FISMA) of 2002 performance metrics to measure agency progress in implementing the Administration’s priority cybersecurity capabilities. The index will average the following scores: percentage of hardware assets covered by Information Security Continuous Monitoring (ISCM); percentage of external network traffic consolidated through a Trusted Internet Connection (TIC); percentage of TIC Reference Architecture v2.0 critical capabilities implemented; and percentage use of Personal Identity Verification (PIV) cards for local access. FY 2011 FY 2012 FY 2013 FY 2014 FY 2015 FY 2016 FY 2017 FY 2018
Target 83% 80% 95% 95% Actual 84%1 85%1
Status Exceeded Exceeded Trend Not enough data to determine a trend 1. Reflects average score across ISCM = Information Security Continuous Monitoring; ICAM = Identity, Credentialing, and Access Management; APMD = Anti-Phishing and Malware Defense
Actions to be taken
Several enterprise level initiatives will continue to improve performance in the CAP areas including enhanced hardware asset management capabilities being implemented on the Department’s high impact systems via the expansion of the Enterprise Continuous Monitoring Operations (ECMO) program, as well as enhanced hardware and software asset management capabilities as a result of the implementation of tools being made available through the Continuous Diagnostics and Mitigation (CDM) program. NOAA’s TIC build-out will result in the Department’s improved performance in a number of the APMD metrics.
Adjustments to targets FY 2017 target changed from 90% to 95% in light of expected progress on initiatives described above.
Indicator Percentage of internal customers satisfied with core mission support processes Category Key Type Customer Service
Description Customer satisfaction will be monitored for core mission support services in the Department’s Human Resources, IT, Acquisitions, and Financial Management portfolios. Data will be gathered continuously through transactional feedback as well as periodic, targeted pulse surveys. This measure is expected to come online in FY 2016. FY 2011 FY 2012 FY 2013 FY 2014 FY 2015 FY 2016 FY 2017 FY 2018
Target 70% 75% 80% Actual 73% Status Exceeded Trend Not enough data to determine a trend
Actions to be taken
FY 2016 was baseline measurement year. Measurement is from annual survey where the respondents indicating “unsatisfied” or “very unsatisfied” are subtracted from the total number of respondents to derive overall satisfaction percentage. OCIO to continue work to improve customer responsiveness and satisfaction for core mission support processes.
Adjustments to targets Set targets for 2017 (75%) and FY 2018 (80%).
DM - 65

Indicator Provide accurate and timely financial information and conform to federal standards, laws, and regulations governing accounting and financial management
Category Supporting (Non-Strategic Plan) Type Intermediate Outcome
Description
This indicator ensures that the Department of Commerce is accountable to the American people, and that no Significant Deficiencies, formerly known as “Reportable Conditions,” (i.e. deficiencies in the design or operation of internal controls) remain unaddressed. To determine if financial information is being provided in a timely and accurate manner, the Department will assess whether those individuals who can best use the information are receiving it within timeframes that render it relevant and useful in their day-to-day decisions
FY 2011 FY 2012 FY 2013 FY 2014 FY 2015 FY 2016 FY 2017 FY 2018
Target
Eliminate any significant deficiency
within 1 year of determination
Complete FY 2011 A-123
assessment of internal controls
Eliminate any significant
deficiency within 1 year of
determination
Complete FY 2012 A-123 assessment of internal controls
Eliminate any significant
deficiency within 1 year of
determination
Complete FY 2013 A-123
assessment of internal controls
Eliminate any repeat significant
deficiency within 1 year of
determination
Complete FY 2014 A-123 assessment of internal controls
Eliminate any repeat significant deficiency within
1 year of determination
Complete FY 2015 A-123 assessment of internal controls
Eliminate any repeat significant deficiency within
1 year of determination
Complete FY 2016 A-123 assessment of internal controls
Eliminate any repeat significant deficiency within
1 year of determination
Complete FY 2017 A-123 assessment of internal controls
Eliminate any repeat significant deficiency within 1
year of determination
Complete FY 2018 A-123 assessment of internal controls
Actual
Eliminated significant deficiency
Completed FY 2011 A-123 Assessment
FY 2012 Audit identified one
material weakness and one significant
deficiency.
Completed FY 2012 A- 123
assessment of internal controls
Eliminated the material weakness but two significant
deficiencies remain
Completed A-123 assessments
Eliminated one repeat significant deficiency out of two, added one
additional significant deficiency.
Completed FY 2014 A-123
assessment of Internal Controls.
Eliminated one repeat significant deficiency out of
two, added a new significant deficiency.
Completed FY 2015 A-123
assessment of Internal Controls.
Eliminated two significant
deficiencies, but one repeat significant deficiency
(FISCAM) remains
Completed FY 2016 A-123
assessment of Internal Controls
Status Met Not Met Not Met Not Met Not Met Not Met Trend Maintain standard, Stable trend
Explanation for Not Met
Two significant deficiencies were eliminated during FY 2016, but one repeat significant deficiency remains. Each year the Financial Information System Controls Audit Manual (FISCAM) areas are audited via the IG contractor. The Department has not eliminated the significant deficiency for IT general controls related to FISCAM. One significant deficiency was eliminated during FY 2015 but it was replaced by another. Each year the same five Financial Information System Controls Audit Manual (FISCAM) areas are audited via the IG contractor. The composition of the audit findings in the five areas changed from 14 to 15 which is why one was eliminated and another was added.
Actions to be taken / The Department will continue to monitor the progress of corrective actions to ensure that they stay on track.
DM - 66
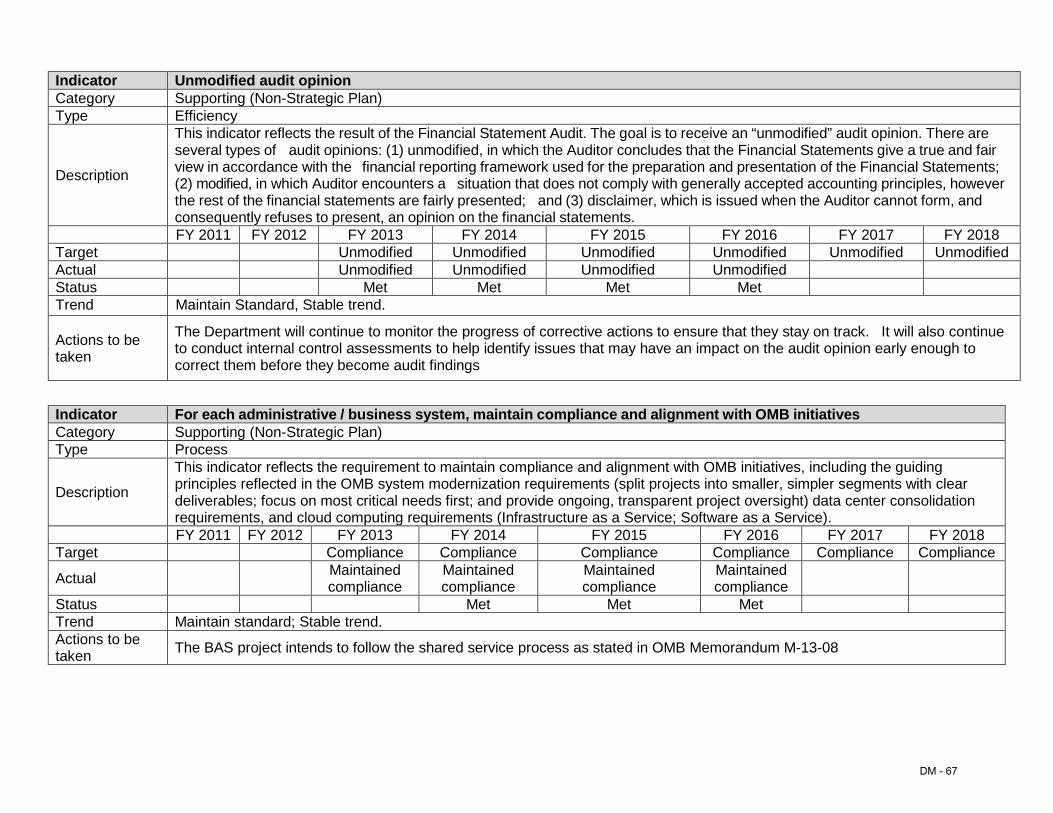
Indicator Unmodified audit opinion Category Supporting (Non-Strategic Plan) Type Efficiency
Description
This indicator reflects the result of the Financial Statement Audit. The goal is to receive an “unmodified” audit opinion. There are several types of audit opinions: (1) unmodified, in which the Auditor concludes that the Financial Statements give a true and fair view in accordance with the financial reporting framework used for the preparation and presentation of the Financial Statements; (2) modified, in which Auditor encounters a situation that does not comply with generally accepted accounting principles, however the rest of the financial statements are fairly presented; and (3) disclaimer, which is issued when the Auditor cannot form, and consequently refuses to present, an opinion on the financial statements. FY 2011 FY 2012 FY 2013 FY 2014 FY 2015 FY 2016 FY 2017 FY 2018
Target Unmodified Unmodified Unmodified Unmodified Unmodified Unmodified Actual Unmodified Unmodified Unmodified Unmodified Status Met Met Met Met Trend Maintain Standard, Stable trend.
Actions to be taken
The Department will continue to monitor the progress of corrective actions to ensure that they stay on track. It will also continue to conduct internal control assessments to help identify issues that may have an impact on the audit opinion early enough to correct them before they become audit findings
Indicator For each administrative / business system, maintain compliance and alignment with OMB initiatives Category Supporting (Non-Strategic Plan) Type Process
Description
This indicator reflects the requirement to maintain compliance and alignment with OMB initiatives, including the guiding principles reflected in the OMB system modernization requirements (split projects into smaller, simpler segments with clear deliverables; focus on most critical needs first; and provide ongoing, transparent project oversight) data center consolidation requirements, and cloud computing requirements (Infrastructure as a Service; Software as a Service). FY 2011 FY 2012 FY 2013 FY 2014 FY 2015 FY 2016 FY 2017 FY 2018
Target Compliance Compliance Compliance Compliance Compliance Compliance
Actual Maintained compliance
Maintained compliance
Maintained compliance
Maintained compliance
Status Met Met Met Trend Maintain standard; Stable trend. Actions to be taken The BAS project intends to follow the shared service process as stated in OMB Memorandum M-13-08
DM - 67

Indicator Dollars awarded using high-risk contracting authorities Category Supporting (Non-Strategic Plan) Type Intermediate Outcome
Description
High-risk contracting authorities such as noncompetitive contracting, cost-reimbursement contracts, and time-and materials and labor-hour contracts pose special risks of overspending. While these contract authorities are important tools when used appropriately, GAO and OIG oversight reviews indicate that they are often used without an appropriate basis or sufficient management and oversight to limit taxpayer risk. This element will measure the Department’s progress in managing risk through reducing the use of high-risk contracting authorities. FY 2011 FY 2012 FY 2013 FY 2014 FY 2015 FY 2016 FY 2017 FY 2018
Target
Maintain 10 percent
reduction in share of dollars obligated under new contract actions using
high risk contracting authorities
Maintain 10 percent reduction in share of dollars obligated under new contract
actions using high risk contracting
authorities
Maintain 10 percent reduction in share of dollars obligated under new contract
actions using high risk contracting
authorities
Maintain 10 percent reduction in share of dollars obligated under new contract
actions using high risk contracting
authorities
Maintain 10 percent reduction in share of dollars obligated under
new contract actions using high
risk contracting authorities
Maintain 10 percent reduction in share of dollars obligated under
new contract actions using high
risk contracting authorities
Actual $228M $279M $367M $324M Status Met Met Met Met Trend Positive trend
Indicator Savings achieved through more effective acquisition practices (millions) Category Supporting (Non-Strategic Plan) Type Outcome
Description
Sound acquisition practices help guard against inefficiency and waste and improve the ability to obtain quality supplies and services that are on time and within budget. There are many ways to achieve savings through more effective acquisition practices, including: ending contracts that do not meet program needs; negotiating more favorably priced contracts; developing more strategic acquisition approaches; and reengineering ineffective business processes. This element will measure the Department’s progress in reducing spending through more effective acquisition practices. FY 2011 FY 2012 FY 2013 FY 2014 FY 2015 FY 2016 FY 2017 FY 2018
Target $18 $18 $18 $18 $18 $16.9 Actual $29 $18.1 $17 $25 Status Exceeded Exceeded Met Exceeded Trend Maintain Standard, Varying Trend Actions to be taken The target is being affected/modified in FY 2016 and FY 2017 due to the Department’s transition to Shared Services.
Adjustments to targets
DM is adjusting Cost Saving Targets in FY 2016 and 2017 based on re-baselined savings in the following initiatives: cellular services, old target 3.5 M, new target $0.9M; reverse action, old target $1.5M, new target $1.1M; Office Supplies, old target $0.6M, new target $0.3M
DM - 68

Indicators – (OCIO)
A. Cost / Schedule Overruns B. Continuous Monitoring C. Strong Authentication D. Trusted Internet Connection Consolidation E. Trusted Internet Connection Capabilities F. Security Compliance Reviews
Category Supporting (Non-Strategic Plan) Type Outcome
Description
VALUE: The Department’s significant annual investment in information technology (IT) solutions and assets requires careful management and monitoring. Through the use of Earned Value Management and Operational Analysis systems in the development and/or operational phases are monitored to ensure the required functionality is delivered on schedule and at the cost projected. Program offices regularly report on the progress and status of their efforts against the cost, schedule, and performance goals. DOC has changed the wording of this measure from “Improve the management of information technology,” to better reflect an objective measure as opposed to a goal.
In addition to the above, and beginning in FY 2015, the Department embarked upon updating its IT infrastructure and initiating an IT Shared Services Initiative aimed at consolidating commodity services across bureaus to gain economies of scale, improve service delivery, and improve customer satisfaction. As part of this effort, six IT shared services were identified and prioritized for deployment in the FY2016-FY2017 timeframe. As these IT shared services are deployed, OCIO will focus on the delivery and measurement of achieved functionality and improvements in customer satisfaction and value delivered to our customers and stakeholders.
CYBER: The successful implementation of each program critical to the Department’s missions depends on the adequacy and security of the Department’s information technology systems. If systems security were to be compromised, the effective accomplishment of the Department’s mission would be in jeopardy. The Department follows the NIST Risk Management Framework (RMF) process to ensure that information and systems are adequately protected throughout their lifecycle. This includes a rigorous assessment of security controls to provide the necessary assurance that an information system can securely process, store, or transmit information. The assessment encompasses all management, operational, and technical controls that protect a system. By following the RMF process, the Department continuously monitors the status of its systems and the adequacy of the controls.
In FY 2016, the Department of Commerce (DOC) worked aggressively to enhance its IT security posture and improve its performance in the Cyber Security Cross Agency Priority (CyberCAP) areas as well as other FISMA areas. An enterprise view of the real-time security posture of DOC’s systems is being enabled through the Enterprise Cybersecurity Monitoring and Operations (ECMO) program and Enterprise Security Operations Center (ESOC). Additional monitoring tools will be integrated in FY 2017 as a result of DOC’s participation in the DHS’s Continuous Diagnostics and Mitigation (CDM) program. DOC met six Anti-Phishing and Malware Defense (APMD) metrics by deploying new network protection tools as well as making a phishing exercise tool available at the enterprise level. DOC will continue to improve its APMD performance through enhanced training exercises and use of additional tools and supporting processes for anti –virus protection, intrusion prevention systems, scanning mobile devices, and the implementation of an enterprise Dynamic Execution Environment (DEE). DOC made progress in Strong Authentication / PIV use through stricter enforcement of technical requirements to use PIV for logical access. A PIV-interoperability solution has been identified to aid in providing PIV badges to DOC populations
DM - 69

that were previously unable to receive them. Additional improvements will be realized through DOC’s ongoing efforts to cultivate a culture of analytics and IT security awareness.
A. Cost / Schedule Overruns FY 2011 FY 2012 FY 2013 FY 2014 FY 2015 FY 2016 FY 2017 FY 2018
Target
IT investments have cost/ schedule
overruns and performance
shortfalls averaging less
than 10%
IT investments have cost/ schedule
overruns and performance
shortfalls averaging less
than 10%
All investments within 10% of
cost and schedule.
IT investments have cost/ schedule overruns
and performance shortfalls averaging less
than 10%
IT investments have cost/ schedule overruns and performance
shortfalls averaging less than 10%
IT investments have cost/ schedule overruns and performance
shortfalls averaging less than 10%
IT investments have cost/
schedule overruns and performance
shortfalls averaging less
than 10%
IT investments have cost/ schedule
overruns and performance
shortfalls averaging less
than 10%
Actual
IT investments had cost/ schedule
overruns and performance
shortfalls averaging less
than 10%
IT investments had cost/ schedule
overruns and performance
shortfalls averaging less
than 10%
75% of major IT investments had
cost/schedule overruns and performance
shortfalls averaging less
than 10%
On average, for its major IT investments in the
development stage, the Department achieved its
cost target of being within 10% variance
(under budget) and was within a 25% schedule
variance.
On average, for its major IT
investments, the Department was
within a 20% positive variance
(under budget) and was within a 30%
schedule variance.
On average, for its major IT
investments, the Department was
within a 20% positive variance
(under budget) and was within a 30%
schedule variance. Status Met Met Not Met Not Met Not Met Not Met Trend Maintain Standard, Stable trend.
Explanation if Not Met
There are six investments / projects – primarily IT infrastructure projects – that are chronically behind schedule and over budget that bring the overall average variance of the Department’s major investments down. The variance typically occurs when a management decision is made to add new projects and change the priority and resources left available for current (primarily infrastructure projects.
Actions to be taken
Major Investments with chronic or exceptionally high cost and schedule variances will be brought in for TechSTAT and/or Commerce IT Review Board Reviews. In addition, we will evaluate whether it is appropriate to develop a formal department wide policy laying out the criteria for when re-baselining is valid.
Adjustments to targets The target was based on OMB’s goals
DM - 70

B. Continuous Monitoring FY
2011 FY
2012 FY
2013 FY 2014 FY 2015 FY 2016 FY 2017 FY 2018
Target
Continuous Monitoring – ongoing near real-time
awareness and assessment of
information security risks to support risk
management decisions (95%)
Continuous Monitoring – ongoing near real-time
awareness and assessment of information security risks to support risk management
decisions (95%)
Continuous Monitoring – ongoing near real-time awareness and
assessment of information security risks to support risk
management decisions (95%)
Continuous Monitoring –
ongoing near real-time awareness and assessment
of information security risks to
support risk management
decisions (95%)
Continuous Monitoring –
ongoing near real-time awareness
and assessment of information security risks to support risk
management decisions (95%)
Actual
Enterprise Security Operations Center achieved functional
initial operating capability on 9/25/2014. Current deployment of enterprise monitoring capability at 113% of
projected deployment.
The Enterprise Security Operations Center is operating
24X7 and is ingesting data feeds from NOAA, DOC HQ,
NTIA and BEA.
The Enterprise Cybersecurity Monitoring & Operations
(ECMO) deploys continuous Monitoring Agents on 100% of
targeted assets for FY16.
Hardware Asset Management 76%; Software Asset
Management:84%; Vulnerability Management:74%;
Configuration Management:91%
The Enterprise Security Operations Center reached
complete operational capability in August 2016 and is now ingesting
data feeds from all Commerce bureaus
Hardware Asset Management:71%; Software
Asset Management: 77%; Vulnerability Management: 91%; Configuration Management: 99%; Overall:79% (based on average of all individual ISCM metrics)
Status Met Not Met Not Met Trend Stable trend.
Explanation if Not Met
A change in ISCM calculations, taking the lowest of multiple questions, also resulted in percentage drops. While there were improvements in FY 2016, OUs continue to add automated capabilities. With the implementation of CDM Phase 1 tools scheduled through FY 2017 and focused on these key ISCM areas, DM hopes to meet the targets by Q1 of FY 2018. DHS will deliver continuous monitoring capabilities via the awarded CMaaS integrator to complement existing efforts under the ECMO program. High Systems endpoints are not yet integrated with the enterprise continuous monitoring platform.
Actions to be taken
DHS Continuing Diagnostics and Mitigation (CDM) Task Order 2 for hardware and software asset management and Vulnerability and Secure configuration management tools and services was awarded on 9/21/15. Currently the awardee, Northrup Grumman, beginning the pilot for CDM Phase 1 tools in preparation for implementation throughout the DOC CDM Phase 1 implementation is expected to be complete by the end of FY 2017. Re: ECMO -- Implementation of tools and processes by DHS by the end of FY17. Completion of FIPS-199 High Systems integration project by end of FY 2017.
Adjustments to targets Dependent on CDM award.
Notes ESOC and DOC-CIRT achieved 24/7 coverage with new central reporting schemas. DHS Continuous Diagnostics and Mitigation Program to provide tools and services for hardware and software asset management and vulnerability and configuration management was awarded and now being piloted.
DM - 71

C. Strong Authentication FY 2011 FY 2012 FY 2013 FY 2014 FY 2015 FY 2016 FY 2017 FY 2018
Target
Increase security training
completion rate to 80%
for privileged users (role
based)
Increase security training completion
rate to 80% for privileged users
(role-based)
Percentage of systems in
production with valid Accreditation and Authorization
(A&A) is 100%
Strong Authentication
ensure only authorized
employees have access to federal
information systems
following the HSPD-12
Personal Identity Verification
standard (75%)
Strong Authentication - ensure only authorized
employees have access to federal
information systems following the HSPD12 Personal Identity Verification standard
(75%)
Strong Authentication – ensure only
authorized privileged and unprivileged
users have access to federal information
systems following the HSPD-12 Personal Identity Verification standard (100%
privileged users and 85% unprivileged
users)
Strong Authentication
ensure only authorized
privileged and unprivileged users
have access to federal
information systems following
the HSPD-12 Personal Identity
Verification standard (100% privileged users
and 85% unprivileged
users)
Strong Authentication
ensure only authorized
privileged and unprivileged users
have access to federal information systems following
the HSPD-12 Personal Identity
Verification standard
(100% privileged users and 85%
unprivileged users)
Actual
89% completion
rate of security
training for privileged
users (rolebased).
Trained Authorizing Officials and
System Owners throughout the
Department with quarterly
workshops.
Achieved greater than 85% of
required security training for
privileged users (role-based).
99% of systems in production with
valid Accreditation and Authorization
Strong Authentication
aggregated totals for non-privileged and
privileged access is 72% as of 9/29/2014
which represents a 100% increase
from FY2013.
Privileged users:86%
Unprivileged users:81%
Privileged users: 90%
Unprivileged users: 86%
Status Met Met Met Met Exceeded Met Trend Maintain standard, stable trend. Explanation if Not Met As of FY2016 Q4, Privileged User target had not been met; Privileged users met 99.8% performance at FY2017 Q1.
DM - 72

D. Trusted Internet Connection Consolidation FY 2011 FY 2012 FY 2013 FY 2014 FY 2015 FY 2016 FY 2017 FY 2018
Target
Trusted Internet Connection
Consolidation – consolidate external Internet traffic and
ensure a set of common security capabilities (95%)
Trusted Internet Connection
Consolidation – consolidate
external Internet traffic and ensure a set of common
security capabilities (95%)
Trusted Internet Connection Consolidation – ensures external network traffic
passing through a TIC or Managed Trusted Internet Protocol Services (MTIPS)
provider. (100%)
Trusted Internet Connection
Consolidation – ensures external
network traffic passing through a TIC or Managed Trusted Internet
Protocol Services (MTIPS) provider.
(100%)
Trusted Internet Connection
Consolidation – ensures external
network traffic passing through a TIC or Managed Trusted Internet
Protocol Services (MTIPS) provider.
(100%)
Actual
TIC Consolidation 100% via MTIPS for
all OUs except NOAA who is in process of establishing TICAP
services
TIC Consolidation is at 98% via MTIPS and
TICAP.
TIC Consolidation is at 100% via MTIPs and TICAP for all
bureaus.
Status Met Met Met Trend Stable trend.
Notes DOC exceeded the CAP goal of 95% of external network traffic passing through a Managed Trusted Internet Protocol Services (MTIPS) provider. This means that an increasing amount of internet traffic passes through trusted internet connections.
E. Trusted Internet Connection Capabilities FY 2011 FY 2012 FY 2013 FY 2014 FY 2015 FY 2016 FY 2017 FY 2018
Target
Trusted Internet Connection
Capabilities – ensure NOAA TIC service
meets TIC 2.0 requirements (100%)
Trusted Internet Connection
Capabilities – ensure NOAA TIC service
meets TIC 2.0 requirements (100%)
Trusted Internet Connection Capabilities – ensure NOAA TIC service meets TIC 2.0
requirements (100%)
Trusted Internet Connection
Capabilities – ensure NOAA TIC service meets TIC 2.0 requirements
(100%)
Trusted Internet Connection
Capabilities – ensure NOAA TIC service meets TIC 2.0 requirements
(100%)
Actual NOAA TIC 2.0
compliance at 87.5%, planned date to reach 100% is 9/30/2015.
NOAA’s TIC 2.0 compliance at 83% (43/52) based on
critical controls and planned to be 98% in
Q2FY16
NOAA’s TIC 2.0 compliance at 85% (44/52) based on the DHS FY16 TIC Capability
Validation (TCV) report critical controls
Status Met Not Met Not Met Trend Stable trend.
Explanation if Not Met
Two primary reasons for missing TIC 2.0 goal for FY 2016: 1) Gap in security standard policy and methods of enforcement supporting TCV compliance; and 2) Gap in standard agreements between organization and NOAA CSD supporting TCV compliance. Since September, 2016 NOAA Cyber Security Division has conducted several reviews to close these gaps. Our full initial independent assessment for TIC 2.0 is going to start second week of April of this year and hope to meet our goal in FY 2017.
F. Security Compliance Reviews DM - 73

FY 2011 FY 2012 FY 2013 FY 2014 FY 2015 FY 2016 FY 2017 FY 2018
Target
Perform IT security
compliance review of all
operating units, and 10 FISMA
systems in CSAM
Perform IT Security Compliance reviews
Perform IT Security compliance review of
all OUs and 30 assessments
Perform IT Security
compliance review of all OUs
and 22 assessments
Perform IT Security Compliance
Reviews of all OUs and 20
assessments
Perform IT Security Compliance Reviews
of all OUs and 20 assessments
Perform IT Security
Compliance Reviews of all OUs and 20 assessments
Perform IT Security
Compliance Reviews of all OUs and 20 assessments
Actual Performed IT
Security Compliance
reviews
Completed 29 security assessments. Conducted
IT security compliance checks of all Department operating units and in-depth internal control
review meetings with five selected operating units
as part of the Department’s IT internal control review program
Security compliance review of all OUs and
34 assessments
Completed Security
compliance reviews of all OUs
and 22 assessments
Completed Security Compliance
Reviews of all OUs and 15
assessments
Conducted 87 analyses, reviews, and assessments and compliance
checks for participating
bureaus.
Status Met Met Met Met Met Met Trend Maintain standard, stable trend.
Notes The parameters constituting an "assessment" changed between FY 2016 & 2017, hence the significant variance in actual performance vs the FY 2016 target. For 2017 & 2018, parameters will revert back to 2015 method.
DM - 74
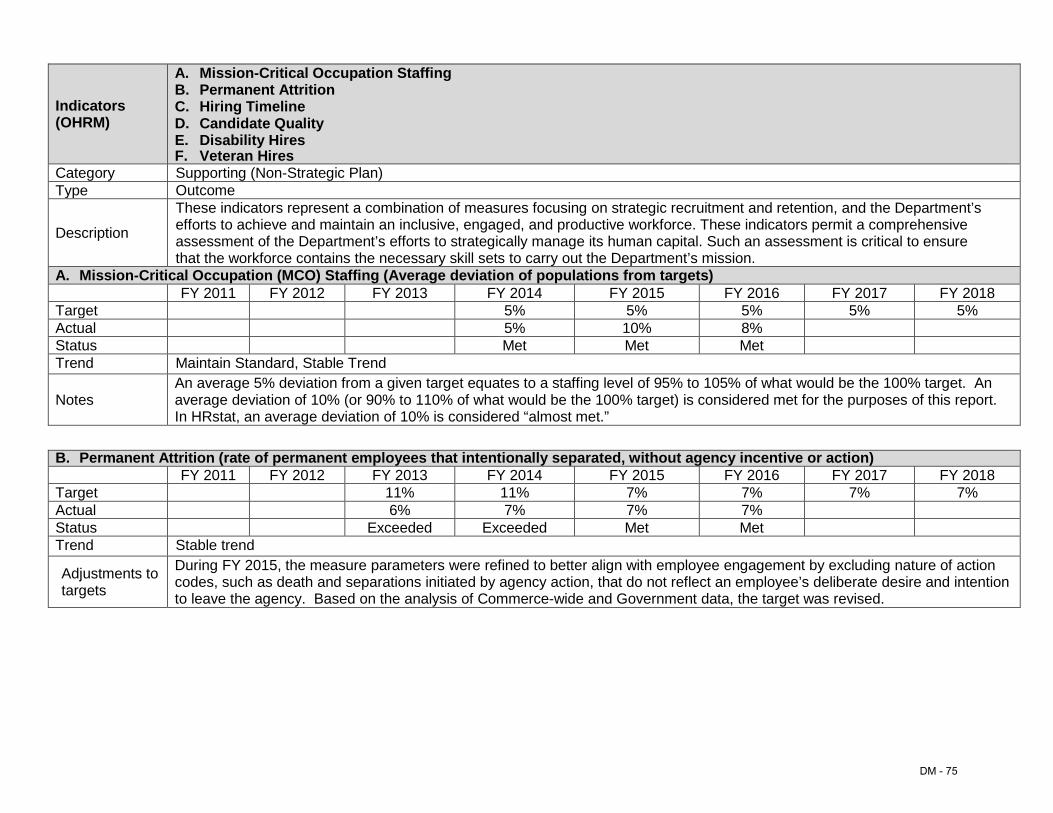
Indicators (OHRM)
A. Mission-Critical Occupation Staffing B. Permanent Attrition C. Hiring Timeline D. Candidate Quality E. Disability Hires F. Veteran Hires
Category Supporting (Non-Strategic Plan) Type Outcome
Description
These indicators represent a combination of measures focusing on strategic recruitment and retention, and the Department’s efforts to achieve and maintain an inclusive, engaged, and productive workforce. These indicators permit a comprehensive assessment of the Department’s efforts to strategically manage its human capital. Such an assessment is critical to ensure that the workforce contains the necessary skill sets to carry out the Department’s mission.
A. Mission-Critical Occupation (MCO) Staffing (Average deviation of populations from targets) FY 2011 FY 2012 FY 2013 FY 2014 FY 2015 FY 2016 FY 2017 FY 2018
Target 5% 5% 5% 5% 5% Actual 5% 10% 8% Status Met Met Met Trend Maintain Standard, Stable Trend
Notes An average 5% deviation from a given target equates to a staffing level of 95% to 105% of what would be the 100% target. An average deviation of 10% (or 90% to 110% of what would be the 100% target) is considered met for the purposes of this report. In HRstat, an average deviation of 10% is considered “almost met.”
B. Permanent Attrition (rate of permanent employees that intentionally separated, without agency incentive or action) FY 2011 FY 2012 FY 2013 FY 2014 FY 2015 FY 2016 FY 2017 FY 2018
Target 11% 11% 7% 7% 7% 7% Actual 6% 7% 7% 7% Status Exceeded Exceeded Met Met Trend Stable trend
Adjustments to targets
During FY 2015, the measure parameters were refined to better align with employee engagement by excluding nature of action codes, such as death and separations initiated by agency action, that do not reflect an employee’s deliberate desire and intention to leave the agency. Based on the analysis of Commerce-wide and Government data, the target was revised.
DM - 75

C. Hiring Timeline (Average number of calendar days to complete hiring actions) FY 2011 FY 2012 FY 2013 FY 2014 FY 2015 FY 2016 FY 2017 FY 2018
Target 80 80 80 65 65 65 65 65 Actual 83 84 103 91 88 101 Status Met Met Not Met Not Met Not Met Not Met Trend Negative
Explanation if Not Met
The 36 days beyond the target can be mostly attributed to the time the job announcement remained open (10 days longer than standard), issuing the official job offer (6 days longer), the manager’s review and interview of applicants (5 days longer), issuing the tentative offer and security processing (5 days longer), HR drafting the announcement (3 days longer), and HR finalizing and posting job opportunity announcement on USAJOBS (3 days longer).
D. Candidate Quality (Percentage of managers saying referred applicants had skills to perform the job) FY 2011 FY 2012 FY 2013 FY 2014 FY 2015 FY 2016 FY 2017 FY 2018
Target 70% 70% 70% 70% 70% Actual 61% 61% 62% 63% 64% 62% Status Met Met Not Met Trend Maintain standard, Stable trend
Explanation if Not Met
This target is based on the % of managers that provided a rating of 8 or higher on a scale of 1 - 10 to the question "Applicants referred had the skills to perform the job" in the Chief Human Capital Officer’s Management Satisfaction Survey. Less than 62% of managers in CENSUS, EDA, NIST, NOAA, NTIA, and NTIS provided a rating of 8 or higher in this question, which contributed to not meeting the target of 70%.
E. Disability Hires (Percentage of new hires that have a disability) FY 2011 FY 2012 FY 2013 FY 2014 FY 2015 FY 2016 FY 2017 FY 2018
Target 9.0% 10.0% 12.5% 13.0% 13.5% Actual 12.3% 7.3% 12.3% 15.1% Status Not Met Exceeded Exceeded Trend Positive trend Notes The FY 2017 target has been established as 13.0% based on incremental increases of .5% between FY 2016 to FY 2018.
DM - 76

F. Veteran Hires (Percentage of new hires that are veterans) FY 2011 FY 2012 FY 2013 FY 2014 FY 2015 FY 2016 FY 2017 FY 2018
Target 16.4% 20.2% 27.5% 25.9 TBD Actual 13.4% 12.5% 13.7% 13.9% Status Not Met Not Met Not Met Trend Positive trend
Explanation if Not Met
While there was a slight increase in veterans hiring over the previous fiscal year, one possible reason for not reaching the veterans hiring goal is due to the lack of available resources and/or personnel for targeted outreach and recruitment. While some bureaus do well because they have allocated the necessary resources and staff (Census, USPTO), others which lack those resources, impacts the department’s overall hiring efforts.
OPM establishes the annual goal is established based on the previous year’s hiring “average” of agencies of similar numbers of employees (Commerce is grouped with Interior, Transportation, and the Social Security Administration). Transportation and the Social Security Administration tend to fill 35% or more of their vacancies annually with veterans. Both DOT and SSA have Corporate Outreach and Recruitment Offices which participate in numerous veterans recruitment and outreach activities.
Adjustments to targets
Annual targets for Commerce are based upon the previous year’s average for the group of agencies with populations of 40,000 to 80,000, as established by the President’s Council on Veteran Employment. Since averages are determined based on previous year’s actual hiring rate, the FY 2018 target will not be established until after FY 2017.
Resource Requirements Table
FY 2011 Actual
FY 2012 Actual
FY 2013 Actual
FY 2014 Actual
FY 2015 Actual
FY 2016 Actual
FY 2017 CR Annualization
FY 2018 Base
Increase / Decrease
FY 2018 Request
Goal 5: Operational Excellence
Total Funding 57.5 56.2 51.1 55.5 56.0 57.7 57.9 59.3 3.7 63.0
Total FTE 173 151 155 152 156 158 158 158 20 178
FTE does not include staff funded by the Working Capital fund.
DM - 77