deploying iptv and ott - digitaltveurope.com · iptv and ott video services. these new tools will...
TRANSCRIPT
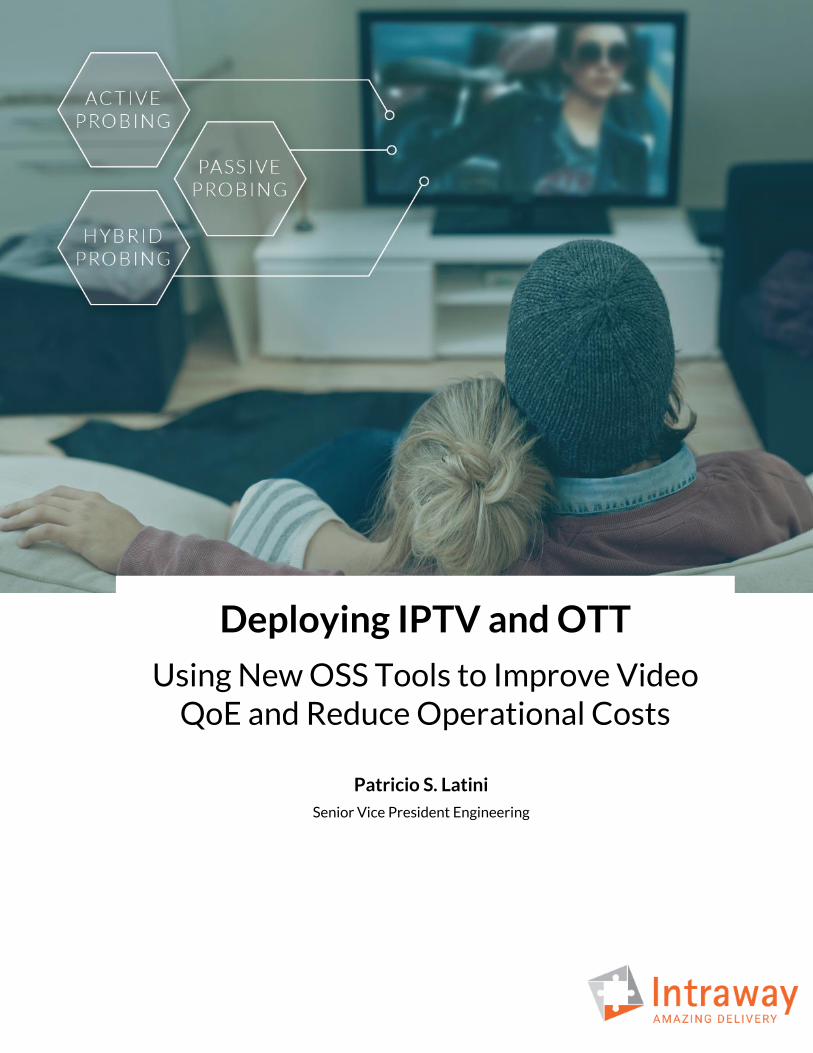
Deploying IPTV and OTT
Using New OSS Tools to Improve Video QoE and Reduce Operational Costs
Patricio S. Latini
Senior Vice President Engineering
All contents are Copyright © 2016 Intraway Corporation. All rights reserved. Intraway, the Intraway logo, is a registered trademarks of Intraway Corporation. and/or its affiliates in the U.S. and certain other countries. All other trademarks mentioned in this document or Website are the property of the irrespective owners. The use of the word partner does not imply a partnership relationship between
Intraway and any other company.
Table of Contents
Title Page Number
INTRODUCTION ________________________________________________________________________________________________ 3 CURRENT SITUATION __________________________________________________________________________________________ 3 HOW TO MEASURE THE QUALITY OF EXPERIENCE? ________________________________________________________ 4 1. QOE INFORMATION USERS _____________________________________________________________________________ 4 2. SERVICE INFORMATION DATA SOURCES _____________________________________________________________ 6
2.1. ACTIVE PROBING _______________________________________________________________________________ 6 2.1.1. CASE STUDY _______________________________________________________________________ 6
2.2. PASSIVE PROBING ______________________________________________________________________________ 8 2.2.1. USE CASE _________________________________________________________________________ 10
2.3. HYBRID PROBING _____________________________________________________________________________ 11 2.4. PROBING METHODS COMPARISON _________________________________________________________ 12
3. END TO END OTT MONITORING ARCHITECTURE VIEW ____________________________________________ 13 CONCLUSIONS ________________________________________________________________________________________________ 14 BIBLIOGRAPHY ________________________________________________________________________________________________ 15 ABBREVIATIONS & ACRONYMS ______________________________________________________________________________ 16
List of Figures
Title Page Number
FIGURE 1 - QOE PLATFORM USERS 5
FIGURE 2 – ACTIVE QOE PROBES ARCHITECTURE 6
FIGURE 3 – YOUTUBE 480P/720P/1080P VIDEO AVERAGE BANDWIDTH REPORT (SINGLE PROBE) 7
FIGURE 4 – YOUTUBE 1080P VIDEO AVERAGE BANDWIDTH REPORT (MULTIPLE PROBES) 7
FIGURE 5 – VIMEO 1080P VIDEO AVERAGE BANDWIDTH REPORT (SINGLE PROBE) 8
FIGURE 6 – PASSIVE PROBE DEVICE AGNOSTIC ARCHITECTURE 10
FIGURE 7 – REAL TIME WIFI SPECTRUM VIEW 11
FIGURE 8 – END TO END OTT SERVICES MONITORING VIEW 13
List of Tables
Title Page Number
TABLE 1 – QOE INFORMATION USERS 5
TABLE 2– SOME OF THE PARAMETERS THAT CAN BE REPORTED TROUGH A SOFTWARE AGENT 9
TABLE 3 – PROBING METHODS COMPARISON 12
All contents are Copyright © 2016 Intraway Corporation. All rights reserved. Intraway, the Intraway logo, is a registered trademarks of Intraway Corporation. and/or its affiliates in the U.S. and certain other countries. All other trademarks mentioned in this document or Website are the property of the irrespective owners. The use of the word partner does not imply a partnership relationship between
Intraway and any other company.
Introduction
Over the last years, many in the cable industry have focused on preparing a strategy to successfully deploy IPTV services. In parallel, the huge expansion of over-the-top (OTT) TV services has played a key role in understanding how IP networks behave with the increased load and patterns of these video services. This paper analyzes some of the lessons learned from OTT video delivery and proposes a set of new tools to have real-time monitoring and historical dash-boarding of key parameters of IPTV and OTT video services. These new tools will allow the cable companies to have a much more accurate understanding of the end user quality of experience and thereby, allow them to react more quickly to problems in the different parts of the networks such as ingestion, content distribution, IP delivery, and the home network. A full section analyzes and proposes solutions for the Home Network environment and in particular, how to be able to remotely monitor, troubleshoot and predict Wi-Fi networks behaviors given the prevalence of Wi-Fi in IPTV and OTT Set-top boxes (STB) and the interferences that may potentially degrade the service. The conclusions will allow cable operators to understand how to leverage existing experiences learned from OTT TV services and use them for the planning of their IPTV and OTT deployments. Also, a new set of Operational Support System (OSS) tools will be available and will promote the improvement of the end user Quality of Experience by having a real-time control of the service’s Key Performance Indicators (KPI while reducing operational costs by better understanding end user problems in the home network environment.
Current Situation
In general, most cable operators are exploring or employing the delivery of video using the IP protocol. While initially the multicast delivery of IP video was considered for on net environments, that trend quickly changed in the last few years in favor of IP unicast methods and particularly towards Adaptive Bitrate Streaming (ABR) over HTTP particularly for its compatibility with personal computers, phones, and tablets. In parallel, apart from their own offering, service providers still need to properly support the delivery of Over the Top Entertainment (OTT) services, which currently account for more than 60% of the total traffic on the operator’s networks based on Global Internet Phenomena Report from Sandvine [1].
All contents are Copyright © 2016 Intraway Corporation. All rights reserved. Intraway, the Intraway logo, is a registered trademarks of Intraway Corporation. and/or its affiliates in the U.S. and certain other countries. All other trademarks mentioned in this document or Website are the property of the irrespective owners. The use of the word partner does not imply a partnership relationship between
Intraway and any other company.
As a result, there are two different cases where the cable operators need to focus on clearly understanding and assuring the Quality of Experience delivered to the end user.
1) Operator’s Own IP Video Offering: a. Over its own network, in a controlled environment allowing them to provide
better content libraries and guaranteed Quality of Service. b. Over the Internet, in order to provide a TV anywhere service with a similar
offering than the on-net service. 2) Other OTT Provider Offerings:
a. As mentioned before, OTT services account for more than 60% of the service provider’s network traffic and their correct operation is often perceived as a differentiator by end users when choosing their broadband service.
How to Measure the Quality of Experience?
“If you cannot measure it, you cannot improve it.”– Lord Kelvin Understanding and measuring the Quality of Experience delivered to a subscriber for a given service has been a high priority topic for cable operators for a long time. While some of them have been successfully implementing methods and systems to accomplish that objective, in general, there has been a gap in the information provided by the OSS systems versus the information required to support full end-to-end QoE measurements. In order to ease the understanding of the problem, the analysis is segmented into two parts:
a) QoE Information User b) Service Information Data Source
1. QoE Information Users In general, there are three groups of QoE data users that by nature require different types of information and which are used as references in Figure 1. Real-Time Users: These are the information users that require access in real time to the QoE information of a single service, such as Call Center or Workforce management platforms, where the information is necessary to take immediate decisions. Service Monitoring Users: These involve the systems used for near real-time detection in a preventive or corrective manner of service outages or degradations. Typically, this applies to the NOC and/or plant maintenance groups.
All contents are Copyright © 2016 Intraway Corporation. All rights reserved. Intraway, the Intraway logo, is a registered trademarks of Intraway Corporation. and/or its affiliates in the U.S. and certain other countries. All other trademarks mentioned in this document or Website are the property of the irrespective owners. The use of the word partner does not imply a partnership relationship between
Intraway and any other company.
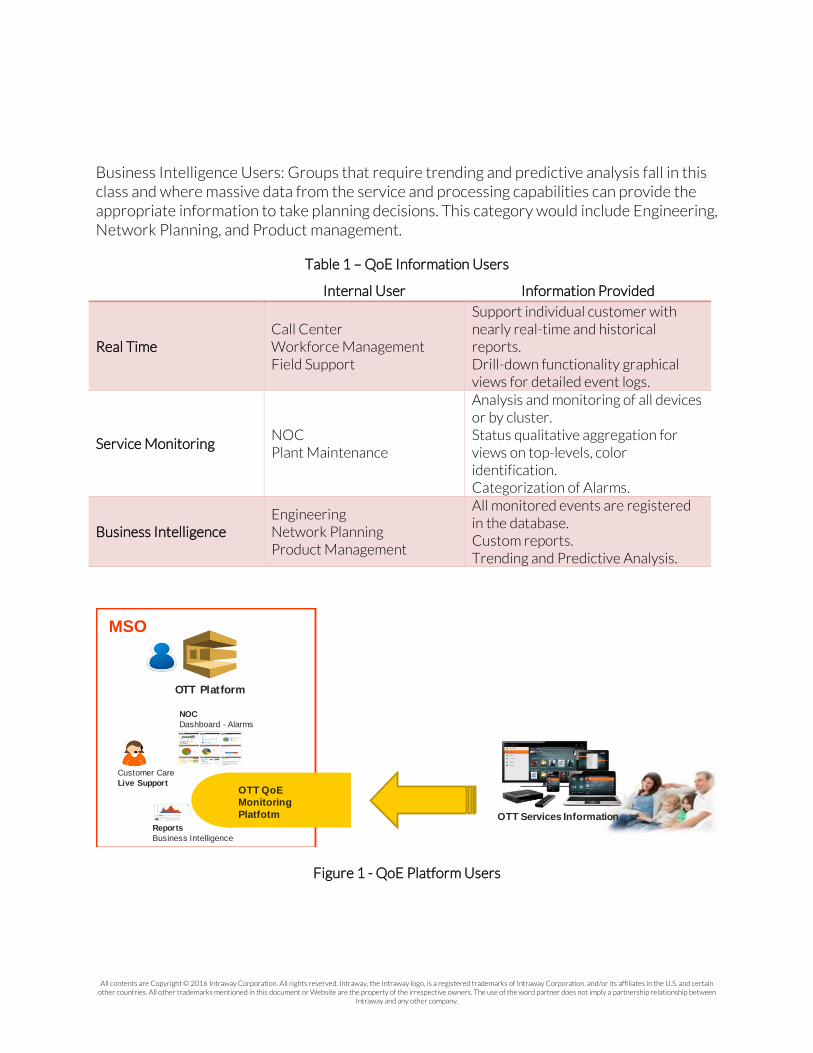
Business Intelligence Users: Groups that require trending and predictive analysis fall in this class and where massive data from the service and processing capabilities can provide the appropriate information to take planning decisions. This category would include Engineering, Network Planning, and Product management.
Table 1 – QoE Information Users
Internal User Information Provided
Real Time Call Center Workforce Management Field Support
Support individual customer with nearly real-time and historical reports. Drill-down functionality graphical views for detailed event logs.
Service Monitoring NOC Plant Maintenance
Analysis and monitoring of all devices or by cluster. Status qualitative aggregation for views on top-levels, color identification. Categorization of Alarms.
Business Intelligence Engineering Network Planning Product Management
All monitored events are registered in the database. Custom reports. Trending and Predictive Analysis.
Figure 1 - QoE Platform Users
OTT Services Information
OTT Platform
ISP X
MSO
OTT QoE
Monitoring
Platfotm
Customer Care
Live Support
Reports
Business Intelligence
NOC
Dashboard - Alarms
All contents are Copyright © 2016 Intraway Corporation. All rights reserved. Intraway, the Intraway logo, is a registered trademarks of Intraway Corporation. and/or its affiliates in the U.S. and certain other countries. All other trademarks mentioned in this document or Website are the property of the irrespective owners. The use of the word partner does not imply a partnership relationship between
Intraway and any other company.
2. Service Information Data Sources In order to successfully evaluate the QoE of a service, two different methods and technologies need to be considered, where each one has its advantages and disadvantages.
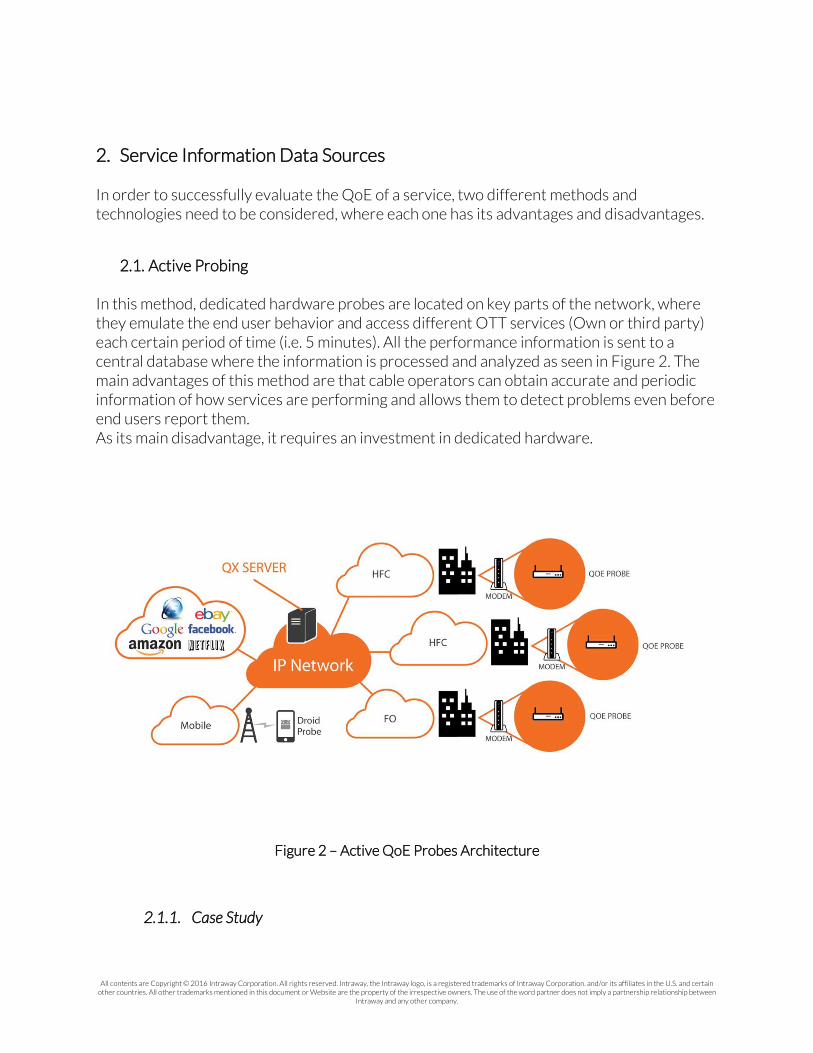
2.1. Active Probing In this method, dedicated hardware probes are located on key parts of the network, where they emulate the end user behavior and access different OTT services (Own or third party) each certain period of time (i.e. 5 minutes). All the performance information is sent to a central database where the information is processed and analyzed as seen in Figure 2. The main advantages of this method are that cable operators can obtain accurate and periodic information of how services are performing and allows them to detect problems even before end users report them. As its main disadvantage, it requires an investment in dedicated hardware.
Figure 2 – Active QoE Probes Architecture
2.1.1. Case Study
All contents are Copyright © 2016 Intraway Corporation. All rights reserved. Intraway, the Intraway logo, is a registered trademarks of Intraway Corporation. and/or its affiliates in the U.S. and certain other countries. All other trademarks mentioned in this document or Website are the property of the irrespective owners. The use of the word partner does not imply a partnership relationship between
Intraway and any other company.
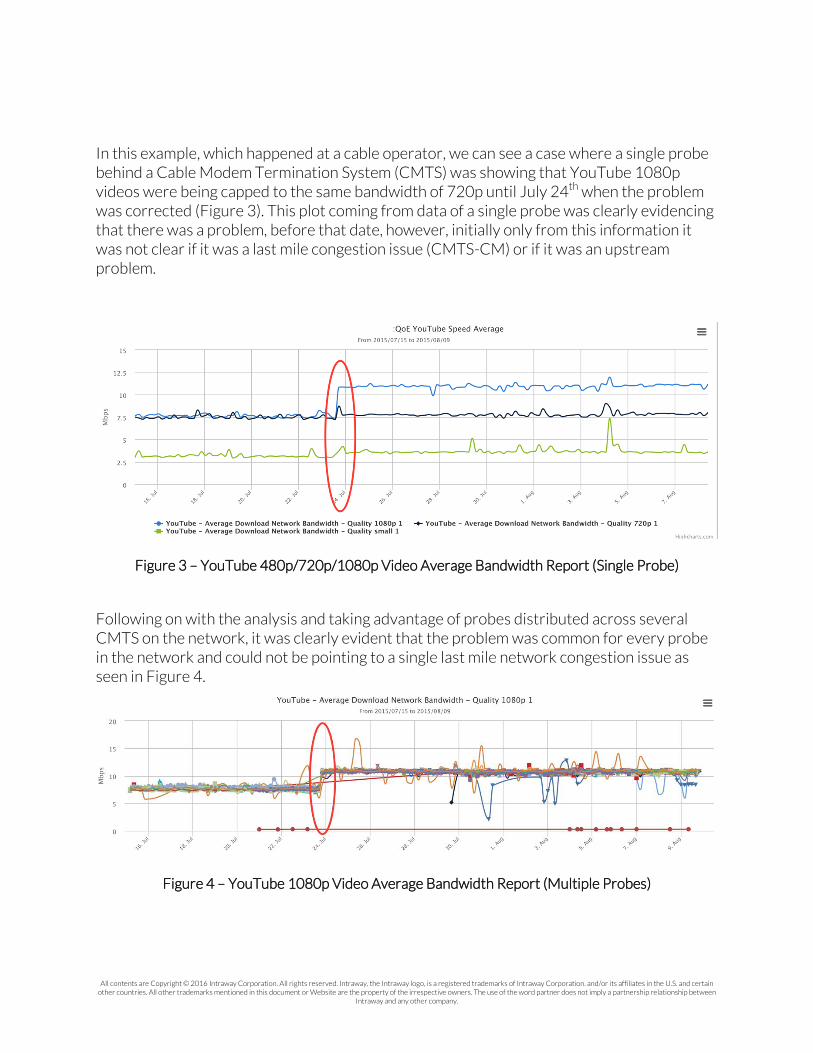
In this example, which happened at a cable operator, we can see a case where a single probe behind a Cable Modem Termination System (CMTS) was showing that YouTube 1080p videos were being capped to the same bandwidth of 720p until July 24th when the problem was corrected (Figure 3). This plot coming from data of a single probe was clearly evidencing that there was a problem, before that date, however, initially only from this information it was not clear if it was a last mile congestion issue (CMTS-CM) or if it was an upstream problem.
Figure 3 – YouTube 480p/720p/1080p Video Average Bandwidth Report (Single Probe)
Following on with the analysis and taking advantage of probes distributed across several CMTS on the network, it was clearly evident that the problem was common for every probe in the network and could not be pointing to a single last mile network congestion issue as seen in Figure 4.
Figure 4 – YouTube 1080p Video Average Bandwidth Report (Multiple Probes)
All contents are Copyright © 2016 Intraway Corporation. All rights reserved. Intraway, the Intraway logo, is a registered trademarks of Intraway Corporation. and/or its affiliates in the U.S. and certain other countries. All other trademarks mentioned in this document or Website are the property of the irrespective owners. The use of the word partner does not imply a partnership relationship between
Intraway and any other company.
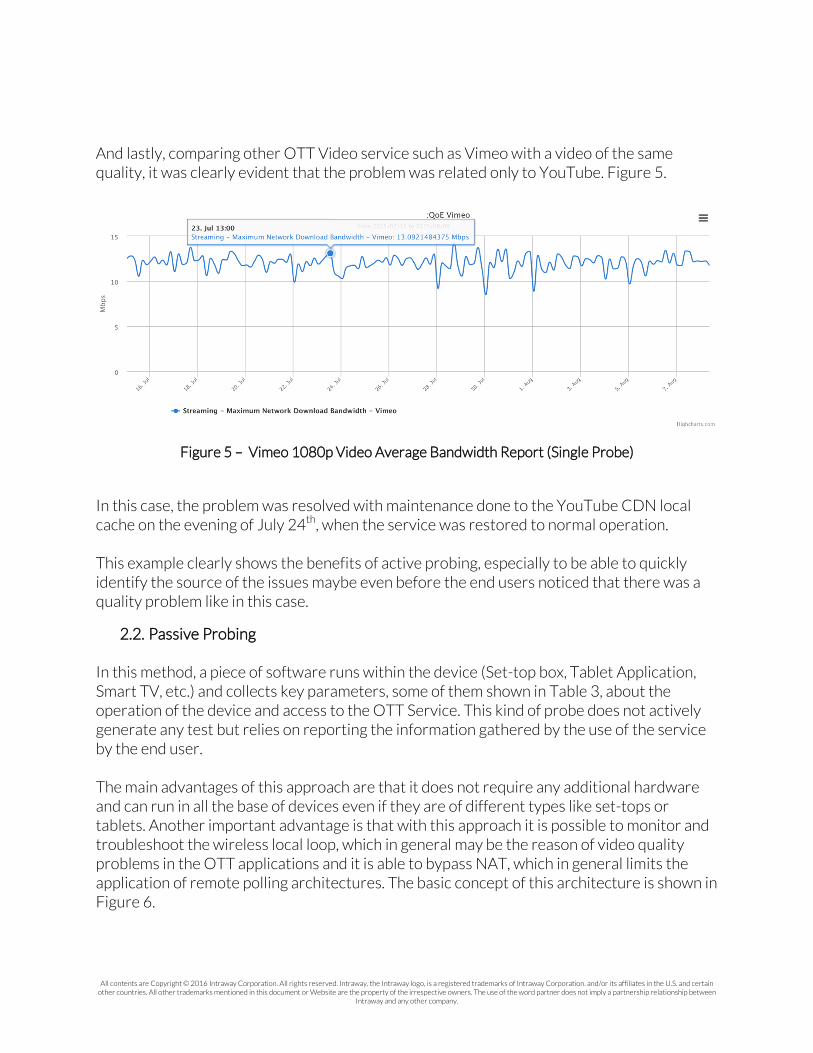
And lastly, comparing other OTT Video service such as Vimeo with a video of the same quality, it was clearly evident that the problem was related only to YouTube. Figure 5.
Figure 5 – Vimeo 1080p Video Average Bandwidth Report (Single Probe)
In this case, the problem was resolved with maintenance done to the YouTube CDN local cache on the evening of July 24th, when the service was restored to normal operation. This example clearly shows the benefits of active probing, especially to be able to quickly identify the source of the issues maybe even before the end users noticed that there was a quality problem like in this case.
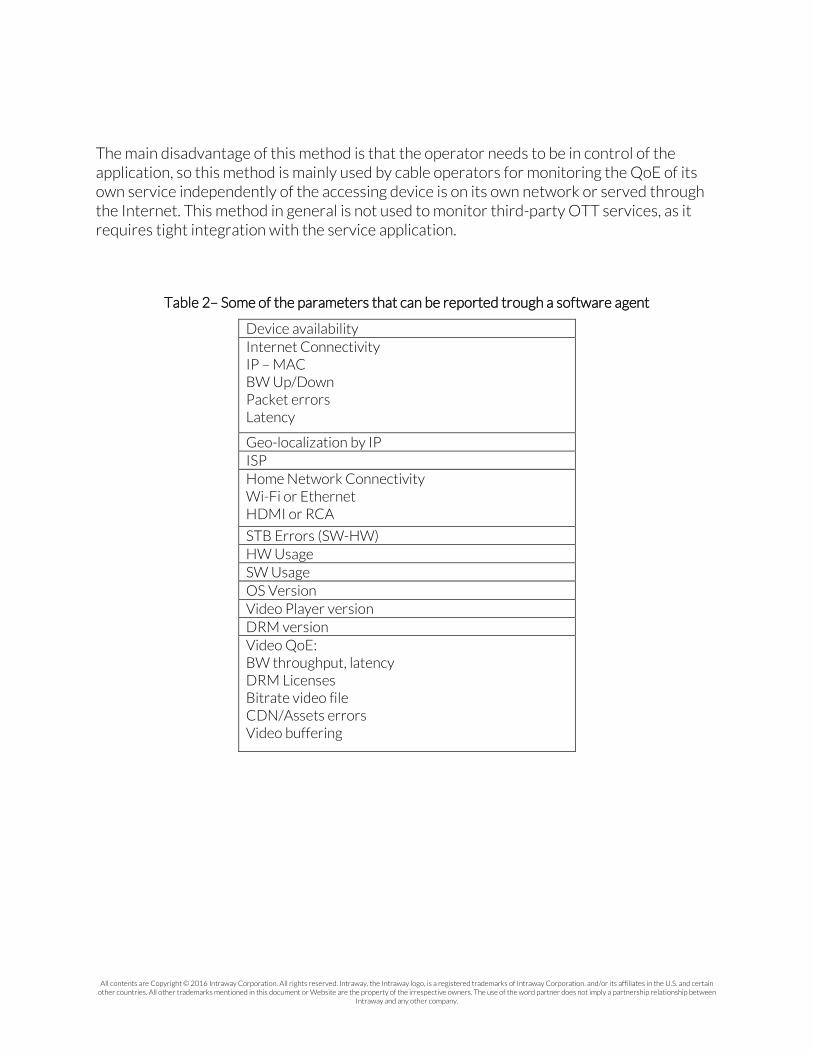
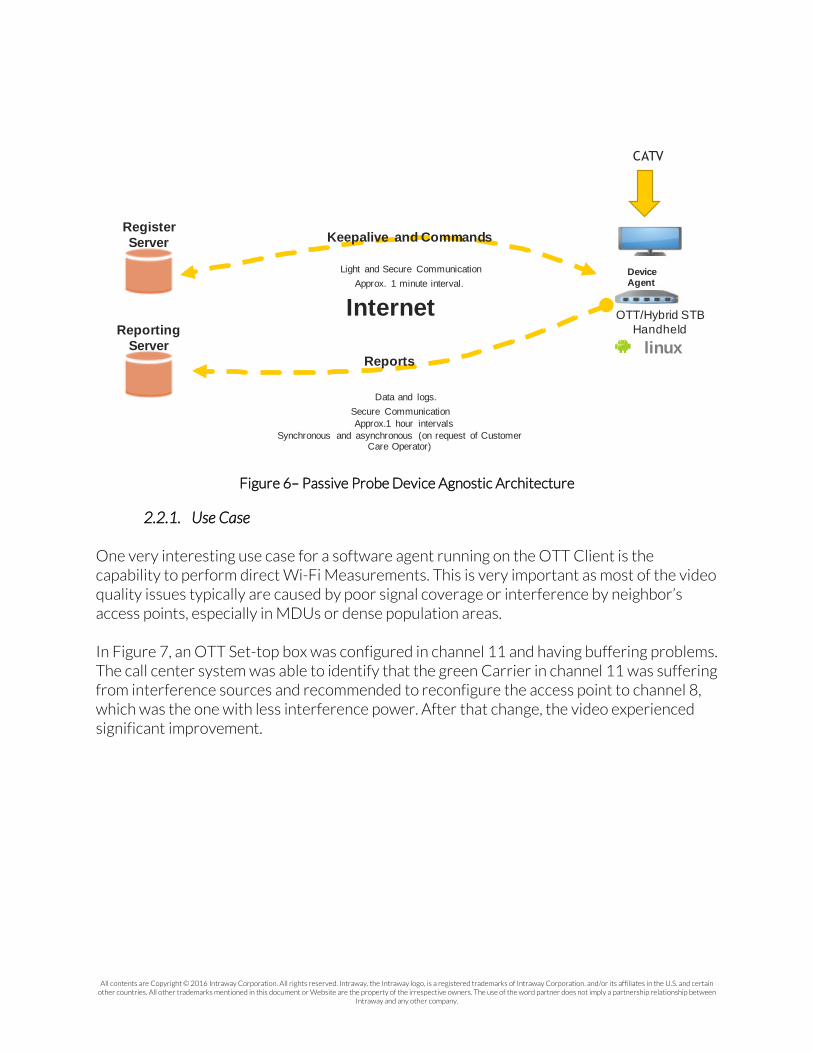
2.2. Passive Probing In this method, a piece of software runs within the device (Set-top box, Tablet Application, Smart TV, etc.) and collects key parameters, some of them shown in Table 3, about the operation of the device and access to the OTT Service. This kind of probe does not actively generate any test but relies on reporting the information gathered by the use of the service by the end user. The main advantages of this approach are that it does not require any additional hardware and can run in all the base of devices even if they are of different types like set-tops or tablets. Another important advantage is that with this approach it is possible to monitor and troubleshoot the wireless local loop, which in general may be the reason of video quality problems in the OTT applications and it is able to bypass NAT, which in general limits the application of remote polling architectures. The basic concept of this architecture is shown in Figure 6.
All contents are Copyright © 2016 Intraway Corporation. All rights reserved. Intraway, the Intraway logo, is a registered trademarks of Intraway Corporation. and/or its affiliates in the U.S. and certain other countries. All other trademarks mentioned in this document or Website are the property of the irrespective owners. The use of the word partner does not imply a partnership relationship between
Intraway and any other company.
The main disadvantage of this method is that the operator needs to be in control of the application, so this method is mainly used by cable operators for monitoring the QoE of its own service independently of the accessing device is on its own network or served through the Internet. This method in general is not used to monitor third-party OTT services, as it requires tight integration with the service application.
Table 2– Some of the parameters that can be reported trough a software agent
Device availability Internet Connectivity IP – MAC BW Up/Down Packet errors Latency
Geo-localization by IP ISP
Home Network Connectivity Wi-Fi or Ethernet HDMI or RCA
STB Errors (SW-HW) HW Usage SW Usage OS Version Video Player version DRM version Video QoE: BW throughput, latency DRM Licenses Bitrate video file CDN/Assets errors Video buffering
All contents are Copyright © 2016 Intraway Corporation. All rights reserved. Intraway, the Intraway logo, is a registered trademarks of Intraway Corporation. and/or its affiliates in the U.S. and certain other countries. All other trademarks mentioned in this document or Website are the property of the irrespective owners. The use of the word partner does not imply a partnership relationship between
Intraway and any other company.
Figure 6– Passive Probe Device Agnostic Architecture
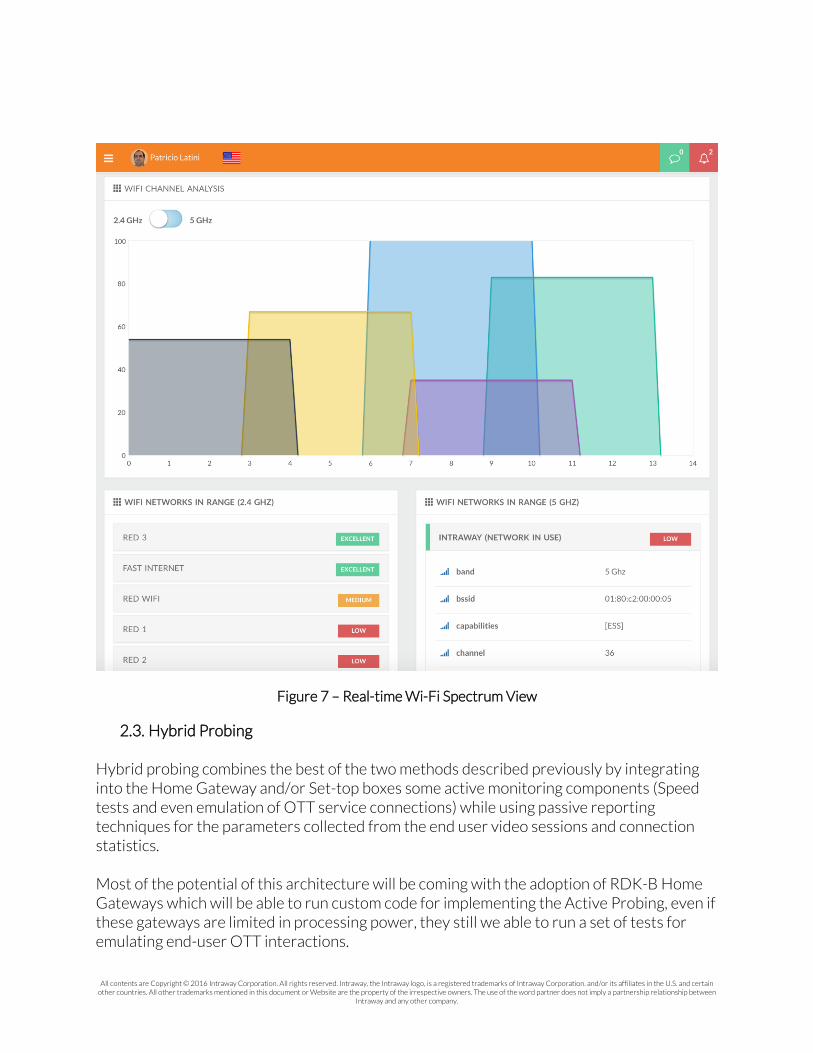
2.2.1. Use Case One very interesting use case for a software agent running on the OTT Client is the capability to perform direct Wi-Fi Measurements. This is very important as most of the video quality issues typically are caused by poor signal coverage or interference by neighbor’s access points, especially in MDUs or dense population areas. In Figure 7, an OTT Set-top box was configured in channel 11 and having buffering problems. The call center system was able to identify that the green Carrier in channel 11 was suffering from interference sources and recommended to reconfigure the access point to channel 8, which was the one with less interference power. After that change, the video experienced significant improvement.
Register
Server
Reporting
Server
Internet
Device Agent
OTT/Hybrid STB
Handheld
Keepalive and Commands
Light and Secure Communication
Approx. 1 minute interval.
Reports
Data and logs.
Secure Communication
Approx.1 hour intervals
Synchronous and asynchronous (on request of Customer Care Operator)
CATV
linux
All contents are Copyright © 2016 Intraway Corporation. All rights reserved. Intraway, the Intraway logo, is a registered trademarks of Intraway Corporation. and/or its affiliates in the U.S. and certain other countries. All other trademarks mentioned in this document or Website are the property of the irrespective owners. The use of the word partner does not imply a partnership relationship between
Intraway and any other company.
Figure 7 – Real-time Wi-Fi Spectrum View
2.3. Hybrid Probing Hybrid probing combines the best of the two methods described previously by integrating into the Home Gateway and/or Set-top boxes some active monitoring components (Speed tests and even emulation of OTT service connections) while using passive reporting techniques for the parameters collected from the end user video sessions and connection statistics. Most of the potential of this architecture will be coming with the adoption of RDK-B Home Gateways which will be able to run custom code for implementing the Active Probing, even if these gateways are limited in processing power, they still we able to run a set of tests for emulating end-user OTT interactions.
All contents are Copyright © 2016 Intraway Corporation. All rights reserved. Intraway, the Intraway logo, is a registered trademarks of Intraway Corporation. and/or its affiliates in the U.S. and certain other countries. All other trademarks mentioned in this document or Website are the property of the irrespective owners. The use of the word partner does not imply a partnership relationship between
Intraway and any other company.
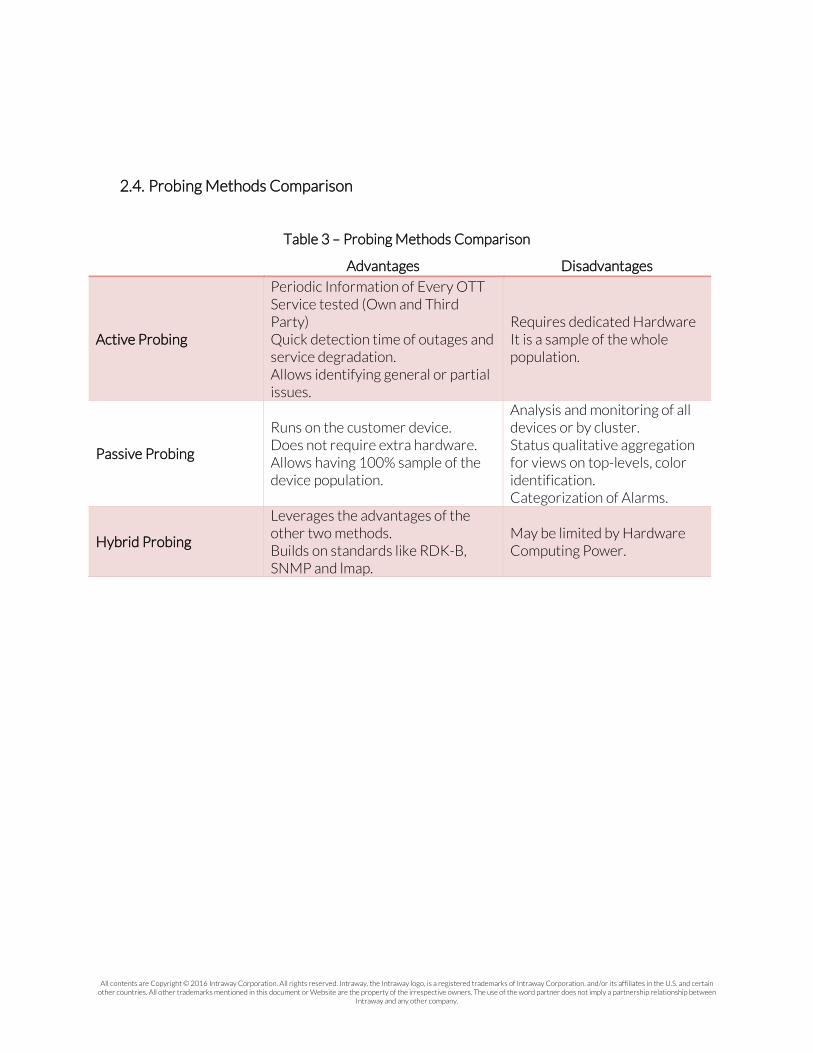
2.4. Probing Methods Comparison
Table 3 – Probing Methods Comparison
Advantages Disadvantages
Active Probing
Periodic Information of Every OTT Service tested (Own and Third Party) Quick detection time of outages and service degradation. Allows identifying general or partial issues.
Requires dedicated Hardware It is a sample of the whole population.
Passive Probing
Runs on the customer device. Does not require extra hardware. Allows having 100% sample of the device population.
Analysis and monitoring of all devices or by cluster. Status qualitative aggregation for views on top-levels, color identification. Categorization of Alarms.
Hybrid Probing
Leverages the advantages of the other two methods. Builds on standards like RDK-B, SNMP and lmap.
May be limited by Hardware Computing Power.
All contents are Copyright © 2016 Intraway Corporation. All rights reserved. Intraway, the Intraway logo, is a registered trademarks of Intraway Corporation. and/or its affiliates in the U.S. and certain other countries. All other trademarks mentioned in this document or Website are the property of the irrespective owners. The use of the word partner does not imply a partnership relationship between
Intraway and any other company.
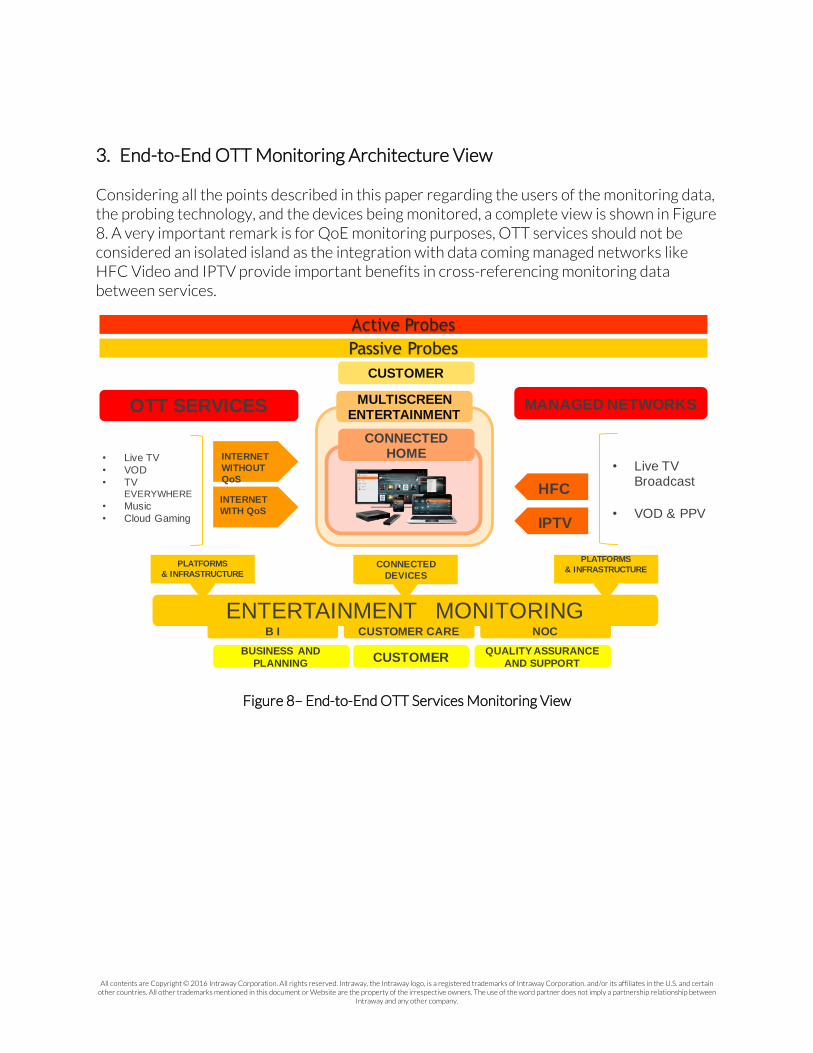
3. End-to-End OTT Monitoring Architecture View Considering all the points described in this paper regarding the users of the monitoring data, the probing technology, and the devices being monitored, a complete view is shown in Figure 8. A very important remark is for QoE monitoring purposes, OTT services should not be considered an isolated island as the integration with data coming managed networks like HFC Video and IPTV provide important benefits in cross-referencing monitoring data between services.
Figure 8– End-to-End OTT Services Monitoring View
CONNECTED HOME
MULTISCREEN ENTERTAINMENT
MANAGED NETWORKS
HFC
IPTV
• Live TV Broadcast
• VOD & PPV
CUSTOMER
OTT SERVICES
INTERNET
WITHOUT
QoS
• Live TV
• VOD
• TV EVERYWHERE
• Music
• Cloud Gaming
INTERNET
WITH QoS
CONNECTED
DEVICES
PLATFORMS
& INFRASTRUCTUREPLATFORMS
& INFRASTRUCTURE
ENTERTAINMENT MONITORINGB I CUSTOMER CARE NOC
CUSTOMERQUALITY ASSURANCE
AND SUPPORT
BUSINESS AND
PLANNING
Passive Probes
Active Probes
All contents are Copyright © 2016 Intraway Corporation. All rights reserved. Intraway, the Intraway logo, is a registered trademarks of Intraway Corporation. and/or its affiliates in the U.S. and certain other countries. All other trademarks mentioned in this document or Website are the property of the irrespective owners. The use of the word partner does not imply a partnership relationship between
Intraway and any other company.
Conclusions
This paper analyzed the current status of OSS Tools that monitor OTT Services
explaining the main Network Operation variables as well as the Key Performance
Indicators used to adjust them.
A detailed explanation of the Internal data users was provided along with the different
information needs for each one. Later, a view from probing technologies was presented
with a detailed explanation and use cases of each of them together with an advantages
and disadvantages comparison.
Finally, the last chapter presented a global architecture view of an end-to-end OTT
Monitoring platform.
For some time, cable operators have worked to understand how OTT Services affect
their networks, how to efficiently manage them and how to assure the Quality of
Experience to their end users. The proposed tools provide an end-to-end approach to
have visibility of the quality of the different OTT offerings passing through their
networks, as well as ensuring that their OTT offerings running over the Internet properly
reach their customers. It is strongly recommended that cable operators use this kind of
tools and methods in order to provide better experiences to their users and reduce
operational costs.

All contents are Copyright © 2016 Intraway Corporation. All rights reserved. Intraway, the Intraway logo, is a registered trademarks of Intraway Corporation. and/or its affiliates in the U.S. and certain other countries. All other trademarks mentioned in this document or Website are the property of the irrespective owners. The use of the word partner does not imply a partnership relationship between
Intraway and any other company.
Bibliography
[1] Sandvine Incorporated. (2015). Global Internet Phenomena Report – Spring 201. Retrieved May 2016, from https://www.sandvine.com/downloads/general/global-internet-phenomena/2011/1h-2011-global-internet-phenomena-report.pdf

All contents are Copyright © 2016 Intraway Corporation. All rights reserved. Intraway, the Intraway logo, is a registered trademarks of Intraway Corporation. and/or its affiliates in the U.S. and certain other countries. All other trademarks mentioned in this document or Website are the property of the irrespective owners. The use of the word partner does not imply a partnership relationship between
Intraway and any other company.
Abbreviations & Acronyms
CM Cable Modem CMTS Cable Modem Termination System CPE Customer Premises Equipment DOCSIS Data Over Cable Service Interface Specification OSS Operations Support System SNMP Simple Network Management Protocol OTT Over the Top STB Set-top Box IPTV Internet Protocol Television QoE Quality of Experience Wi-Fi Wireless Fidelity CDN Content Delivery Network ABR Adaptive Bit Rate HTTP Hyper Text Transfer Protocol MSO Multiple System Operator NOC Network Operations Center NAT Network Address Translation MDU Multiple Dwelling Unit ISP Internet Service Provider DRM Digital Rights Management SW Software HW Hardware IP Internet Protocol BW Bandwidth OS Operating System RDK-B Reference Design Kit – Broadband