deployment and performance characteristics of 5-foot ... · deployment and performance...
TRANSCRIPT

c/,
N A S A
n z I-
* * z
T E C H N I C A L NOTE
DEPLOYMENT A N D PERFORMANCE CHARACTERISTICS OF 5 -FOOT-DIAMETER (1.5 m) ATTACHED INFLATABLE DECELERATORS FROM MACH NUMBER 2.2 TO 4.4
by Hermun L. Bohon and R. Miserentino
LangZey Reseurch Center Humpton, Va. 23365
N A T I O N A L AERONAUTICS A N D SPACE A D M I N I S T R A T I O N W A S H I N G T O N , D. C. A U G U S T 1970
I l l1 I Ill I I I
I
https://ntrs.nasa.gov/search.jsp?R=19700026642 2018-06-13T02:46:58+00:00Z

I TECH LIBRARY KAFB, NM
I IlllllIIIIIllllllllllllllIll11111 1. Report No. 2. Government Acceision No. 3. Recipient's Catalog No.
NASA TN D-5840 4. Title and Subtitle
DEPLOYMENT AND PERFORMANCE CHARACTERISTICS 5. Report Date
August 1970 O F 5-FOOT-DIAMETER (1.5 m) ATTACHED INFLATABLE 6. Performing Organization Code
I
DECELERATORS FROM MACH NUMBER 2.2 TO 4.4 7. Author(s)
Herman L. Bohon and R. Miserentino
9. Performing Organization Name and Address
NASA Langley Research Center Hampton, Va. 23365
12. Sponsoring Agency Name and Address
National Aeronautics and Space Administration Washington, D.C. 20546
15. Supplementary Notes
Attached dece lera tors Unclassified
8. Performing Organization Report No. L-7023
10. Work Unit No. 124-07-23-01
11. Contract or Grant No.
13. Type of Report and Period Covered
Technical Note 14. Sponsoring Agency Code
- Unlimited Inflatable dece lera tors Blunt body
~
19. Security Classif. (of this report) 20. Security Classif. (of this page) 21. NO. of Pages 22. *ice' Unclassified Unclassified 43 $3.00
'For sale by the Clearinghouse for Federal Scientific and Technical Information
Springfield, Virginia 22151
I

DEPLOYMENT AND PERFORMANCE CHARACTERISTICS OF
5-FOOT-DIAMETER (1.5 m) ATTACHED INFLATABLE DECELERATORS
FROM MACH NUMBER 2.2 TO 4.4
By Herman L. Bohon and R. Miserentino Langley Research Center
SUMMARY
The need for a deceleration system with good supersonic performance characterist ics has led to the development of an attached inflatable decelerator (AID). An AID consists of an aerodynamically shaped, ram-air -inflated, fabric canopy attached directly to the payload to be decelerated.
To demonstrate the workability of the AID, four nominally identical models, 5 feet (1.5 m) in diameter, were designed, fabricated, and tested in the Arnold Engineering Development Center 16-foot supersonic propulsion tunnel. The models were fabricated from 1.86 ozm/yd2 (63 g/m2) Nomex cloth. The payload w a s represented by a 1200 conical aeroshell. Deployment characteristics and steady-state performance data were obtained over the Mach number range from 2.2 to 4.4 and at angles of attack from Oo to 100.
All models deployed successfully and exhibited flutter-free performance after deployment. Shock loads commonly associated with inflation of parachutes during deployment were not experienced. Force and moment data and ram-air pressure data were obtained throughout the Mach number range and at angles of attack from 0' to 10'. The high drag coefficient of 1.14 w a s in good agreement with the value predicted by the theory used in the design and indicated other AID shapes may be designed on a rational basis with a high degree of confidence.
INTRODUCTION
Mission studies for entry into planetary atmospheres have indicated potential advantages of deploying decelerators at hypersonic and supersonic speeds. In a M a r s mission, for example, references 1 and 2 demonstrate potential landed payload increases by deployment of a decelerator at high supersonic speeds rather than at transonic speeds. Deceleration at supersonic speeds has been demonstrated with ribbon-type parachutes and ballutes; however, these configurations have certain disadvantages. The need of high porosity of the parachute and small frontal angle of the ballute to assure stability of the decelerators at

ll1ll1l I I1 I I I
supersonic speeds resulted in low drag coefficients. (See ref. 3.) Thus, there is a need to advance the state-of-the-art of supersonic deceleration.
A promising device for efficient deceleration at high supersonic speeds is an attached inflatable decelerator (AID). The AID (see fig. 1)is a ram-air-inflated lightweight canopy which attaches directly to an aeroshell or payload and for a given application can be shaped to provide maximum drag and minimum structural mass. The feasibility of the AID has been demonstrated analytically in reference 4 wherein optimized AID shapes derived from isotensoid theory are presented. A mass efficiency analysis, presented in reference 5, shows that an AID requires the least mass when compared with other decelerators deployed at supersonic speeds in a high loading environment. The present paper presents the resul ts of an experimental wind-tunnel investigation of the deployment and performance characterist ics of an AID over the Mach number range from 2.2 to 4.4.
The wind-tunnel models consisted of a 5-foot-diameter (1.5 m) fabric decelerator canopy attached to a 2-foot-diameter (0.6 m) sting-mounted 120' conical body simulating the shell of an entry capsule. The models were tested in the 16-foot supersonic propulsion tunnel at Arnold Engineering Development Center. An alcohol-water vaporization system was used to initiate canopy deployment, and ram-air inlets completed inflation and maintained the deployed shape. Axial and normal force and moment data were obtained during deployment and under steady-state conditions at angles of attack.
The model design, fabrication, and static test resul ts are presented in reference 6 and some results of the wind-tunnel tes ts a r e presented in references 7 and 8. A motion-picture film supplement (L-1080) of all model deployments is available on loan; a request card and a description of the film are included at the back of this paper.
SYMBOLS
The units used for the physical quantities defined in this paper are both in U.S. Customary Units and in the International System of Units (SI). The appendix presents factors relating these two systems of units.
A frontal a rea
Ad total frontal a r ea of decelerator, nD2/4
Ae frontal area of aeroshell
CD drag coefficient
2

cD ,d
cD ,e
Cm
CN
D
FA
FN
M
Pi
PS
q,
R
T
Tt
t
X,Y
a!
drag coefficient based on total frontal area A,j
drag coefficient based on frontal area of aeroshell
pitching-moment coefficient
normal-f orce coefficient
maximum diameter of decelerator (see fig. 2)
axial load
normal force
Mach number
internal pressure
f ree-stream static pressure
f ree-stream dynamic pressure
AID radius excluding burble fence
temperature
total temperature
time
coordinates of AID shape (see fig. 2)
angle of attack
MODEL DESCRIPTION
Model Design
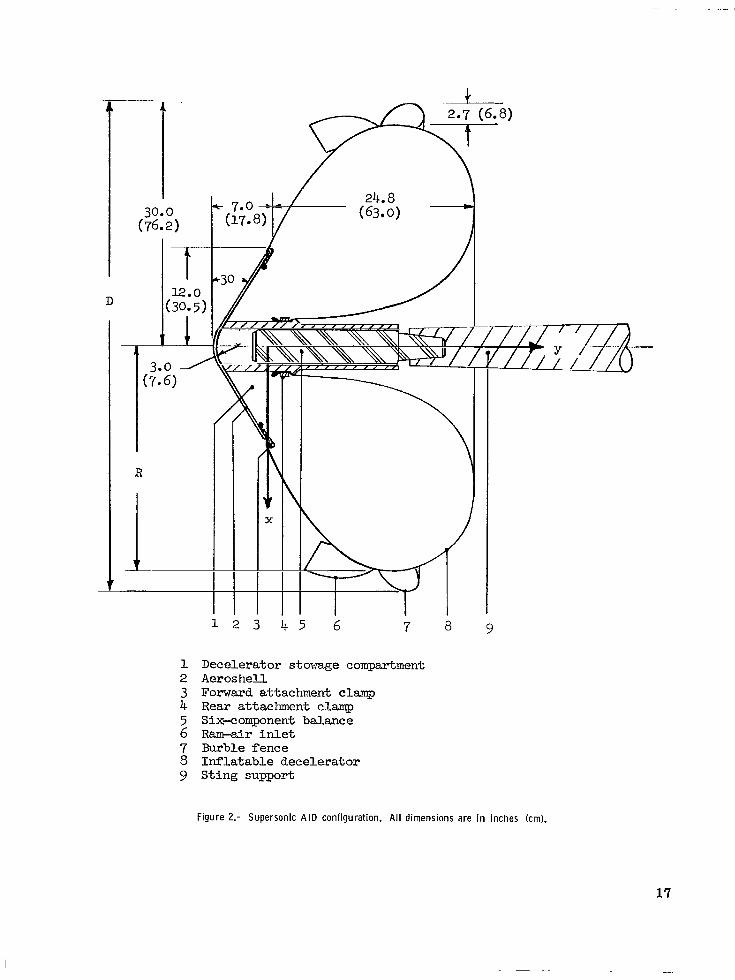
The AID assembly shown in figure 2 consists of a 120' conical aeroshell and the attached fabric decelerator envelope. The cone is representative of an entry vehicle
3
I

in which the payload and AID fabric a r e packaged. Upon deployment of the AID at supersonic speeds, the aeroshell may be retained as part of the deceleration system or may be separated from the payload by the AID to reduce the decelerated mass, In the present investigation the fabric was attached directly to the outer periphery of the aeroshell and an inner attachment to form the shape shown in figure 2.
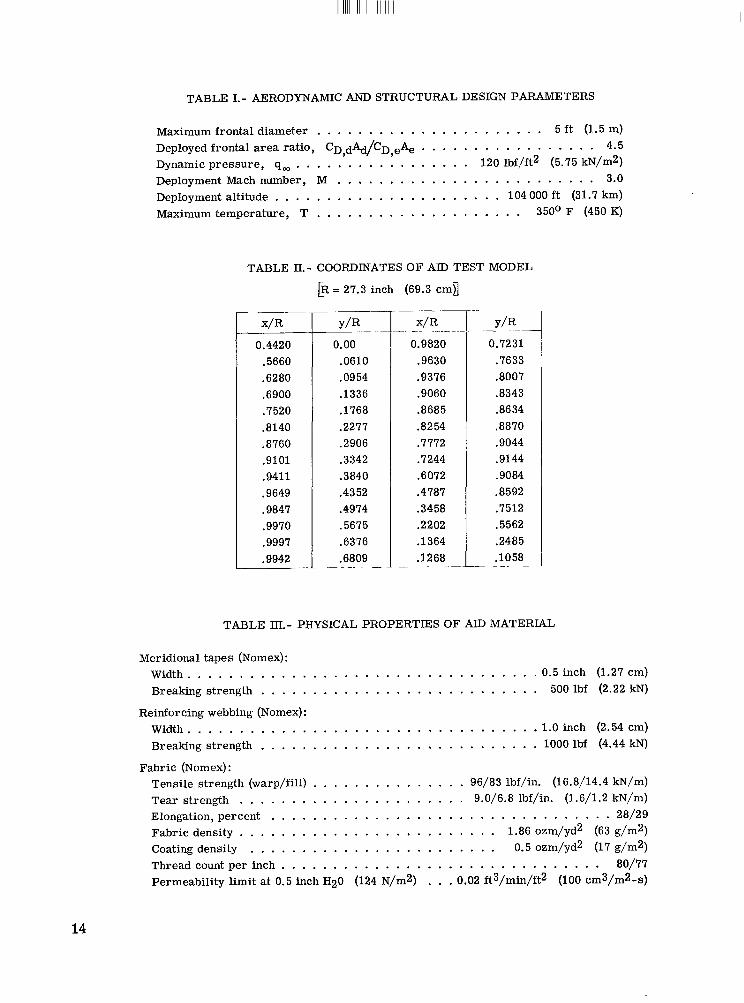
Design requirements.- The aerodynamic and structural requirements governing the AID design are given in table I. The models were sized by flow blockage limitations in the Arnold Enginewing Development Center l6-foot supersonic propulsion tunnel. Models were designed for deployment at a Mach number of 3 and a dynamic pressure of 120 lbf/ft2 (5.75 kN/m2) corresponding to an altitude of 104 000 feet (31.7 km). The effective drag a rea after deployment is 4.5 t imes that before deployment. The temperature requirement was governed by future application and placed a limitation on fabric material selection used in the design. With these specifications a development program w a s initiated in which AID models were designed and fabricated as reported in reference 6.
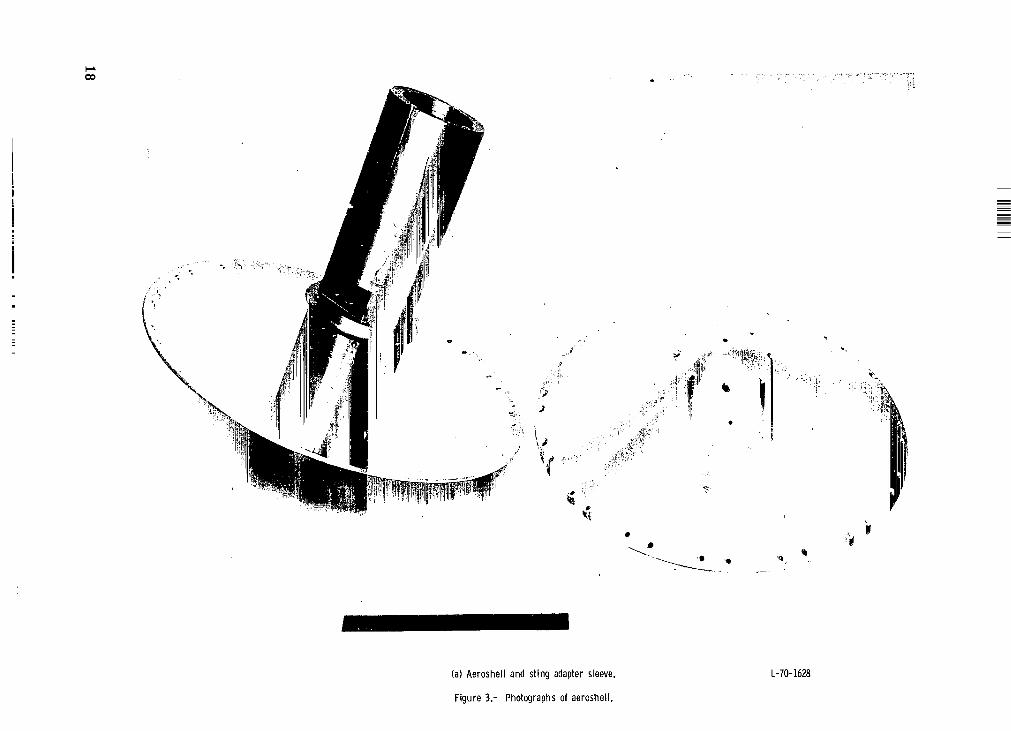
Aeroshell. - A boilerplate aeroshell was fabricated to meet the safety requirements established for the AEDC test facility. The aeroshell, fabricated from spun aluminum is 24 inches (61 cm) in diameter and has a 3-inch (7.6 cm) nose radius. The aeroshell is attached to a heavy support which mates with a sting-mounted internal balance. The aeroshell and support a r e shown by a photograph in figure 3(a). The support sleeve also serves as the inner attachment point for the canopy r e a r surface. (See fig. 2.) The outer attachment of the fabric and aeroshell is made by a ring clamp at the periphery of the aeroshell. (See fig. 3(b).)
Canopy design.- The fabric decelerator consists of the basic canopy with ram-air inlets and a burble fence. The AID canopy shape is obtained from an isotensoid analysis which utilizes both aerodynamic and structural disciplines in the derivation. Such an analysis is developed in reference 9 and analytical solutions yielding optimized design parameters of a class of attached inflatable decelerators applicable at supersonic speeds a r e presented in reference 4.
The shape is governed by the static equilibrium of forces resulting from aerodynamic pressure over the front surface, a concentrated force at the burble fence, base pressure, internal pressure, and resultant forces in the canopy. The aerodynamic pressure distribution used in the design is shown in reference 6 and was subsequently verified from a pressure survey on hard models of the AID shape in a Mach 3 stream. (See ref. 10.) The coordinates of the resulting aerodynamic shape a re given in table II.
The canopy internal pressure required to maintain a prescribed shape is obtained with four ram-air inlets equally spaced around the canopy. (See fig. 2.) The cloth inlets a r e 4 inches (10 cm) in diameter and a r e held in the airs t ream by cords attached to the inlet mouth and to the canopy forward of the inlets. (The cords are not shown in fig. 2.)
4

The inlet has a flap on the interior of the canopy which controls reverse flow. Details of the inlet design are presented in reference 6. The burble fence, located at the maximum diameter, is required at subsonic speeds to maintain uniform flow separation for subsonic stability. A preliminary investigation reported in reference 4 revealed that good subsonic stability was obtained with a fence which increased the AID diameter by 10 percent.
AID Construction and Packaging Mode
The AID is a gore and tape construction very similar to that of cloth parachutes. The meridian tapes are the primary load-carrying members and extend over the entire canopy length from the outer attachment to the inner attachment. Forty-eight meridians were used and were attached to the fabric gores by stitching. The gores a r e lobed between the meridian tapes to produce an essentially uniform s t r e s s resultant throughout the fabric.
All the fabric and tapes were Nomex. The fabric was 1.86 ozm/yd2 (63 g/m2); the meridians were 500 lb (2.22 kN) strength tapes 0.5 inch (1.3 cm) wide, but folded to one-quarter inch (0.63 cm) for attachment to the fabric. All fabric was coated with 0.5 ozm/yd2 (17 g/m2) Viton elastomer prior to fabrication to reduce the porosity. Seams and tapes were coated after fabrication. A photograph of an AID canopy and the aluminum aeroshell a r e shown in figure 4.
The canopy is folded and packaged in an annulus at the base of the aeroshell as illustrated in figure 5. The forward section of the canopy serves as the cover for the packaged configuration and is secured at the central sting with a "daisy chain" assembly made from a ser ies of loops attached to the canopy meridians. A pyrotechnic cutter is used to sever the restraining chord to permit rapid release upon deployment. A photograph of the packaged configuration showing the daisy chain loops and the pyrotechnic cutter is presented in figure 6.
Deployment of the canopy in this particular se r ies of tes ts was initiated by vaporization of an alcohol-water mixture contained inside the stowed canopy.1 When the fluid is released at the low static pressure of the aeroshell base, vaporization occurs with sufficient energy to deploy the canopy to its full rearward position. The ram-air inlets then complete the inflation process and maintain the canopy internal pressure. To evaluate the deployment sequence, a model was tested in an environmental chamber at a static pressure corresponding to the design test condition. (See ref. 6.) The first deployment resulted in canopy failure along the r ea r surface because of excessive circumferential loads. The canopy was unrestrained in the test and the absence of aerodynamic pressure on the front surface during rapid deployment left the canopy free to deform into a torus and thereby caused the failure.
lRecent tes t s (ref. 11)have been made on AID configurations with inlets mechanicallydeployed which eliminate the need for a fluid-vaporization system.
5
To safeguard against such events in wind-tunnel deployment, the models were reinforced as shown in figure 7. The reinforcements cons'ist of a cloth sleeve extending 7.5 in. (19 cm) along the canopy and circumferential webbing at the four locations shown in the figure. The sleeve was Nomex weave with a strength of 400 lbf/in. (70 kN/m) and the webbing was 1.0-inch-wide (2.5 cm) Nomex rated at 1000 lbf (4.44 kN) breaking strength.
The physical properties of the AID tapes and fabric are shown in table IIIand the masses of the components of the 5-foot-diameter (1.5 m) model are listed in table Tv. The nominal canopy mass of the test models is 4.18 lbm (1.90 kg).
INSTRUMENTATION
The internal pressure of the canopy was measured with a rapid-response 5-psi (34 kN/m2) differential-pressure transducer mounted in the aeroshell. Also, four static-pressure gages were mounted around the sting to measure steady-state base pressures before and after deployment. Temperatures of the back surface of the aeroshell and the inflation liquid were measured with iron-constantan thermocouples. The model forces were measured with an internally mounted six-component, strain-gage balance system with an accuracy of *0.3 percent for the range of loads expected in the tests. Five cameras with speeds ranging from 24 pps to 1000 pps were used to document the model motions.
All model data and other tunnel data were digitized and code punched on paper tape for on-line data reduction. Outputs from the balance, pressure transducer, and thermocouples were also continuously recorded on oscillographs for monitoring model dynamics.
TUNNEL TEST FACILITY
The models were tested in the 16-foot supersonic propulsion tunnel at the Arnold Engineering Development Center. The tunnel is a continuous flow facility designed to operate over a Mach number range from 1.5 to 6.0 and a wide range of dynamic pressure. However, during the test period of this investigation, this range was not available because of limited power of the tunnel. The stagnation temperature can be varied over a range from 150' F to 435' F (340 K to 497 K). An extensive description of the tunnel and its operating characteristics is presented in reference 12.
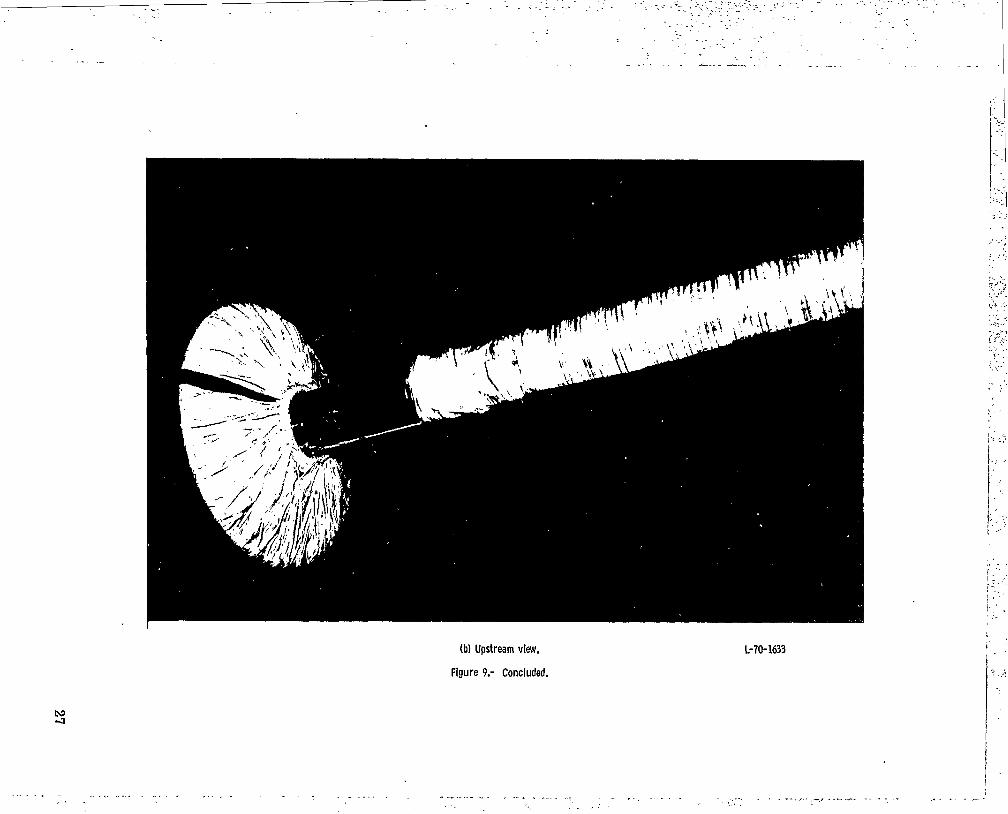
Details of the model sting support and location of models 1 and 2 in the test section a r e shown in figure 8(a). Because of difficulty encountered in maintaining established flow on models 1 and 2, models 3 and 4 were located further upstream as shown in figure 8(b). Photographs of the undeployed model mounted on the sting a r e shown in figures 9(a) and 9b).
6

RESULTS AND DISCUSSION
The deployment conditions for each of four test models a r e listed in table V. Table VI gives the values of Mach number, dynamic pressure, and angle of attack at which six-component force and moment data were obtained. Steady-state data obtained from model 2 at M = 2.2 were in e r r o r because of a tunnel-induced normal shock wave located too near the base of the model. Because of the large size of the models, the position of the downstream normal shock wave was sensitive to the tunnel pressure ratio between the test section and diffuser, and established flow was sometimes difficult to maintain. When momentary tunnel unstart occurred, blockage of the bluff body was sufficiently large to cause a loss of supersonic flow and the tunnel could not be restarted. During unstart, large pressure forces from the normal shock traversing the test section with the model inflated resulted in catastropic failure of models 1, 2, and 3. Test duration was 4, 10, 43,and 66 minutes for models l , 2, 3, and 4, respectively.
Deployment Characteristics
The deployment sequence is shown in figure lO(a) for the M = 3.0 and M = 2.2 deployments (tests 1 and 2). A s discussed previously, deployment was initiated by flash vaporization of an alcohol-water mixture. The time t = 0 corresponds to the release of the fluid. The next two f rames in the sequence show the relatively wellAbehaved opening process as the canopy moves to its most rearward position corresponding to the third f rame at 0.036 and 0.088 second. In each case the outward growth of the canopy is small; however, the r am air inlets are shown facing the stream. The first model was fully deployed in 0.17 second whereas the second model, with half as much fluid in the reservoir , was fully deployed in 0.27 second. Errat ic tunnel start-up loads during the first two tes ts were cause for concern for the integrity of the packaged canopy; therefore, the packaged models of tes ts 3 and 4 were held in place with a circumferential break thread attached to all the meridian tapes near the daisy chain to help restrain the cover canopy during start-up. Both models 3 and 4 had difficulty breaking the restraining thread and consequently, the deployment sequence took more time. The deployment sequences are shown in figures ll(c) and l l (d) for tests 3 and 4, respectively. The model of tes t 3 deployed in 0.7 second after release of the fluid reservoir , whereas the model of test 4 deployed in 0.45 second. However, time elapse to full deployment after breaking the restraining chords and unfurling initiated was about 0.25 second. A film supplement showing all four deployments in r ea l time and at high speeds is available for further study. (See request card at end of report.)
The drag load FA and AID internal pressure pi obtained during deployment a r e shown in figure 11for tests 1 to 4. The time t = 0 corresponds to release of the inflation fluid. The initial peak on the pressure plot in figure ll(a) is the buildup which occurs
7

I1 Ill1 I1 llll1ll1l111 I I1 I I I1
during acceleration of the canopy rearward. The low point which follows (t = 0.04) occurs when the canopy's downstream movement ceases. (See fig. lO(a).) This point in time corresponds to the peak dynamic load or "snatch force" shown on the drag trace. These forces dissipate after 0.04 second as the canopy rapidly develops fullness. As the canopy opens against the ai rs t ream, the drag load increases uniformly to a near maximum after 0.17 second and increases slightly thereafter as the internal pressure approaches 2q,. Since the ram-air inlets provide controlled flow into the canopy, the flow rate decreases rapidly as the internal pressure approaches 2q,; consequently, "shock" loads commonly associated with parachutes opening to maximum fullness are virtually eliminated. After deployment, the canopy was extremely stable and f ree of canopy flutter as is evident by the smooth drag load t race after 0.17 second.
Superimposed on the pressure plot in figure ll(a) is the internal pressure measured during an inflation tes t (see ref. 6) conducted prior to wind-tunnel tes ts in an environmental chamber to evaluate the fluid vaporization system and the canopy deployment mode. The environmental chamber pressure was 19.1 lbf/ft2 (0.91 kN/m2), the same as the wind-tunnel static pressure. As can be seen from figure ll(a), the internal pressure variation is very similar to that measured during the wind-tunnel deployment until the canopy reaches its most rearward position (low point in the pressure plot) at about 0.04 second. (See fig. lO(a).) The near linear increase in pressure after 0.04 second appears then to come entirely from the ram-air inlets.
The axial-force and pressure trace shown in figure l l (b) for test 2 indicates the deployment is significantly smoother than that of test 1. This effect is attributed to the lower initial internal pressure buildup due to the smaller quantity of fluid used, the higher static pressure, and lower fluid temperature. (See table V.) Although the deployment takes more time, the peak loads experienced during initial canopy acceleration in test 1 a r e eliminated. The reduction in drag load after 0.3 second resulted from base pressure buildup as the large drag of the AID brought the tunnel to the verge of flow breakdown. Because of the abnormal base pressure, the drag data obtained from the M = 2.2 deployment after 0.3 second is not representative of that for f ree flight.
The drag and internal pressure t races shown in figures l l ( c ) and l l (d) for tes t s 3 and 4, respectively, reflect the time elapse caused by canopy hang-up after release of the reservoir. (See figs. lO(c) and lO(d).). In each case after rearward movement begins, the canopy deployment is smooth, as indicated by the axial-force traces.
The normal force FN and rolling moment recorded during deployment a r e shown in figures 12 and 13, respectively. In figure 12(a) (test l),the peak normal force occurs during the time period of peak axial force (0.04 to 0.06 second) and is associated with the dynamic snatch force caused by rapid inflation. (See fig. ll(a).) This disturbance was not present in test 2 (fig. 12(b)) and the maximum normal force was considerably smaller
8

than that of tes t 1. In all four deployments the maximum normal force occurred with the canopy internal pressure pi between 0.8q, and 1.2q,. The rolling moments a r e shown in figure 13 (note the change in scale in fig. 13(c), test 3); the maximum moment occurred in test 4 and represents a couple with a magnitude of about 60 lbf (124 N) acting at the aeroshell periphery. This moment was about double the moments of the other tes ts and observation of film indicated canopy hang-up during deployment caused unusual twisting of the canopy.
Steady-State Performance
After deployment of the AID canopies, tunnel conditions were varied to obtain steady-state drag data and angle-of-attack data over a range of Mach number. Throughout the Mach number range covered, the decelerators were extremely stable and free of flutter. Some of the steady-state resul ts are discussed in the following sections.
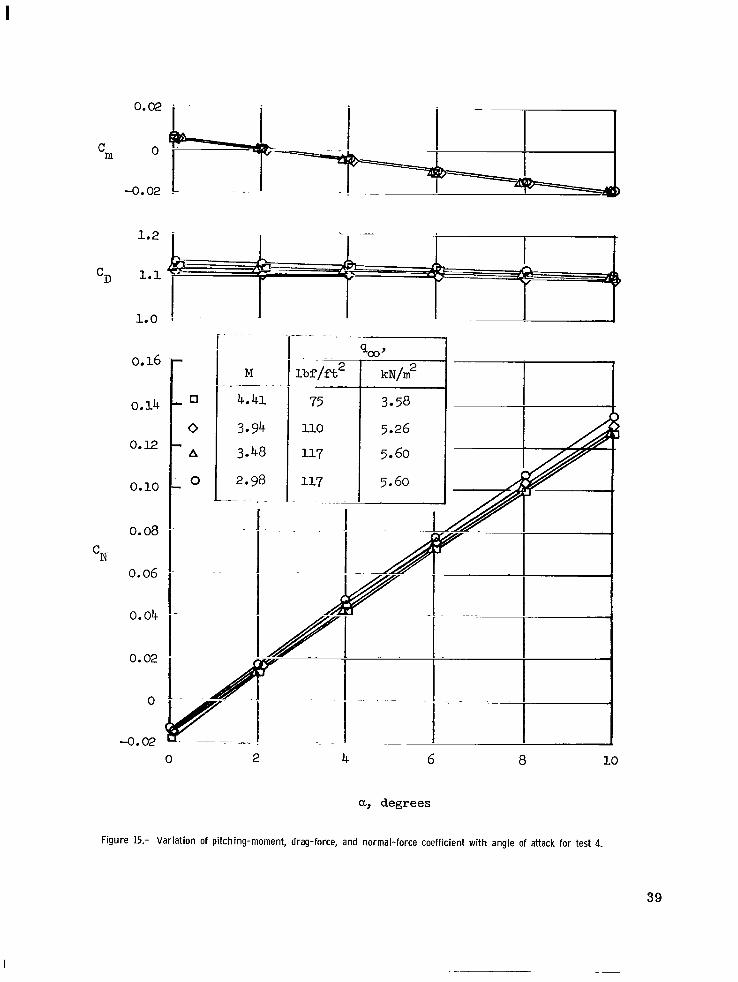
Variation of Cm, CD, and CN with angle of attack.- Static force and moment data were obtained on model 1 at angles of attack from Oo to 5' and on models 3 and 4 at angles of attack from Oo to loo. The moment, drag, and normal-force coefficients a r e plotted against 01 in figure 14 fo r tes t s 1 and 3 and in figure 15 for test 4. Angle-ofattack data w e r e obtained at four different Mach numbers during test 4 as indicated on the figure. Also shown in figure 14 by the circle symbol is Cm and CN for the aeroshell (120° cone) of tes t 3 prior to AID deployment. The moment coefficients a r e transferred to the aeroshell base and the aeroshell base diameter (24 in. or 61 cm) is used as the characteristic length prior to deployment and the canopy diameter (60 in. or 153 rm) after deployment. As can be seen from the data, the variation of the coefficients is linear . Determination of the center of pressure from the data in figures 14 and 15 before and after canopy deployment indicates the center of pressure is not affected by deployment. The location of center of pressure downstream from the aeroshell base for the aeroshell alone is 10.2 inch (25.9 cm). After deployment, the data indicate the center of pressure is between 9.7 inch (24.6 cm) and 10.3 inch (26.2 cm) downstream from the aeroshell base.
Figure 14 shows some deviation in CD between tes ts 1 and 3 although test conditions were nearly identical. (At 01 = Oo, CD = 1.16 for test 1 and CD = 1.12 for test 3). The reduction in CD with angle of attack, however, is very small and represents only a 2-percent reduction over the range of angle of attack covered. Figure 15 shows some deviation in CD with Mach number; however, the variation with angle of attack is again small. Observation of motion pictures indicated the AID canopy tends to stay alined with the airs t ream when the aeroshell is rotated. Thus, there is little loss of drag load with angle of attack. Figure 16 shows photographs of the AID (test 4) at a = Oo and 01 = loo at M = 3.94, q, = 110 lbf/ft% (5.3 kN/m2). The canopy alinement with the
9
I

- - -
I 1 I l l Ill I
airs t ream at angle of attack is more evident, however, from the photograph in figure 17 where model 1 is pitched to a! = 5'. Note the plane of the burble fence is essentially normal to the airs t ream. Similar photographs were not available from tests 3 and 4 where the models were pitched to a! = 10'.
Effects of Mach number on Cg.- The overall performance of the AID is shown in _I___i___
figure 18 where CD values from all four tes t s are plotted against Mach number for a! = Oo. The Mach number range covered is from M = 2.2 to M = 4.4. The tes t numbe r s are defined by use of different symbols and, for comparison, the CD of the aeroshell (120° cone) prior t o each deployment is indicated by the symbols with the tick mark. The dashed line is from experimental data for pointed cones from reference 13 and agrees well with the present test data with the exception of test 1. Explanation for the discrep
ancy in CD of tes t 1with the data from test 3 and reference 13 was not determined, but most of the discrepancy is eliminated after AID deployment. The solid line is the predicted CD for the deployed configuration from the theory of reference 4. The variation in measured CD over the Mach number range tested is from 1.11to 1.16 and indicates the AID performance is insensitive to Mach number in the supersonic range. The prox
imity of the measured CD of the four models and the good correlation with the calculated CD suggests that performance of other AID model designs may be readily predicted with accuracy.
Canopy ram-a i r pressure.- The variation of the ratio of measured canopy ram-air pressure pi to free-stream dynamic pressure q, with Mach number is shown in figure 19. The canopy pressure is recovered from the airs t ream through the four inlets in the canopy. (See fig. 2.) Data points shown for the four tes t s cover a range of Mach number from 2 to 4.4. Although the measured pressure ratio appears to be essentially independent of Mach number, there is considerable variation between models. The recovery pressure is dependent on several parameters such as location of ram-air inlet, body bluntness, and permeability of the canopy material. Thus, some variation between models must be expected. All pressure ratios are lower than expected; the value used in reference 6 to obtain the design shape was pi/q, = 2.16 which is shown by the solid curve in figure 19. A value of pi/q, = 1.99 was measured experimentally during a pressure survey on hard models at M = 3.0. (See ref. 10.) There was no apparent degradation of material or loss of pi with time in the supersonic stream. The model of test 4 was deployed at M = 4.4 and maintained steady internal pressure to shutdown at M = 3.0, 66 minutes after deployment. (See table VI.) Likewise model 3 was tested for 43 minutes without any apparent degradation of the material.
CONCLUDING REMARKS
Four bluff attached inflatable decelerators (AID), 60 inches (1.5 m) in diameter were tested in the Arnold Engineering Development Center l6-foot supersonic propulsion
10
.. ... . I

I
tunnel to determine deployment characteristics and steady-state performance over the Mach number range from 2.2 to 4.4. The AID lightweight canopy w a s attached to an aluminum 120' conical aeroshell 24 inches (0.61 m) in diameter. Deployment of the AID canopy from its stowed compartment within the aeroshell was initiated by a fluid vaporization system. Ram air inlets completed the inflation and maintained the inflation pressure. The deployed canopy increased the effective drag area (CDA) by a factor of 4.5.
All models deployed successfully. The canopies were very steady and f ree of flutter throughout the supersonic range and at angles of attack through 10'. Steady-state force and moment data indicate the models are statically stable over the Mach number range covered. The measured drag coefficient was essentially independent of angle of .attack and of Mach number and was in good agreement with values predicted by theory. The r am air pressure was lower than predicted and was essentially constant with free-stream dynamic pressure. However, the overall performance indicates the design of other AID configurations can be made with a high degree of confidence.
Langley Research Center, National Aeronautics and Space Administration,
Hampton, Va., May 13, 1970.
11

APPENDIX
CONVERSION OF U.S. CUSTOMARY UNITS TO SI UNITS
The International System of Units (SI) was adopted by the Eleventh General Conference on Weights and Measures, Paris (ref. 14). Conversion factors for the units used herein a r e given in the following table:
Physical quantity U.S. CustomaryUnit
Force . . . . . . . . Mass . . . . . . . . Length . . . . . . . Area . . . . . . . . P r e s s u r e . . . . . . Temperature . . . . Volume . . . . . . .
~.
lbf lbm in. f t2 lbf/ft2 O F +459.67 oz (fluid)
Conversion factor
(*)
4.448 0.4536 0.0254 0.0929 47.88
5/ 9 29.6
I__~
SI Unit
newtons (N) kilogram (kg) meter (m) square meter (m2) newtons/meter2 (N/m2) kelvin (K) centimeters3 (cm3)
*Multiply value given in U.S. Customary Unit by conversion factor to obtain equivalent value in SI Unit.
Prefixes to indicate multiples of units are as follows:
12

REFERENCES
1. Guy, L. D.: Structural and Decelerator Design Options for Mars Entry. J. Spacecraft Rockets, vol. 6, no. 1, Jan. 1969, pp. 44-49.
2. Gillis, C. L.: Aerodynamic Deceleration Systems for Space Missions. AIAA Paper NO. 68-1081, Oct. 1968.
3. McShera, John T., Jr.; and Bohon, Herman L.: A Summary of Supersonic Decelera tors With Emphasis on Problem Areas in Aerodynamics and Structures. AIAA Paper No. 67-201, Jan. 1967.
4. Mikulas, Martin M., Jr.; and Bohon, Herman L.: Development Status of Attached Inflatable Decelerators. J. Spacecraft Rockets, vol. 6, no. 6, June 1969, pp. 654-660.
5. Anderson, Melvin S.; Bohon, Herman L.; and Mikulas, Martin, Jr.: A Structural Merit Function for Aerodynamic Decelerators. NASA TN D-5535, 1969.
6. Barton, R. Reed: Development of Attached Inflatable Decelerators for Supersonic Application. NASA CR-66613, 1968.
7. Reichenau, David E. A.: Investigation of an Attached Inflatable Decelerator System for Drag Augmentation of the Voyager Entry Capsule at Supersonic Speeds. AEDC-TR-68-71, U.S. Air Force, Apr. 1968.
8. Baker, D. C.: Investigation of an Inflatable Decelerator Attached to a 120-deg Conical Entry Capsule at Mach Numbers From 2.55 to 4.40. AEDC-TR-68-227, U.S. Air Force, Oct. 1968.
9. Houtz, N. E.: Optimization of Inflatable Drag Devices for Isotensoid Design. AIAA Paper No. 64-437, June-July 1964.
10. Deveikis, William D.; and Sawyer, James Wayne: Static Aerodynamic Characteristics, Pressure Distributions, and Ram-Air Inflation of Attached Inflatable Decelerator Models at Mach 3.0. NASA TN D-5816, 1970.
11. Baker, D. C.: Investigation of an Attached Inflatable Decelerator With Mechanically Deployed Inlets at Mach Numbers From 2.25 to 4.75. AEDC-TR-69-132, U.S. Air Force, June 1969.
12. Anon.: Test Facilities Handbook. Eighth ed., Arnold Eng. Develop. Center, Dec. 1969.
13. Campbell, James F.; and Howell, Dorothy T.: Supersonic Aerodynamics of Large-Angle Cones. NASA TN D-4719, 1968.
14. Comm. on Metric Pract.: ASTM Metric Practice Guide. NBS Handbook 102, U.S. Dept. Com., Mar. 10, 1967.
13
I
Ill 11l1ll11 I I l l I 1 I
TABLE I.- AERODYNAMIC AND STRUCTURAL DESIGN PARAMETERS
Maximum frontal diameter . . . . . . . . . . . . . . . . . . . . . . 5 f t (1.5 m) Deployed frontal area ratio, CD,dAd/CD,eAe . . . . . . . . . . . . . . . . . 4.5 Dynamic pressure, q, . . . . . . . . . . . . . . . . . 120 lbf/ft2 (5.75 kN/m2) Deployment Mach number, M . . . . . . . . . . . . . . . . . . . . . . . . . 3.0 Deployment altitude . . . . . . . . . . . . . . . . . . . . . . 104 000 ft (31.7 km) Maximum temperature, T . . . . . . . . . . . . . . . . . . . . 350° F (450 K)
TABLE E.- COORDINATES O F AID TEST MODEL
= 27.3 inch (69.3 cm]
x/R Y/R x/R_.
0.4420 0.00 0.9820 , 0.7231 .5660 .0610 .9630 i .7633 .6280 .0954 .9376 .8007 .6900 .1336 .9060 .8343 .7520 .1768 .8685 .8634 .8140 .2277 .8254 .8870 .8760 .2906 .7772 .9044 .9101 .3342 .7244 .9144 .9411 .3840 .6072 .9084 .9649 .4352 .4787 .8592 .9847 .4974 .3458 .7512 .9970 .5675 .2202 .5562 .9997 .6376 .1364 .2485 .9942 .6809 .1268 .lo58
- - -~ ~ . _ _
TABLE IU.-PHYSICAL PROPERTIES OF AID MATERLAL
Meridional tapes (Nomex): Width . . . . . . . . . . . . . . . . . . . . . . . . . . . . . . . . . . 0.5 inch (1.27 cm) Breaking strength . . . . . . . . . . . . . . . . . . . . . . . . . . . 500 lbf (2.22 kN)
Reinforcing webbing (Nomex): Width . . . . . . . . . . . . . . . . . . . . . . . . . . . . . . . . . . 1.0 inch (2.54 cm) Breaking strength . . . . . . . . . . . . . . . . . . . . . . . . . . . 1000 lbf (4.44 IrN)
Fabric (Nomex): Tensile strength (warp/fill) . . . . . . . . . . . . . . . 96/83 lbf/in. (16.8/14.4 kN/m) Tear strength . . . . . . . . . . . . . . . . . . . . . . 9.0/6.8 lbf/in. (1.6p.2 kN/m) Elongation, percent . . . . . . . . . . . . . . . . . . . . . . . . . . . . . . . . . 28/29 Fabric density . . . . . . . . . . . . . . . . . . . . . . . . . 1.86 ozm/yd2 (63 g/m2) Coating density . . . . . . . . . . . . . . . . . . . . . . . . 0.5 ozm/yda (17 g/m2) Thread count per inch . . . . . . . . . . . . . . . . . . . . . . . . . . . . . . . 80/77 Permeability limit at 0.5 inch H20 (124 N/m2) . . . 0.02 ft3/min/ft2 (100 cm3/m2-s)
14

TABLE IV.- MASS OF COMPONENTS OF 5-FOOT-DIAMETER (1.53 m) AID
-Mass
Item lbm kg
Coated fabric . . . . . . . . . . . . . . . . . . . . . . . . . . 0.88 0.40 Meridian tapes . . . . . . . . . . . . . . . . . . . . . . . . . . 1.21 0.55 Reinforcing webbing and sleeve . . . . . . . . . . . . . . . . 0.32 0.145 Stitching, joint overlap, attachment reinforcing, etc. . . . . . 0.97 0.44 Burble fence . . . . . . . . . . . . . . . . . . . . . . . . . . 0.23 0.108 Inlet assembly (4) . . . . . . . . . . . . . . . . . . . . . . . . 0.57 0.259
.- - ~
Total . . . . . . . . . . . . . . . . . . . . . . . . . . . 14.18 11.90
TABLE V.- MODEL DEPLOYMENT CONDITIONS
Reservoir Reservoir fluid Model M PS Tt
-fluid temperature
lbf/ft2 W/m2 lbf/in2 W/m2 O F K oz ~
1 3.0 120.2 5.75 19.1 132 194 363 1 2 2 2.2 120.5 5.76 35.6 246 185 358 6 3 3.0 117.0 5.60 18.6 126 120 322 6 4 4.4 74.5 3.56 5.5 38 147 337 6
~ ~
TABLE VI.- SUMMARY OF AID SUPERSONIC TESTS
Range of performance data
Model Test duration after
M deployment, min
lbf/ft2 ~~ I
1 3.0 120 5.75 0 to 5 4 2 2.2 120 5.75 0 3 2.5 to 3.0 90 to 196 4.31 to 9.38 0 to 10 4 3.0 to 4.4 36 to 117 1.73 to 5.60 0 to 10
15

Burble
Ram
Figure 1.- Cutaway view of attached inflatable decelerator (AID).
1 2 3 4 5 6 7 8 9
.. . . ,
D
1 2 3 4 5 6 7 8 9
Decelerator stowage compartment Aeroshell Forward attachment clamp Rear attachment clamp Six-component balance Ram-air i n l e t Burble fence In f l a t ab le decelerator Sting support
Figure 2.- Supersonic A I D configuration. Al l dimensions are i n inches (cm).
17
. ,
(a) Aeroshell and sting adapter sleeve. L-70-1628
Figure 3.- Photographs of aeroshell.

(b) Aeroshell and forward at tachment clamp. L-70-1629
Figure 3.- Concluded. CLW

N 0
Figure 4.- Photograph of A I D canopy and aeroshell. L-70-1630

f Pyrotechnic c u t t e r
Rear attachment I n l e t locat ion
xward attachment
I Aeroshell I
Figure 5.- Canopy folding and packaging mode.
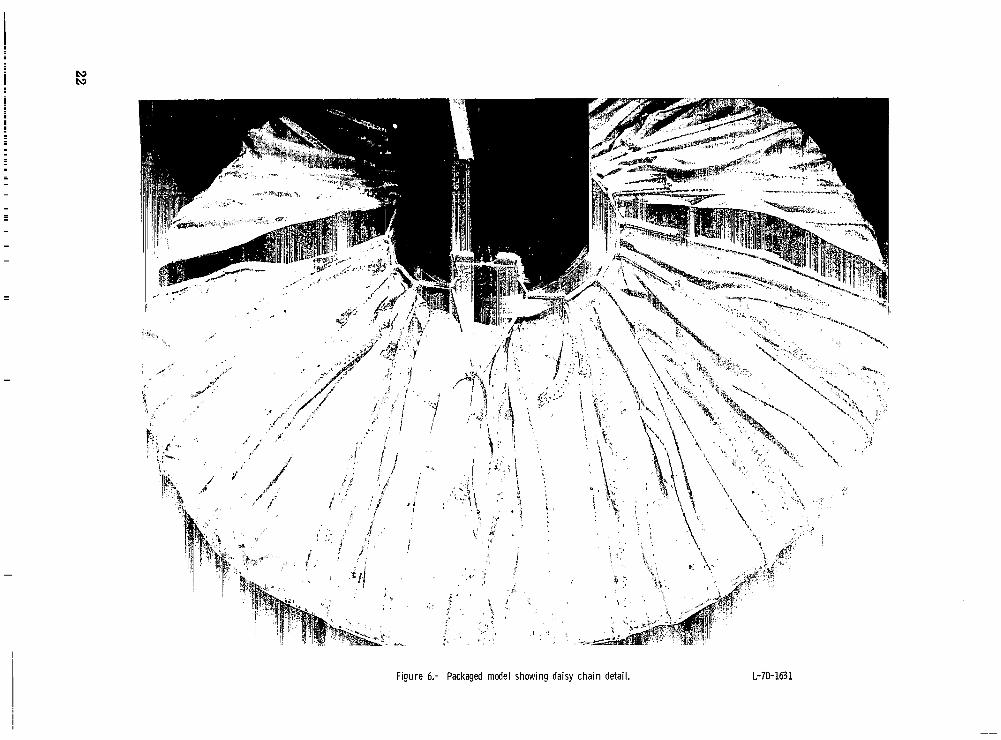
Figure 6.- Packaged model showing daisy chain detail. L-70- 1631

I
Figure 7.- Rear surface reinforcement of the A I D canopy. Dimensions are in inches (cm).
23

N l.P
Station number i n feet (meters)
(a) Models 1 and 2.
Figure 8.- Location of models i n test section.

Flexible nozzle c a r t Mdel support s t r u t f v
I 1 I I Sta t ion -4.6 (4.4) 0 6.2 (1.9) 10.2 (3.1)
Sta t ion number i n feet (meters)
(b) Models 3 and 4.
Figure 8.- Concluded.
II I
I 20.0 (6.1)

(a) Downstream view. L-70-1632
Figure 9.- AID in t u n n e l p r io r t o deployment.
- - ~ . . . . . . . . . . . ~ . . . . .- . , .,,:-- . . . . -, . . . . . * . . . . .~. . . - .
- , - . . . . . . . . . . .~. . . .
. . . . . .. . . . .
. . . _ ..- . - ~ . 1. . . . . . - ~ ---.- &__. . . . . . . . . . . . . . . .
(b) Upstream vlew. L-70- 1633
Figure 9.- Concluded,
. . . . . . . . . . . .. ............ - - - . . . . . . . . . . . . . . . . . . . . ,.. ,-,.. .,-. ~ -....... .......,',.I, . . . , ,

Is I
03 R e s e r v o i r r e l e a s e d U n f u r l i n g i n i t i a t e d I n l e t s f a c i n g s t r e a m Fully i n f l a t e d
t = O t = .008 t = . 0 3 6 t = . I 7 2
(a) Test 1; M = 3.0; q,= 120.2 Ibf/ft* (5.75 kN/m2).
t = O t = .016 t = . 0 8 8 t = .272
(b) Test 2; M = 2.2; q,= 120.5 lbf/ft2 (5.76 kN/m2).
Figure 10.- A I D deployment sequence i n supersonic stream. L-70- 1634

R e s e r v o i r r e l e a s e d U n f u r l i n g i n i t i a t e d I n l e t s f a c i n g s t r e a m F u l l y i n f l a t e d
t = O t = .40 t = .46 t = .70
(c) Test 3; M = 3.0; q,= 117.0 lbf/ft2 (5.60 kN/mZ).
t = O t = .IO t = . 2 5 t = .45
(d) Test 4; M = 4.4; q,= 74.5 Ibf/ft2 (3.56 kN/m2).
Figure 10.- Concluded. L-70-1635

-- --
IIlIllI1l11111I I I I I 1 II I1 I
2000
FA, lbf
1000
0
2.0
-Pi 1.0
900
0 0.1 0.2 0.3
Time, s
10
F*, kJ!l
5
0
Static t e s t (ref. 6 )
. . I 0.4 0.5
(a) Model 1; M = 3.0; q,= 120.2 Ibf/ft2 (5.75 kN/m2).
Figure 11.- Axial force and internal pressure rat io du r ing deployment.
30
I I I I I I 111 I Ill I

3000
10
2000
FA, lbf FA? IrN
51000
0 0
2.0
Pi- 1.0 .- -T 9, A
0 0.1 0.2 0.3 0.4 0.5
Time, s
(b) Model 2; M = 2.2; qm= 120.5 Ibf/f12 (5.76 kN/m2).
Figure 11.- Continued.
31
Ill1 I I1 I l l 1 I1

w Lo
10
FA, lbf
5
0
2.0
3:- 1.0 a -co
0 0.1 0.2 0.3 0.4 0.5 0.6 0.7 0.8 09 9 1.0
m:LJ.Me, s
(C) Model 3; M = 3.0; q,= 117 lbf/ft2 (5.6 kN/mz).
Figure 11.- Continued.


(a ) Test 1.
300 r 1‘ -300 IL I
1 1 1 I 1 1 0 05 .1
9 15 .2 25
Time, s
(b) Ted 2.
Figure 12.- Normal force during A I D deployment.

-’ 2
30° ,r i
-300 L I I 1 I I
.3 .4 - 5 .6 .7 .8
(C) Test 3.
-300
-300 1-I I I I 1 I ^
a +0 .1 .2 .3 .4 *5
Time, s
(d) Test 4.
Figure 12.- Concluded.
w cn

holling moment,in-lbf 0 ' 0 Rolling
moment, N-m
0 .1 .2
(a) Test 1.
83
Rolling moment, in-lbf
lowr 1,100
Rolling moment,
N+ll - -100-1000
0 .1
Time, s
(b) Test 2.
Figure 13.- Roll ing moment du r ing A I D deployment.

500 r n 1 50
Rolling moment, in-lbf
I I I I I t -3 .4 -5 .6 - 7 .8
IC) Test 3.
1500
Rolling moment, 0in-lbf
-1500
1 t I I I 1 0 .1 .2 03 .4 .5
Time, s
Id) Test 4.
Figure 13.- Concluded.
150
Rolling moment,
0 N-m
-150
w 4

cN
0.16
0.14
0.12
0.10
0.08
0.06
0.04
0.02
0
-0.02
-0.04 0 2 4 6 8 10
a, degrees
Figure 14.- Variat ion of pitching-moment, drag-force, and normal-force coefficient w i t h angle of attack for tests 1 and 3.
38
1
0.16
0.14
0. I 2
0.10
0.08
cN 0.06
0.04
0.02
0
-0.02 0 2 4 6 8 10
a, degrees
Figure 15.- Variation of pitching-moment, drag-force, and normal-force coefficient with angle of attack for test 4.
39

11111l I 1 Ill I I
(b) a = 100.
Figure 16.- A I 0 at angle of attack. M = 3.94; q,= 110 Ibf/ft2 (5.25 k N / d ) . L-70-1636
40

Figure 17.- A I D at 5' angle of attack for M = 3.0 and q,= 120 lbf/ft2 (5.75 kN/m2). Test 1. L-70-1637

-1.8 Experiment (120' cone, reference 13)
d1.6 I - G - - - - - - - d -
cy
1.2 '
cD ' -v+-+QD D 0
1.0 - Theory (Reference 4 )
.8
.6 -.4 p d Undeployed
0 Deployed
.2 I-
0 ' I I I
2.0 2.5 3.0 3.5
M
Figure 18.- Variation of drag coefficient with Mach number.
O Test 1
0 Test 2
0 Test 3 D Test 4
I I I
4.0 4.5 5.0
a = Oo.

Reference 6
r 4 0 N W 2.0 r
0 0 D
0 0 0 ; D D
1.5
0 Test 1
0 Test 2
0 Test 3 b Test 4
1.0 01, ' i I I 2 3 4 5
M
Figure 19.- Variation of ram-air pressure wi th Mach number.

- -
111ll111l1 Ill
NATIONAL AND SPACE ADMINISTRATIONAERONAUTICS WASHINGTON,D. C. 20546
OFFICIAL BUSINESS FIRST CLASS MAIL
POSTAGE AND FEES PA11 NATIONAL AERONAUTICS
SPACE ADMINISTRATIOh
02U 001 5 6 51 3DS 70225 00903 A I R FORCE WEAPONS L A B O R A T O R Y /WLOL/ K I R T L A W D A F B , NEW M E X I C O 87117
POSTMASTER: If Undeliverable (Section 1 Postal Manual) Do Not Ret
_ _ _ _ - - _ _ ___ ~
~ ~ ~ .= . _ _ - ~- - - .a..
‘ T h e aeronaiiticnl and space activities of the United Stntes shnll be coizdzlcted so as t o contribate . . . t o the expamion of human knowledge of pheizoniena in the ntiiiosphere and space. T h e Administration shal,? provide for the widest prncticable and appropriate dissemination o f inf ormntion concerning its nctiidies and the reszdts thereof.”
-NATIONALAERONAUTICSAND SPACE ACT OF 1958
NASA SCIENTIFIC AND TECHNICAL PUBLICATIONS
TECHNICAL REPORTS: Scientific and technical information considered important, complete, and a lasting contribution to existing knowledge.
TECHNICAL NOTES: Information less broad in scope but nevertheless of importance as a contribution to existing knowledge.
TECHNICAL MEMORANDUMS : Information receiving limited distribution because of preliminary data, security classification, or other reasons.
CONTRACTOR REPORTS: Scientific and technical information generated under a NASA contract or grant and considered an important contribution to existing knowledge.
TECHNICAL TRANSLATIONS: Information published in a foreign language considered
/to merit NASA distribution in English.
SPECIAL PUBLICATIONS : Information derived from or of value to NASA activities. Publications include conference proceedings, monographs, data compilations, handbooks, sourcebooks, and special bibliographies.
TECHNOLOGY UTILIZATION PUBLICATIONS: Information on technology used by NASA that may be of particular interest in commercial and other non-aerospace applications. Publications include Tech Briefs, Technology Utilization Reports and Notes, and Technology Surveys.
Details on the availability of these publications may be obtained from:
SCIENTIFIC AND TECHNICAL INFORMATION DIVISION
NATI0NA L AERO N AUT1C S AN D SPACE ADM I N I STRATI0N Washington, D.C. PO546