deposit insurance and depositor monitoring
TRANSCRIPT

NBER WORKING PAPER SERIES
DEPOSIT INSURANCE AND DEPOSITOR MONITORING:QUASI-EXPERIMENTAL EVIDENCE FROM THE CREATION OF
THE FEDERAL DEPOSIT INSURANCE CORPORATION
Haelim Park AndersonGary Richardson
Brian S. Yang
Working Paper 23828http://www.nber.org/papers/w23828
NATIONAL BUREAU OF ECONOMIC RESEARCH1050 Massachusetts Avenue
Cambridge, MA 02138September 2017
The authors thank colleagues for comments and advice. The views expressed in this paper are solely those of the authors and do not necessarily represent those of the Office of Financial Research, the United States Treasury, or the National Bureau of Economic Research.
NBER working papers are circulated for discussion and comment purposes. They have not been peer-reviewed or been subject to the review by the NBER Board of Directors that accompanies official NBER publications.
© 2017 by Haelim Park Anderson, Gary Richardson, and Brian S. Yang. All rights reserved. Short sections of text, not to exceed two paragraphs, may be quoted without explicit permission provided that full credit, including © notice, is given to the source.
Deposit Insurance and Depositor Monitoring: Quasi-Experimental Evidence from the Creationof the Federal Deposit Insurance CorporationHaelim Park Anderson, Gary Richardson, and Brian S. YangNBER Working Paper No. 23828September 2017JEL No. E42,E65,G21,G28,N22,P34
ABSTRACT
In the Banking Acts of 1933 and 1935, the United States created the Federal Deposit Insurance Corporation, which ensured deposits in commercial banks up to $5,000. Congress capped the size of insured deposits so that small depositors would not run on banks, but large and informed depositors – such as firms and investors – would continue to monitor banks’ behavior. This essay asks how that insurance scheme influenced depositors’ reactions to news about the health of the economy and information on bank’s balance sheets. An answer arises from our treatment-and-control estimation strategy. When deposit insurance was created, banks with New York state charters accepted regular and preferred deposits. Preferred depositors received low, fixed interest rates, but when banks failed, received priority in repayment. Deposit-insurance legislation diminished differences between preferred and regular deposits by capping interest rates and protecting regular depositors from losses. We find that before deposit insurance, regular depositors reacted more to news about banks’ balance sheets and economic aggregates; while preferred depositors reacted less. After deposit insurance, this difference diminished, but did not disappear. The change in the behavior of one group relative to the other indicates that deposit insurance reduced depositor monitoring, although the continued reaction of depositors to some information suggests that, as intended, the legislation did not entirely eliminate depositor monitoring.
Haelim Park AndersonOffice of Financial ResearchU. S. Department of the Treasury 717 14th Street, NW Washington, D.C. 20220 [email protected]
Gary RichardsonDepartment of Economics University of California, Irvine 3155 Social Sciences Plaza Irvine, CA 92697-5100and [email protected]
Brian S. YangUniversity of Minnesota Duluth 360 LSBE1318 Kirby Drive Duluth, MN 55812 [email protected]

1
1. Introduction
Deposit insurance is a pillar of financial architecture in modern economies, yet the policy
remains controversial. Advocates assert that deposit insurance fosters financial stability and
forestalls financial panics (Demirguc-Kunt and Kane, 2002; Folkerts-Landau and Lindgren,
1998; Garcia, 1999). Critics claim that deposit insurance distorts incentives of savers and
financiers, encourages moral hazard and excessive risk-taking, and spawns systemic financial
crises. The controversy revolves around different perceptions about whether depositors monitor
banks’ performance in the absence of insurance; how monitoring influences banks’ behavior;
how, when, and to what extent insurance distorts monitoring; and whether it is possible to design
a deposit insurance system that preserves (at least to some extent) depositor monitoring
(Calomiris, 1999; Gorton, 2007). Empirical studies examining the effect of deposit insurance on
depositor monitoring have produced mixed results. Some studies detect monitoring, even in
nations with explicit and extensive insurance (e.g. Park and Peristiani (1998) and Martinez-Peria
and Schmukler (2001)). Other studies find little monitoring (Demirguc-Kunt and Huizinga 2004,
Calomiris and Jaremski, 2016).
These empirical inconsistencies arise for several reasons. Scholars study different nations
with different insurance systems which may, in fact, function differently. Scholars often lack
direct data on the phenomenon of interest; and scholars often study data from periods that lack
clearly defined control and treatment groups. So, in many cases, scholars may not be able to
precisely determine the ways in which depositors behaved. Recent studies overcome these
identification issues by using more granular data. Some studies overcome these constraints by
using a quasi-experimental research design, where they observe changes in the behavior of a
newly insured group relative to an uninsured control group (Karas, Pyle, and Schoors, 2013;

2
Calomiris and Jaremski, 2016). Others use the depositor-level data and observe the responses of
individual depositors to shocks (Kelly and O'Grada, 2008; Iyer and Puri, 2012; Iyer, Puri, and
Ryan, 2016; Brown, Guin, and Morkoetter, 2017). In particular, Iyer, Jensen, Johannesen, and
Sheridan (2017) use the depositor level data and document the reactions of individual depositors
when the deposit insurance limit changed. Our essay examines a similar policy experiment: the
creation of a national deposit insurance system in the United States during the 1930s.
The structure of New York’s commercial banking system provides a unique analytic
opportunity. New York’s commercial banks accepted preferred and regular deposits. Preferred
depositors received interest fixed by law, and when a bank failed, received repayment before
regular depositors. Regular depositors received interest set by the market, which usually
exceeded that paid to preferred depositors, but when a bank failed, received repayment after
preferred depositors. During the 1930s, a series of federal laws (particularly the Banking Acts of
1933 and 1935) limited interest that banks could pay upon demand deposits and established the
Federal Deposit Insurance Corporation (FDIC). The FDIC insured deposits in commercial banks
up to $5,000. Before these reforms, the incentives of preferred and regular depositors differed
sharply. For preferred depositors, regulations fixed the risks and returns at a low level; while for
regular depositors, the market set the risks and returns at a higher level. After these reforms,
regulations dictated risks and returns for both groups, setting the risk of loss for all depositors
near zero and capping interest on deposits at a low rate (zero for demand deposits). This change
in the incentives of one group relative to another facilitates our treatment-and-control estimation
of the impact of deposit insurance.1
1 Our dataset focuses on the period between 1929 and 1938. The period from 1929 to 1932 is characterized by the
Great Depression and banking panics. In comparison, the period from 1934, when deposit insurance was enacted,
until the current crisis, is known as the “Quiet Period” in U.S. banking (Gorton, 2010). A banking panic occurs
when information-insensitive debt becomes information-sensitive. In other words, depositors intensify monitoring

3
Our general approach is to compare the behavior of preferred and regular depositors
within a bank before and after the introduction of deposit insurance. The preponderance of the
banks that we study were unit institutions, located in a single building. Some of the larger banks
possessed branches, but by law, all of these branches operated within the same municipality as
the headquarters. We control for bank and municipality fixed effects. Our within bank approach,
therefore, controls for the substantial changes in the structure of the financial industry during the
1930s and the wide range of factors – observable and unobservable – that impacted depositors in
each institution but did not differentially impact regular and preferred depositors.
The remainder of this essay describes our analysis. Section 2 establishes the historical
foundations of our estimation strategy. It is based on the unique structure of New York’s
commercial banking system and the adoption of deposit insurance in the United States, one of
the first and largest institutional changes of this type. Section 3 describes the data set that we
examine for this study, which includes the balance sheets of all state-chartered banks and trust
companies in New York from 1929 through 1938. Section 4 presents a model of depositor
behavior which informs our statistical analysis.
Section 5 presents our statistical methods and empirical results. We focus on two types of
information two which depositors typically react. The first is information about economic
conditions, which informs depositors about the risks of depositing in banks and the opportunity
cost of doing so. The second is information specific to individual banks, such as information
about their balance sheets, which reveals information about banks’ health and the benefits of
the health of their banks. However, deposit insurance made deposits information-insensitive debt. By comparing
depositors’ responses to bank risk before and after deposit insurance, we identify how deposit insurance influenced
depositor monitoring.

4
possessing a relationship with an institution in the future. We assess depositors’ reactions to both
types of information.
Our assessment requires us to overcome a key threat to inference: endogeneity. Both
types of information that we examine arise, in part, through decisions of depositors. The most
widely reported information about the state of the economy, such as the Dow Jones Industrial
Average, arose from financial markets in New York City. Prices in those markets reacted to
flows of deposits in and out banks in Manhattan, because commercial banks in the Big Apple
invested a substantial share of their resources in call money markets, which funded purchases of
stocks and bonds. The impact of this information, therefore, can be accurately assess only for
banks outside of New York City; so this portion of our analysis excludes banks in all boroughs
of the city.
Information about banks’ balance sheets also depended on the collective choices of
depositors. This is particularly true of the balance-sheet ratios that depositors typically
monitored, such as (in today’s terminology) measures of banks’ liquidity and leverage. In the
cash to deposits ratio, for example, the denominator is total deposits, which is obviously a
function of depositors’ decisions, and the numerator is cash, which also depended directly and
indirectly on depositors’ choices. Withdrawals directly reduced cash on hand in the bank, while
managers’ anticipation of withdrawals induced them to change the level of cash holdings. We
control for endogeneity of this type using prevalent solution in the literature: lag and functional
form restrictions that separate how ratios reacted to depositors’ decisions from how depositors
reacted to changes in ratios. The structure of our data provides an obvious lag structure.
Depositors received information about banks’ balance sheets with a lag of several weeks after the
end of a fiscal quarter, when financial institutions published their quarterly reports in local
5
newspapers. We incorporate this timing into our estimates by assuming that depositors reacted
only to information available to the public.
Section 6 discusses the limitations and implications of our estimates. Our results show
that deposit insurance reduced, but did not eliminate, depositor monitoring. Before the creation
of the FDIC, regular depositors reacted more than preferred depositors to information about bank
balance sheets and economic aggregates. After the creation of the FDIC, regular and preferred
depositors reacted similarly to information about banks’ balance sheets. In other words, regular
depositors’ reactions to information about aggregate economic conditions diminished, but did not
entirely disappear.
2. Historical Background
Our empirical research rests upon factual foundations. This section summarizes the
essential information. It focuses on three topics. The first is the structure of the commercial
banking system in the state of New York, which shaped depositors’ incentives to monitor banks.
The second is depositors’ ability to obtain and process information, which shaped the ways in
which they could monitor the safety and soundness of deposits. The third is reforms of the
commercial banking system during the 1930s, principally the creation of deposit insurance,
which influenced depositors’ incentives to monitor financial institutions.
In New York during the 1920s and 1930s, hundreds of commercial banks operated under
state charters. Almost all of these banks operated as unit institutions, under a single charter,
within a single building, and summarizing their activities with a single balance sheet. Unit banks’
depositors typically resided within a short distance, most less than 20 miles, of the bank. Most
loans were made to borrowers within a similar radius. A small number of banks operated

6
branches, which according to state law, had to operate within the same municipality as their
headquarters. For these branch networks, corporate balance sheets summed the assets and
liabilities of the headquarters and branches. A small number of banks in Manhattan also operated
within holding corporations. Holding corporations typically owned multiple institutions. A
common structure included a commercial bank, an investment bank, a trust company, and
sometimes a building-and-loan or an insurance corporation. This essay analyzes the commercial
banking component of each holding corporation.
New York City possessed a special position in the banking hierarchy of the United States.
New York was a central reserve city. Banking law required banks in a central reserve city to hold
13 percent of net demand deposits as reserves. The banks held these reserves either as cash in
their vaults or, for member banks, as deposits at the Fed. Albany and Buffalo were reserve cities.
Banks in reserve cities had to hold 10 percent of deposits as reserves, but could hold those
reserves either as cash in their vaults, deposits at the Fed, or deposits in banks in central reserve
cities. Banks outside of reserve cities were collectively called country banks. These banks had to
hold 7 percent of net demand deposits as reserves, and could hold those reserves either as cash in
their vault or deposits in banks in reserve or central reserve cities.2 These legal-reserve
requirements reinforced and reflected a reserve pyramid in which country banks around the
United States deposited reserves in banks in reserve cities which in turn deposited reserves in
New York City, which served as the central money market for financial institutions throughout
the United States. This long-standing structure shaped the clientele of banks in different locations
2 Note that the small number of country banks that joined the Federal Reserve System held their reserves as deposits
at the Fed. Also note that these reserve requirements rose in 1936 and 1937. For details, see the Federal Reserve
Bulletin..

7
and the structure of their balance sheets. We discuss these details in the next section of this
paper.
New York’s commercial banks accepted preferred and regular deposits. Regular
depositors received interest set by the market, but when a bank failed, received repayment after
preferred depositors. During the 1920s, interest rates on demand deposits in banks in New York
City ranged from one to four percent. Interest rates on time deposits averaged one to two
percentage points higher.
Preferred depositors received interest fixed set by law, generally a few percentage points
lower than the rate for regular deposits. When a bank failed, preferred depositors received
repayment before regular depositors. Preferred deposits were safe. Banks had to invest preferred
deposits in long-term government bonds. The nominal value of those bonds guaranteed eventual
repayment of the nominal value of the preferred deposits. Liquidators of failed banks tended to
expedite repayment of preferred deposits. Newspapers indicate that repayment typically began
within a few months and finished within one year. We have found no evidence that preferred
depositors lost funds in banks that failed in New York State.
Most depositors could choose between depositing as preferred or regular depositors (just
as most depositors could choose to make time or demand deposits). The law, however, required
some depositors to only make preferred deposits. The required group included custodians of
funds, such as lawyers overseeing trusts; New York state chartered savings banks and savings
and loans; credit unions; land banks; the government of the State of New York and its business
entities; and municipal and county governments. In 1929, the last year for which we have
detailed data on the breakdown, approximately 97% of preferred depositors came from those
required groups. Between 1929 and 1935, the quantity of preferred deposits tripled. In this same

8
period, the total assets of the required groups fell, many by more than half. It seems unlikely that
their holdings of bank deposits tripled during this period. Thus, it is likely that some regular
depositors shifted funds into preferred deposits during the financial crises in New York in 1931
through 1933. This shift seems sensible, as firms and individuals sought safe havens for cash
balances. This shift would inflate the apparent reaction of preferred depositors, which would
reduce the apparent impact of deposit insurance, which we are measuring based upon the
convergence of the behavior of these groups after deposit insurance. We do not think that this
bias is large, but we cannot completely control for it, given the structure of the data. The nature
of preferred deposits meant that banks held, on average, 6 percent preferred deposits. One-
quarter of all banks held no preferred deposits.
Deposits served as banks principal source of funds. Deposits amounted to 80% of the
liabilities of the banks that we study. Banks’ secondary source of funds consisted of owners’
equity. Funds raised via sales of stock amounted to 8% of the liabilities of the banks that we
study. Retained earnings amounted to 8% of the liabilities. Borrowings from banks (and other
institutions) amounted to a small fraction of banks’ balance sheets. Banks’ lacked the ability to
raise funds via many methods common today, including the Fed funds, repo, and commercial
paper markets; by selling securities; or via special purpose vehicles. Most of those institutions
did not exist during the 1930s, and banks could not legally raise funds through the few that did.
In New York, several systems existed for chartering and regulating institutions that
accepted deposits. These included nationally chartered banks, state-chartered banks, unchartered
(private) banks, and building and loans. Our study does not directly analyze these
complementary and competing institutions, because of differences in data sources, data

9
frequency, deposit structure, and regulations. Our experimental design applies only to state-
chartered commercial banks which could accept both regular and preferred deposits.
In the 1920s and 1930s, depositors possessed substantial information about the health of
banks. State law required commercial banks to submit four balance sheets each year to the
superintendent of state banks. All banks submitted these balance sheets on the same days,
selected by the superintendent, on which he called for the reports, hence the name of call reports.
Each year, one call occurred on the last business day of June. Another call occurred on the last
business day of December. Another call occurred in the spring, somewhere near the end of the
first quarter of the year. Another call occurred in the fall, somewhere near the end of the third
quarter. Randomizing the spring and fall calls prevented banks from ‘window dressing’ their
balance sheets, by engaging in financial activities that improved the appearance sheet of their
balance sheet on specific days.
The law required commercial banks to publish their balance sheet in their local
newspapers. Publication typically occurred within a few days of a call. Many banks published
balance-sheets at higher frequencies and in greater detail than that required by law, by
purchasing advertising space in hometown newspapers. In these advertisements, banks described
their assets, liabilities, profits, dividend payments, services offered, interest rates, and the names
of their officers and directors. Information about banks’ balance sheets also appeared in the
publications of business information firms, such as Rand McNally, Polk, Moody, and the
Commercial and Financial Chronicle. Rand McNally published its Bankers’ Directory in January
and July of each year, focusing on information from December and June call reports. Polk
published its Bankers’ Encyclopedia in March and September, focusing on information from the
calls at the end of the first and third quarters. Moody’s published a rating book for financial firms

10
– including large commercial banks – each quarter. The Commercial and Financial Chronicle
contained monthly section summarizing bank balance sheet information and bank stock prices.
In 1928, this period section became a stand-alone publication entitled the Bank and Quotation
Record.
For most banks in New York City, information was available at high frequency. Each
week, numerous newspapers – including the New York Times and Wall Street Journal –
published a table containing balance-sheet information for all banks belonging to the New York
City Clearing House. Pages surrounding these tables typically contained advertisements for
banks throughout in the city.
Newspapers also published articles about difficulties besetting banks in Manhattan,
throughout the state, and around the United States. These articles often appeared prominently,
frequently on the first page. Newspapers also published detailed descriptions about fluctuations
in financial markets and the health of the economy.
This inundation ensured that depositors possessed information about the health of their
banks. Since depositors’ ability to collect and synthesize information was limited, we restrict our
analysis to information publicly available in newspapers. This information closely corresponded
with basic information available to regulators since laws required all banks to publish quarterly
call reports. Depositors’ ability to analyze information was also limited. In the 1920s, depositors
(and even academic economists) lacked electronic computers, statistical spreadsheets,
mathematical microeconomic theory, and sophisticated statistical theory.
To ensure that we examine the evidence with these limitations in mind, we focus our
analysis on quantitative methods popularized by Banker’s Magazine (1927) during the 1920s and
Garcia’s (1935) How to Analyze a Bank Statement in the 1930s. These sources described how

11
depositors, investors, and other interested analysts could assess the health of banks’ balance
sheets. Signs of bank health included steady increases in equity, measured by paid-up capital,
surplus, and retained earnings; diversified portfolios, including cash, bonds, and loans; and
consistent payments of interest and dividends. The sources also taught the public how to conduct
simple ratio analysis. These sources taught readers to calculate useful ratios. Examples include
equity ratio, which equaled paid-up capital plus retained earnings divided by total assets, and
which Garcia explains as indicative of the “leverage” of the institution (1935)Another was the
cash ratio, which equaled cash, cash items, and reserves deposited at other banks divided by total
deposits. A third was the ratio of collateralized or otherwise secured loans to total assets. The
sources told depositors to compare these ratios to past measures for the same bank and average
ratios for all banks. All editions of Garcia’s book, which was published from the 1930s through
the 1980s, contained a table indicating average ratios for banks in different regions, states, and
reserve cities. Safer banks had higher capital ratios and similar liquidity to comparable
institutions. In good times, the typical cash ratio approached the minimum required by law. The
typical bank, in other words, held little or no excess reserves. During the 1920s and early 1930s,
when liquidity was abundant and the Federal Reserve System trusted (or perhaps untested) as a
lender of last resort, holding substantial excess reserves could be seen as a sign of weakness,
since it signaled that a bank did not believe it could turn to counterparties or the Federal Reserve
for loans, should it need to convert assets to cash in order to accommodate depositors’ demands.
Depositors also possessed information about the state of the economy. The Dow Jones
Industrial Average (DJIA) was one of the most widely reported statistics. It appeared every day
in newspapers throughout New York (and the rest of the United States). The DJIA was one of the
first and certainly the most widely watched and most influential barometer of business activity.

12
Large movements in the DJIA were typically highlighted on newspapers’ front pages and by
newspapers’ street signs and salesmen. Large movements in the DJIA also generated discussion
on radio news shows, which commanded growing audiences during the 1930s. At that time, of
course, individuals had access to much less information about the state of the economy than
individuals due today. The government and private businesses collected and published far less
data. Quantitative analysis of financial and economic data was in its infancy. Neither the Internet
nor electronic spread sheets existed. Typical depositors at typical banks tended to focus on
summary statistics which were widely reported. The most widely reported statistic was the DJIA.
Our paper employs three additional types of data to control for economic conditions. The
first is a leading economic indicator: construction contracts awarded. The second is a
contemporaneous economic indicator: the New York Fed’s index of retail trade. The third is a
lagging economic indicator: business failures by month. We collect all of this information
monthly, and use it to distinguish depositors’ reactions to information about the state of the
economy (represented by the DJIA) and actual economic activity. We know depositors were
inundated with information about the DJIA, while depositors lacked information about
construction, sales, and failures. Generating that information involved a lag of several months.
Reports of that information seldom appeared in the popular press, and in general, appeared deep
within publications of interest to bankers and businessmen.
The Banking Act of 1933, commonly called the Glass-Steagall Act, created Federal
Deposit Insurance Corporation (FDIC). The FDIC initially insured all deposits up to $10,000 and
of larger deposits, 100% of the first $10,000; 75% of the next $40,000; and 50% of any deposit
over $50,000. The FDIC was originally created as an emergency, temporary measure. It began
with backing from the Federal government, raised funds from fees charged on participating

13
banks, and possessed the power to impose assessments on healthy banks to pay for losses from
insolvent banks. The law required all nationally chartered and Federal Reserve member banks to
join the FDIC. State-chartered institutions could join the FDIC, but most state-chartered banks in
New York eschewed its original incarnation.
The Banking Act of 1935 (passed in August of that year) amended the earlier act. The
FDIC received a permanent charter. The FDIC insured the first $5,000 of all deposits and
nothing over that amount. The FDIC collected an annual assessment of 1/12 of 1 percent of all
deposits in insured banks with no provision for collecting ‘special assessments’ to cover larger-
than-expected losses. The FDIC became the receiver for all troubled commercial banks. New
resolution procedures ensured the prompt payoff of all insured depositors, either directly through
the FDIC or indirectly, after the FDIC brokered a transfer of the deposits (and underlying assets)
to a healthy bank. These changes made the FDIC palatable to most depository institutions.
Almost all state-chartered banks in New York quickly joined the program. The swift adoption of
deposit insurance was motivated, in part, by a change in New York’s banking law, which
eliminated double liability of stockholders and reduced liability of directors for banks that joined
the FDIC.
The Banking Acts of 1933 and 1935 changed the financial system in many ways. For our
study, the most important changes were those that differentially influenced the incentives of
preferred versus regular depositors. Insurance was a transcendent change. Prior to its existence,
incentives of preferred and regular depositors differed, with regular depositors exposed to greater
risk. After deposit insurance, incentives converged, with both classes of depositors promised
rapid access to funds held by failing banks. Rules regarding interest payments on deposits
worked in the same direction. Before 1935, rates paid to preferred and regular depositors
14
differed. Afterwards, these rates converged, with the interest rates on demand deposits set near
zero and interest rates on time and savings deposits capped at six percent.
3. Data Sources and Summary Statistics
Data for this study come from several sources. The principal data consists of quarterly
level balance sheets for all state-chartered commercial banks and trust companies in New York
State. This information was published in the Annual Report of the Superintendent of Banks. We
computerized this data for the years relevant for our study, and our working to computerize the
data series for all years from 1913 through 1938.
Newly constructed balance sheet information possesses many advantages. It is accurate,
since it comes from legal submissions whose veracity checked by independent auditors and bank
examiners. Incorrect submissions exposed corporate officers to civil and criminal liability. This
information was also widely disseminated, since state law required banks to publish these
balance sheets in local newspapers. The bank superintendent published all of this information in
monthly bulletins and in an annual report published early in the following year (i.e. 1912 data
appeared in print in early 1913). The report presented this data in a consistent format for several
decades.
The data also present certain challenges. One challenge comes from the evolving
categorization of liabilities and assets across the years that we study. In some years, for example,
the source reports liabilities tabulated by class of depositor and type of deposit. In other years,
the source does not contain this cross tabulation. We overcome this challenge by computing
consistent categories across all years at the finest possible categorization. Another challenge
comes from a lacuna in the data. During the years 1933 and 1934, when the banking holiday

15
closed many commercial banks for prolonged periods of time, New York’s legislature suspended
laws requiring banks to submit call reports and publish balance sheet information.3 We overcome
this challenge by comparing the impact of the permanent program of the FDIC, established in the
summer of 1935, to the state of affairs that prevailed in the state of New York prior to the
introduction of emergency measures during March 1933. We do not analyze the impact of the
temporary insurance regimes established during the banking emergency and evolving prior to the
solidification of the FDIC.
The structure of New York’s banking system provides a unique analytic opportunity. It
also illuminates a salient and central case. Deposits at banks in New York comprised a large
share of total deposits in the U.S. Figure 1 presents total deposits in New York and the United
States. At the onset of the Great Depression, U.S. deposits amounted to $27 billion. In the early
1930s, deposits fell sharply due to the banking panics that deepened the depression. From 1933
to 1935, deposits rebounded, but did not return to the pre-depression peak until after the end of
our study. These aggregate changes coincided with an increase in the share of deposits held in
banks in the state of New York. At the beginning of 1929, banks in New York held 42 percent of
all deposits. At the end of 1932, banks in New York held nearly 70 percent of all deposits. This
is because deposits contracted sharply in the other states, while deposits declined mildly in New
York.
Our data on state-chartered banks represents a large share of all deposits in the state of
New York. Figure 2 presents the share of deposits in the national and state-chartered banking
3 In the spring of 1932, the Legislature of the State of the New York established the Banking Board to improve
banking businesses during the Great Depression. In March 1933, when the Banking Act was passed to end banking
panics, the Legislature gave the Banking Board the emergency powers to enact rules and regulations which have the
effect of law. During the years 1933 and 1934, the Banking Board suspended Banking Laws requiring the rendering
of reports or the examinations of banking institutions subject to the supervision of the Banking Department.

16
systems in New York. State-charted banks were important financial intermediaries in New York
during this period; they represented 60 percent of total deposits.
Tables 1 and 2 show balance sheets published in the annual report between 1929 and
1938. After the state department began reporting of balance sheets, it made several changes to
the reporting framework over time.4 In 1930, there was a major change in the reporting
framework because the state department began to report the amount of demand and time deposits
separately.
Our micro-sample consists of data on 377 state-chartered banks and trust companies, 72
of which are New York City banks, 8 are reserve city banks, and 297 are country banks. While
just over 19 percent of the sample consists of New York City banks, those banks are much larger
than the country banks, averaging over 10 million in assets versus just over 4 million in assets for
country banks.
Most of these deposits were concentrated in New York City. Figure 3 presents the share
of deposits in New York’s state-charted banking system by reserve city status. New York City
banks represented only 19 percent of banks, but 70 percent of deposits. Reserve city and country
banks represent 10 and 20 percent of deposits, respectively. Throughout our analysis, we will
provide separate estimation results for New York City bank and for country banks since we find
important differences in depositor monitoring of these two categories of banks.
In order to identify causality between deposit insurance and depositor monitoring, we use
deposit insurance as a natural experiment that reduced the risk of holding regular deposits after
1935. We begin our analysis by plotting the movement of regular and preferred deposits before
4 The major change occurred in 1911 when the state banking department began to publish quarterly balance sheets
for trust companies in an attempt to intensify regulatory scrutiny in response to the banking panic of 1907. Other
changes occurred in various years as the state banking department made changes to the reporting of balance sheet
items.

17
and after deposit insurance. Figure 4, Panel A, shows that regular deposits constituted most of
total deposits. Regular and preferred deposits represented 90 percent and 10 percent of total
deposits, respectively. Figure 4, Panel B illustrates deposit indices for regular and preferred
deposits. While regular deposits declined and preferred deposits increased before deposit
insurance, it is unclear that both types of deposits followed different trajectories after deposit
insurance.
We present the mean values and standard deviation for all variables used in the analysis
in Table 3. The descriptive statistics are calculated separately for the periods before and after the
introduction of deposit insurance. We observe that while regular deposits contracted, preferred
deposits expanded before the introduction of deposit insurance. In comparison, while regular
deposits expanded, preferred deposits contracted after the introduction of deposit insurance. As a
result, a share of preferred deposits increased from 0.7 to 0.11. The cash-deposit ratio rose from
0.13 to 0.21 as banks accumulated large cash reserves after 1935. In comparison, the capital-
deposit ratio remained constant.
The remainder of our data indicates information about the state of the economy. Data on
Dow Jones Industrial Average comes from Federal Reserve Economic Data operated through the
Federal Reserve Bank of St. Louis. Data on retail trade indices is constructed by combining data
published in the Federal Reserve Bulletin and a monthly internal memorandum produced by the
Federal Reserve Board, as described in Park and Richardson (2010). Data on construction
contracts awarded and the number of business failures comes from the Federal Reserve Bulletin.
These latter two series originally appeared in the business periodicals of R.G. Dun and
Bradstreets, and after their merger at the depths of the depression, the publications by Dun and
Bradstreets.
18
4. Model
Our empirical approach begins with a model of why economic agents deposited funds in
commercial banks during the era which we investigate. Depositors’ primary motivation was
acquiring transaction services. The principal service was the ability to use checks as a means of
payment. Secondary services included safekeeping of cash, wire transfers, letters of credit,
certified checks, access to seasonal lines of credit, and convenient foreign exchange. Interest was
paid on demand deposits, which were the majority of deposits held by commercial banks.
Savings accounts paid slightly higher rates of interest, and could be used for transaction services
by transferring funds between savings and demand accounts. At the time, commercial banks
were the only financial institutions that offered these services – the legal, contractual, and
technological innovations that enabled other institutions to compete on this dimension did not
occur until after World War 2, and largely during the 1970s and 1980s. Thus, the principal
alternative to using commercial banks for transactions services was to hold large quantities of
cash.
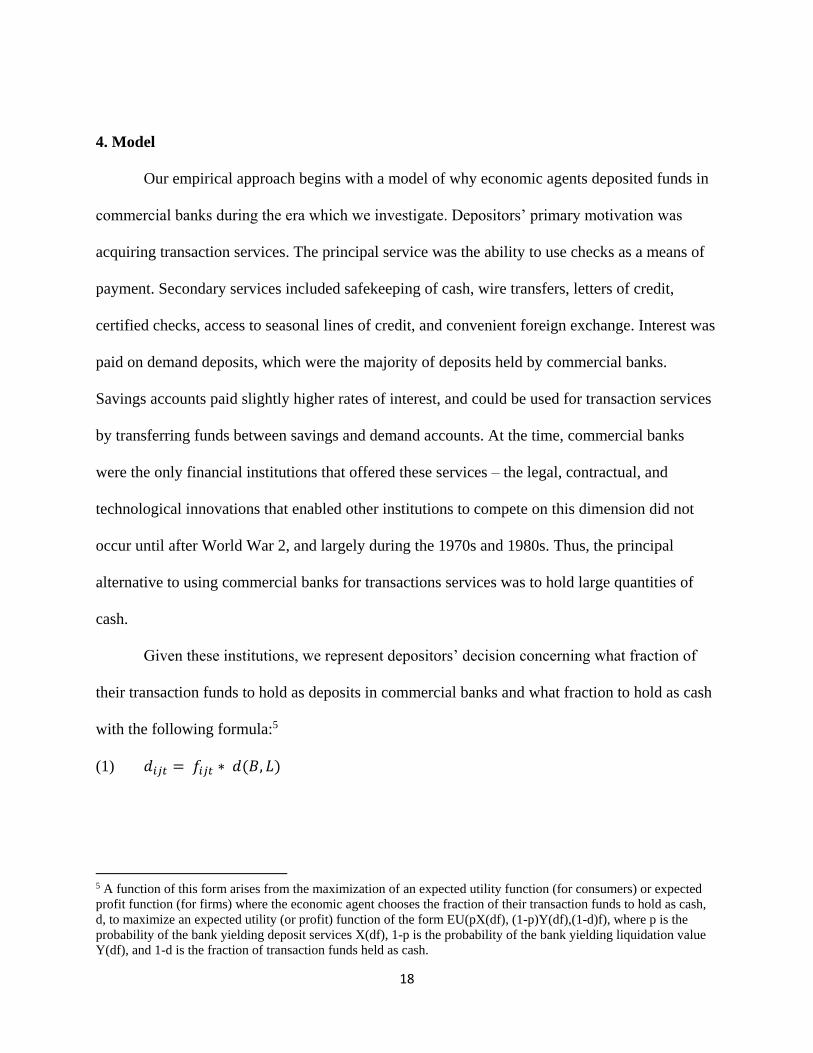
Given these institutions, we represent depositors’ decision concerning what fraction of
their transaction funds to hold as deposits in commercial banks and what fraction to hold as cash
with the following formula:5
(1) 𝑑𝑖𝑗𝑡 = 𝑓𝑖𝑗𝑡 ∗ 𝑑(𝐵, 𝐿)
5 A function of this form arises from the maximization of an expected utility function (for consumers) or expected
profit function (for firms) where the economic agent chooses the fraction of their transaction funds to hold as cash,
d, to maximize an expected utility (or profit) function of the form EU(pX(df), (1-p)Y(df),(1-d)f), where p is the
probability of the bank yielding deposit services X(df), 1-p is the probability of the bank yielding liquidation value
Y(df), and 1-d is the fraction of transaction funds held as cash.

19
Where dijt indicates the funds deposited by the ith depositor in the jth bank at time t. Time periods
runs from t = 1912.1, …., 1938.4, where 1912.1 indicates the first quarter of 1912 and 1938.4
indicates the fourth quarter of 1938. The total number of banks equals J, so that j = 1, ….., J. The
total number of depositors, I, differs from ij = 1, …., Ij. Hereafter, we omit the subscript on I,
except where necessary for clarity. fijt indicates the transaction funds available to the ith
depositor of the jth bank at time t.
The function, d(B,L), indicates the fraction of a depositor’s transaction funds that they
deposited in their bank. The function possesses two arguments, B and L. The first argument, B,
indicates the expected benefits of holding demand deposits. It is the product of two terms, B =
b(rjt,sjt)*pjt. The first term, b(rjt,sjt), indicates the benefits from holding demand deposits, given
the services, sjt, and interest, rjt, offered by bank j at time t. The second term, pjt, indicates the
probability that the bank remained in operation and that depositors received these benefits. The
second argument, L, indicates the expected liquidation value of a bank deposit. It is also the
product of two terms, L = ljt * (1-pjt). The first term, ljt, indicates the liquidation value of a
deposit in bank j at time t, if the bank should cease operations, which occurred with probability
(1-pjt).6 Substituting for B and L in (1), we see that depositors determined the fraction of their
funds to deposit in their bank by weighing the expected benefits of two states of the world: one
state in which the bank remained in operation and provided transaction services; the other in
6 Note that since we are focusing on demand deposits, which individuals can withdraw at any time, individuals
based their decisions on the interest rate they earn in the current period. Since we are focusing on transaction
accounts, the alternative investment is holding currency (or a close substitute for currency, such as gold coins or
perhaps postal-savings deposits, a safe forming of savings that pays minimal interest and provides few services). For
these reasons, our model abstracts from the term structure of interest rates and returns on alternative forms of invest.
Later, we’ll discuss how these could be added to the model, but why they would not change our results. Throughout
our analysis, we normalize the costs and benefits of holding cash, which was depositors principal alternative, to
zero.

20
which the bank ceased operations and the depositor received the liquidation value of their
deposit, as in equation (2) below.7
(2) 𝑑𝑖𝑗𝑡 = 𝑓𝑖𝑗𝑡 ∗ 𝑑(𝑏(𝑟𝑗𝑡 , 𝑠𝑗𝑡)𝑝𝑗𝑡, 𝑙(1 − 𝑝𝑗𝑡))
To determine total deposits in each bank, we need to sum the balances of the depositors.
Then, we can write total deposits in a bank, Djt, as follows.
(3) 𝐷𝑗𝑡 = ∑ 𝑑𝑖𝑗𝑡𝐼1 = ∑ 𝑓𝑖𝑗𝑡
𝐼1 ∗ 𝑑(𝐵, 𝐿) = 𝐹𝑗𝑡 ∗ 𝑑(𝐵, 𝐿)
Here, Fjt indicates total transaction funds available to all depositors in bank j at time t. If we
assume that all depositors are identical, then we can write (3) as follows.
(4) 𝐷𝑗𝑡 = ∑ 𝑑𝑖𝑗𝑡𝐼1 = ∑ 𝑓𝑖𝑗𝑡
𝐼1 ∗ 𝑑(𝐵, 𝐿) = 𝐹𝑗𝑡 ∗ 𝑑(𝐵, 𝐿) = 𝐼 ∗ 𝑓𝑖𝑗𝑡 ∗ 𝑑(𝐵, 𝐿)
Our empirical estimates focus on deposits aggregated at the bank level, because we observe total
deposits in each bank, not the balances of particular depositors.
We also observe banks’ allocation of assets. Depositors observed this information, and in
many cases, considered it when deciding the fraction of their transaction balances to place in
their banks. For this section, we represent a bank’s choice with a single variable, x, which
indicates the fraction of a bank’s assets placed into lucrative but risky asset, such as a loan to a
local business. The variable xjt lies between zero and one. Assume a bank holds all resources
other than loans in a safe, liquid, low-return asset, such as cash in its vault. A bank’s portfolio
decisions influence the interest that it pays to depositors, its probability of failure, and the
liquidation value of its deposits. Taking this information into account allows us to rewrite our
depositor-decision equation as follows.8
7 Note that we’ll assume depositors in failed banks have access to the liquidation value of their deposits during the
quarter in which the bank failed. 8 The concept of depositor monitoring means that depositors react to banks’ choices – particularly about how to
invest the funds with which they are entrusted – which influence the costs and benefits of deposits. Our model
incorporates this concept by adding a variable, x, which represents the banks’ choice (or choices). For now, think of
x as a single decision, a banks’ choice of what percentage of its balance sheet to invest in a safe, liquid asset (e.g.

21
(5) 𝐷𝑗𝑡 = 𝐹𝑗𝑡 ∗ 𝑑(𝑏(𝑟(𝑥𝑗𝑡), 𝑠𝑗𝑡)𝑝(𝑥𝑗𝑡), 𝑙(𝑥𝑗𝑡)(1 − 𝑝(𝑥𝑗𝑡)))
To determine how aggregate deposits responded to banks’ portfolio choices, we take the
derivative of both sides of (5) with respect to xjt.
(6) 𝜕𝐷𝑗𝑡/𝜕𝑥𝑗𝑡 = 𝜕 𝐹𝑗𝑡∗ 𝑑(𝑏(𝑟(𝑥𝑗𝑡),𝑠𝑗𝑡)𝑝(𝑥𝑗𝑡),𝑙(𝑥𝑗𝑡)(1−𝑝(𝑥𝑗𝑡)))
𝜕𝑥𝑗𝑡
Simplifying and collecting terms yields an equation with a clear interpretation.
(7) 𝜕𝐷𝑗𝑡
𝜕𝑥𝑗𝑡= 𝐹𝑗𝑡 ∗ [𝑝(𝑥𝑡𝑗)
𝜕𝑑
𝜕𝐵
𝜕𝑏
𝜕𝑟
𝜕𝑟
𝜕𝑥+ (
𝜕𝑑
𝜕𝐵𝑏(𝑟(𝑥𝑡𝑗), 𝑠) −
𝜕𝑑
𝜕𝐿𝑙(𝑥𝑡𝑗))
𝜕𝑝
𝜕𝑥+ (1 − 𝑝(𝑥𝑡𝑗))
𝜕𝑑
𝜕𝐿
𝜕𝑙
𝜕𝑥]
The derivative on the right-hand side contains three terms. The first term, 𝜕𝑑
𝜕𝐵
𝜕𝑏
𝜕𝑟
𝜕𝑟
𝜕𝑥𝑝(𝑥𝑡𝑗), refers
to the change in benefits that a depositor receives when a bank changes interest rates on demand
deposits (multiplied by the probability of receiving interest payments). The second term,
(𝜕𝑑
𝜕𝐵𝑏(𝑟(𝑥𝑡𝑗), 𝑠) −
𝜕𝑑
𝜕𝐿𝑙(𝑥𝑡𝑗))
𝜕𝑝
𝜕𝑥, refers to the net benefit of depositing in a healthy bank rather
than receiving the liquidation value of one’s deposits multiplied by the change in the likelihood
of the banks’ survival (due to the changing riskiness of the bank’s portfolio). The third term,
(1 − 𝑝(𝑥𝑡𝑗))𝜕𝑑
𝜕𝐿
𝜕𝑙
𝜕𝑥, refers to the change in liquidation value of the bank’s portfolio (due to the
changing riskiness of the bank’s portfolio) multiplied by the probability of the bank failing.
Economic factors determine the endpoints of the r(x) and p(x) functions. If a bank holds
all of its assets as cash, then it earns no returns, cannot pay interest to depositors, cannot recoup
its costs, and eventually fails. If a bank holds no liquid assets, then it may be able to pay high
interest for a while, but eventually the illiquid institution faces a credit crunch, when depositors
wish to withdraw funds and the bank lacks the ability to repay, and the bank goes out of
cash in its vault or deposits at the Federal Reserve) versus what percentage to invest in riskier higher-return assets
(e.g. mortgage loans). Therefore, x is a fraction whose domain lies between zero and one (later, we generalize x to a
vector of variables that can lie either between zero and one or along the real line). A bank’s choice may influence
the probability of default or the interest paid to depositors. Therefore, both r, p, and D are functions of x.

22
business. So, the optimal level of x lies in the interior of the (0,1) interval. Between those
endpoints, the shapes of the functions are unknown.
The functions’ optimal points and even their shapes may vary over time, as the state of
the economy and attitudes of individuals vary. For example, during a long period of prosperity,
banks with above average x may earn larger profits, pay higher dividends, and have lower rates
of failure. Following a financial panic, however, banks with above average x may suffer
substantial investment losses, which could force them into insolvency. The shapes of the r(x) and
p(x) functions may also depend upon strategic interactions in financial markets. The probability
of failure, p(x), for example, depends upon depositors’ perceptions of mindset of short-term
creditors (such as other depositors or correspondent bankers), who could withdraw funds en
masse, forcing an illiquid institution out of business.
Equations (4) through (7) highlight key issues in empirical studies of depositors’
behavior. We observe deposits, D, at the aggregate but not the individual level. We observe few
of the variables or functions on the right-hand side of the equation. At times, ex-post returns, r,
can be estimated by dividing total interest paid during a period by average daily deposits during
that same interval, but this information is available infrequently, and estimated average yields
may be far from the marginal returns earned by particular depositors. The ex-post probability of
default can be estimated from the failure rate of commercial banks, but depositors’ ex-ante
expectations of the probability of default cannot be unobserved.
Equation (7), which is the derivative of (5) with respect to xjt, highlights other issues that
complicate attempts to determine how depositors react to banks’ actions. Economic theory
places little or no restrictions on the shapes or slopes of the functions on the right-hand side of
(7). Not surprisingly, the literature on this topic reports empirical estimates of these coefficients

23
(or of the aggregate relationship between x and D) with various signs, magnitudes, and
significance levels. The coefficients often vary over time. All of these estimates could be
correct. They usually seem consistent with sensible interpretations of the situation – like during
booms depositors shift towards higher-risk higher-return institutions, so that D/dx is positive,
while following financial crises, depositors shift their funds towards institutions with less
exposure and more liquidity, so that D/dx is negative.
Equation (7) above summarizes the responses of regular depositors. The equation
simplifies for preferred depositors for several reasons. First, state law set rates of interest for
preferred depositors. For them, therefore, dr/dx equaled zero, and hence the first term on the
right-hand side of (7) equaled zero. Second, in the good state of the world in which their bank
continued to operated, preferred depositors received lower interest rates and identical services to
regular depositors. In contrast in the bad state of the world, preferred depositors were better off
than regular depositors (as described in the next paragraph). Thus, the second term in equation
(7), which was a function of the difference between the good and bad states for a depositor, was
lower for preferred than regular depositors.
Third, state law ensured that preferred depositors received complete repayment before
regular depositors received any repayment. Historically, preferred depositors in New York state
banks experienced no legal losses, although bank failures occasionally caused them economic
inconvenience, because it trapped their deposits in institutions undergoing liquidation, and
prevented them from accessing their cash until the liquidating agent, either the Superintendent of
Banks or court-authorized receiver, collected sufficient funds to pay of preferred claims, which
occasionally took time. In the instances which the authors’ examined, liquidators typically began
paying preferred depositors within a few months and finished the payouts within one year.
24
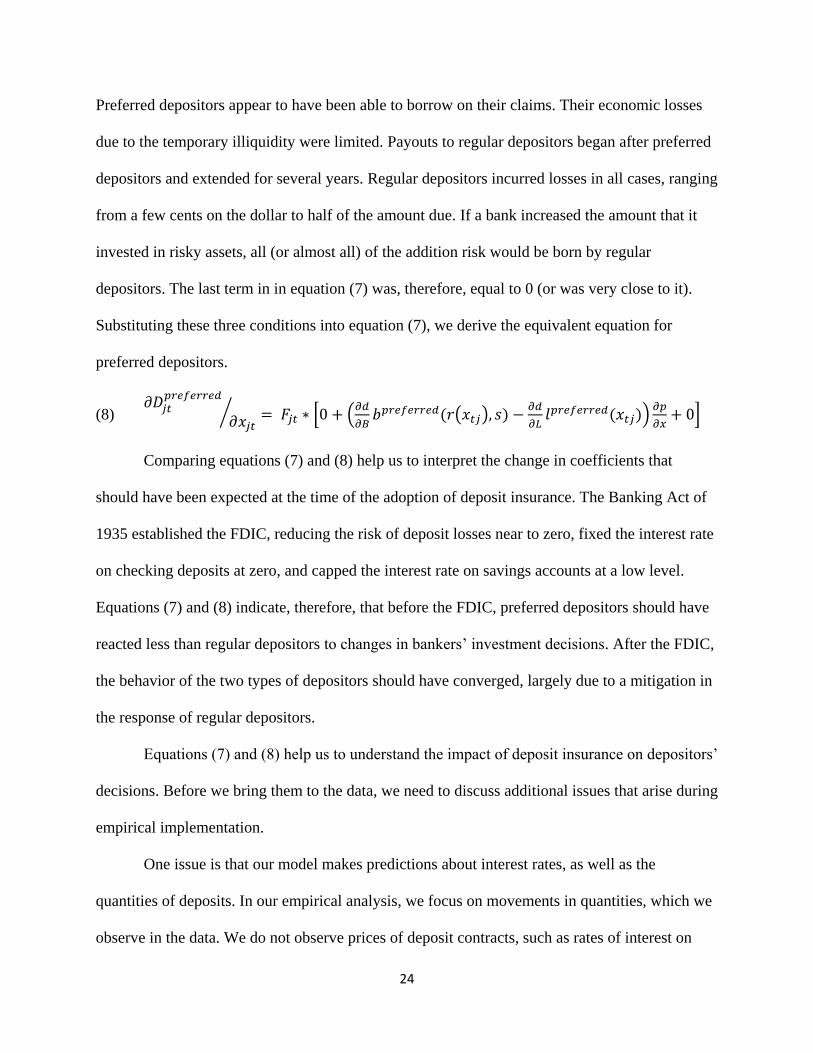
Preferred depositors appear to have been able to borrow on their claims. Their economic losses
due to the temporary illiquidity were limited. Payouts to regular depositors began after preferred
depositors and extended for several years. Regular depositors incurred losses in all cases, ranging
from a few cents on the dollar to half of the amount due. If a bank increased the amount that it
invested in risky assets, all (or almost all) of the addition risk would be born by regular
depositors. The last term in in equation (7) was, therefore, equal to 0 (or was very close to it).
Substituting these three conditions into equation (7), we derive the equivalent equation for
preferred depositors.
(8) 𝜕𝐷𝑗𝑡
𝑝𝑟𝑒𝑓𝑒𝑟𝑟𝑒𝑑
𝜕𝑥𝑗𝑡⁄ = 𝐹𝑗𝑡 ∗ [0 + (
𝜕𝑑
𝜕𝐵𝑏𝑝𝑟𝑒𝑓𝑒𝑟𝑟𝑒𝑑(𝑟(𝑥𝑡𝑗), 𝑠) −
𝜕𝑑
𝜕𝐿𝑙𝑝𝑟𝑒𝑓𝑒𝑟𝑟𝑒𝑑(𝑥𝑡𝑗))
𝜕𝑝
𝜕𝑥+ 0]
Comparing equations (7) and (8) help us to interpret the change in coefficients that
should have been expected at the time of the adoption of deposit insurance. The Banking Act of
1935 established the FDIC, reducing the risk of deposit losses near to zero, fixed the interest rate
on checking deposits at zero, and capped the interest rate on savings accounts at a low level.
Equations (7) and (8) indicate, therefore, that before the FDIC, preferred depositors should have
reacted less than regular depositors to changes in bankers’ investment decisions. After the FDIC,
the behavior of the two types of depositors should have converged, largely due to a mitigation in
the response of regular depositors.
Equations (7) and (8) help us to understand the impact of deposit insurance on depositors’
decisions. Before we bring them to the data, we need to discuss additional issues that arise during
empirical implementation.
One issue is that our model makes predictions about interest rates, as well as the
quantities of deposits. In our empirical analysis, we focus on movements in quantities, which we
observe in the data. We do not observe prices of deposit contracts, such as rates of interest on

25
time, savings, and demand deposits. Data on rates paid to depositors at individual banks in New
York State does not exist. State authorities did not report this information in their reports, and
state authorities did not preserve banks’ income statements, which could be used to calculate the
average interest rate which a bank paid to its depositors. Even if we had such information, it
might reveal little about market discipline, because the state and federal laws controlled rates of
interest on deposits of different types at different points in time in the era that we analyze.
Interest rates paid to preferred depositors were fixed by state law. Interest rates paid to regular
depositors were fixed after 1933, when Congress provided the Federal Reserve with the authority
to set rates of interest paid on deposits.
Another issue is that in the model, we assume that depositors allocate funds to a single
type of deposits or to cash in their pocket. We assume that depositors neither shift funds from
one bank to another nor do they shift funds from regular to preferred deposits in response to
bankers’ investment decisions. In the real world, of course, depositors may have (and probably
did) some of both. We lack information on these choices, because we only observe deposits by
type at the bank level. We’ll discuss how these issues influence our estimates in the empirical
section below.
Our model also simplified bankers’ portfolio and leverage decisions. We simplified these
into a simple choice of investing all funds in either a safe or risky asset. In the real world,
bankers make a set of simultaneous decisions about the liability and asset sides of their balance
sheets. Bankers determine how much of their own much to invest in the institution and how
much to leverage their investment with depositors’ funds. Bankers invest their resources in an
array of assets, some with higher risks and returns, some safer and more liquid. On these issues,
our shift from theory to estimation relies on Garcia’s (1935) and Bankers’ Magazine’s (1928)

26
volumes that introduced the public to the ratio analysis of bank balance sheets. These books told
depositors to focus on banks’ decisions about leverage, cash, and asset quality. For leverage,
both sources recommended examining the ratio of owners’ equity to borrowed funds (or to total
assets). A higher ratio meant that owners had more skin in the game, a bank was less likely to
fail, and if it did go out of business, depositors would see higher recoveries. For liquidity, both
sources recommended examining a ratio of cash (or cash-like assets) to deposits (or to total
assets). The comparison should be made to the typical amount of liquidity held by comparable
banks, and both sources provided tables, which indicated recent ratios for banks in prominent
locations. Deviations from the norm (either high or low) were deemed undesirable. Banks with
less liquidity than normal may not be able to meet depositors needs. Banks with more liquidity
than normal might have inside information about upcoming shocks or fear that that their assets
might not be accepted as collateral from correspondents or the Federal Reserve.
5. Empirical Methods and Results
Our empirical analysis asks two related questions. First, how did preferred and regular
depositors’ reactions to information about banks’ balance sheets change after the introduction of
deposit insurance? Second, how did preferred and regular depositors’ reactions to information
about the state of the economy change after the introduction of deposit insurance? We answer
these questions sequentially, because answering each question involves overcoming a problem of
endogeneity. The solution to endogeneity in the first case prevents us from answering the second
question; while the solution to endogeneity in the latter case prevents us from answering the
former

27
To measure depositors’ reaction to information about banks’ balance sheets, we estimate
the following panel regression.
(9) ∆𝑙𝑛(𝐷𝑘𝑗𝑡) = 𝛽𝑭𝑭𝑡−1 + ∑ ∑(𝑘 + 𝑐 + 𝑘𝑐)𝛽𝑘𝑐𝑭𝑭𝑡−1
1
𝑐=0
1
𝑘=0
+ 𝜆𝑡 + 𝜇𝑘𝑗 + 𝜀𝑗𝑘𝑡
Dkjt indicates the log of deposits of type k for bank j during period t. The indicator variable k
equals 0 for preferred deposits and 1 for regular deposits. The indicator variable c equals 0
before the introduction of deposit insurance (i.e. t < 1934.4) and 1 after the introduction of
deposit insurance (i.e. t > 1934.4). The interaction term, kc, equals 1 for observations on regular
deposits after the introduction of deposit insurance and 0 otherwise.
The vector Ft-1 indicates bank balance sheet factors. This vector of bank-level ratios
reflects banks’ leverage, liquidity, and in some specifications, asset quality. We represent
leverage with the ratio of owners’ book equity to total assets. This ratio is typically termed the
capital ratio. Book equity is the sum of paid-up capital, surplus, and other retained earnings. We
represent liquidity with the ratio of excess reserves to total deposits. We use the ratio of excess
reserves to deposits, rather than cash assets to deposits, because required reserves varied
depending on the city in which a bank was located and membership in the Federal Reserve
System. Excess reserves are calculated by subtracting required reserves from total reserves,
giving a clear indication the funds that banks could quickly mobilize to pay depositors. Reserves
are the sum of cash items, cash on hand, and funds due from banks (including the Federal
Reserve). Required reserves are a fraction of time and demand deposits which varies depending
upon the city in which the bank operated. Asset quality is measured by a ratio of secured loans to
total loans.
We lag these bank balance-sheet ratios to reflect the fact that the public received balance-
sheet information with a lag and to reduce potential endogeneity problems. The lag ensures that

28
only exogenous information appears on the right-hand side of the equation. βF is the vector of
coefficients for the variables in F. βkcF are the coefficients corresponding to the intercept and
interaction terms for regular deposits, after FDIC, and regular/after FDIC respectively.
An indicator variable for each time period, λt, controls for time‐varying economic factors.
These time-fixed effects ensure that we control for all time-varying factors, even those which we
do not observe. To control for heterogeneity at the bank level, we include a fixed effect for each
bank. We also cluster error terms at the bank, depositor level, μkj.. The random error term is εjkt.
The results from our regressions appear in Table 4. All columns include time fixed
effects. The second and forth columns include controls for loan quality. The third and fourth
columns include bank fixed effects. Our main interest is the vector of coefficients β11F and the
sum of the coefficients β11F plus β10F. The former indicate whether deposit insurance altered the
incentives of regular relative to preferred depositors. The latter indicates whether deposit
insurance caused the behavior of regular and preferred depositors to converge.
The first row presents the coefficient indicating regular depositors’ response to deposit
insurance (β11, excess reserves). In all cases, the null hypothesis that it equaled zero can be rejected.
This indicates that deposit insurance changed the behavior of regular depositors. In all cases, we
cannot reject the null hypothesis that the sum of the coefficients in the first and third rows (i.e.
β11, excess reserve + β10, excess reserve) equals zero. That indicates that the behavior of regular depositors
converged with the behavior of preferred depositors. The coefficients in the second and forth
rows reveal the baseline behavior for preferred depositors. They reacted to information about
banks’ liquidity neither before nor after the creation of the FDIC.
It is worth noting that the pre-FDIC behavior of regular depositors corresponds to the
behavior reported in books on bank analysis from the 1930s (which we discussed in the
29
preceding section). The books indicated that depositors should be wary of banks that held
substantially more or less liquidity than other institutions. In New York before 1932, the median
holding of excess reserves was close to zero. Commercial banks, in other words, held little
liquidity in excess of that legally required. Instead, they relied for liquidity upon the money-
center banks in Manhattan and the Federal Reserve Bank of New York, which stood behind
them. Banks which held more liquidity than necessary sent negative signals to depositors. That
signal diminished after the introduction of deposit insurance, when depositors – both regular nor
preferred – responded little to information about liquidity (and when almost all banks held large
excess reserves).
Now, we turn to capital. The fifth row presents the coefficient indicating how regular
depositors responded to capital-ratio changed after the introduction of deposit insurance (β11,
capital ratio). In all models, the null hypothesis that the coefficient equaled zero can be rejected.
Deposit insurance, in other words, changed how regular depositors responded to information
about capital ratios. We also cannot reject the null hypothesis that the sum of the coefficients in
the fifth and seventh rows (i.e. β11, capital ratio + β10, capital ratio) equals zero. That indicates that the
behavior of regular depositors converged with the behavior of preferred depositors after the
introduction of deposit insurance. The coefficients in the sixth and eighth rows reveal the
baseline behavior for preferred depositors. Before the creation of the FDIC, preferred depositors
did not react to information about the capital ratio. Afterwards, they did. Why preferred
depositors became more sensitive to bank risk later in the depression is difficult to determine.
The result could be consistent with a wake-up call effect that depositors may experience in the
aftermath of a banking crisis. Karas, Pyle, and Schoors (2013) report similar results. They find a

30
numbing effect from deposit insurance and a wake-up call from financial crises. In their study,
these effects cancel each other out in the long run.
Our results appear to be robust to changes in the specifications described above. Similar
results arise from regressions using different definitions of liquidity, such as total (rather than
excess) reserves, or the ratio of quick assets (cash, due from banks, and government bonds) to
demand deposits. Similar results also arise using different definitions of capital and leverage.
Overall, we find that after the creation of the FDIC, depositors ceased to respond to
information about banks’ liquidity. Depositors continued to respond to information about banks’
net worth, although regular depositors’ response to solvency concerns diminished and converged
on that of preferred depositors, who seem to have been more concerned with solvency after the
financial crisis of the early 1930s. These results seem sensible. Congress created the FDIC to
diminish incentives to run banks, particularly solvent institutions. The legislation that created the
FDIC (particularly the Emergency Banking Act, the Banking Act of 1933, and the Banking Act
of 1935) also expanded the federal governments’ role as a lender of last resort. These acts
authorized the FDIC to inject funds into (rather than liquidate) illiquid institutions and expanded
the lending authority of the Federal Reserve System, the Reconstruction Finance Corporation,
and the Department of the Treasury. Congress created multiple lenders of last resort to ensure
that at least one of them would act vigorously to counteract widespread runs on banks. Congress
tried to preserve depositors’ incentive to monitor the solvency of banks. Congress capped the
size of ensured accounts at $5,000, so that informed depositors, such as banks, firms, and
wealthy investors, whose deposits frequently exceeded the insurance threshold, retained an
incentive to monitor how banks invested funds and remove funds from financial institutions that

31
took too much risks or whose investments went wrong. Our results suggest that the FDIC
initially operated as Congress intended.
Now, we ask whether the creation of the FDIC changed how depositors responded to
news about the macroeconomy. Our key explanatory variable is the Dow Jones Industrial
Average (DJIA). At the time (and even today), the Dow was one of the most prominent statistics
in the United States. Depositors received information about it daily. Media outlets displayed the
information prominently. The Dow, however, was not exogenous information for banks in New
York City. These banks invested substantial sums – at times up to a fifth of their assets – in call
money markets. Call loans were invested in equity, derivative, and commodity markets,
particularly the New York Stock Exchange. The quantity of call loans influenced, therefore, the
prices of stocks, and the Dow Jones average. As a result, we cannot establish causality between
deposits and Dow Jones indices for banks operating in New York City. By contrast, banks
outside New York City could not invest in call loans. For those banks, deposits did not drive the
Dow.
Our baseline panel specification is as follows,
(10) 𝐷𝑘𝑗𝑡 = 𝛽𝐴𝐴𝑡 + 𝜷𝑿𝑿𝑡 + 𝜷𝑭𝑭𝑡−1
+ ∑ ∑(𝑘 + 𝑐 + 𝑘𝑐)
1
𝑐=0
[𝛽𝑘𝑐𝐴𝐴𝑡 + 𝜷𝑘𝑐𝑿𝑿𝑡 + 𝜷𝑘𝑐𝑭𝑭𝑡−1]
1
𝑘=0
+ 𝜇𝑘𝑗 + 𝜀𝑗𝑘𝑡
The variables have the same definitions as before. Dkjt indicates the log of deposits of type k for
bank j during period t. At indicates the log of the Dow Jones Industrial Average in period t. The
coefficient, β10A, indicates how regular depositors’ response to news differed from preferred

32
depositors. The coefficient, β10A, indicates how all depositors’ responses differed after the
introduction of deposit insurance. The coefficient, β11A, is the key variable of interest. It indicates
how the response of regular depositors to information about the economy changed relative to the
reaction of preferred depositors after the introduction of deposit insurance. To control for
heterogeneity at the bank level, we include a fixed effect for each class of depositors at each
bank. We also cluster error terms at the bank, depositor level, μkj.. The random error term is εjkt.
The vector Xt represents economic conditions. It includes the logged values of a leading
economic indicator (construction contracts awarded), a coincident indicator (retail trade index),
and a lagging indicator (number of business failures). These variables reflect economic forces
that effected the supply and demand of deposits, rather than information that depositors
possessed, because these data were constructed with a lag of many months and were seldom
disseminated directly to ordinary individuals. βX is the vector of coefficients for the variables in
X. βkcX are the coefficients corresponding to the intercept and interaction terms for regular
deposits, after FDIC, and regular-after FDIC respectively.
The vector Ft-1 indicates bank balance sheet factors. These include the ratio of unsecured
loans to total loans, the ratio of excess reserves to total deposits, the ratio of capital to total
assets, and the log of total assets. βF is the vector of coefficients for the variables in F. βkcF are
the coefficients corresponding to the intercept and interaction terms for regular deposits, after
FDIC, and regular-after FDIC respectively.
Table 5 indicates the results of these regressions for banks outside of New York City.
Column (1) presents a baseline. Columns (2) and (3) add controls for economic conditions.
Columns (3) adds controls for balance-sheet characteristics. These regressions show that before
the introduction of deposit insurance, deposits fluctuated in response to information about the

33
DJIA, even when controlling for economic factors and bank characteristics. Preferred deposits
served as a safe haven. When the DJIA rose, regular deposits rose and preferred deposits fell.
When the DJIA fell, the opposite happened. Preferred deposits expanded, and regular deposits
contracted.
Our key coefficient, β11A, which indicates how the response of regular depositors to the
FDIC differed from the response of preferred depositors, is negative and statistically significant.
It indicates that the introduction of deposit insurance reduced the response of regular deposits to
news about the DJIA relative to the response of preferred depositors. The coefficient β11A has a
causal interpretation. It demonstrates how the response of the treated group, in this case regular
depositors, differed from the response of the untreated group, preferred depositors.
6. Discussion
This essay examines the impact of the world’s first and largest nationwide deposit-
insurance system. In 1935, after two years of tinkering with emergency expedients, the United
States finalized the structure for the Federal Deposit Insurance Corporation. After this date,
depositors’ reactions to information about the aggregate economy diminished. Reactions to
information about banks’ balance sheets disappeared. Deposit insurance, in sum, reduced but did
not entirely eliminate depositor monitoring.
This result raises several questions. First, was this the outcome what the advocates of the
system intended? The answer is a qualified yes. Advocates certainly wanted to reduce the
reactions of small depositors, and they appear to have done so. But, advocates also desired to
retain market discipline, and hoped that large investors and corporate depositors, who lacked
insured but possessed the ability to monitor banks’ performance, would continue to reward banks

34
that behaved well and punish banks that performed poorly. On this front, they appear to have
been partially successful. Depositors continued to react, to some extent, to information about
aggregate economic risks. Bad news resulted in fewer deposits in risky banks; good news
resulted in the opposite. But these reactions were much smaller than they had been in the past,
and reactions to information about banks’ balance sheets disappeared.
The difference between these two types of information may be due to the regulatory
regime imposed along with deposit insurance. With the creation of the FDIC, commercial banks
faced at least three regulatory agencies – the FDIC, Fed, and either OCC or state bank
superintendent. These agencies enforced a tighter regulatory regime. So, differences among
banks’ balance sheets diminished. This convergence may prevent us from observing what would
have happened had banks acted in ways that they had prior to the panics of the early 1930s.
A second question concerns comparability: do studies of other nations at other times
reach similar results? Some studies do, but other studies don’t. A clear contrast arises with the
work of Martinez-Peria and Schmukler (2001), who employ similar methods to examine how
depositors reacted to the creation of deposit insurance schemes in Latin American nations in
recent decades. They find that the crises which preceded the creation of deposit insurance ‘woke
up’ depositors, increasing their awareness of risk and reaction to information about the safety
and soundness of banks. These heightened reactions continued after the creation of deposit
insurance, probably because depositors did not believe these schemes would protect them against
plausible contingencies, because the governments of those nations lacked the financial resources
to back up their systems if things went wrong.
In the United States, however, the promises of the Federal Deposit Insurance System
seem to have been credible, after 1935. From the spring of 1933 through the summer of 1935,

35
few banks in New York volunteered to join the temporary insurance scheme, probably because it
required healthy commercial banks to pay assessments to cover losses at insolvent institutions
that exceeded the reserves of the insurance fund. The Banking Act of 1935 changed that
provision, by increasing fees paid by insured institutions and assigning losses that those fees did
not cover to the Federal Government. The Banking Act of 1935 also provided the FDIC with a
permanent, rather than temporary, charter. The Banking Act of 1935 also reformed the corporate
governance of commercial banks, for example by making the CEO and CFO personally liable for
the veracity of financial statements, and reformed procedures for the resolution of failed banks.
These modern procedures kept banks in operation, to maximize the firms value, while trying to
merge or sell the valuable operations of the insolvent institution to new business partners. These
modern resolution procedures dramatically reduced depositors’ risk, because depositors no
longer had to wait for courts to decide who would receive what fraction of their deposits in a
failed institution. Since then, depositors at FDIC institutions have incurred no losses. The FDIC
that arose from the Banking Act of 1935 appears to have been popular among depositors and
bankers. Every state-chartered commercial bank in New York State joined the FDIC during
1935, and as this paper shows, depositors in general ceased worrying about the safety of their
deposits.

36
References
Bankers’ Magazine. (1927). How to analyze a bank's statement: reprinted from the "Bank credit
problems department" of the Bankers Magazine. New York: Bankers publishing
company.
Board of Governors of the Federal Reserve System (U.S.), (1943), Banking and Monetary
Statistics 1914-1941, accessed Mar 22, 2013 from FRASER,
http://fraser.stlouisfed.org/publication/?pid=38
Brown, Martin, Benjamin Guin, and Stefan Morkoetter. (2017). “Deposit Withdrawals from
Distressed Banks: Client Relationships Matter.” Mimeo, University of St. Gallen.
Calomiris, Charles W. and Matthew Jaremski. (2016). Stealing deposits: deposit insurance, risk-
taking and the removal of market discipline in early 20th century banks. NBER Working
Paper, No. w22692.
Calomiris, Charles. (1999). “Building an Incentive-compatible Safety Net.” Journal of Banking
and Finance, 23, 1499–519.
Chung, Ching-Yi and Gary Richardson. “Deposit Insurance Altered the Composition of Bank
Suspensions During the 1920s: Evidence from the Archives of the Board of Governors,”
Contributions to Economic Analysis & Policy: Vol. 5: No. 1, Article 34, pp. 1-42, (2006)
“Corporations. Ultra Vires: Contracts. Power of a Bank to Guarantee the Deposits of Another
Bank.” (1936). Harvard Law Review, 50, 130-131.
Demirguc-Kunt, Asli, and Enrica Detragiache. (2002). “Does Deposit Insurance Increase
Banking System Stability? An Empirical Investigation.” Journal of Monetary Economics,
49, 1373–1406.
Demirguc-Kunt, Asli, and Harry Huizinga. (2004). “Market Discipline and Deposit Insurance.”
Journal of Monetary Economics, 51, 375–99.
Demirguc-Kunt, Asli, and Edward Kane (2002). “Deposit Insurance around the Globe: Where
Does It Work?” Journal of Economic Perspectives, 16, 175–95.
Demirguc-Kunt, Asli, Edward Kane, and Luc Laeven. (2008). “Determinants of Deposit
Insurance Adoption and Design.” Journal of Financial Intermediation, 17, 407–38.
D.H.R. (1933) “Status of Surety of State Bank Deposits in Pennsylvania.” University of
Pennsylvania Law Review and American Law Register, 81, 441-449.
Folkerts-Landau, David Fokko Ihno and Carl-Johan Lindgren. (1998). Toward a Framework for
Financial Stability. Washington, DC: International Monetary Funds.

37
Garcia, Ferdinand Lawrence. (1935). How to Analyze a Bank Statement. Boston: Bankers Pub.
Co.
Garcia, Gillian. (1999). “Deposit Insurance: Actual and Best Practices,” IMF Working Paper
99/54, Washington, DC: International Monetary Fund.
Gorton, Gary. (2010). Slapped by Invisible Hand: The Panic of 2007. New York: Oxford
University Press.
Iyer, Rajkamal, Thais Laerkholm Jensen, Niels Johannesen, and Adam Sheridan. (2017). “The
Run for Safety: Financial Fragility and Deposit Insurance.” University of Copenhagen
Working Paper.
Iyer, Rajkamal and Manju Puri. (2012). “Understanding Bank Runs: The Importance of
Depositor-Bank Relationships and Networks.” American Economic Review, 102(4),
1414–1445.
Iyer, Rajkamal, Manju Puri, and Nick Ryan. (2016). "A Tale of Two Runs: Depositor Responses
to Bank Solvency Risk." Journal of Finance, 71(6), 2687-2726
J.M.W. “Unauthorized Pledges of National Bank Assets to Secure Deposits of Public Funds.”
(1939). Virginia Law Review, 26, 197-203.
Karas, Alexei, William Pyle, and Koenti Schoors. (2013). “Deposit Insurance, Banking Crises,
and Market Discipline: Evidence from a Natural Experiment on Deposit Flows and
Rates,” Journal of Money, Credit and Banking, 45, 179-200.
Kelly, Morgan and Cormac Gráda. (2000). “Market Contagion: Evidence from the Panics of
1854 and 1857.” American Economic Review, 90(5), 1110–1124.
Kniffin, William H. (1937). How to use your bank; a discussion of the relationship of a bank to
its customers with practical suggestions as to how advantageously to use banking-
services. New York, London, McGraw-Hill book Co.
Martinez-Peria, Maria, and Sergio Schmukler. (2001). “Do Depositors Punish Banks for Bad
Behavior? Market Discipline, Deposit Insurance, and Banking Crises.” Journal of
Finance, 56, 1029–51.
Park, Sangkyun, and Stavros Peristiani. (1998). “Market Discipline by Thrift Depositors.”
Journal of Money, Credit and Banking , 30, 347–64.
Richardson, Gary. “Quarterly Data on the Categories and Causes of Bank Distress during the
Great Depression,” Research in Economic History, Volume 25, pp. 37-115, (January
2008).

38
Richardson, Gary and Patrick Van Horn. “Intensified Regulatory Scrutiny and Bank Distress in
New York City during the Great Depression,” Journal of Economic History, Vol. 69, No.
2 (June 2009).
“Priority of State Deposits in Bank Insolvencies.” (1934). Harvard Law Review, 47, 841-846.
Sipes, Robert E. (1939). “Banks and Banking: Trusts: Special Deposits: Agreement between
Depositor and Bank.” Michigan Law Review, 37, 470-473.
“The Pledge of Bank Assets to Secure Deposits.” (1933). Harvard Law Review, 47, 1017-1023.

39
Figures
Figure 1. Deposits in New York and United States.
Source: All Bank Statistics, 1896-1955.
Figure 2: Deposits in National and State Chartered Banks in New York.
Source: All Bank Statistics, 1896-1955.
0
5
10
15
20
25
30
29 30 31 32 33 34 35 36 37 38
New York Other States
(billions of dollars)
-
2
4
6
8
10
12
14
16
29 30 31 32 33 34 35 36 37 38
National Banks State-Charted Banks
(billions of dollars)

40
Figure 3: Deposits in State-Charted Banks by Reserve City Status
Source: New York, State Bank Superintendent, Annual Reports (1929 – 1938).
0
1
2
3
4
5
6
29 30 31 32 33 34 35 36 37 38
NYC Reserve City Country Banks
(billions of dollars)

41
Figure 4: Share of Deposits held by Preferred and Regular Depositors in New York
Panel A. Deposits Held By Preferred and Regular Depositors
All Banks New York City Banks Country Banks
Panel B. Deposit Indices
All Banks New York City Banks Country Banks
Note: For indices, average of 1935 values equals 100. Source: State Bank Superintendent of New York, Annual Reports (1929–1938).
0
1,000
2,000
3,000
4,000
5,000
6,000
29 30 31 32 33 34 35 36 37 38Regular Deposit Preferred Deposit
(millions of dollars)
-
1,000
2,000
3,000
4,000
5,000
29 30 31 32 33 34 35 36 37 38Regular Deposit Preferred Deposit
(millions of dollars)
-
100
200
300
400
500
29 30 31 32 33 34 35 36 37 38Regular Deposit Preferred Deposit
(millions of dollars)
0
50
100
150
200
29 30 31 32 33 34 35 36 37 38Preferred Deposit
Regular Deposit
Index
0
50
100
150
200
29 30 31 32 33 34 35 36 37 38Preferred DepositRegular Deposit
0
50
100
150
200
29 30 31 32 33 34 35 36 37 38Preferred Deposit
Regular Deposit
Index

42
Table 1: Assets and Liabilities Reported, 1929
Assets
Liabilities
Specie
Capital
Other currency authorized by the United States government Surplus, including all undivided profits
Cash Items Preferred deposits, viz:
Due from NY Federal Reserve Bank, less offsets Due New York State savings banks
Due from other approved reserve depositories, less offsets Due New York State savings and loan associations, credit
unions, and land bank
Due from other banks, bankers, and trust companies Deposits by the State of New York
Stocks and bond investments Other deposits secured by the pledge of assets
Loans and discounts secured by bond, mortgage, deed, or other
real estate collateral
Deposits otherwise preferred
Loans and discounts secured by other collateral Due depositors, not preferred
Loans, discounts, and bills purchased but not secured by
collateral
Due trust companies, banks, and bankers
Own acceptances purchased Bills payable
Overdrafts Rediscounts
Bonds and mortgages owned Acceptances of drafts payable at a future date or authorized by
commercial lines of credit
Real estate Other liabilities
Customers’ liability on acceptances (per contra, see liabilities)
Other Assets
Source: State Bank Superintendent of New York, Annual Report, 1929.

43
Table 2: Assets and Liabilities Reported, 1930-1932 and 1935-1938
Assets
Liabilities
Specie
Capital
Other currency authorized by the United States government Surplus, including all undivided profits
Cash Items Reserves for taxes, expenses, contingencies, etc.
Due from NY Federal Reserve Bank, less offsets Deposits
Due from other approved reserve depositories, less offsets Preferred
Due from other banks, bankers, and trust companies Demand
Stocks and bond investments Time
Loans and discounts secured by bond, mortgage, deed, or other
real estate collateral
Not preferred
Loans and discounts secured by other collateral Demand
Loans, discounts, and bills purchased but not secured by
collateral
Time
Own acceptances purchased Due trust companies, banks, and bankers
Overdrafts Bills payable
Bonds and mortgages owned Rediscounts
Real estate Acceptances of drafts payable at a future date or authorized by
commercial letters of credit
Customers’ liability on acceptances (per contra, see liabilities) Bills purchased sold with endorsement
Customers’ liability on bills purchased and sold with
endorsement
Other liabilities
Other Assets
Source: New York State Banking Department (1930 – 1938).

44
Table 3: Summary Statistics
1929Q1-1932Q4 1935Q1-1938Q4
N Mean SD N Mean SD
Preferred deposit growth 5100 0.04 0.28 4071 -0.01 0.27
Regular deposit growth 5095 -0.02 0.12 4071 0.02 0.10
Preferred deposits/total deposits 5100 0.07 0.09 4071 0.11 0.12
Cash-deposit ratio 5100 0.13 0.10 4071 0.21 0.12
Capital-deposit ratio 5100 0.22 0.12 4071 0.21 0.10
Collateralized loan/total loans 5100 0.25 0.15 4071 0.35 0.20
ln(total assets) 5100 14.98 1.65 4071 14.99 1.73
Source: See text.

45
Table 4: Depositors’ Reactions to Bank Balance Sheet Characteristics, 1929 to 1938
(1) (2) (3) (4)
Excess Reserve Ratio * k * c 0.16** 0.18** 0.16* 0.20**
(0.067) (0.072) (0.084) (0.089)
Excess Reserve Ratio * c -0.01 -0.03 0.05 0.03
(0.043) (0.044) (0.052) (0.054)
Excess Reserve Ratio * k -0.14** -0.15** -0.23** -0.26**
(0.059) (0.064) (0.099) (0.104)
Excess Reserve Ratio -0.02 -0.02 -0.13** -0.11**
(0.032) (0.033) (0.054) (0.057)
Capital Ratio * k * c -0.31*** -0.30***
-0.38*** -0.36***
(0.102) (0.101) (0.140) (0.139)
Capital Ratio * c 0.22*** 0.22*** 0.32*** 0.31***
(0.079) (0.078) (0.108) (0.105)
Capital Ratio * k 0.27*** 0.27*** 0.28* 0.26*
(0.086) (0.085) (0.151) (0.151)
Capital Ratio -0.09 -0.09 0.13 0.14
(0.061) (0.060) (0.101) (0.101)
Time Fixed Effects Yes Yes Yes Yes
Controls for Loan Quality No Yes No Yes
Bank Fixed Effects No No Yes Yes
Observations 17,097 17,097 17,097 17,097
R-squared 0.0704 0.0706 0.073 0.074
Notes: Robust standard errors in parentheses. Asterisks indicate level of statistical significance: *** p <
0.01, ** p < 0.05, * p < 0.1. Notes: Regressions include observations for all banks in New York state for
each call report for the years 1929 to 1932 and 1935 through 1938. The dependent variable is the first
differenced natural logarithm of bank deposits. k is an indicator that equals 1 for regular deposits. c is an
indicator that equals one after the establishment of the FDIC. Controls for loan quality include the ratio of
unsecured to all loans and its interactions with k, c, and kc.

46
Table 5: Depositors’ Reaction to Information about the State of the Economy
(1) (2) (3)
Dow Jones Average * k * c -0.12*** -1.14*** -1.14***
(0.010) (0.097) (0.097)
Dow Jones Average * c 0.09*** 0.93*** 1.04***
(0.009) (0.094) (0.093)
Dow Jones Average * k 0.49*** 0.31*** 0.31***
(0.029) (0.044) (0.044)
Dow Jones Average -0.32*** -0.32*** -0.35***
(0.029) (0.043) (0.043)
Bank Fixed Effects Yes Yes Yes
Economic Conditions No Yes Yes
Bank Characteristics No No Yes
Observations 16,016 16,016 16,010
R-squared 0.190 0.214 0.228
Notes: The dependent variable is the first differenced natural logarithm of bank deposits. Regressions
include observations for all banks outside New York City for each call report for the years 1929 to 1932
and 1935 through 1938. k is an indicator variable indicating regular deposits. c is an indicator variable
indicating deposit insurance exists in that time period. Standard errors in parentheses. Asterisks indicate
level of statistical significance: *** p<0.01, ** p<0.05, * p<0.1. Controls for economic conditions include
construction contracts awarded, retail sales, and business failures. See text for details.