deposit insurance, moral hazard and market monitoring
TRANSCRIPT

WORK ING PAPER S ER I E SNO. 302 / F EBRUARY 2004
DEPOSITINSURANCE,MORAL HAZARD AND MARKET MONITORING
by Reint Gropp and Jukka Vesala

In 2004 all ECB publications will feature
a motif taken from the
€100 banknote.
WORK ING PAPER S ER I E SNO. 302 / F EBRUARY 2004
DEPOSIT INSURANCE,
MORAL HAZARDAND MARKETMONITORING1
by Reint Gropp2
and Jukka Vesala
1 Research assistance by Sandrine Corvoisier and Andres Manzanares is gratefully acknowledged. All errors are the authors’. Theviews expressed in this paper are solely those of the authors and not those of the ECB or the Eurosystem. We are grateful for the
comments received from Charles Calomiris, Asli Demirguc-Kunt, Xavier Freixas, Vitor Gaspar, Hans Gersbach, Philipp Hartmann,Martin Hellwig, Anil Kashyap, David Mayes, Benoit Mojon, Mitchell Petersen, Jean-Charles Rochet, two anonymous referees, seminar
participants at the ECB, the 2nd Kiel Workshop in Economics “The Integration of Financial Markets in Europe”, the IFS/WhartonConference “Competition among Banks: Good or Bad?”, the CEPR/EER/IAE Conference on Finance in Manresa/Spain, the
Federal Reserve Bank of Chicago 38th Annual Conference on Bank Structure and Competition and the IMF.2 European Central Bank, Kaiserstraße 29, D-60311 Frankfurt am Main, Germany. Corresponding
authors email adress: [email protected].
This paper can be downloaded without charge from http://www.ecb.int or from the Social Science Research Network
electronic library at http://ssrn.com/abstract_id=515064.

© European Central Bank, 2004
AddressKaiserstrasse 2960311 Frankfurt am Main, Germany
Postal addressPostfach 16 03 1960066 Frankfurt am Main, Germany
Telephone+49 69 1344 0
Internethttp://www.ecb.int
Fax+49 69 1344 6000
Telex411 144 ecb d
All rights reserved.
Reproduction for educational and non-commercial purposes is permitted providedthat the source is acknowledged.
The views expressed in this paper do notnecessarily reflect those of the EuropeanCentral Bank.
The statement of purpose for the ECBWorking Paper Series is available from theECB website, http://www.ecb.int.
ISSN 1561-0810 (print)ISSN 1725-2806 (online)

CONTENT SAbstract 4
Non-technical summary 5
I. Introduction 6
II. A stylised model of the safety netand moral hazard 7
III. Institutional background 15
IV. Data sources and description 16
V. Definitions of dependent andindependent variables 17
VI. Econometric model and baselineresults 20
VII. Banks’ balance sheet structure 25
VIII. Robustness 26
IX. Conclusion 27
Literature 29
Tables 31
Appendices 37
European Central Bankworking paper series 42
3ECB
Work ing Paper Ser ie s No . 302February 2004
Abstract
The paper analyses the relationship between deposit insurance, debt-holder monitoring,and risk taking. In a stylised banking model we show that deposit insurance may reducemoral hazard, if deposit insurance credibly leaves out non-deposit creditors. Testing themodel using EU bank level data yields evidence consistent with the model, suggesting thatexplicit deposit insurance may serve as a commitment device to limit the safety net andpermit monitoring by uninsured subordinated debt holders. We further find that crediblelimits to the safety net reduce risk taking of smaller banks with low charter values andsizeable subordinated debt shares only. However, we also find that the introduction ofexplicit deposit insurance tends to increase the share of insured deposits in banks’liabilities.
JEL classification: G21, G28
Key words: Banking, Moral Hazard, Market Monitoring, Deposit Insurance
4ECBWork ing Paper Ser ie s No . 302February 2004

Non-technical summary
Markets can limit the risk taking of banks, only if some market participants unambiguously have theirmoney at stake. This implies that some liabilities of the bank must be credibly excluded from the safety net.In this paper, we argue that explicit deposit insurance may play a useful role as a commitment device ofauthorities to limit the safety net to those explicitly covered under the deposit insurance. This point standsin contrast to the frequently reiterated argument that deposit insurance generates moral hazard andincentives for excessive risk taking by banks. If prior to the introduction of deposit insurance implicitguarantees were broad, the effect of introducing explicit deposit insurance on market monitoring and risktaking of banks may be positive. The reason is that all creditors of the bank aside from those insured underthe explicit system may have stronger incentives to monitor the bank. Based on the empirical evidence forthe European Union (EU) presented in this paper, it appears that explicit deposit insurance may in fact be auseful way to limit the safety net, increase market monitoring of banks, and reduce moral hazard.
In this paper, we first present a simple model which suggests that profit maximising banks may increase orreduce their risk taking in response to the introduction of deposit insurance, depending on four factors.One, whether or not the explicit deposit insurance is credible in excluding all other creditors of the bank.Second, the charter value of the bank. Third, the share of liabilities aside from insured deposits on thebalance sheet of the bank. And fourth, whether or not the banks is too-big-to-fail. The model highlights thatthe introduction of explicit deposit insurance, which credibly imposes limits on the safety net, will result ina reduction of risk for banks with low charter values, high shares of non-insured liabilities and for banksthat are not too-big-to-fail.
The predictions of the model are tested in a sample of EU banks during the 1990s. The EU in the 1990s is aparticularly suitable environment for testing the model, because a number of countries introduced explicitdeposit insurance during that period. This implies that there is cross-sectional as well as time seriesvariation in the existence of explicit deposit insurance in a sample of banks, which aside from depositinsurance operate in a largely similar regulatory environment. The empirical results are broadly consistentwith the theory. In particular we find: (i) The introduction of explicit deposit insurance in the EU may havesignificantly reduced banks’ risk taking. (ii) This effect is stronger for banks with low charter values andhigh subordinated debt shares. (iii) The risk taking of banks with a very large share in the banking systemof the country is unaffected (“too big to fail”). The theoretical model also predicts that banks will increasethe share of insured deposits in response to the introduction of explicit deposit insurance, precisely in orderto avoid increased market discipline. In deposit share regressions, we find evidence in favour of thishypothesis.
The results of the paper highlight the importance of the institutional environment for effective marketdiscipline of banks. It also provides evidence that banks in fact change their behaviour in response tosignals from the market, i.e. that market discipline can be effective. In this sense, the paper contributes tothe ongoing and extensive debate about the role markets as complements (or even substitutes) forsupervisory review and capital requirements, as outlined in the proposals regarding the reform of the BaselAccord.
5ECB
Work ing Paper Ser ie s No . 302February 2004

I. Introduction
Markets can limit the risk taking of banks, only if some market participants
unambiguously have their money at stake. This implies that some liabilities of the bank
must be credibly excluded from the safety net. In this paper, we argue that explicit deposit
insurance may play a useful role as a commitment device of authorities to limit the safety
net to those explicitly covered under the deposit insurance. This point stands in contrast to
the frequently reiterated argument that deposit insurance generates moral hazard and
incentives for excessive risk taking by banks. If prior to the introduction of deposit
insurance implicit guarantees were broad, the effect of introducing explicit deposit
insurance on market monitoring and risk taking of banks may be positive.2 Based on the
empirical evidence for the European Union (EU) presented in this paper, it appears that
explicit deposit insurance may in fact be a useful way to limit the safety net, increase
market monitoring of banks, and reduce moral hazard.
Previous empirical evidence concerning the impact of deposit insurance on bank
risk taking and the potential for banking sector fragility is mixed. For example, Wheelock
and Wilson [1994] and Alston et al. [1994] fail to establish a relationship between
historical US bank failure rates and deposit insurance. In addition, Karels and McClatchey
[1999] fail to find evidence that the adoption of deposit insurance increased the risk taking
of US credit unions. Conversely, Grossman [1992], Wheelok [1992] and Thies and
Gerlowski [1989] find a positive and significant relationship. Similarly, ������ ����
and Detragiache [2002] in a sample of 61 countries find that over a period from 1980-97
deposit insurance significantly increased the probability of a banking crisis in the country.
The impact of deposit insurance on risk taking interacts with at least three other
important factors: banks’ charter values, the effectiveness of monitoring by non-deposit
creditors and “too-big-to-fail.” The failure to accurately reflect any one of these factors
may account for the mixed findings of the empirical literature. If banks are able to earn
rents, either through regulatory limits on competition (e.g. Keeley [1990]) or valuable
lending relations (Sharpe [1990] and Rajan [1992]) or the acquisition of reputation (e.g.
Boot and Greenbaum [1992]), the effects of deposit insurance on risk taking may be
mitigated. Similarly, the degree of risk taking of banks may be influenced by the amount
of uninsured debt banks carry on their balance sheets (Dewatripont and Tirole [1993a])
2 The ample intervention by the government during the Swedish and Finnish banking crises in the early 1990,where explicit and limited deposit insurance systems were not in place beforehand, can be taken as supportingevidence in favour of the latter contention.
6ECBWork ing Paper Ser ie s No . 302February 2004
and Calomiris [1999]). And third, if banks are perceived as “too-big-to-fail,” their risk
taking might not be affected by the deposit insurance arrangement, as they enjoy a
comprehensive safety net in any case.
This paper aims to extend the empirical literature in two main ways. First, the
existing empirical evidence regarding banks’ risk taking tends to use U.S. data or use
rather heterogeneous samples containing developing and developed countries, whose
banking systems may be at widely different stages of liberalisation and sophistication.
There is limited evidence for developed countries, concerning the impact of deposit
insurance arrangements on risk taking in an environment of competitive banking outside
the US. This paper attempts to fill part of this void. Second, our data set allows us to test a
rich set of hypotheses regarding the interaction between deposit insurance, charter values,
monitoring, “too-big-to-fail” and moral hazard, closing some of the gap between the
theoretical and empirical literatures.
Our main findings can be summarised as follows: (i) We find evidence that the
introduction of explicit deposit insurance in the EU may have significantly reduced banks’
risk taking. (ii) We find that this effect is less prevalent for banks with high charter values
and low subordinated debt shares. (iii) We further find that the risk taking of banks with a
very large share in the banking system is unaffected (“too big to fail”). (iv) We find some
adjustments in the balance sheet structure of banks towards more insured deposits after the
introduction of explicit deposit insurance.
The remainder of the paper is organised as follows. In Section II we motivate our
empirical hypotheses by drawing on a simple model of banks with moral hazard. In
Section III, we provide some institutional background of deposit insurance and
deregulation in the EU. In Section IV we describe the data set we employ, along with
some summary statistics. Variable definitions, the empirical specification and baseline
results are reported in Sections V and VI, respectively. In Section VII, we examine the
effects of the introduction of explicit deposit insurance on banks’ balance sheets. Section
VIII examines the robustness of our results and Section IX concludes the paper.
II. A stylised model of the safety net and moral hazard
The theoretical literature (e.g. Freixas and Rochet [1997], Boot and Greenbaum
[1993], Dewatripont and Tirole [1993a, 1993b] and Matutes and Vives [1995]) is
unambiguous in that the public safety net, providing assistance to banks in distress and
protecting banks’ claim-holders from losses, increases the propensity by bank managers to
7ECB
Work ing Paper Ser ie s No . 302February 2004
take on excessive risk (moral hazard).3 This is so, since insured claim-holders of the bank
do not have appropriate incentives to monitor the actions by banks’ management. In this
section, we present a simple model of banks, which permits a derivation of conditions
under which the introduction of explicit deposit insurance results in an increase in market
monitoring if compared with an implicit bank safety net. The model also allows us to state
a number of empirical hypotheses regarding the interaction of specific bank characteristics
and risk taking under different safety net arrangements. As we will see below, the model
relies heavily on the idea that banks’ risk taking may largely be a function of the presence
of a set of creditors, which are credibly excluded from the safety net.
Consider the following simple, one period banking model with I risk neutral banks
denoted by subscript i. The banks are financed with deposits and subordinated debt.4 In
order to focus on the effects of the safety net, we abstract from moral hazard related to
limited liability and conflicts of interest between different claimants of the bank. The
associated return the bank pays on these two types of liabilities are Dir and B
ir ,
respectively. The bank invests in a risky portfolio of loans and charges a rate of )1( −Lir
on those loans. Banks offer a differentiated loan product, and are price takers in the
deposit and subordinated debt markets. For simplicity, we normalise the length of each
bank’s balance sheet to unity.
As in Boot and Greenbaum [1993], the probability structure of bank i’s pay-off
from its loan portfolio is
(1) 0 with probability i(1–mi)
and
(2) Lir ������������������� i) + mi i.
where i is the probability of default in bank i’s loan portfolio in the absence of
monitoring and mi represents the bank’s choice of monitoring effort, where )1,0(∈im
and )1,0(∈iρ . The pay-off is a function of the exogenous default probability, i and the
endogenous choice of the bank of how much monitoring effort to expend, mi.5 Note that if
the bank monitors fully, i.e. mi=1, the bank will receive rLi with certainty and will never
default. Monitoring, however, is costly and we assume a strictly positive and convex
monitoring cost schedule V(m) with V’(m)>0, V’’(m)>0, and V(m=0)=0.
3 The safety net, defined as the protection of banks’ creditors against losses resulting from bank failures, ismotivated in the first place by the short maturity structure of bank liabilities and the private informationcharacteristic of their longer-maturity assets, reflecting banks’ unique liquidity creation and intermediationfunctions (Diamond and Dybvig [1983], Gorton and Pennacchi [1990] and Calomiris and Kahn [1991])4 For simplicity we assume that banks do not have any equity. This assumption is relaxed subsequently in thediscussion on charter values.5 The position of the business cycle of the economy a bank operates in would be one way to interpret theexogenous riskiness of the portfolio or riskiness of the sector that the bank primarily lends to.
8ECBWork ing Paper Ser ie s No . 302February 2004

The bank operates for a succession of equivalent periods until it fails, where failure
is defined as the case of a pay-off to the loan portfolio of zero. To save notation we
suppress subscripts t. Further, assume that D represents the probability that the
government compensates depositors and B the probability of government compensation
of subordinated (non-deposit) debt in case the bank fails. Hence, if the banks succeeds,
depositors and subordinated debt holders receive Dir and B
ir , respectively. If the bank
fails, they receive Di
Drγ and Bi
Brγ .
We specify the following no arbitrage relationship between monitoring, mi, the
probability of bail out, B and rL and the risk free rate, r:
(3) ))(1)(1( rrmrr Li
Bi
Bi −γ−−+=
Expression (3) implies that
rmrmr iBB
iiBB
i ==∈=∈= )1},1,0{(})1,0{,1( γγ
and
Lii
BBi rmr === )0,0(γ .
Hence, if the bank does not monitor and the probability of a bail out is zero, the
borrowing rate will be equal to the lending rate. Further, expression (3) shows that if
either there is complete monitoring or the probability of a bail out is 1, rB will converge to
the risk free rate, as in that case the bank’s portfolio entails zero risk.
Equivalently, for the rate on deposits we have
(4) ))(1)(1( rrmrr Li
Di
Di −−−+= γ
Hence, the interest rate on subordinated debt and deposits is the same, as long as
they are bailed out with the same probability. Once this probability differs, the bank will
pay different interest rates on the two types of liabilities. While we do not model the
preferences of investors explicitly, equations (3) and (4) suggest that they are risk-averse.
The risk premium investors expect would be )( rr Li − , if they invested in the risky asset
directly (no monitoring). Further, this risk premium is linear and declining in the bail out
probability and in the level of monitoring of the bank.
Denoting the share of deposits in bank i’s liabilities with i, each bank maximises
profits of the form
( )( ) ( ) ( ) ).1(,),(V1 iB
iB
iiD
iD
iiL
iiiii mrmrmrm αγαγρρπ −−−−+−=
Solving
(5) im
πmax
yields the following first-order condition:
99ECB
Work ing Paper Ser ie s No . 302February 2004

( ).0)1(
m
r
m
r
m
mVr
m ii
Bi
ii
Di
i
iLii
i
i ≡−∂∂
−∂∂
−∂
∂−=
∂∂ ααρπ
Assuming the monitoring cost function has the specific form of6
(6) ( ) βii mm =V �� ����� ��
and substituting expressions (3) and (4), we obtain the optimal level of monitoring
(7) [ ] 1
1
* ))(1)(1())(1(1 −
−−−+−−+=β
γαγαρβ
rrrrrm Li
Bi
Li
Di
Liii
From (7) we see that the optimal level of monitoring is an increasing function of
bank i’s portfolio riskiness, i and the interest rate spread between risky loans and the risk
free rate. If the portfolio is riskier and the relative pay-off to risk greater, the bank will
monitor more. In contrast, higher probabilities of bail out for either deposits or
subordinated debt will reduce the bank’s level of monitoring. Note also, that in case
deposits and subordinated debt are bailed out by the government with different
probabilities, the proportion of the bank that is financed with subordinated debt will
matter. For the moment, we assume that i’s are fixed, but we will return to this issue
below. In the following we analyse a number of specific cases.
“Free banking”
If there is no chance of a bail out or any implicit or explicit deposit insurance, we
have D= B =0. The first thing to notice is that in this case the share of deposits in the
liabilities of the bank, i, does not matter, as both bank liabilities are equally risky. Hence,
the optimal level of monitoring becomes
(8) [ ] 1
1
* )(1 −
−+=β
ρβ
rrrm Li
Li
FBi .
Note that even in the “free banking” case the bank will not necessarily fully monitor
and reduce the probability of failure to zero. We can now calculate the default probability
of bank i, pi, by substituting equation (8) into (1)
(9) [ ]
−+−=−1
1
)(1
1β
ρβ
ρ rrrp Li
Lii
FBi .
As one would expect, this probability is independent of the government’s actions.
The probability of a bank’s failure is simply a function of the riskiness of its portfolio and
the pay-off to monitoring, as represented by the interest rate spread.
6 Any other strictly positive and convex function V(m) would yield qualitatively the same results.
10ECBWork ing Paper Ser ie s No . 302February 2004

Explicit deposit insurance
Next, consid������������ ������������������������������������� D=1 and B ∈ (0,1).
We allow for non-zero B to permit deposit insurance systems that credibly limit coverage
to depositors as well as deposit insurance systems, which are not credible in their
limitation to depositors, i.e. subordinated debt holders could be also bailed out with some
non-zero probability. In the following we refer to a system with a zero bail out probability
for subordinated debt holders as “credible deposit insurance.” The optimal level of
monitoring of a bank operating in a non-credible system becomes
(10) [ ] 1
1
* ))(1)(1(1 −
−−−+=β
γαρβ
rrrm Li
Bi
Lii
NCiDI
and
(11) [ ] 1
1
* ))(1(1 −
−−+=β
αρβ
rrrm Lii
Lii
CiDI
���������������������� ���� B=0.
Comparing (10) to (8) it is clear that for non-zero levels of deposits or a non-zero
probability of a bail out of subordinated debt holders, the optimal level of monitoring with
explicit deposit insurance will be less than in the “free banking case.” This is also
reflected in a higher probability of bank failure
(12) [ ]
−−−+−=−1
1
))(1)(1(1
1β
γαρβ
ρ rrrp Li
Bi
Liii
NCiDI
in case the system is not credible and
(13) [ ]
−−+−=−1
1
))(1(1
1β
αρβ
ρ rrrp Lii
Liii
CiDI ,
if it is credible. The default probability is strictly increasing with the likelihood that
subordinated debt holders are also compensated in case of a bank failure. More
interestingly, for 1<<Bγ , equations (12) and (13) show that the probability of bank
failure is also strictly increasing with the share of deposits in bank liabilities.
Implicit safety net
Now turn to the case with an implicit safety net. We define an implicit safety net as
an arrangement in which all creditors of a bank are bailed out in the case the bank fails
with some probability )1,0(, ∈SDγ , but there is no explicit deposit insurance. Hence, in
11ECB
Work ing Paper Ser ie s No . 302February 2004
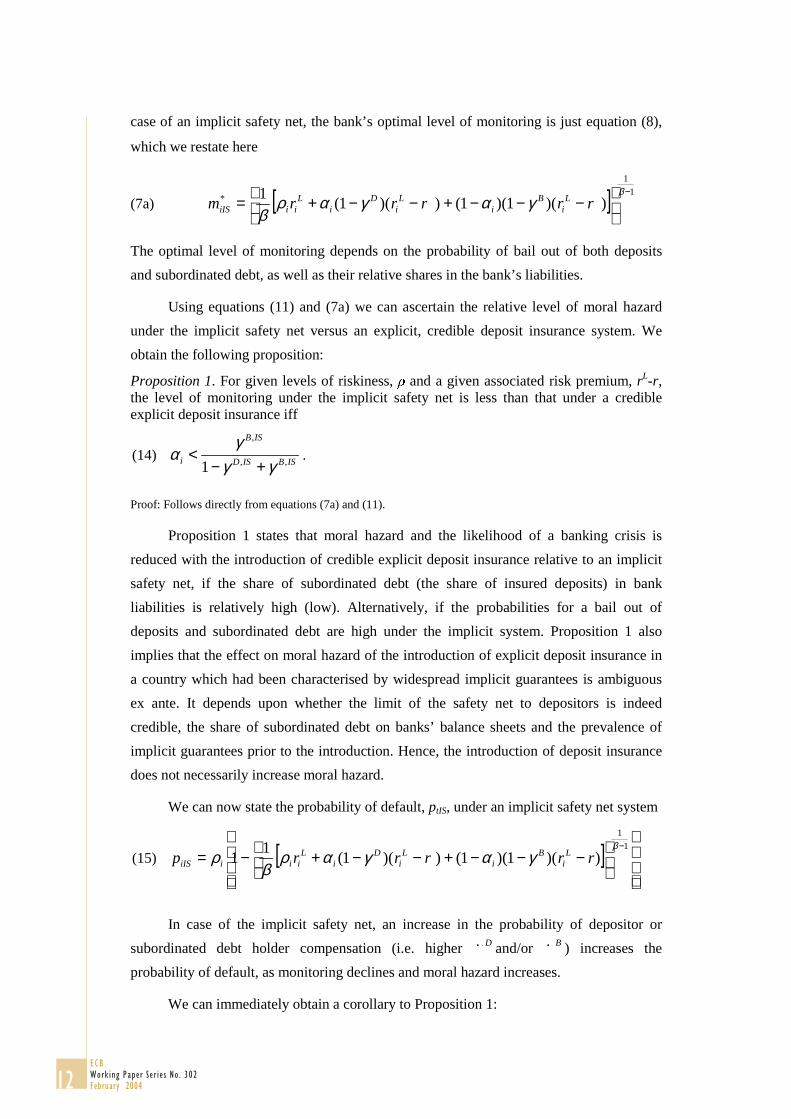
case of an implicit safety net, the bank’s optimal level of monitoring is just equation (8),
which we restate here
(7a) [ ] 1
1
* ))(1)(1())(1(1 −
−−−+−−+=β
γαγαρβ
rrrrrm Li
Bi
Li
Di
LiiiIS
The optimal level of monitoring depends on the probability of bail out of both deposits
and subordinated debt, as well as their relative shares in the bank’s liabilities.
Using equations (11) and (7a) we can ascertain the relative level of moral hazard
under the implicit safety net versus an explicit, credible deposit insurance system. We
obtain the following proposition:
Proposition 1. For given levels of riskiness, and a given associated risk premium, rL-r,the level of monitoring under the implicit safety net is less than that under a credibleexplicit deposit insurance iff
(14) ISBISD
ISB
i ,,
,
1 γγγ
α+−
< .
Proof: Follows directly from equations (7a) and (11).
Proposition 1 states that moral hazard and the likelihood of a banking crisis is
reduced with the introduction of credible explicit deposit insurance relative to an implicit
safety net, if the share of subordinated debt (the share of insured deposits) in bank
liabilities is relatively high (low). Alternatively, if the probabilities for a bail out of
deposits and subordinated debt are high under the implicit system. Proposition 1 also
implies that the effect on moral hazard of the introduction of explicit deposit insurance in
a country which had been characterised by widespread implicit guarantees is ambiguous
ex ante. It depends upon whether the limit of the safety net to depositors is indeed
credible, the share of subordinated debt on banks’ balance sheets and the prevalence of
implicit guarantees prior to the introduction. Hence, the introduction of deposit insurance
does not necessarily increase moral hazard.
We can now state the probability of default, ptIS, under an implicit safety net system
(15) [ ]
−−−+−−+−=−1
1
))(1)(1())(1(1
1β
γαγαρβ
ρ rrrrrp Li
Bi
Li
Di
LiiiiIS
In case of the implicit safety net, an increase in the probability of depositor or
subordinated debt holder compensation (i.e. higher Dγ and/or Bγ ) increases the
probability of default, as monitoring declines and moral hazard increases.
We can immediately obtain a corollary to Proposition 1:
12ECBWork ing Paper Ser ie s No . 302February 2004

Corollary 1. For given levels of riskiness, and a given associated risk premium, rL-r, theprobability of bank failure is higher under an implicit system than under credible depositinsurance iff
(14a) ISBISD
ISB
i ,,
,
1 γγγ
α+−
< ,
which is exactly the same condition as for proposition 1 and follows directly.
Corollary 1 states that under the condition that the limitation of the safety net to depositors
is in fact credible, a bank with a higher subordinated debt share should adjust its risk
taking more than a bank with a low subordinated debt share.
Charter values, “too big to fail” and balance sheet structure
We will now consider the effect of the existence of charter values for banks’ risk
taking under the different safety net arrangements. For that we modify the banks pay-off
structure as follows
(16) 0-Ci with a probability i(1–mi) and
(17) rtL +Ci with a probability (1– i) + mi i.
Ci represents a charter value, which should be interpreted as a fixed value of staying
in operation, arising from market power, reputation or other factors. We assume that
0<Ci<1. The bank will loose Ci if its loan portfolio defaults and retains this value if it
succeeds.7 With this modification, the bank’s maximisation problem becomes
(18) ( )( )[ ]
( ) ( ) ).1(,),(V
1))(1(
iB
iB
iiD
iD
ii
iL
iiiiiiii
mrmrm
CrmCm
αγαγρρρπ
−−−−
++−+−−=
Taking first order conditions and re-arranging yields the optimal level of monitoring
with charter values
(19) [ ] 1
1
* ))(1)(1())(1()1(1 −
−−−+−−+++=β
γαγαρρβ
rrrrCrm Li
Bi
Li
Diii
Liii
Comparing equation (8) to (19), one obtains Proposition 2
7 There are many other ways to model the presence of charter values. Generally, they require multi-period
models. To maintain simplicity, we have abstracted from these issues, as the question of how a chartervalue may arise is not the focus of this paper. For more discussion, see Boot and Greenbaum [1993],Matutes and Vives [1997] and most recently Pelizzon (2001).
13ECB
Work ing Paper Ser ie s No . 302February 2004

Proposition 2. For given levels of riskiness, � a given associated risk premium, rL-r, andgiven the safety net arrangements, the level of monitoring will be higher in the presence ofcharter values.
Corollary 2. Given some non-zero level of subordinated debt ( i<1), banks with highcharter values will adjust their monitoring (and risk taking) less than banks with lowcharter values in response to a shift from an implicit safety net to explicit depositinsurance.
Proof: We prove the Corollary by showing that with charter values less than 1, even if the banking system isfully insured, monitoring could be as high as in the free banking case. Suppose under the implicit safety net,
we have Dγ =
Bγ =1, i.e. the banking system is perfectly insured against default. Setting equation (19) equal
to equation (10) and solving for Ci we obtain .11
<+
−=i
Li
i
rrC
ρ
Corollary 2 gives us an important empirical prediction. Banks with high charter
values, as they have less incentives under the implicit safety net to take on excessive risk,
will reduce their risk taking less upon the introduction of a credible deposit insurance
system compared to banks with low charter values.
At this point, we are also in a position to discuss “too big to fail” in the context of
our model. “Too big to fail” simply suggests that Dγ = Bγ =1 for large systemic banks,
regardless of the safety net arrangements for all other banks. It is obvious that the optimal
level of monitoring will be
(20) [ ] 1
1
* 1 −
=β
ρβ
LiiiTBTF rm .
Hence, we can state Proposition 3:
Proposition 3. Banks that are “too big to fail” will not adjust their risk taking in responseto the introduction of credible explicit deposit insurance.
So far we have taken the balance sheet structure of banks as given, i.e. the share of
deposits i was exogenous. Relaxing this assumption yields the following additional
proposition:
Proposition 4: Suppose the bank chooses i first and mi only second. Then
if D> B the bank chooses i=1
if D< B the bank chooses i=0
if D� B the bank chooses ]1,0[∈α i .8
Proof: Follows immediately from (5).
Proposition 4 has an important empirical implication: If a country moves from an implicit
system, in which the probability of bail out for subordinated debt and deposits was equal
8� �!��� i all previous propositions and corollaries hold.
γ γ
14ECBWork ing Paper Ser ie s No . 302February 2004

or greater, to an explicit system in which the probability of depositor compensation is 1,
banks will adjust their balance sheet structures towards relying more heavily on insured
deposits.9
In summary, the model in this section shows that the effect of introducing explicit
deposit insurance on banks risk taking may be ambiguous ex ante and depends on
assumptions about the counterfactual to deposit insurance (no safety net vs. an implicit
safety net). The model yields a number of empirical predictions regarding moral hazard
and risk taking of banks. In Sections VII and VIII, we use a data set of European banks to
test for Propositions 1 and 2 as well as Corollaries 1 and 2, and for Propositions 3 and 4.
III. Institutional background
As we propose to test the model using European data, it may be useful to give some
background information on the regulatory environment in Europe. Banking deregulation
in Europe began in the late 1970s and continued through the early 1990s, with significant
differences in the timing and speed of the process across countries (Canals [1993]). With
few exceptions, regulations on banks’ competitive conduct have now largely been
eliminated. These regulations included controls on banks’ deposit and lending rates, fees
and commissions, as well as direct credit quotas and branching limitations. Functional
separation of financial institutions, if it existed, has generally ceased. There was a shift in
regulatory thinking from conduct regulations towards the use of prudential regulations
(capital adequacy, exposure concentration limitations), freeing competition and abolishing
regulatory protection of national markets. However, some country specific distortions
remain, mainly related to taxation and subsidies, but they distort banking markets to a
much more limited extent than in the past. While conclusive empirical evidence is still
outstanding, the result of deregulation is generally believed to be a sharp increase in
banking competition.
European Community legislation, primarily since the White Paper of 1985
“Completing the Internal Market”, has significantly contributed to this process and has
provided incentives for national legislators to deregulate and streamline banking
legislation. The most important piece of Community legislation was the 2nd Banking Co-
ordination Directive (89/646/EEC) leading to unification of the regulatory framework for
“entry control” and cancelling the major elements of national separation of markets in
legal/regulatory terms. The Directives on banks’ own funds (89/299/EEC) and required
9 Clearly, we do not observe banks fully financed with either subordinated debt or insured deposits; ratherbanks tend to use a combination of both. One simple way to reconcile this stylised fact with our model wouldbe to introduce some fixed supply of insured deposits (as deposit insurance is limited to some amount perdepositor).
15ECB
Work ing Paper Ser ie s No . 302February 2004
solvency ratio (89/647/EEC) were adopted within the same time frame. However, these
regulations in effect extended the scope of the 1988 Capital Accord of the Basel
Committee on Banking Supervision issued for internationally active banks to all banks in
the EU. The Basel Accord meant on one hand an important change in banking regulation
away from intrusive conduct regulations towards greater reliance on prudential standards.
On the other hand, it introduced more stringent capital requirements, which may have
influenced banks’ risk taking. We will use in the empirical analysis the implementation of
the 2nd Banking Directive as a summary proxy for the “ultimate” deregulation process,
while recognising that significant aspects of deregulation affecting banking competition
and banks’ risk taking incentives took place also before the implementation of this
Directive.
Central in the context of this paper a Directive on Deposit Guarantee Schemes
(94/19/EC) was issued, in order to support the orderly functioning of banking markets
under the liberalised environment. It set the minimum formal deposit guarantee at 20 000
euro.10 At the time of the directive, four EU countries did not have explicit deposit
insurance: Finland, Greece, Portugal and Sweden. Greece and Portugal introduced deposit
insurance in 1996, Sweden in 1997 and Finland not until 1999.11 We use this cross-
country and time series variation in the econometric analysis below to identify the effects
of deposit insurance on bank behaviour. None of the EU schemes guarantee interbank
deposits and all have limits of the coverage per depositor (Appendix I). Other debt
instruments issued by banks are all outside the scope of the coverage, while some schemes
may provide a limited coverage.
IV. Data sources and description
The data used in this study were obtained from a number of different sources. The
balance sheets and the income statements of EU banks are from the Fitch-IBCA
Bankscope data set, which contains balance sheet data for a wide variety of European
banks. We used consolidated balance sheets, supplemented by unconsolidated balance
sheets for banks, which did not have consolidated data in Bankscope and did not have
significant subsidiaries. We retained those banks for which we could ascertain market
values using Datastream, as market values are necessary to calculate our measure of
charter value, q and which existed under the same name throughout the sample period.12
10 This was required to exist in all EU Member Countries by 1 July 1995. A limitation to Ecu 15,000 waspossible until 31 December 1999.11 Belgium, Ireland, Luxembourg and the Netherlands had a coverage lower than 20 0000 euro before theDirective.12 This implies that some banks in the sample may have taken over smaller banks during the sample period.
16ECBWork ing Paper Ser ie s No . 302February 2004

This process yields a sample of 128 banks for 1991-1998. A few of the banks recorded by
IBCA only report partial information on important data items. We used lagged variable
regression or bank-specific means to impute these missing values. We also excluded 1991,
as in Bankscope no information was available for all French banks and a large number of
Italian banks, and we wanted to keep these important banking markets in the sample. The
end result is a balanced panel containing 128 banks with data from 1992 to 1998 and a
sample size of 896 observations. We supplemented this bank specific information with the
stock market index for the country of origin of the bank, which we also obtained from
Datastream. Datastream also provided us with the inter-day volatility of share prices,
which we use in the risk equations. Other financial variables collected are 10-year
Government bond yields as a measure of the long-term nominal interest rate and the
money market rate as a nominal short-term interest rate. The rates were obtained from the
IMF’s International Financial Statistics.
The resulting sample contains data for banks in all 15 EU countries (Table 1). The
composition by country broadly corresponds to market size with the exception of the UK
and Sweden, for which market values for banks were difficult to obtain in Datastream.
Table 2 gives some descriptive summary statistics for the banks in the sample. The banks
are relatively large, the average total assets is $48 billion. The banks, hence, are
approximately seven times the average size of all EU banks in the Bankscope. We
attribute this size difference to our requirement that the banks be traded at a stock
exchange. The sample banks represent approximately one sixth of the total assets of the
EU banking sector.
The banks in our sample quite accurately reflect the some of the stylised facts in
European banking. For example, while the overall mean of the share of non-interest
earnings in total earnings is 32.5 percent, this share has continuously increased from 27
percent in 1992 to 38 percent in 1998. Interestingly this is not reflected in the share of
loans in total assets, which has remained approximately constant around the overall
sample mean of 55 percent.
V. Definitions of dependent and independent variables
We are particularly interested in the effect of deposit insurance on bank behaviour.
Given the cross-sectional and time series variation in deposit insurance in EU countries
we are able to explicitly control for the effect of the existence of deposit insurance. We
create an indicator variable, which is equal to one when no system is in place, which was
the case in Greece, Portugal until 1995, for Sweden until 1996 and for Finland for the
entire sample period. We also created an indicator capturing differences in deposit
insurance coverage. The indicator equals one when coverage is extraordinarily high (Italy
17ECB
Work ing Paper Ser ie s No . 302February 2004

and France, which had coverage levels of 6 to 12 times the sample average, respectively
and Germany, where the coverage is limited only by the book value of capital of the
bank). Details on the coverage of EU deposit insurance schemes, as well as other details
are given in Appendix I. Finally, in order to measure the impact of deregulation, we
created an indicator, which reflects the implementation date of the Community legislation
through the 2nd Banking Co-ordination Directive. The indicator equals one after the actual
implementation date and implies that we model the liberalisation based on the Directive as
a structural shift.13
A bank’s charter value can be defined as the present value of the stream of profits
that it expects to earn when staying in business. Hence, the charter value would equal to
the market value (present value of the future expected earnings/dividend) of its assets
minus the replacement cost of the bank, i.e. the expense of rebuilding the existing bank
from scratch (Demsetz et. al. [1996]). The market value is set to equal the market value of
equity (E) (stock price times the amount of equities outstanding) plus the book value of
banks’ liabilities (L). This is reasonable, since the value of going concern would be
reflected in the market value of the equity, as the equity holders would be the
beneficiaries, not the debt holders. The replacement cost of a bank is simply the book
value of its assets (A). Hence, the charter value (CV), which is divided by the book value
of assets in order to obtain a scale-free measure, can be expressed as:
(21)A
ALE
A
CV −+= .
Adding 1 and simplifying gives Tobin’s q, which in the following will be used as a
proxy for a bank’s charter value:
(22)A
LEq
+= .
This measure is also used by Keeley [1990] and Demsetz et. al. [1996]. For a bank
with pricing power in loan, deposit or other markets, the market value of assets (E+L)
would exceed their book value (A), and q would exceed one. In equilibrium q would
exactly equal one for an uninsured bank with no pricing power.
The measure q as a proxy for charter value has the advantage of permitting
comparability across different bank sizes. Furthermore, it directly reflects the extent of
monopoly rents earned by banks due to pricing power. Smirlock [1984] argues that
13 Note that even though the Directive was passed at the European level, the implementation dates vary in the
individual countries: The Netherlands and Sweden (1991), UK (1992), France, Germany, Portugal,Greece, Ireland and Italy (1993), Austria, Belgium, Finland and Luxembourg (1994), Spain (1995), andDenmark (1996).
18ECBWork ing Paper Ser ie s No . 302February 2004
because q relates the market value of banks’ assets to their current cost, it is an ideal “all-
in” measure of the rents. Any pricing power, irrespective of its source, would be reflected
in the market value of banks’ equity, and thus assets, but not in the cost of acquired assets.
This circumvents also the significant measurement problems in trying to proxy the extent
of pricing power through interest rates charged by banks for loans and deposits, and even
more so through accounting-based measures of margins which can be driven by many
auxiliary factors and accounting peculiarities.14
In the regression analysis we also utilise balance sheet ratios to control for bank
specific differences, including the share of deposits in total liabilities, the share of non-
interest earnings in total earnings, and the share of loans in total assets. The share of non-
interest income in total income was included to measure the bank’s willingness and ability
to diversify into non-lending, non-traditional activities, such as underwriting and to some
extent will also proxy for the bank’s “innovation ability.” In the relationship between
moral hazard and deposit insurance the monitoring of uninsured debt-holders may be quite
important, as discussed in Section II. Therefore, we included the share of subordinated
debt in total liabilities as an independent variable. In the European context, with
significant differences in the size of countries’ economies, we use the share of the bank’s
total assets in the total assets of the country’s banking system to control for the “too-big-
to-fail” effects on charter value and risk taking.
Further, we include a normalised country specific stock market index15, money
market rates and a measure of the steepness of the yield curve, which we defined as the
difference between money market rates and 10-year government bond yields. Finally, not
all banks in the sample were commercial banks. We also had a limited number of co-
operative banks and mortgage banks, which might experience valuations that are quite
different from those of commercial banks. Specialised banks or banks with a somewhat
different organisational form might face different constraints, as well as pursue different
objectives relative to commercial banks.16 For definitions of all variables see Appendix II.
14
A problem may arise in using q as a measure of banks’ rents (or charter value), as the book value of assetsreflects historical costs, rather than current costs of the assets. Therefore, ex post q may diverge from 1 simplybecause asset return realisations may have been different from expectations, rather than as a reflection ofmarket power. Hence, the theoretically correct ex ante q is measured with error when using the ex post q. Onecould also argue that q and risk taking may be simultaneously determined. This would suggest an instrumentalvariable approach. We experimented with a number of instruments, but were unable to find one with aneconomic justification.15 The respective stock market indices were normalised, such that for all countries 1991=100. This will ensurecomparability across countries.
16 With few exceptions, our choice of control variables corresponds closely to those of Keeley [1990].
19ECB
Work ing Paper Ser ie s No . 302February 2004
VI. Econometric model and baseline results
We estimate the following reduced form model:
(23) ε++Π+Π+δ+δ= iitjtitjt uCXDrisk 2110 ,
where riskjt represents a measure of riskiness for bank j at time t, Dit represents a set
of indicator variables describing the deposit insurance system and the degree of
deregulation in country i at time t, Xjt represent a set of control variables unique to bank j
at time t, and Cit are country specific control variables. Equation (23) is estimated using
country-specific fixed effects in order to control for country specific differences, which
are unaccounted for in the control variables. These country specific effects pick up any
other policy differences across countries, which are not included explicitly in the set of
control variables (such as taxes and any remaining differences in national banking
regulations). The different measures of bank risk are discussed below.
In line with the theoretical literature (e.g. Matutes and Vives [1995]), we distinguish
between the three different types of risk: leverage risk, asset risk and overall bank risk.
Leverage risk is defined as the book value of debt divided by the market value of assets
(the market value of equity plus the book value of liabilities). It measures the degree of
gearing of the bank; the more highly geared a bank is, the riskier it, as its cushion against
an unexpected deterioration in the quality of its assets is smaller than in a less leveraged
bank. Higher gearing may also reflect a readjustment in the balance structure towards
deposits (Proposition 4). Our second measure of risk, asset risk, is approximated by using
the share of problem loans in total assets. Finally, we use the inter-day volatility of the
bank’s share price, corrected for the market component as a measure of the overall risk of
the bank. We defined the volatility as
(24) Sdtj [Ln [pd/pd-1]]* n .
for any year t and bank j, where pd represents the stock price on day d, n represents
the number of trading days and Sd is the standard deviation of the daily stock price during
period t. From (24) we extracted the non-diversifiable component. This was done, as we
were concerned that our measure of overall risk may be driven by the volatility of the
market portfolio rather than by non-diversified risk. Hence, we estimated a standard
market model and calculated the standard deviation of the residuals, which gives us a
measure of idiosyncratic volatility. For the details of the calculation see Appendix III.
All three measures suffer from shortcomings. In particular, our measure of leverage
would benefit from a market-based measure of liabilities, which we did not have access to.
The measure of asset risk is backward looking, not a measure of current risk, as default or
payment difficulties of the clients of a bank will only appear in our measure with a lag.
For example, the bank may extend further loans, which enable its troubled customer to
20ECBWork ing Paper Ser ie s No . 302February 2004

remain current on the initial credit. And third, differences in inter-day volatility may not
only reflect the riskiness of a bank, but also the liquidity depth of the market for its shares,
although we would consider this problem to be relatively small given the size of the banks
in our sample.
The baseline estimates for the relationship between risk and deposit insurance are
presented in Table 3. Table 3 shows that banks tend to reduce their risk taking for two of
the three measures of risk in response to the introduction of explicit deposit insurance.
Conflicting evidence is provided by the third measure: Leverage risk tends to increase
with explicit deposit insurance. This is weak evidence in favour of Proposition 4; namely
that banks increase their share of insured deposits when explicit deposit insurance is
introduced. In the next section, we will present evidence, which more directly addresses
this issue. For asset risk and overall risk, the absence of explicit deposit insurance is
associated with significantly higher risk taking.17
The effects of the 2nd Banking Directive on risk taking appear to have been mixed.
We find a weakly positive effect on leverage and asset risk. Overall risk, as measured by
the idiosyncratic stock price volatility, is lower after the implementation of the directive,
which we interpret to reflect the tighter solvency standards associated with the directive.
Now turn to the effect of changes in the charter value (q) on risk taking. As argued in the
literature, banks with higher charter values tend to exhibit lower levels of leverage and
overall risk (Proposition 2). 18
The estimates for the control variables largely conform to expectations. For
example, banks with a higher proportion of loans in their portfolios have also a higher
proportion of problem loans and, hence, more asset risk, but generally are not riskier
overall. Banks with a higher share in the total assets of the banking system in their country
are more highly leveraged, but also not riskier overall. This suggests that these banks may
be better diversified and, hence, hold less capital. We find some evidence that
subordinated debt holders are able to exert influence on the risk taking of banks (corollary
1). The coefficient has the expected significantly negative sign for overall risk.
Interestingly, it is positive for leverage risk, suggesting some substitution of tier 1 (equity)
and tier 2 (subordinated debt) capital. We provide further evidence on the question of
subordinated debt holder monitoring below.
17 Higher coverage is not associated with an effect on banks’ risk, which is consistent with our argument thatwhat matters is not the characteristics of the scheme, but rather its existence in the sense of leaving somecreditors of the bank uncovered altogether.18 This is consistent with the previous empirical literature using US data (e.g. Keeley [1990], Demsetz et.al.[1996], Grossman [1992], McKenzie et. al. [1992], Brewer and Mondschean [1994]) and Furlong and Keeley[1989]).
21ECB
Work ing Paper Ser ie s No . 302February 2004

Ex ante, we had no strong priors on the effects of market conditions on risk taking.
A high stock market may suggest a favourable economic environment and, hence, would
be associated with lower risk of banks’ portfolios. This is reflected in the significantly
negative coefficient of the stock market index on asset risk. However, we also find that
leverage and stock price volatility increase when stock markets are high. Similar
arguments apply to the effects of interest rates.
While we have taken care to use a number of different measures of bank risk and
found sensible results across all measures, we were concerned that the results may tell us
little about the effect of deposit insurance, but rather highlight differences in countries
unrelated to deposit insurance. Recall that the group of countries without deposit
insurance includes Finland (throughout the sample period), Greece, Portugal (until 1995)
and Sweden (until 1996). We considered the possibility that coefficient on the dummy on
the absence of explicit deposit insurance simply measures that these countries are different
from the remainder of the sample for reasons completely unrelated to deposit insurance.
For example, both Finland and Sweden experienced banking crises at the beginning of our
sample period; it is possible that this may be driving our results.19 Regarding Greece and
Portugal, we were concerned that our results could reflect the fact that the banking sector
in these countries may have been less developed or otherwise dissimilar from the “core”
EU countries. The country differences might also reflect differences in intensity of bank
regulation and supervision, which are unrelated to deposit insurance and the country
effects are too crude a measure to pick up these differences.
In order to address these concerns, we have taken two complementary approaches.
One, we interact the deposit insurance indicator with bank specific characteristics, such
that the effects of deposit insurance are identified using bank characteristics, rather than
country characteristics. And second, we limit our sample to the countries that at some
point did not have explicit deposit insurance (Finland, Sweden, Portugal and Greece) and
estimate the effects of the introduction of explicit deposit insurance relying largely on
time series evidence.
19 Note, however, that we could argue that it may not be a coincidence that banking crises occurred in twocountries without deposit insurance. This is the opposite point of the one in Demirgüç-Kunt and Detragiache[2002].
22ECBWork ing Paper Ser ie s No . 302February 2004

Identification using bank characteristics
First consider the following indicators, which we interact with the “no deposit insurance”
indicator:
• A set of indicators, which distinguish between banks with subordinated debt shares
above and below the median of the distribution, which permits us to test for
Corollary 1. The share of subordinated debt is used as a proxy for uninsured debt
more generally, as we were able to measure it more accurately than the other debt
categories.
• A set of indicators, which distinguishes between banks with high charter values
(charter values greater than 1) and other banks. This would allow testing for
Corollary 2.
• A set of indicators, which distinguish banks, based on their relative size in the
banking system. We set the cut-off point at banks with more than 12 percent of the
total assets of a banking system in their country of incorporation, which represents
the 90th percentile of the distribution. The failure of banks with such a high share in
the total assets of the banking system would clearly represent a systemic risk to the
banking system as a whole. Hence, this distinction allows us to test Proposition 3.
Table 4 displays the results for this exercise. We have limited the table to the
interaction terms, as they are of particular interest.20 Consider first the interaction terms
with subordinated debt. We find evidence in favour of the notion that subordinated debt
may act as market-based limit to moral hazard and excessive risk taking of banks
(Corollary 1). For asset risk and overall risk, banks with higher subordinated debt shares
reduce their risk taking more than those with lower subordinated debt shares and the
difference is significant at the 5 percent level in the case of asset risk (and marginally
significant at the 10 percent level for overall risk). This finding is especially striking as we
find further evidence for Proposition 4, namely that banks have increased their leverage in
response to the introduction of explicit deposit insurance (see below). It also further
corroborates the notion that explicit deposit insurance was credible at limiting insurance to
depositors. Second, for the charter value/no deposit insurance interaction terms, we find
support for Corollary 2. In case of asset and overall risk banks with high charter values do
not adjust their risk taking downwards in response to the introduction of deposit insurance
and banks with low charter values do. For asset risk, we can reject that the two
coefficients are equal at the 5 percent confidence level. Higher charter values act as
20 The coefficients on all other variables are robust to the introduction of these interaction terms. The
complete results are available from the authors upon request.
23ECB
Work ing Paper Ser ie s No . 302February 2004

deterrence against additional risk taking (albeit not against higher leverage), regardless of
the safety net arrangements in place.
Finally, we also find support for Proposition 3, namely, that banks, which constitute
a particularly large share of the banking system in a given country, do not adjust their risk
taking. The coefficients are statistically significantly different at the five- percent level for
overall risk. We interpret this finding as evidence that “too big to fail” has remained a
relevant issue before and after the introduction of explicit deposit insurance and further
that the limit of the safety net to depositors is only credible for smaller banks.
These findings deserve some further discussion. They suggest that the regime prior
to the introduction of deposit insurance was not characterised by the absence of any safety
net, but the presence of a broad and implicit one. In this case, the establishment of explicit
deposit insurance limits the scope of the safety net and reduces moral hazard, since, first,
explicit deposit insurance typically leaves out large depositors, as the coverage per
depositor is limited. Second, the coverage is limited to depositors only, leaving out other
creditors altogether. All these aspects generally are true for the deposit insurance systems
in the EU (see Appendix I). Hence, our results would suggest that the counterfactual that
has been assumed in the empirical literature, namely that, in the absence of explicit
deposit insurance, banks operate in a completely uninsured environment, may be flawed,
at least in the context of developed economies.21
Economically, the effects are quite substantial. For example, upon the introduction
of deposit insurance, banks with high shares of subordinated debt (low charter values)
tended to have three percent (two percent) less problem loans on their books compared to
under the no-deposit insurance case. Similarly, the idiosyncratic stock price volatility is
20 percent (25 percent) lower. For banks, which we do not classify as “too big to fail”, we
also find that stock price volatility is 25 percent lower after the introduction of deposit
insurance compared to before.
Identification using time series variation
Recall that we have both cross sectional as well as time series variation in the
existence of deposit insurance. Hence, we can limit our sample to those countries that at
some point during the sample did not have explicit deposit insurance. In this case the
effects of explicit deposit insurance would be identified largely through time series
effects, reducing concerns that the results are driven by other cross-sectional differences
21 If a reform establishing an explicit deposit insurance scheme coincides with improvements in supervisionor more stringent disclosure requirements (heightened market discipline), the reduction in risk taking could beattributed to these factors rather than the limitation of the safety net. However, developments in supervisionand market disclosure have not been in Europe directly related to the changes in the deposit insurancearrangements.
24ECBWork ing Paper Ser ie s No . 302February 2004

across countries unaccounted for by the control variables. The results for this exercise are
presented in Table 5. We limit ourselves to present results for the preferred measure of
risk, overall risk. Notice that this reduces the sample size to 56 observations. Even so, we
find consistent evidence that the introduction of deposit insurance has reduced risk taking
by banks. Further, when interacted with bank characteristics, our main findings go
through. Banks with higher subordinated debt shares and that are not “too-big-to-fail”
adjust their risk taking more than other banks, in line with the predictions of the
theoretical model (Propositions 1 and 3). The evidence on charter values is weaker,
however.
VII. Banks’ balance sheet structure
While the above evidence is suggestive that the effect on risk taking is somewhat
mitigated by banks’ move towards more insured liabilities (given the increase in leverage
subsequent to the introduction of explicit deposit insurance), we would like to examine
Proposition 4 and estimate (insured) deposit share equations. Hence we estimate
(25) 22110 ε++Η+Η+γ+γ= iitjtitjt uCXDIDS ,
where IDSjt represents the share of insured deposits in bank j’s liabilities in period t. All
other symbols are defined as before. Given that we are estimating a quantity equation, we
need proxies for the own price (i.e. the price of deposits) and the price of substitutes. As
we do not have access to bank specific interest rates, we use the money market rate as the
price of deposits and the bond yield as the price of a substitute. Deposit rates tend to
follow short-term money market rates as they are often priced at a margin below banks’
prime rates (which follow the money market rates with some lag). The bond yield can be
used as a proxy of the return on alternative investments by household investors, which in
the EU consist of bonds to a large extent. Further, the share of insured deposits is not
directly observable. We use the share of total deposits minus the share of interbank
deposits, as in all EU deposit insurance schemes they are excluded from coverage.
However, in most cases foreign currency deposits are also excluded and all schemes have
a ceiling (except Germany) per depositor. Unfortunately, we do not have information on
foreign currency deposits and due to the ceiling our measure of insured deposits will
overstate their true share. These caveats should be kept in mind when considering the
results from estimating equation (25).22
The results, presented in Table 6, suggest that indeed banks may have shifted their
liabilities towards more insured deposits in response to introducing explicit deposit
22 There are also important issues in relation to the identification of loan demand and supply, which we leave
unresolved here. Equation (26) should be viewed as a reduced form estimating equation.
25ECB
Work ing Paper Ser ie s No . 302February 2004
insurance. The coefficient on the absence of deposit insurance is negative and significant
in the full sample, as well as when we limit the sample to those countries, which at some
point did not have explicit deposit insurance. The finding is even more striking as insured
deposits are measured with some error here and underlines the finding earlier that even
given this shift, risk taking diminished with explicit deposit insurance. One might ask why
didn’t banks shift their liability structure entirely towards insured deposits. There are a
number of answers to this question, which lies outside the scope of this paper, but most
straightforwardly, insured deposits may be in limited supply, given that explicit deposit
insurance schemes typically only insure a fixed amount per depositor. In addition, interest
rates on insured deposits, which we only capture in a rudimentary way here, may adjust,
offsetting the advantage due to insurance.
The other coefficients conform to expectations. The coefficients on the money
market rate (which serves as the proxy for the own interest rate) is positive and highly
significant, suggesting that supply effects dominate. Consistent with this finding, the rate
on the alternatives, bonds and the stockmarket, show a negative effect on the share of
deposits. Further, banks with higher loan shares in their assets also have higher deposit
shares in their liabilities, larger banks tend to finance themselves less with deposits and,
finally, specialised lending institutions and mortgage banks have lower shares of deposits
than commercial banks (the omitted category).
VIII. Robustness
We performed a number of additional robustness checks. One, charter values (q)
and risk taking of banks may be simultaneously determined (see e.g. Keeley [1990]).
However, we were unable to obtain an instrument with an economic justification for why
it was related to charter values and orthogonal to risk. Hence, we experimented with
models identified through country specific effects and used q lagged by one period. The
results are reported in Appendix IV.1 and suggest that there may be some simultaneity
problems in relation to leverage risk. Recall that q is defined as the market value of assets
divided by the book value and we measure leverage ratio by calculating the debt equity
ratio as the book value of debt divided by the market value of equity plus the book value
of debt. The market value of equity enters both definitions (once in the numerator and
once in the denominator) and consequently market movements may spuriously generate a
high negative correlation. Using country specific effects to identify the instrumental
variable model resolves this problem. The estimated coefficients for our central variable
of interest, namely the variable indicating the absence of explicit deposit insurance, are
unchanged for asset and overall risk. The same is true for the results with the interaction
terms (Appendix IV.2).
26ECBWork ing Paper Ser ie s No . 302February 2004
Second, we considered the possibility that a more sophisticated error structure may
be more appropriate in our measure of overall risk, for example to allow for persistence in
stock price volatilities. We experimented with an autocorrelated error structure of up to 6
lags and also estimated generalised linear models with stationary, unstructured and non-
stationary correlation matrices. All specifications yielded quite consistent results and are
available from the authors upon request.
Third, we report results from OLS regression using bank averages in Table 7. We
calculated variable averages for each bank and fitted an OLS model to this data. The
objective is to address potential mismeasurement through mergers or acquisitions during
the sample period. The approach minimises not the overall squared differences, but the
cross-sectional squared differences. We limit ourselves to reporting results for our
preferred measure of risk, overall risk. Note that the sample sizes are reduced to 73 (the
number of banks for which we were able to calculate overall risk). We find consistent
results, suggesting that our results are unlikely to be significantly affected by distortions
due to mergers.
IX. Conclusion
This paper analysed the relationship between deposit insurance, bank charter
values, debt-holder monitoring, and risk taking for European banks. Utilising cross-
sectional and time series variation in the existence of deposit insurance schemes in the
EU, we find that the establishment of explicit deposit insurance may significantly reduce
the risk taking of banks. We draw two conclusions from this finding. One, in the absence
of deposit insurance, European banking systems may have been characterised by strong
implicit insurance operating through the expectation of public intervention at times of
distress. And second, the introduction of an explicit deposit insurance system may imply a
de facto reduction in the scope of the safety net and enable authorities to credibly exclude
some creditors of the bank from the safety net. Our findings generally support the idea that
explicit safety net arrangements are more “incentive-compatible” than the implicit ones,
representing a vague but ex ante unlimited commitments by the government to intervene
and protect banks’ claim-holders. The government may not be able to eliminate the safety
net altogether and credibly commit not to intervene under times of distress. We find this
despite some tendency of banks to increase their financing with insured deposits, when
explicit deposit insurance is introduced.
We have stressed in our analysis that the limit to the safety net has to be credible for
deposit insurance to have a “beneficial” effect. The credibility of the system may hold the
key to reconciling the evidence presented in this paper with some of the evidence in the
previous literature, which tended to find that deposit insurance increases moral hazard.
27ECB
Work ing Paper Ser ie s No . 302February 2004

The previous literature which found that the existence of deposit insurance increase banks’
risk taking, largely used data from developing or emerging markets, e.g. Demirgüç-Kunt
and Detragiache [2000], or historical data sets from the 1920s as in Grossman [1992] or
Wheelock [1992]. It is plausible that weaker institutional structures (for example
concerning the liquidation regimes for banks), or the non-existence of liquid markets for
banks’ liabilities, as for example in emerging markets, make a limitation to the safety net
less credible. Under these circumstances, “constructive ambiguity” could be a better
solution to containing moral hazard. In addition, in countries with underdeveloped
subordinated debt markets, subordinated debt holders or other uninsured bank creditors
may not be able to perform the monitoring role that would have the risk reducing effect on
banks in the presence of deposit insurance. Clearly, in those countries deposit insurance
may have quite different effects from those shown in this paper.23
The evidence should also be viewed as supportive of the notion that creditors are
able not only to effectively monitor banks, but also to impose discipline on at least some
banks. However, the results also point to the fact that market monitoring may be
inadequate for large, systemically important banks as their creditors (this includes
subordinated debt holders) expect that authorities will not let those banks fail in any event
(“too big to fail”).
23 Some evidence of functioning equity and debt markets is given in Gropp et al. [2002] and Sironi [2002],
while Gropp and Richards [2001] find evidence that while equity markets may reflect risk, subordinateddebt in Europe may do so insufficiently.
28ECBWork ing Paper Ser ie s No . 302February 2004
Literature
Alston, L., A. Grove, and D. Wheelock [1994] “Why Do Banks Fail? Evidence from the1920s” Explorations in Economic History 31(4), pp. 409-431.
Boot A. and S. Greenbaum [1993] “Bank Regulation, Reputation and Rents: Theory andPolicy Implications” Mayer,-Colin; Vives,-Xavier, eds. Capital Markets andFinancial Intermediation. Cambridge; New York and Melbourne: CambridgeUniversity Press, pp. 262-285.
Brewer, E. and T. Mondschean [1994] “An Empirical Test of the Incentive Effects ofDeposit Insurance: The Case of Junk Bonds at Savings and Loan Associations”Journal of Money, Credit, and Banking 26, pp. 146-64.
Calomiris, C. and C. Kahn [1991] “The Role of Demandable Debt in Structuring OptimalBanking Arrangements”, American Economic Review, pp. 497-513.
Calomiris, C. [1999] “Building an Incentive-compatible Safety Net”, Journal of Bankingand Finance, 23, pp. 1499-1519.
Canals, J. [1993] Competitive Strategies in European Banking, Calarendon Press,Oxford.
Cordella, T. and E. Yeyati [1998] “Financial Opening, Deposit Insurance and Risk in aModel of Banking Competition”, IMF Working Paper No WP/98/97.
Demirgüç-Kunt, A. and E. Detragiache [2002] “Does Deposit Insurance Increase BankingSystem Stability? An Empirical Investigation”, Journal of Monetary Economics 49pp. 1373-1406.
Demsetz, R., M. Saidenberg and P. Strahan [1996] “Banks with Something to Lose: TheDisciplinary Role of Franchise Value”, Federal Reserve Bank of New YorkEconomic Policy Review 2, pp. 1-14.
Dewatripont M. and J. Tirole [1993a] “Efficient Governance Structure: Implications forBanking Regulation” Mayer,-Colin; Vives,-Xavier, eds. Capital Markets andFinancial Intermediation. Cambridge; New York and Melbourne: CambridgeUniversity Press, pp. 12-35.
Dewatripont M. and J. Tirole [1993b] The Prudential Regulation of Banks, EditionsPayot, Lausanne.
Diamond D. and P. Dybvig [1983] “Bank Runs, Deposit Insurance and Liquidity”Journal of Political Economy Vol. 91, pp.401-409.
Freixas X. and J. Rochet [1997] Microeconomics of Banking, The MIT Press,Cambridge.
Furlong, F. and M. Keeley [1987] “Bank Capital Regulation and Asset Risk”. EconomicReview, Federal Reserve Bank of San Francisco, pp. 20-40.
Furlong, F. and M. Keeley, [1989] “Bank Capital Regulation and Risk Taking: A Note”Journal of Banking and Finance Vol.13, pp.883-891.
Garcia, G. [1999] “Deposit Insurance: A Survey of Actual and Best Practices”, IMFWorking Paper.
Gorton G. and G. Pennacchi [1990] “Financial Intermediaries and Liquidity Creation”,Journal of Finance, pp. 49-71.
29ECB
Work ing Paper Ser ie s No . 302February 2004

Gropp, R. and A. Richards [2001] “Rating Agency Actions and the Pricing of Debt andEquity of European Banks: What Can We Infer about Private Sector Monitoring ofBank Soundness?” Economic Notes 30(3) pp. 373-398.
Gropp, R., J. Vesala and G. Vulpes [2002] “Equity and Bond Market Signals as LeadingIndicators of Bank Fragility” ECB Working Papers No 150, June.
Grossman, R. [1992] “Deposit Insurance, Regulation, and Moral Hazard in the ThriftIndustry: Evidence from the 1930s”, American Economic Review Vol. 82, pp. 800-821.
Kane, E. [1989] The S&L Mess: How Did It Happen? Urban Institute Press.
Karels, G. and C. McClatchey [1999] “Deposit Insurance and Risk-Taking Behavior in theCredit Union Industry”, Journal of Banking and Finance 23(1), pp. 105-134.
Keeley, M. [1990] “Deposit Insurance, Risk, and Market Power in Banking” AmericanEconomic Review Vol. 80, pp. 1183-1200.
MacKinlay, C. [1997] “Event Studies in Economics and Finance” Journal of EconomicLiterature 35, pp. 13-39.
Matutes, C and X. Vives [1995] “Imperfect Competition, Risk Taking, and Regulation inBanking”, European Economic Review, Vol. 44, 1-34.
McKenzie, J., R. Cole and R. Brown [1992] “Moral Hazard, Portfolio Allocation, andAsset Returns for Thrift Institutions”, Journal of Financial Services Research 5, pp.315-339.
Merton, R. [1977] “An Analytical Derivation of the Cost of Deposit Insurance LoanGuarantees”, Journal of Banking and Finance 1, pp. 3-11.
Pelizzon, L. [2001] “Franchise Value, Capital Requirements and Closure Rules in aDynamic Model of Bank Portfolio Management” Mimeo, University of Padoa.
Rajan, R. [1992] “Insiders and Outsiders: The Choice between Informed and Arm’s-length Debt”, Journal of Finance 47, pp. 1367-1400.
Sharpe, S. [1990] “Asymmetric Information, Bank Lending and Implicit Contracts: AStylized Model of Customer Relationships”, Journal of Finance 45, pp. 1069-1087.
Sironi, A. [2002] “Testing for Market Discipline in the European Banking Industry:Evidence from Subordinated Debt Spreads”, Board of Governors of the FederalReserve System, Finance and Economics Discussion Series, No. 2000-40 (July).
Smirlock, M. [1984] “Tobin’s q and the Structure Performance Relationship”, AmericanEconomic Review 74, pp. 1051-60.
Thies, C. and D. Gerlowski [1989] “Deposit insurance; A history of failure”, CatoJournal, 8(3), 677-693.
Wheelock, D. [1992] “Deposit Insurance and Bank Failures: New Evidence from the1920s”, Economic Inquiry 30(3), pp. 530-543.
Wheelock, D. and P. Wilson [1994] “Productivity Changes in U.S. Banking: 1984-93”Federal Reserve Bank of St. Louis Working Paper: 94/021A, pp. 30.
30ECBWork ing Paper Ser ie s No . 302February 2004
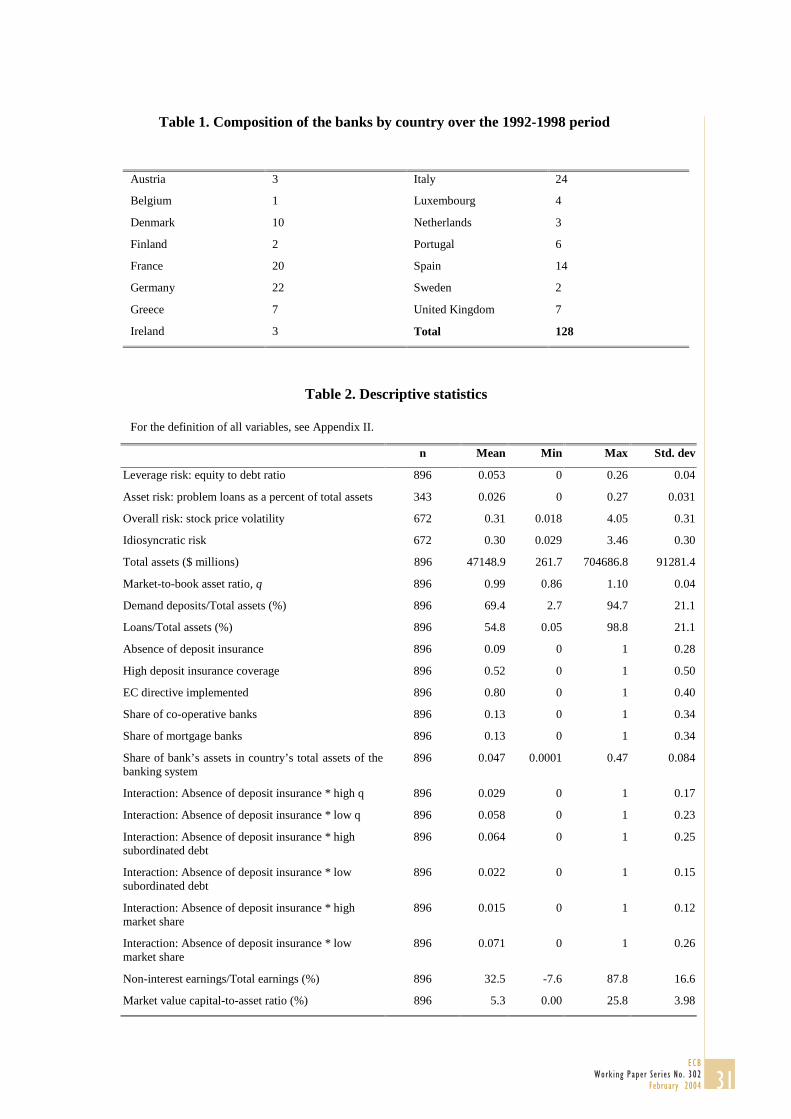
Table 1. Composition of the banks by country over the 1992-1998 period
Austria 3 Italy 24
Belgium 1 Luxembourg 4
Denmark 10 Netherlands 3
Finland 2 Portugal 6
France 20 Spain 14
Germany 22 Sweden 2
Greece 7 United Kingdom 7
Ireland 3 Total 128
Table 2. Descriptive statistics
For the definition of all variables, see Appendix II.
n Mean Min Max Std. dev
Leverage risk: equity to debt ratio 896 0.053 0 0.26 0.04
Asset risk: problem loans as a percent of total assets 343 0.026 0 0.27 0.031
Overall risk: stock price volatility 672 0.31 0.018 4.05 0.31
Idiosyncratic risk 672 0.30 0.029 3.46 0.30
Total assets ($ millions) 896 47148.9 261.7 704686.8 91281.4
Market-to-book asset ratio, q 896 0.99 0.86 1.10 0.04
Demand deposits/Total assets (%) 896 69.4 2.7 94.7 21.1
Loans/Total assets (%) 896 54.8 0.05 98.8 21.1
Absence of deposit insurance 896 0.09 0 1 0.28
High deposit insurance coverage 896 0.52 0 1 0.50
EC directive implemented 896 0.80 0 1 0.40
Share of co-operative banks 896 0.13 0 1 0.34
Share of mortgage banks 896 0.13 0 1 0.34
Share of bank’s assets in country’s total assets of thebanking system
896 0.047 0.0001 0.47 0.084
Interaction: Absence of deposit insurance * high q 896 0.029 0 1 0.17
Interaction: Absence of deposit insurance * low q 896 0.058 0 1 0.23
Interaction: Absence of deposit insurance * highsubordinated debt
896 0.064 0 1 0.25
Interaction: Absence of deposit insurance * lowsubordinated debt
896 0.022 0 1 0.15
Interaction: Absence of deposit insurance * highmarket share
896 0.015 0 1 0.12
Interaction: Absence of deposit insurance * lowmarket share
896 0.071 0 1 0.26
Non-interest earnings/Total earnings (%) 896 32.5 -7.6 87.8 16.6
Market value capital-to-asset ratio (%) 896 5.3 0.00 25.8 3.98
31ECB
Work ing Paper Ser ie s No . 302February 2004
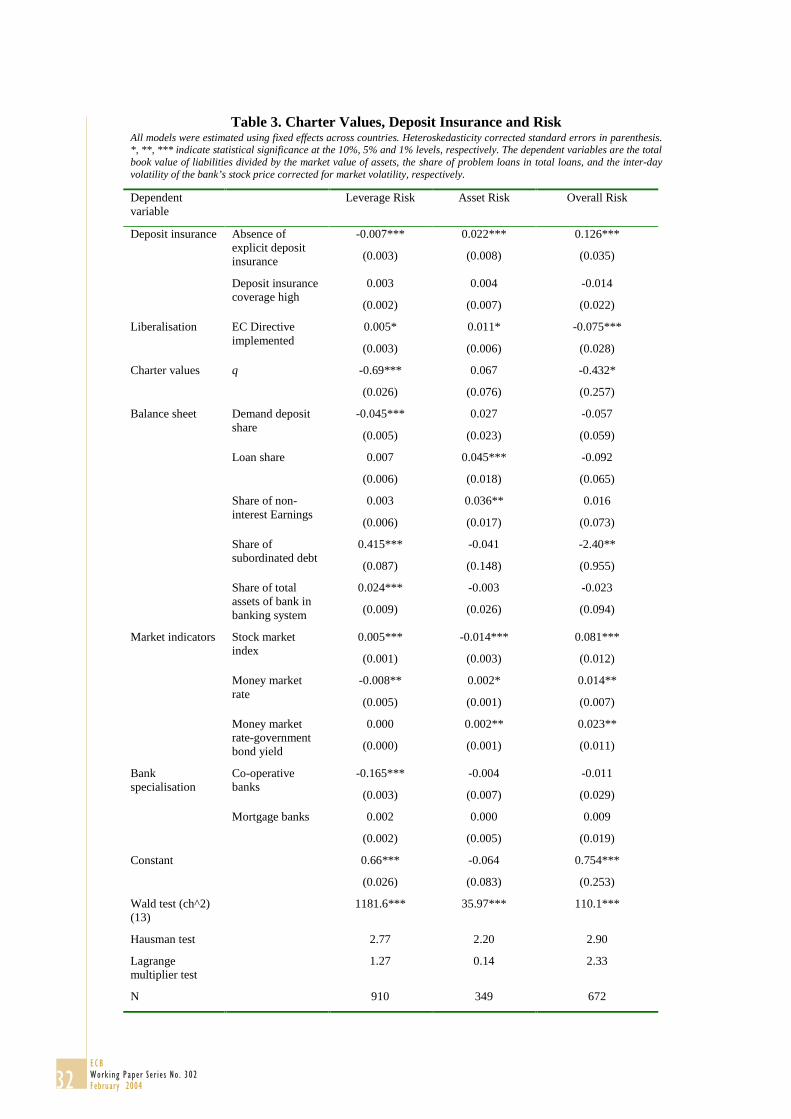
Table 3. Charter Values, Deposit Insurance and RiskAll models were estimated using fixed effects across countries. Heteroskedasticity corrected standard errors in parenthesis.*, **, *** indicate statistical significance at the 10%, 5% and 1% levels, respectively. The dependent variables are the totalbook value of liabilities divided by the market value of assets, the share of problem loans in total loans, and the inter-dayvolatility of the bank’s stock price corrected for market volatility, respectively.
Dependentvariable
Leverage Risk Asset Risk Overall Risk
Deposit insurance Absence ofexplicit depositinsurance
-0.007***
(0.003)
0.022***
(0.008)
0.126***
(0.035)
Deposit insurancecoverage high
0.003
(0.002)
0.004
(0.007)
-0.014
(0.022)
Liberalisation EC Directiveimplemented
0.005*
(0.003)
0.011*
(0.006)
-0.075***
(0.028)
Charter values q -0.69***
(0.026)
0.067
(0.076)
-0.432*
(0.257)
Balance sheet Demand depositshare
-0.045***
(0.005)
0.027
(0.023)
-0.057
(0.059)
Loan share 0.007
(0.006)
0.045***
(0.018)
-0.092
(0.065)
Share of non-interest Earnings
0.003
(0.006)
0.036**
(0.017)
0.016
(0.073)
Share ofsubordinated debt
0.415***
(0.087)
-0.041
(0.148)
-2.40**
(0.955)
Share of totalassets of bank inbanking system
0.024***
(0.009)
-0.003
(0.026)
-0.023
(0.094)
Market indicators Stock marketindex
0.005***
(0.001)
-0.014***
(0.003)
0.081***
(0.012)
Money marketrate
-0.008**
(0.005)
0.002*
(0.001)
0.014**
(0.007)
Money marketrate-governmentbond yield
0.000
(0.000)
0.002**
(0.001)
0.023**
(0.011)
Bankspecialisation
Co-operativebanks
-0.165***
(0.003)
-0.004
(0.007)
-0.011
(0.029)
Mortgage banks 0.002
(0.002)
0.000
(0.005)
0.009
(0.019)
Constant 0.66***
(0.026)
-0.064
(0.083)
0.754***
(0.253)
Wald test (ch^2)(13)
1181.6*** 35.97*** 110.1***
Hausman test 2.77 2.20 2.90
Lagrangemultiplier test
1.27 0.14 2.33
N 910 349 672
32ECBWork ing Paper Ser ie s No . 302February 2004

Tab
le 4
. Ref
inem
ents
: C
hart
er V
alue
s, “
Too
Big
to
Fai
l”, a
nd M
onit
orin
gA
ll m
odel
s w
ere
esti
mat
ed u
sing
fix
ed e
ffec
ts a
cros
s co
untr
ies.
Het
eros
keda
stic
ity
corr
ecte
d st
anda
rd e
rror
s in
par
enth
esis
. *,
**,
***
ind
icat
e st
atis
tica
l si
gnif
ican
ce a
t th
e 10
%,
5% a
nd 1
% l
evel
s,re
spec
tive
ly. T
he d
epen
dent
var
iabl
es a
re t
he t
otal
boo
k va
lue
of l
iabi
liti
es d
ivid
ed b
y th
e m
arke
t va
lue
of a
sset
s, t
he s
hare
of
prob
lem
loa
ns i
n to
tal
loan
s, a
nd t
he i
nter
-day
vol
atil
ity
of t
he b
ank’
s st
ock
pric
eco
rrec
ted
for
mar
ket v
olat
ilit
y, r
espe
ctiv
ely.
Mon
itori
ng b
y de
bt-h
olde
rsC
hart
er v
alue
s“T
oo b
ig to
fai
l”
Inte
ract
ion
term
s: A
bsen
ce o
fex
plic
it de
posi
t ins
uran
cein
tera
cted
wit
h:
Lev
erag
eR
isk
Ass
et R
isk
Ove
rall
Ris
kL
ever
age
Ris
kA
sset
Ris
kO
vera
llR
isk
Lev
erag
eR
isk
Ass
et R
isk
Ove
rall
Ris
k
Dum
my=
1 if
sub
ordi
nate
d de
btsh
are ������
����
�� �
-0.1
0**
(0.0
05)
-0.0
06
(0.0
14)
0.11
1**
(0.0
51)
Dum
my=
1 if
sub
ordi
nate
d de
btsh
are
> 0
.013
(m
edia
n)-0
.006
*
(0.0
03)
0.02
8***
(0.0
09)
0.17
3***
(0.0
44)
Dum
my=
1 if
pre
dict
ed q
>1
-0.0
08**
(0.0
04)
0.00
7
(0.0
10)
0.06
8
(0.0
56)
Dum
my=
1 if
pre
dict
ed q��
-0.0
06*
(0.0
04)
0.03
4***
(0.0
10)
0.15
7***
(0.0
42)
Dum
my=
1 if
sha
re in
ass
ets
ofba
nkin
g sy
stem
> 0
.12
(95th
per
c.)
-0.0
13**
(0.0
05)
0.02
2*
(0.0
13)
-0.0
06
(0.1
70)
Dum
my=
1 if
sha
re in
ass
ets
ofba
nkin
g sy
stem
����������th
per
c.)
-0.0
05**
(0.0
03)
0.02
2**
(0.0
09)
0.16
0***
(0.0
34)
Equ
alit
y of
coe
ffic
ient
s 1/
****
**
1/ *
, **,
***
rep
rese
nts
that
equ
alit
y of
the
two
coef
fici
ents
can
be
reje
cted
at t
he 1
0%, 5
% o
r 1%
leve
l, re
spec
tive
ly.
33ECB
Work ing Paper Ser ie s No . 302February 2004

Table 5. Sample limited to Finland, Greece, Portugal and Sweden
All models were estimated using fixed effects across countries. Heteroskedasticity corrected standard errors in parenthesis. *,**, *** indicate statistical significance at the 10%, 5% and 1% levels, respectively. The dependent variable is the inter-dayvolatility of the bank’s stock price corrected for market volatility. The interaction terms are defined as before.
Baseline Interaction: Subordinateddebt
Interaction: chartervalue
Interaction: “toobig to fail”
Absence of explicit depositinsurance
0.109***
(0.052)
Interaction term 1/ 0.076
(0.071)
0.132*
(0.076)
-0.052
(0.140)
Interaction term 2/ 0.126**
(0.057)
0.096*
(0.057)
0.121**
(0.052)
EC directive -0.412***
(0.067)
-0.418***
(0.067)
-0.406***
(0.068)
-0.406***
(0.066)
q -0.624
(0.491)
-0.619
(0.489)
-0.723
(0.556)
-0.560
(0.487)
Deposit share 0.76***
(0.251)
0.724**
(0.256)
0.751***
(0.252)
0.804***
(0.251)
Loan share -0.419*
(0.226)
-0.402*
(0.227)
-0.458*
(0.240)
-0.405*
(0.223)
Subordinated debt share 1.39
(3.52)
-0.624
(4.580)
1.79
(3.62)
1.63
(3.48)
Share of non-interest earnings 0.032
(0.177)
0.059
(0.181)
0.026
(0.178)
0.015
(0.176)
Share of assets in bankingsystem
0.181
(0.547)
0.155
(0.546)
0.179
(0.547)
0.371
(0.560)
Stock index 0.10***
(0.022)
0.10***
(0.022)
0.10***
(0.022)
0.099***
(0.022)
Money market rate -0.072***
(0.028)
-0.081***
(0.031)
-0.068**
(0.029)
-0.070**
(0.028)
Money market rate-bond yield 0.005
(0.007)
0.002*
(0.001)
0.010*
(0.007)
0.010*
(0.007)
Constant 0.500
(0.477)
0.526
(0.477)
0.625
(0.564)
0.396
(0.479)
Wald test 62.7*** 63.61*** 62.22*** 66.37***
n 56 56 56 56
1/ Low subordinated debt share; high q; high share in banking system, respectively.
2/ High subordinated debt share; low q; low share in banking system. See text for further explanation.
34ECBWork ing Paper Ser ie s No . 302February 2004

Table 6. Banks’ liability structure
The dependent variable is the share of deposits (excluding interbank deposits) in total liabilities. Model wasestimated with fixed effects across countries. Heteroskedasticity corrected standard errors in parenthesis. ***,**, * indicates statistical significance at the 1, 5 and 10 percent level, respectively. All independent variablesare defined as before.
Full sample Sample limited to Finland,Greece, Portugal and Sweden
Absence of deposit insurance -0.065***
(0.023)
-0.074***
(0.023)
High coverage 0.022*
(0.013)
EC directive 0.072***
(0.018)
0.094***
(0.027)
q 0.217
(0.175)
0.332
(0.266)
Share of loans 0.125***
(0.041)
0.154**
(0.063)
Share of subordinated debt 0.385
(0.548)
-0.655***
(0.126)
Share of assets in the banking system -0.091
(0.071)
-0.875***
(0.125)
Total assets/100000 -0.004***
(0.001)
-0.004
(0.01)
Money market rate 0.037***
(0.002)
0.014***
(0.004)
Bond yield -0.025***
(0.005)
-0.008
(0.007)
Stockmarket indicator 0.073***
(0.008)
-0.005
(0.012)
Savings banks 0.191**
(0.078)
Co-operative banks 0.021
(0.020)
Mortgage banks 0.003
(0.014)
0.038
(0.028)
Specialised lending institutions -0.077***
(0.020)
-0.080***
(0.023)
Constant -0.215
(0.183)
0.219
(0.280)
Wald statistic (15) 414.3*** (15) 440.5*** (12)
n 896 126
35ECB
Work ing Paper Ser ie s No . 302February 2004

Table 7. OLS with bank averagesOLS regression using bank averages. Standard errors in parenthesis. *, **, *** indicate statistical significance at the 10%, 5% and 1% levels,
respectively. The dependent variable is the inter-day volatility of the bank’s stock price corrected for market volatility.
Dependent variable
Deposit insurance Absence of explicit deposit insurance 0.251**
(0.127)
Deposit insurance coverage high -0.064
(0.051)
Liberalisation EC Directive implemented 0.063
(0.227)
Charter values q 0.332
(0.664)
Balance sheet Demand deposit share -0.218**
(0.099)
Loan share -0.381***
(0.120)
Share of non-interest Earnings 0.003
(0.006)
Share of subordinated debt 0.823
(2.27)
Share of total assets of bank in banking system 0.002
(0.279)
Market indicators Stock market index -0.148*
(0.089)
Money market rate 0.008**
(0.005)
Money market rate-government bond yield 0.023**
(0.011)
Bank specialisation Co-operative banks 0.050
(0.056)
Mortgage banks 0.001
(0.042)
Constant 0.59
(0.72)
Wald statistic 0.25
N 73
36ECBWork ing Paper Ser ie s No . 302February 2004
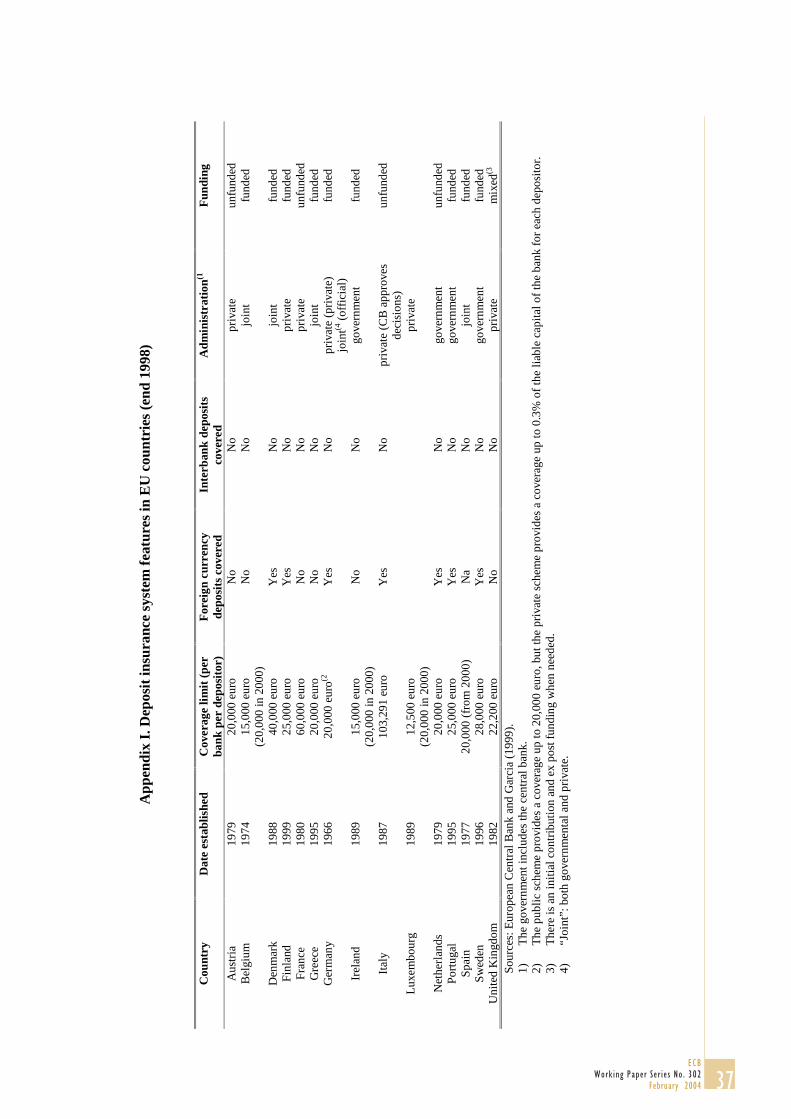
App
endi
x I.
Dep
osit
insu
ranc
e sy
stem
fea
ture
s in
EU
cou
ntri
es (e
nd 1
998)
Cou
ntry
Dat
e es
tabl
ishe
dC
over
age
limit
(pe
rba
nk p
er d
epos
itor
)F
orei
gn c
urre
ncy
depo
sits
cov
ered
Inte
rban
k de
posi
tsco
vere
dA
dmin
istr
atio
n(1F
undi
ng
Aus
tria
1979
20,0
00 e
uro
No
No
priv
ate
unfu
nded
Bel
gium
1974
15,0
00 e
uro
(20,
000
in 2
000)
No
No
join
tfu
nded
Den
mar
k19
8840
,000
eur
oY
esN
ojo
int
fund
edF
inla
nd19
9925
,000
eur
oY
esN
opr
ivat
efu
nded
Fra
nce
1980
60,0
00 e
uro
No
No
priv
ate
unfu
nded
Gre
ece
1995
20,0
00 e
uro
No
No
join
tfu
nded
Ger
man
y19
6620
,000
eur
o(2Y
esN
opr
ivat
e (p
riva
te)
join
t(4 (
offi
cial
)fu
nded
Irel
and
1989
15,0
00 e
uro
(20,
000
in 2
000)
No
No
gove
rnm
ent
fund
ed
Ital
y19
8710
3,29
1 eu
roY
esN
opr
ivat
e (C
B a
ppro
ves
deci
sion
s)un
fund
ed
Lux
embo
urg
1989
12,5
00 e
uro
(20,
000
in 2
000)
priv
ate
Net
herl
ands
1979
20,0
00 e
uro
Yes
No
gove
rnm
ent
unfu
nded
Por
tuga
l19
9525
,000
eur
oY
esN
ogo
vern
men
tfu
nded
Spa
in19
7720
,000
(fr
om 2
000)
Na
No
join
tfu
nded
Sw
eden
1996
28,0
00 e
uro
Yes
No
gove
rnm
ent
fund
edU
nite
d K
ingd
om19
8222
,200
eur
oN
oN
opr
ivat
em
ixed
(3
Sou
rces
: Eur
opea
n C
entr
al B
ank
and
Gar
cia
(199
9).
1)
The
gov
ernm
ent i
nclu
des
the
cent
ral b
ank.
2)
The
pub
lic
sche
me
prov
ides
a c
over
age
up to
20,
000
euro
, but
the
priv
ate
sche
me
prov
ides
a c
over
age
up to
0.3
% o
f th
e li
able
cap
ital
of
the
bank
for
eac
h de
posi
tor.
3)
The
re is
an
init
ial c
ontr
ibut
ion
and
ex p
ost f
undi
ng w
hen
need
ed.
4)
“Joi
nt”:
bot
h go
vern
men
tal a
nd p
riva
te.
37ECB
Work ing Paper Ser ie s No . 302February 2004

Appendix II. Definition of variables
Symbols: j: banks t: periods i: countries
EC Directive Implemented = 1 if i = DE, GR, FR, IE, IT, NL, PT, SE, UK and t"�##$
i = BE, LU, AT, FI and t"�##%
i = ES and t"�##&
i = DK and t"�##'
= 0 otherwise.
Absence of explicit deposit insurance = 1 if i = GR, PT, SE and t"�##'
i = FI
= 0 otherwise.
Deposit insurance coverage high = 1 if i = DE, FR, IT
= 0 otherwise.
Leverage risk = book value of debtjt /(book value of debtjt + market value of equityjt).
Asset risk = problem loansjt /total assetsjt.
Overall risk = Sdtj [Ln [pd/pd-1]]* n , where pd represents the stock price on day d, n the
number of active trading days and Sd the standard deviation during period t.
Idiosyncratic risk: see Appendix III.
Demand deposit share = Demand depositsjt/Total liabilitiesjt.
Loan share = Customer loansjt/Total assetsjt.
Share of non-interest earnings = 1-[interest earningsjt/total operational earningsjt]
Growth rate of assets since 1991 = [assetsjt-assetsjt-1] /assetsjt-1
Total assets of bank divided by total assets of banking system = Total assetsjt/ Total assets
of banking systemit
Stock market index = [Stock market indexit/Stock market indexi1991 ]*100
Money market rate-government bond yield = Money market rateit-Government bond
yieldit
Money market rate = Money market rateit
38ECBWork ing Paper Ser ie s No . 302February 2004

Appendix III. Computation of idiosyncratic risk
We computed our measure of idiosyncratic risk by first estimating a standard market
model of the form24
jtitjt R εβα + + = jtjt R (A1)
where Rit denotes the log daily stock return of bank j during year t and Rct represents the
log daily return of the market portfolio in country i during year t. Hence, we estimate the
model with about 250 daily observations for each bank in each year.25 The residuals of
this regression are commonly referred to as “abnormal” returns in the event study
literature (e.g. MacKinlay [1997]) and would be represented by
itjtjtjtjtjt RRAR βαε ˆˆˆ −−=≡ , (A2)
where jtα̂ and jtβ̂ are the estimated coefficients from equation (A1). If we take the
standard deviation of both sides of (A2) we obtain
222 ˆitjtjt RjtRAR σβσσ −= (A3)
Equation (A3) can be interpreted as the idiosyncratic volatility of the stock price of bank j
during period t.
24 See MacKinlay [1997] for further discussion on estimating such models, as well as their relative advantagesand disadvantages relative to other methods.25 As the model was estimated with daily data, it is likely that the normality assumption is violated at least insome cases and OLS estimation (which is what we use) may not be entirely appropriate. However, as Cableand Holland [2000] show, robust estimation will not necessarily solve the problem. At present, to ourknowledge, there does not exist a solution to this issue.
39ECB
Work ing Paper Ser ie s No . 302February 2004

Appendix IV.1 Instrumental variable resultsModels were estimated using fixed effects across time periods (instrument: country effects) or fixed effects across countries (instrument:lagged q). Heteroskasticity corrected standard errors in parenthesis. *, **, *** indicate statistical significance at the 10%, 5% and 1%levels, respectively. The dependent variables are the total book value of liabilities divided by the market value of assets, the share of problemloans in total loans and the inter-day volatility, respectively.
Instrument: Country effects Instrument: Lagged q
Dependent variable LeverageRisk
Asset Risk Overall Risk Leveragerisk
Asset risk Overall risk
Deposit insurance Absence of explicitdeposit insurance
0.032***
(0.007)
0.022***
(0.006)
0.124***
(0.036)
-0.004
(0.004)
0.025***
(0.009)
0.086***
(0.033)
Deposit insurancecoverage high
-0.033**
(0.017)
-0.0014
(0.007)
-0.029
(0.021)
0.010***
(0.003)
0.013**
(0.006)
0.0007
(0.019)
Liberalisation EC Directiveimplemented
0.020**
(0.008)
0.015**
(0.006)
-0.056***
(0.016)
0.006
(0.005)
-0.011
(0.008)
-0.035
(0.035)
Charter values Instrumented q -1.25***
(0.323)
-1.92***
(0.369)
-0.685***
(0.196)
-0.507***
(0.036)
0.156*
(0.085)
-0.334
(0.242)
Balance sheet Demand depositshare
-0.007
(0.008)
0.016
(0.016)
-0.146***
(0.038)
-0.051***
(0.006)
-0.002
(0.031)
-0.132**
(0.056)
Loan share -0.280***
(0.007)
0.044***
(0.016)
-0.237***
(0.046)
-0.009
(0.008)
0.041**
(0.019)
-0.102*
(0.058)
Share of non-interest Earnings
0.262***
(0.076)
0.106***
(0.015)
0.243***
(0.074)
-0.014*
(0.008)
0.046***
(0.016)
0.059
(0.064)
Share ofsubordinated debt
0.621***
(0.111)
-0.131
(0.117)
-1.48**
(0.619)
0.509***
(0.113)
0.017
(0.152)
-0.488
(0.885)
Share of total assetsof bank in bankingsystem
-0.070
(0.044)
-0.054**
(0.024)
0.044
(0.078)
0.023*
(0.013)
-0.010
(0.027)
-0.068
(0.097)
Market indicators Stock market index 0.117***
(0.032)
0.175***
(0.025)
-0.008***
(0.0014)
-0.013***
(0.003)
0.094***
(0.010)
Money market rate -0.018***
(0.005)
-0.010***
(0.001)
-0.038**
(0.019)
-0.012**
(0.005)
-0.011***
(0.003)
-0.035**
(0.015)
Money market rate-government bondyield
0.036***
(0.010)
0.012***
(0.002)
0.023***
(0.005)
0.026**
(0.010)
0.013***
(0.003)
0.023***
(0.006)
Bank specialisation Co-operative banks -0.234***
(0.062)
-0.033***
(0.008)
-0.119***
(0.043)
-0.008*
(0.004)
0.0007
(0.007)
0.014
(0.025)
Mortgage banks 0.055***
(0.016)
0.010**
(0.005)
0.034**
(0.015)
0.003
(0.003)
0.003
(0.006)
0.045***
(0.017)
Constant 1.24***
(0.322)
1.94***
(0.380)
0.703***
(0.191)
0.493***
(0.037)
-0.125
(0.10)
0.600**
(0.255)
n 896 343 672 783 312 454
40ECBWork ing Paper Ser ie s No . 302February 2004
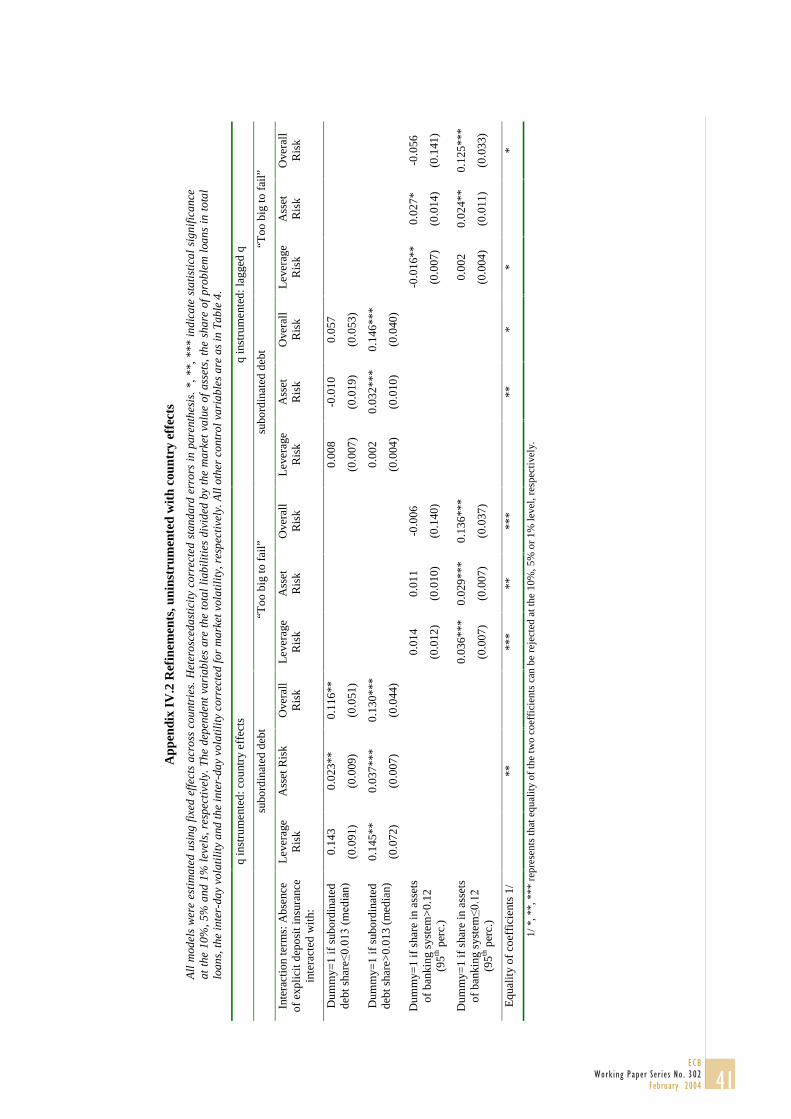
App
endi
x IV
.2 R
efin
emen
ts, u
nins
trum
ente
d w
ith
coun
try
effe
cts
All
mod
els
wer
e es
tim
ated
usi
ng f
ixed
eff
ects
acr
oss
coun
trie
s. H
eter
osce
dast
icit
y co
rrec
ted
stan
dard
err
ors
in p
aren
thes
is. *
, **,
***
ind
icat
e st
atis
tica
l si
gnif
ican
ceat
the
10%
, 5%
and
1%
lev
els,
res
pect
ivel
y. T
he d
epen
dent
var
iabl
es a
re t
he t
otal
lia
bili
ties
div
ided
by
the
mar
ket
valu
e of
ass
ets,
the
sha
re o
f pr
oble
m l
oans
in
tota
llo
ans,
the
inte
r-da
y vo
lati
lity
and
the
inte
r-da
y vo
lati
lity
cor
rect
ed fo
r m
arke
t vol
atil
ity,
res
pect
ivel
y. A
ll o
ther
con
trol
var
iabl
es a
re a
s in
Tab
le 4
.
q in
stru
men
ted:
cou
ntry
eff
ects
q in
stru
men
ted:
lagg
ed q
subo
rdin
ated
deb
t“T
oo b
ig to
fai
l”su
bord
inat
ed d
ebt
“Too
big
to f
ail”
Inte
ract
ion
term
s: A
bsen
ceof
exp
licit
depo
sit i
nsur
ance
inte
ract
ed w
ith:
Lev
erag
eR
isk
Ass
et R
isk
Ove
rall
Ris
kL
ever
age
Ris
kA
sset
Ris
kO
vera
llR
isk
Lev
erag
eR
isk
Ass
etR
isk
Ove
rall
Ris
kL
ever
age
Ris
kA
sset
Ris
kO
vera
llR
isk
Dum
my=
1 if
sub
ordi
nate
dde
bt s
hare��
����
����� �
0.14
3
(0.0
91)
0.02
3**
(0.0
09)
0.11
6**
(0.0
51)
0.00
8
(0.0
07)
-0.0
10
(0.0
19)
0.05
7
(0.0
53)
Dum
my=
1 if
sub
ordi
nate
dde
bt s
hare
>0.
013
(med
ian)
0.14
5**
(0.0
72)
0.03
7***
(0.0
07)
0.13
0***
(0.0
44)
0.00
2
(0.0
04)
0.03
2***
(0.0
10)
0.14
6***
(0.0
40)
Dum
my=
1 if
sha
re in
ass
ets
of b
anki
ng s
yste
m>
0.12
(95th
per
c.)
0.01
4
(0.0
12)
0.01
1
(0.0
10)
-0.0
06
(0.1
40)
-0.0
16**
(0.0
07)
0.02
7*
(0.0
14)
-0.0
56
(0.1
41)
Dum
my=
1 if
sha
re in
ass
ets
of b
anki
ng s
yste
m��
���
(95th
per
c.)
0.03
6***
(0.0
07)
0.02
9***
(0.0
07)
0.13
6***
(0.0
37)
0.00
2
(0.0
04)
0.02
4**
(0.0
11)
0.12
5***
(0.0
33)
Equ
alit
y of
coe
ffic
ient
s 1/
****
***
***
***
**
1/ *
, **,
***
rep
rese
nts
that
equ
alit
y of
the
two
coef
fici
ents
can
be
reje
cted
at t
he 1
0%, 5
% o
r 1%
leve
l, re
spec
tive
ly.
41ECB
Work ing Paper Ser ie s No . 302February 2004

European Central Bank working paper series
For a complete list of Working Papers published by the ECB, please visit the ECB�s website(http://www.ecb.int).
202 �Aggregate loans to the euro area private sector� by A. Calza, M. Manrique and J. Sousa,January 2003.
203 �Myopic loss aversion, disappointment aversion and the equity premium puzzle� byD. Fielding and L. Stracca, January 2003.
204 �Asymmetric dynamics in the correlations of global equity and bond returns� byL. Cappiello, R.F. Engle and K. Sheppard, January 2003.
205 �Real exchange rate in an inter-temporal n-country-model with incomplete markets� byB. Mercereau, January 2003.
206 �Empirical estimates of reaction functions for the euro area� by D. Gerdesmeier andB. Roffia, January 2003.
207 �A comprehensive model on the euro overnight rate� by F. R. Würtz, January 2003.
208 �Do demographic changes affect risk premiums? Evidence from international data� byA. Ang and A. Maddaloni, January 2003.
209 �A framework for collateral risk control determination� by D. Cossin, Z. Huang,D. Aunon-Nerin and F. González, January 2003.
210 �Anticipated Ramsey reforms and the uniform taxation principle: the role of internationalfinancial markets� by S. Schmitt-Grohé and M. Uribe, January 2003.
211 �Self-control and savings� by P. Michel and J.P. Vidal, January 2003.
212 �Modelling the implied probability of stock market movements� by E. Glatzer andM. Scheicher, January 2003.
213 �Aggregation and euro area Phillips curves� by S. Fabiani and J. Morgan, February 2003.
214 �On the selection of forecasting models� by A. Inoue and L. Kilian, February 2003.
215 �Budget institutions and fiscal performance in Central and Eastern European countries� byH. Gleich, February 2003.
216 �The admission of accession countries to an enlarged monetary union: a tentativeassessment� by M. Ca�Zorzi and R. A. De Santis, February 2003.
217 �The role of product market regulations in the process of structural change� by J. Messina,March 2003.
42ECBWork ing Paper Ser ie s No . 302February 2004

218 �The zero-interest-rate bound and the role of the exchange rate for monetary policy inJapan� by G. Coenen and V. Wieland, March 2003.
219 �Extra-euro area manufacturing import prices and exchange rate pass-through� byB. Anderton, March 2003.
220 �The allocation of competencies in an international union: a positive analysis� by M. Ruta,April 2003.
221 �Estimating risk premia in money market rates� by A. Durré, S. Evjen and R. Pilegaard,April 2003.
222 �Inflation dynamics and subjective expectations in the United States� by K. Adam andM. Padula, April 2003.
223 �Optimal monetary policy with imperfect common knowledge� by K. Adam, April 2003.
224 �The rise of the yen vis-à-vis the (�synthetic�) euro: is it supported by economicfundamentals?� by C. Osbat, R. Rüffer and B. Schnatz, April 2003.
225 �Productivity and the (�synthetic�) euro-dollar exchange rate� by C. Osbat, F. Vijselaar andB. Schnatz, April 2003.
226 �The central banker as a risk manager: quantifying and forecasting inflation risks� byL. Kilian and S. Manganelli, April 2003.
227 �Monetary policy in a low pass-through environment� by T. Monacelli, April 2003.
228 �Monetary policy shocks � a nonfundamental look at the data� by M. Klaeffing, May 2003.
229 �How does the ECB target inflation?� by P. Surico, May 2003.
230 �The euro area financial system: structure, integration and policy initiatives� byP. Hartmann, A. Maddaloni and S. Manganelli, May 2003.
231 �Price stability and monetary policy effectiveness when nominal interest rates are boundedat zero� by G. Coenen, A. Orphanides and V. Wieland, May 2003.
232 �Describing the Fed�s conduct with Taylor rules: is interest rate smoothing important?� byE. Castelnuovo, May 2003.
233 �The natural real rate of interest in the euro area� by N. Giammarioli and N. Valla,May 2003.
234 �Unemployment, hysteresis and transition� by M. León-Ledesma and P. McAdam,May 2003.
235 �Volatility of interest rates in the euro area: evidence from high frequency data� byN. Cassola and C. Morana, June 2003.
43ECB
Work ing Paper Ser ie s No . 302February 2004
236 �Swiss monetary targeting 1974-1996: the role of internal policy analysis� by G. Rich, June 2003.
237 �Growth expectations, capital flows and international risk sharing� by O. Castrén, M. Millerand R. Stiegert, June 2003.
238 �The impact of monetary union on trade prices� by R. Anderton, R. E. Baldwin andD. Taglioni, June 2003.
239 �Temporary shocks and unavoidable transitions to a high-unemployment regime� byW. J. Denhaan, June 2003.
240 �Monetary policy transmission in the euro area: any changes after EMU?� by I. Angeloni andM. Ehrmann, July 2003.
241 Maintaining price stability under free-floating: a fearless way out of the corner?� byC. Detken and V. Gaspar, July 2003.
242 �Public sector efficiency: an international comparison� by A. Afonso, L. Schuknecht andV. Tanzi, July 2003.
243 �Pass-through of external shocks to euro area inflation� by E. Hahn, July 2003.
244 �How does the ECB allot liquidity in its weekly main refinancing operations? A look at theempirical evidence� by S. Ejerskov, C. Martin Moss and L. Stracca, July 2003.
245 �Money and payments: a modern perspective� by C. Holthausen and C. Monnet, July 2003.
246 �Public finances and long-term growth in Europe � evidence from a panel data analysis� byD. R. de Ávila Torrijos and R. Strauch, July 2003.
247 �Forecasting euro area inflation: does aggregating forecasts by HICP component improveforecast accuracy?� by K. Hubrich, August 2003.
248 �Exchange rates and fundamentals� by C. Engel and K. D. West, August 2003.
249 �Trade advantages and specialisation dynamics in acceding countries� by A. Zaghini,August 2003.
250 �Persistence, the transmission mechanism and robust monetary policy� by I. Angeloni,G. Coenen and F. Smets, August 2003.
251 �Consumption, habit persistence, imperfect information and the lifetime budget constraint�by A. Willman, August 2003.
252 �Interpolation and backdating with a large information set� by E. Angelini, J. Henry andM. Marcellino, August 2003.
253 �Bond market inflation expectations and longer-term trends in broad monetary growth andinflation in industrial countries, 1880-2001� by W. G. Dewald, September 2003.
44ECBWork ing Paper Ser ie s No . 302February 2004

254 �Forecasting real GDP: what role for narrow money?� by C. Brand, H.-E. Reimers andF. Seitz, September 2003.
255 �Is the demand for euro area M3 stable?� by A. Bruggeman, P. Donati and A. Warne,September 2003.
256 �Information acquisition and decision making in committees: a survey� by K. Gerling,H. P. Grüner, A. Kiel and E. Schulte, September 2003.
257 �Macroeconomic modelling of monetary policy� by M. Klaeffling, September 2003.
258 �Interest rate reaction functions and the Taylor rule in the euro area� by P. Gerlach-Kristen, September 2003.
259 �Implicit tax co-ordination under repeated policy interactions� by M. Catenaro andJ.-P. Vidal, September 2003.
260 �Aggregation-theoretic monetary aggregation over the euro area, when countries areheterogeneous� by W. A. Barnett, September 2003.
261 �Why has broad money demand been more stable in the euro area than in othereconomies? A literature review� by A. Calza and J. Sousa, September 2003.
262 �Indeterminacy of rational expectations equilibria in sequential financial markets� byP. Donati, September 2003.
263 �Measuring contagion with a Bayesian, time-varying coefficient model� by M. Ciccarelli andA. Rebucci, September 2003.
264 �A monthly monetary model with banking intermediation for the euro area� byA. Bruggeman and M. Donnay, September 2003.
265 �New Keynesian Phillips Curves: a reassessment using euro area data� by P. McAdam andA. Willman, September 2003.
266 �Finance and growth in the EU: new evidence from the liberalisation and harmonisation ofthe banking industry� by D. Romero de Ávila, September 2003.
267 �Comparing economic dynamics in the EU and CEE accession countries� by R. Süppel,September 2003.
268 �The output composition puzzle: a difference in the monetary transmission mechanism inthe euro area and the US� by I. Angeloni, A. K. Kashyap, B. Mojon and D. Terlizzese,September 2003.
269 �Zero lower bound: is it a problem with the euro area?" by G. Coenen, September 2003.
270 �Downward nominal wage rigidity and the long-run Phillips curve: simulation-basedevidence for the euro area� by G. Coenen, September 2003.
271 �Indeterminacy and search theory� by N. Giammarioli, September 2003.
45ECB
Work ing Paper Ser ie s No . 302February 2004

272 �Inflation targets and the liquidity trap� by M. Klaeffling and V. López Pérez,September 2003.
273 �Definition of price stability, range and point inflation targets: the anchoring of long-terminflation expectations� by E. Castelnuovo, S. Nicoletti-Altimari and D. Rodriguez-Palenzuela, September 2003.
274 �Interpreting implied risk neutral densities: the role of risk premia� by P. Hördahl andD. Vestin, September 2003.
275 �Identifying the monetary transmission mechanism using structural breaks� by A. Beyer andR. Farmer, September 2003.
276 �Short-term estimates of euro area real GDP by means of monthly data� by G. Rünstler,September 2003.
277 �On the indeterminacy of determinacy and indeterminacy" by A. Beyer and R. Farmer,September 2003.
278 �Relevant economic issues concerning the optimal rate of inflation� by D. R. Palenzuela,G. Camba-Méndez and J. Á. García, September 2003.
279 �Designing targeting rules for international monetary policy cooperation� by G. Benignoand P. Benigno, October 2003.
280 �Inflation, factor substitution and growth� by R. Klump, October 2003.
281 �Identifying fiscal shocks and policy regimes in OECD countries� by G. de Arcangelis and S. Lamartina, October 2003.
.
282 �Optimal dynamic risk sharing when enforcement is a decision variable� by T. V. Koeppl,
October 2003.
283 �US, Japan and the euro area: comparing business-cycle features� by P. McAdam,
November 2003.
284 �The credibility of the monetary policy ‘free lunch’� by J. Yetman, November 2003.
285 �Government deficits, wealth effects and the price level in an optimizing model�
by B. Annicchiarico, November 2003.
286 �Country and sector-specific spillover effects in the euro area, the United States and Japan�
by B. Kaltenhaeuser, November 2003.
287 �Consumer inflation expectations in Poland� by T. Łyziak, November 2003.
288 �Implementing optimal control cointegrated I(1) structural VAR models� by F. V. Monti,
November 2003.
289 �Monetary and fiscal interactions in open economies� by G. Lombardo and A. Sutherland,
November 2003.
46ECBWork ing Paper Ser ie s No . 302February 2004
291 �Measuring the time-inconsitency of US monetary policy� by P. Surico, November 2003.
290 �Inflation persistence and robust monetary policy design� by G. Coenen, November 2003.
292 �Bank mergers, competition and liquidity� by E. Carletti, P. Hartmann and G. Spagnolo,
November 2003.
293 �Committees and special interests” by M. Felgenhauer and H. P. Grüner, November 2003.
294 �Does the yield spread predict recessions in the euro area?” by F. Moneta, December 2003.
295 �Optimal allotment policy in the eurosystem’s main refinancing operations?” by C. Ewerhart, N. Cassola, S. Ejerskov and N. Valla, December 2003.
296 �Monetary policy analysis in a small open economy using bayesian cointegrated structural VARs?” by M. Villani and A. Warne, December 2003.
297 �Measurement of contagion in banks’ equity prices� by R. Gropp and G. Moerman, December 2003.
298 �The lender of last resort: a 21st century approach” by X. Freixas, B. M. Parigi and J.-C. Rochet, December 2003.
299 �Import prices and pricing-to-market effects in the euro area� by T. Warmedinger, January 2004.
300 �Developing statistical indicators of the integration of the euro area banking system�
by M. Manna, January 2004.
301 �Inflation and relative price asymmetry” by A. Rátfai, January 2004.
302 �Deposit insurance, moral hazard and market monitoring” by R. Gropp and J. Vesala, February 2004.
47ECB
Work ing Paper Ser ie s No . 302February 2004
