depositional and tectonic controls on architecture of the
TRANSCRIPT

Scholars' Mine Scholars' Mine
Masters Theses Student Theses and Dissertations
Summer 2012
Depositional and tectonic controls on architecture of the Depositional and tectonic controls on architecture of the
carbonate platform of upper Paleocene Khalifah Formation, Sirte carbonate platform of upper Paleocene Khalifah Formation, Sirte
Basin, Central Libya Basin, Central Libya
Salah Abdurzak Shaniba
Follow this and additional works at: https://scholarsmine.mst.edu/masters_theses
Part of the Geology Commons, and the Geophysics and Seismology Commons
Department: Department:
Recommended Citation Recommended Citation Shaniba, Salah Abdurzak, "Depositional and tectonic controls on architecture of the carbonate platform of upper Paleocene Khalifah Formation, Sirte Basin, Central Libya" (2012). Masters Theses. 6930. https://scholarsmine.mst.edu/masters_theses/6930
This thesis is brought to you by Scholars' Mine, a service of the Missouri S&T Library and Learning Resources. This work is protected by U. S. Copyright Law. Unauthorized use including reproduction for redistribution requires the permission of the copyright holder. For more information, please contact [email protected].


DEPOSITIONAL AND TECTONIC CONTROLS ON ARCHITECTURE OF THE
CARBONATE PLATFORM OF UPPER PALEOCENE KHALIFAH FORMATION,
SIRTE BASIN, CENTRAL LIBYA
By
SALAH A SHANIBA
A THESIS
Presented to the Faculty of the Graduate School of the
MISSOURI UNIVERSITY OF SCIENCE AND TECHNOLOGY
In Partial Fulfillment of the Requirements for the Degree
MASTER OF SCIENCE IN GEOLOGY AND GEOPHYSICS
2012
Approved by
Wan Yang, Advisor
Mohamed G. Abdelsalam
Kelly H. Liu

2012
Salah A Shaniba
All Rights Reserved

iii
ABSTRACT
The Paleocene strata in Sirte Basin, Libya, contain major oil and gas
accumulations in a variety of lithofacies of reef and bioherm carbonate depositional
environments. The Upper Paleocene Khalifah Formation, which is one of the main
reservoirs containing about 30% of the oil reserves of the Sirte Basin, is composed of
shallowing-upward and carbonate platform deposits and is capped by open marine shale
deposits formed during a marine transgression. Well and seismic data are used to
interpret the depositional environments and identify upward shallowing and deepening
trends in the formation. In the study area, Mabruk oil field in northwestern Sirte Basin,
three level of low, intermediate, and high-order cycles are delineated in Khalifah
Formation. Six low-order cycles are interpreted within the formation. Structural and
isopach maps show a paleohigh, which was formed by structural and stratigraphic
processes. The first four low-order cycles are progressively thickening upward, probably
indicating platform and reef buildup, the fifth low-order cycle is the thickest and indicates
keep up mode of platform deposition. The uppermost cycle is thin and well bedded and
defines the end of a reef buildup cycle.

iv
ACKNOWLEDGMENTS
I am thankful to Almighty Allah and I am grateful to my research advisor, Dr.
Wan Yang, for his help, advice, and encouragement during my study at Missouri
University of Science and Technology. Special thanks to the committee members Dr.
Mohamed G. Abdelsalam and Dr. Kelly Liu for serving on my committee and for their
comments during the preparation of this thesis.
I am very grateful to Mabruk Oil Operations, Libya, in particular the
superintendent of the Oil Movement and Ship in Field Operation Department, Mr. Yosef
Shenba and the Geology & Geophysics Manager and staff for providing the data used in
this study. I would like to thank ExxonMobil Company for sponsoring financially my
graduate study. Special thanks go to Institute of International Education for supervising
me during my study.
I would also like to thank faculty, students and staff of Department of Geological
Sciences and Engineering for their help and support during my study at Missouri
University of Science and Technology.
Finally, I extend my thanks to my parents, wife, and friends for their love, help,
and support during my study.

v
TABLE OF CONTENTS
Page
ABSTRACT ....................................................................................................................... iii
ACKNOWLEDGMENTS ................................................................................................. iv
LIST OF ILLUSTRATIONS ........................................................................................... viii
LIST OF TABLES ............................................................................................................ xii
SECTION
1. INTRODUCTION .......................................................................................................... 1
1.1. OVERVIEW OF SIRTE BASIN ........................................................................ 1
1.2. LOCATION OF THE STUDY AREA ............................................................... 1
1.3. HISTORY OF WEST MABRUK FIELD .......................................................... 2
1.4. OBJECTIVES ..................................................................................................... 3
2. GEOLOGICAL SETTING ............................................................................................. 5
2.1. TECTONIC SETTING ....................................................................................... 5
2.1.1. Phase 1: Berriasian-Barremian ................................................................. 5
2.1.2. Phase 2: Aptian-Santonian. ...................................................................... 5
2.1.3. Phase 3: Santonian .................................................................................... 7
2.1.4. Phase 4: Campanian-Maastrichtian .......................................................... 8
2.1.5. Phase 5: Paleocene-Late Eocene .............................................................. 8
2.1.6. Phase 6: Latest Eocene ............................................................................. 8
2.1.7. Phase 7: Oligocene-Early Miocene .......................................................... 8
2.1.8. Phase 8: Miocene to Present ..................................................................... 8
2.2. DEPOSITIONAL SETTING AND STRATIGRAPHY ..................................... 9
2.3. PETROLEUM SYSTEM IN THE WESTERN SIRTE BASIN ....................... 10
2.3.1. Source Rocks .......................................................................................... 11
2.3.2. Seals and Traps ....................................................................................... 11
2.3.3. Reservoirs ............................................................................................... 11
3. DATA ........................................................................................................................... 15
3.1. SEISMIC DATA ............................................................................................... 15
3.2. WELL LOG DATA .......................................................................................... 16

vi
3.2.1. Spontaneous Potential (SP) .................................................................... 17
3.2.2. Gamma Ray ............................................................................................ 17
3.2.3. Porosity Logs .......................................................................................... 17
3.2.3.1 Neutron log. ................................................................................17
3.2.3.2 Density log ..................................................................................18
3.2.3.3 Sonic log .....................................................................................19
3.2.4. Photo-Electric Factor Log. ..................................................................... 21
3.2.5. Resistivity Logs ...................................................................................... 22
3.3. INTERPRETATION SOFTWARE .................................................................. 23
4. METHODOLOGY ....................................................................................................... 24
4.1. WELL LOG ANALYSIS ................................................................................. 24
4.1.1. Lithology Calibration ............................................................................. 24
4.1.2. Crossplot Analysis .................................................................................. 24
4.1.3. Cycle Analysis ........................................................................................ 24
4.2. SEISMIC INTERPRETATION ........................................................................ 24
4.2.1. Synthetic Seismogram ............................................................................ 24
4.2.2. Well-to-Seismic Calibration ................................................................... 26
4.2.3. Horizon Picking ...................................................................................... 26
4.3. MAP INTERPRETATION. .............................................................................. 28
4.3.1. Structural Maps. ..................................................................................... 28
4.3.2. Isopach Maps .......................................................................................... 31
4.3.3. Time Slices ............................................................................................. 31
5. RESULTS AND INTERPRETATIONS ...................................................................... 36
5.1. STRUCTURAL CONFIGURATIONS OF THE STUDY AREA ................... 36
5.1.1. Faults ...................................................................................................... 36
5.1.2. Folds. ...................................................................................................... 36
5.2. STRATIGRAPHIC ARCHITECTURE AND CYCLE DEVELOPMENT ..... 41
5.2.1. Cyclostratigraphy of Khalifah Formation .............................................. 41
5.2.2. Characteristics of Low-Order Cycle 1 .................................................... 43
5.2.3. Characteristics of Low-Order Cycle 2.....................................................46
5.2.4. Characteristics of Low-Order Cycle 3 .................................................... 51

vii
5.2.5. Characteristics of Low-Order Cycle 4 .................................................... 54
5.2.6. Characteristics of Low-Order Cycle 5. ................................................... 56
5.2.7. Characteristics of Low-Order Cycle 6 .................................................... 56
5.3. CHARACTERISTICS OF KHALIFAH FORMATION .................................. 63
6. CONCLUSIONS........................................................................................................... 69
APPENDIX ....................................................................................................................... 70
BIBLIOGRAPHY ............................................................................................................. 71
VITA ................................................................................................................................ 73

viii
LIST OF ILLUSTRATIONS
Figure Page
1.1. Distribution of sedimentary basins in Libya, which include Sirte,
Kuffra, Murzuk, and Ghadames basins ...................................................................... 2
1.2. Map of Sirte Basin and the location of study area ...................................................... 3
1.3. Map showing 3-D seismic survey as outlined by the triangle and wells
locations (black dots with well names) in West Mabruk Oilfield .............................. 4
2.1. Pre-Hercynian subcrop map in Sirte Basin area ......................................................... 6
2.2. Tectonic map of the Sirte Basin, showing oil and gas distribution and its
relationship to major structural elements ................................................................... 7
2.3. Lithostratigraphy of the Paleocene rocks of Sirte Basin, showing the
Khalifah Formation stratigraphic column with their equivalent .............................. 10
2.4. Stratigraphy and lithofacies of Mabruk Oilfield ....................................................... 12
2.5. Petroleum system in the western Sirte Basin ............................................................ 14
2.6. Stratigraphic cross section of the Sirte Basin showing source rocks and
hydrocarbon accumulations ...................................................................................... 14
3.1. 3-D seismic survey of West Mabruk Oilfield used in the study ............................... 15
3.2. Base map of seismic survey and location of the six wells in West
Mabruk Oilfield used in the study ............................................................................ 16
3.3. Some typical responses of the neutron log ............................................................... 19
3.4. Some typical responses of the sonic log ................................................................... 20
3.5. Some typical responses of the PEF log ..................................................................... 21
3.6. Some typical responses of the resistivity log, showing effects of lithology
and fluid on an electric current ................................................................................. 22
4.1. Crossplot of acoustic log against gamma ray values of different lithologies
for Well 5 .................................................................................................................. 25
4.2. Crossplot of photo-electric factor log against gamma ray log vales for Well 5 ....... 26
ix
4.3. Crossplot of deep resistivity log against gamma ray log for Well 1 ......................... 27
4.4. Crossplot of neutron log against gamma ray log for Well 3 ..................................... 28
4.5. A synthetic seismogram constructed for Well 2 using Ormsby-type
wavelet calculated from the seismic traces ............................................................... 29
4.6. A synthetic seismogram for Well 4, constructed using the same parameters
as in Fig 4.5 ............................................................................................................... 30
4.7. A synthetic seismogram of Well 2 overlaid on a vertical seismic section
(inline 4485) in order to tie the well data to seismic sections ................................... 31
4.8. Seven cycles boundaries on seismic inline 4490 ...................................................... 32
4.9. Structural contour map of the base of low-order cycle 1 .......................................... 33
4.10. Isopach contour map for low-order cycle 5 ............................................................ 34
4.11. Time slice at 0.46 sec. showing the geometry of mound/reef facies. ..................... 35
5.1. Structural contour map at the base of low-order cycle 5 showing three
faults have the same NE-SW orientation.................................................................. 37
5.2. An E-W cross section (upper panel) shows a series of faults located
in the northern study area ......................................................................................... 38
5.3. Structural contour map for the base of low-order cycle1, showing
two major folds within the Mabruk Oilfield............................................................. 39
5.4. A NW-SE Cross section showing the main structural high in the center
of the study area........................................................................................................ 40
5.5. An example of well delineation of cycles ................................................................. 42
5.6. A simplified page-size well cross section of the six low-order cycles ..................... 44
5.7. Two seismic cross sections show examples of the six low-order cycles
in both crossline and inline ....................................................................................... 45
5.8. Examples of lithologic and cyclostratigraphic analyses using well data
for low-order cycle 1 in Well 1 (upper panel) and Well 2 (lower panel). ................ 47
5.9. Seismic crossline 2093 showing an example of seismic stratal geometry
of a mounded feature with off-lapping convex-up reflections, which
suggests a coral reef facies within Khalifah Formation ........................................... 48

x
5.10. Isopach contour map of low-order cycle 1 ............................................................. 48
5.11. The six low-order cycles in a seismic cross section crossline 2177 ....................... 49
5.12. The lithology and component high and intermediate-order cycles of
low-order cycle 2 in Well 2 .................................................................................... 50
5.13. Isopach contour map of low-order cycle 2 ............................................................. 50
5.14. The lithology and component high and intermediate-order cycles of
low-order cycle 3 in Well 1 .................................................................................... 52
5.15. Some downlap and toplap termination patterns in seismic cross section
oriented NE-SW ..................................................................................................... 53
5.16. Isopach contour map of low-order cycle 3 ............................................................. 53
5.17. Isopach contour map of low-order cycle 3 with northwest-southeast
cross sections (inline and crossline) through the thick area ................................... 55
5.18. Lithology and component high and intermediate-order cycles in low-order
cycle 4 in Well 6 ..................................................................................................... 57
5.19. An example of a vertical seismic section crossline 1932 showing
the typical seismic facies of low-order cycle 4 ...................................................... 58
5.20. Isopach contour map of low-order cycle 4 ............................................................. 58
5.21. A seismic section crossline 2032 showing the thickness change
from north to south of low-order cycle 4 ............................................................... 59
5.22. The lithologic interpretation and component high and intermediate-order
cycles in low-order cycle 5 in Well 5 ..................................................................... 60
5.23. An example of vertical seismic section crossline 2049 showing the
typical limestone seismic facies of low-order cycle 5 ........................................... 61
5.24. Isopach contour map of low-order cycle 5 ............................................................. 61
5.25. Lithology and component high and intermediate-order cycles of
low-order cycle 6 in Well 1 .................................................................................... 62
5.26. An example of vertical seismic section inline 4737 showing the
typical shale seismic facies of low-order cycle 6 ................................................... 62
5.27. Isopach contour map of low-order cycle 6 ............................................................. 63

xi
5.28. Isopach Map for all low-order cycles showing the distribution of
depositional facies in the area.................................................................................. 64
5.29. Structural contour map of the top of low-order cycle 6 .......................................... 66
5.30. Carbonate build-up with several seismic facies units ............................................. 67
5.31. Carbonate build-up with several seismic facies in Mabruk Oilfield....................... 68

xii
LIST OF TABLES
Table Page
2.1. Summary of lithologies of all Khalifah units. ............................................................ 13
5.1. Thickness in meters of six low-order cycles in six wells in the study area. .............. 42

1. INTRODUCTION
1.1. OVERVIEW OF SIRTE BASIN
The Sirte Basin (also spelled as Sirt in some literature) in north central Libya, is
one of the four sedimentary basins in Libya, northern Africa (Fig. 1.1). The basin covers
an area of 600,000 km². It is among the top 20 world’s largest petroleum provinces, with
a reserve of about 117 billion barrels of oil (Hallet, 2002). The hydrocarbon source rock
in the basin is mainly Silurian and Cretaceous organic-rich shales containing Type II
kerogens (Gumati et al., 1996). The geological history of the basin is closely related to
the tectonic evolution of North African continental margin. The basin is characterized by
a Mesozoic-Cenozoic basin-fill, and a series of platforms and deep troughs (Gumati et al.,
1996). More than 85% of the hydrocarbons in Libya have been discovered in Sirte Basin,
making of a great economic importance and attracting attentions of many stratigraphers
and sedimentologists (Hallet, 2000).
1.2. LOCATION OF THE STUDY AREA
Lithology, stratigraphy, and depositional environment of sedimentary rocks in the
Mabruk Oilfield are the focus of this study. The field is located in Concession 17, at the
western side of Sirte Basin, which is approximately 170 km south of Gulf of Sirte (Fig.
1.2). It has four areas of hydrocarbon accumulations, namely, North, Central, West, and
East Mabruk (Mabruk Oil Operations Company, 1999). This study will focus on the
western part of Mabruk field.

2
Figure 1.1. Distribution of sedimentary basins in Libya, which include Sirte, Kuffra,
Murzuk, and Ghadames basins (modified from Gumati, 1996).
1.3. HISTORY OF WEST MABRUK FIELD
The West Mabruk field was discovered in the early 1960s; its development began
by Mabruk Oil Operations Company (Mabruk Oil Operations Company, 2008) in 1995.
The field is subdivided into three main parts, north, central and south (Fig 1.3). A total of
51 wells include 30 oil wells and 2 injection wells. The reserve in stock tank original oil
in place for West Mabruk field was estimated to be about 400 MMBO in 2008.

3
Figure 1.2. Map of Sirte Basin and the location of study area (modified from Lewis,
1990).
1.4. OBJECTIVES
The objective of this thesis research is to: (1) integrate seismic interpretation with
well data to interpret the depositional environments of sedimentary rocks in the study
area, (2) describe the stratigraphic pattern of the Upper Paleocene Khalifah Formation in
the western Mabruk Field using 3D seismic, well log, and geologic (formation tops) data,
and (3) recommend potential hydrocarbon plays for future hydrocarbon exploration.

4
Figure 1.3. Map showing 3-D seismic survey as outlined by the triangle and wells
locations (black dots with well names) in West Mabruk Oilfield. The west, east and
central parts of the field are colored green (modified from Mabruk Oil Operations
Company, 2008).

5
2. GEOLOGICAL SETTING
2.1. TECTONIC SETTING
The Sirte Basin was formed by block faulting which induced great subsidence that
started during Late Cretaceous (Selley, 1997). The subsidence occurred after the Tibesti-
Sirte arch collapsed to form the Sirte Basin. The Sirte Basin floor is a major
unconformity separating overlying thick Upper Cretaceous sedimentary fills from
underlying Precambrian basement (Fig. 2.1). The block faults in Sirte Basin form horsts
and graben and are characterized by an abrupt dog-leg geometry. Block faulting persisted
from mid-Cretaceous to end of Paleocene. These faults have formed a series of troughs
and platforms, such as Hon, Tagrifet, Marada, and Marsa Brega rifts, and Az zahrah-Al
bayda, Al jahamah, Zaltan and Amal platforms (Selley, 1997; Fig. 2.2). The Mabruk
Oilfield lies in the Zallah trough generated by a family of faults. Three major structures
control the Mabruk, Zahaligh, and Bustefa anticline in the field (Mabruk Oil Operations
Company, 1999). Several sequences and structural events have been identified, which
have contributed to the present structural configuration of the Sirte Basin.
2.1.1. Phase 1: Berriasian-Barremian. The first faults occurred in the southern
part of the basin at this time. Two structural trends are identified: E-W and WNW-ESE,
as the Sabratah –Cyrenaica Fault Zone (Anketell, 1993).
2.1.2. Phase 2: Aptian-Santonian. At this time a set of NE- SW faults occurred
in the Sirte Basin, signifying the syn-rift period (Mabruk Oil Operations Company,
1999). Anktell (1993) interpreted these NE-SW faults as resulting from a paleo-stress
field associated with the interaction between Europe and Africa.

6
Figure 2.1. Pre-Hercynian subcrop map in Sirte Basin area (modified from Ahlbrandt,
2001). The study area is located in the Zallah Trough in NW Sirte Basin.
The northward motion of Africa created a transtension which induced dextral
strike-slip faulting, the Sabratah-Cyrenaica Fault Zone, causing the formation of pull
apart basins in the Sirte Basin, between the Sabratah-Cyrenaica Fault Zone and the major
WNW-ESE faults of the Sarir trough. The ENE-WSW extension induced a dextral strike-
slip motion that together with the Neocomian displacements, created the fault patterns of
the Sirte Basin typical of pull-apart basins.

7
Figure 2.2. Tectonic map of the Sirte Basin, showing oil and gas distribution and its
relationship to major structural elements (modified from Rusk, 2001). The study area is
located in the Zallah Trough in NW Sirte Basin.
2.1.3 Phase 3: Santonian. A structural inversion and transtension occurred in the
Sirte Basin. This is indicated by the relative movement of the Arabo-Nubian block
toward the west and the collision of Africa with Europe (Hallett, 2002).
N

8
2.1.4. Phase 4: Campanian-Maastrichtian. Renewal of significant subsidence in
the Sirte Basin occurred due to another episode of extension and post-rift sagging.
The collision between Europe and Apulia and the NE-ward movement of the Arabo-
Nubian block reactivated the Sirte pull-apart basins and the movements along the main
faults (Hallett, 2002).
2.1.5. Phase 5: Paleocene-Late Eocene. During this period, Africa moved
strongly towards the west in the Paleocene, before resuming a NE-ward motion (Mabruk
Oil Operations Company, 1999). Accordingly extensional movements were still active in
the Sirte Basin which entered into a sag phase (Gumati & Kanes, 1985).
2.1.6. Phase 6: Latest Eocene. Locally, at the western end of the basin, the NW-
SE faulting reactivated a strike-slip feature, the Gedari fault. The strike-slip faulting was
associated with the relative motion of two plates, the Saharan in the west and the Arabo-
Nubian in the east. This can be placed in the larger context of the major collision between
the African and European plates (Gumati & Kanes, 1985).
2.1.7. Phase 7: Oligocene-Early Miocene. During the Oligocene, the northern
part of Sirte Basin and notably the Hun Trough was the center of substantial subsidence.
The change in the relative movement between Africa and Europe seemed similar to those
recorded during the Paleocene, bringing a dextral strike-slip reactivation of the Sirte
Basin faulting. Locally, during the Eocene-Oligocene, a structural reversal induced local
terrigenous sedimentation (Gumati & Kanes, 1985).
2.1.8. Phase 8: Miocene to Present. During this period, large tectonic
movements are responsible for another reactivation of NW-SE faults in the Sirte Basin in
9
response to the dextral strike-slip motions of the Sabratah-Cyrenaica Fault Zone. The
African Plate moved distinctly towards the north (Gumati & Kanes, 1985).
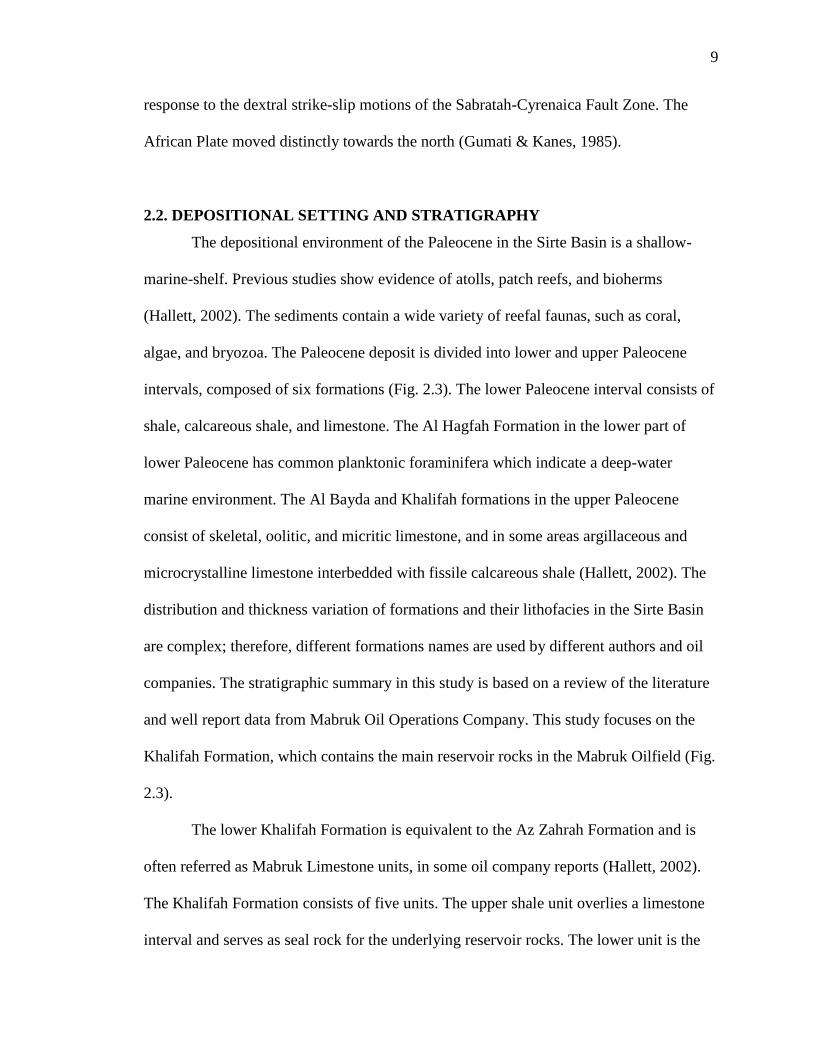
2.2. DEPOSITIONAL SETTING AND STRATIGRAPHY
The depositional environment of the Paleocene in the Sirte Basin is a shallow-
marine-shelf. Previous studies show evidence of atolls, patch reefs, and bioherms
(Hallett, 2002). The sediments contain a wide variety of reefal faunas, such as coral,
algae, and bryozoa. The Paleocene deposit is divided into lower and upper Paleocene
intervals, composed of six formations (Fig. 2.3). The lower Paleocene interval consists of
shale, calcareous shale, and limestone. The Al Hagfah Formation in the lower part of
lower Paleocene has common planktonic foraminifera which indicate a deep-water
marine environment. The Al Bayda and Khalifah formations in the upper Paleocene
consist of skeletal, oolitic, and micritic limestone, and in some areas argillaceous and
microcrystalline limestone interbedded with fissile calcareous shale (Hallett, 2002). The
distribution and thickness variation of formations and their lithofacies in the Sirte Basin
are complex; therefore, different formations names are used by different authors and oil
companies. The stratigraphic summary in this study is based on a review of the literature
and well report data from Mabruk Oil Operations Company. This study focuses on the
Khalifah Formation, which contains the main reservoir rocks in the Mabruk Oilfield (Fig.
2.3).
The lower Khalifah Formation is equivalent to the Az Zahrah Formation and is
often referred as Mabruk Limestone units, in some oil company reports (Hallett, 2002).
The Khalifah Formation consists of five units. The upper shale unit overlies a limestone
interval and serves as seal rock for the underlying reservoir rocks. The lower unit is the
10
lower Shale (Mabruk Oil Operations Company, 1999; Fig 2.4). In some areas, Mabruk
Carbonate Member is identified in the lower Khalifah Formation, and is divided into
upper, middle, and lower units composed of shale to argillaceous limestone. Coralgal
micritice limestone and red-green algal-foraminifera limestone were deposited in the reef,
back reef and lagoon environments, whereas dolomite and dolomitic limestone in the
inner shelf environment (Mabruk Oil Operations Company, 1999). The lithologic
characteristics of the units in Khalifah Formation are summarized in Table 2.1.
Figure 2.3. Lithostratigraphy of the Paleocene rocks of Sirte Basin, showing the Khalifah
Formation stratigraphic column with their equivalent (modified from Hallett, 2002).
2.3. PETROLEUM SYSTEM IN THE WESTERN SIRTE BASIN
The western Sirte Basin includes the Dur al Abd Trough, Zallah Trough, Al
Kotlah Graben and Abu Tumayam Trough. It contains a significant source rock and
different type of seals. The reservoirs are carbonate rocks. This area has a production
potential of up to 5000 BOPD per well (Hallett, 2002; Fig. 2.5).

11
2.3.1. Source Rocks. Rachmat shale, Sirte shale, and Etel Formation are the main
source rocks in the Sirte Basin. In the western Sirte Basin two Sirte shale kitchens are
present in the Zallah Trough.
The effective source rocks range in thickness from 100 to 300 m and are at peak
maturity. The generating capacity of the immature source rock was probably insufficient
to fill the reservoirs in the Zallah Trough (Hallett, 2002). It is most likely that they were
charged by migration from Maradah Trough (Roohi, 1993).
2.3.2. Seals and Traps. Rabia and Khalifah upper Shale unit is the major
extensive seals for the reservoirs in this area. Faults can be found as seals, too. The
majority of the hydrocarbon traps are structural due to Eocene tectonics. The Mabruk
Oilfield is basically occupied by anticlines with a northwesterly fault trend (Hallett,
2002).
2.3.3. Reservoirs. As a carbonate interval in a thick shale sequence, the Mabruk
Member is adequately sealed for oil accumulation. The oil in Khalifah Formation occurs
both in the upper and lower Mabruk limestone units. The thickness of upper Mabruk unit
is about 10 to 30 m. Generally, the Mabruk reservoir has the character of a reefal,
bioclastic limestone and dolomite. The porosity reaches 35 % according to core and log
analyses (Mabruk Oil Operations Company, 1999). Figure 2.6 shows the effect of
tectonic fragmentation of the Sirte Arch into a series of horsts and grabens and the
accumulations of hydrocarbon.

12
Figure 2.4. Stratigraphy and lithofacies of Mabruk Oilfield (modified from Mabruk Oil
Operations Company, 2008).
13
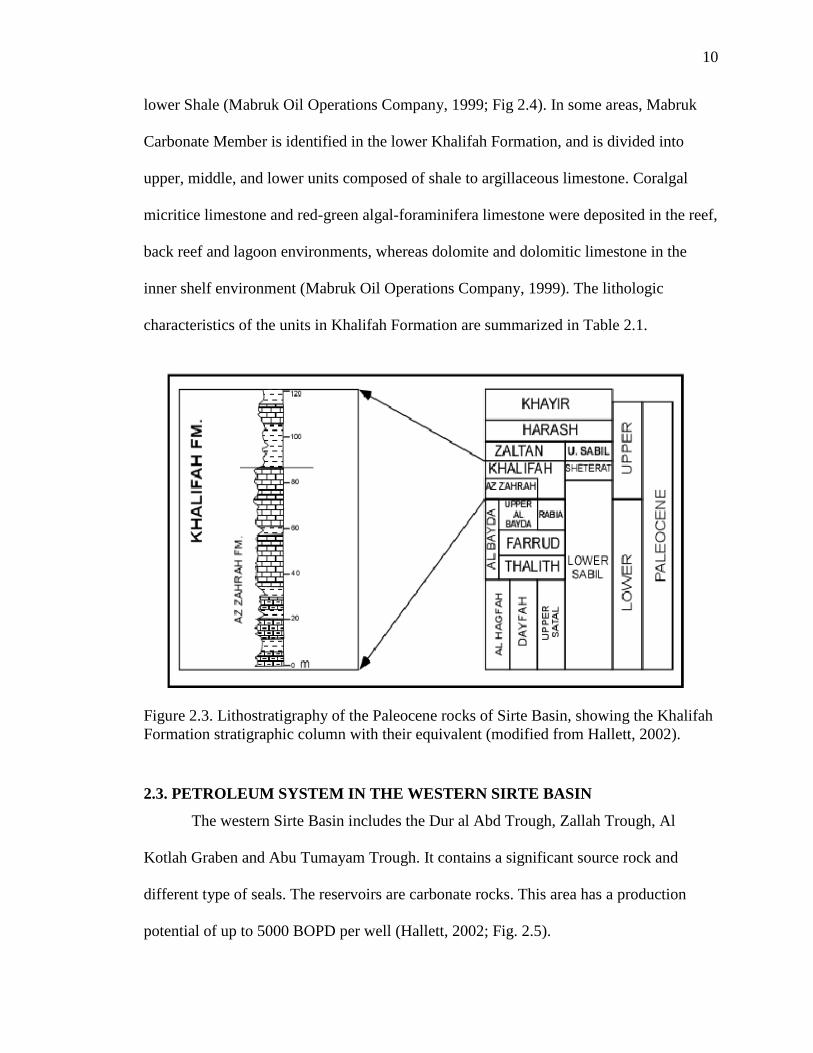
Table 2.1. Summary of lithologies of all Khalifah units.
Unit Name Lithology description
Upper Shale unit
Alternation of dark grey soft and subfissile
shales, very calcareous; white to grey very
argillaceous limestones, very calcareous soft
grey clays (Mabruk Oil Operations Company,
1999).
Upper Mabruk Limestone unit
Mainly a succession of wackestones, off-white,
micritic to fine crystalline, and packstones to
fine grainstones characterized by a poorly
developed cement (Mabruk Oil Operations
Company, 1999).
Middle Argillaceous unit Mostly a soft, grey, argillaceous mudstone
with a few beds of dark grey, very calcareous
shales (Mabruk Oil Operations Company,
1999).
Lower Mabruk unit Mostly friable mudstones and wackestones to
grainstones, interbedded with dark grey
calcareous shales (Mabruk Oil Operations
Company, 1999).
Lower Shale unit
Dark grey soft subfissile very calcareous
shales and clays with interbeds of light grey
mudstones to wackestones (Mabruk Oil
Operations Company 1999).

14
Figure 2.5. Petroleum system in the western Sirte Basin. Two mature source rocks in the
Zallah Trough and migration direction and pathway are shown (modified from Hallett,
2002).
Figure 2.6 Stratigraphic cross section of the Sirte Basin showing source rocks and
hydrocarbon accumulations (modified from Hallett, 2002).

15
3. DATA
3.1. SEISMIC DATA
Subsurface seismic and well data are used in this study. The three-dimensional (3-
D) seismic data volume contains 1000 inlines and 500 crosslines, covering the entire
West Mabruk field for about 112.8 km2. The line and trace spacings are 25 m. The total
two-way travel time is 4 seconds (Figs. 3.1 and 3.2).
Figure 3.1. 3-D seismic survey of West Mabruk Oilfield used in the study. The seismic
survey coverage is the red polygon in the block diagram.

16
Figure 3.2. Base map of seismic survey and location of the six wells in West Mabruk
Oilfield used in the study. The thick bordered area is the 3-D seismic coverage.
3.2. WELL LOG DATA
Six wells are used in this study. They are widely distributed in Mabruk Oilfield. A
suite of wireline logs in digital formats are used, including spontaneous potential (SP),
gamma ray (GR), bit size, shallow and deep resistivity, and Photo-Electric Factor logs.
Formation tops and time-depth information are from Mabruk Oil Operations Company.
Other well data include reports of thin section analysis, X-Ray diffraction, mud logs of
well cuttings, and a report of core description and analysis. These descriptions and
analyses were mostly done at the geological laboratory of Mabruk Oil
OperationsCompany. Well data are critical to this subsurface study. The following are
brief description of the principles and lithologic interpretations of several types of
wireline logs.
Well 1
Well 5
Well 6 Well 4
Well 3 Well 2
17
3.2.1. Spontaneous Potential (SP). The Spontaneous potential (SP) log is one of
the earliest measurements used in the petroleum industry. It is used for determining gross
lithology by differentiating permeable from impermeable zones. The SP response is
produced by direct current potential which is developed spontaneously between a
moveable electrode in the well bore and a fixed electrode in the surface. The difference in
salinities between mud filtrate and formation water create the electrochemical factor
within permeable beds. The SP log can also be used to determine the volume of shale in
permeable beds and formation-water resistivity (Asquith and Kryqowski, 2004).
3.2.2. Gamma Ray. Gamma Ray (GR) log is a record of natural radioactivity in
formations. The radioactivity recorded comes from three radioactive elements. The main
use of the GR log is identification of lithology. Shale has a high gamma-ray reading due
to its large amount of radioactive material. Therefore, GR signals are generally a good
indicator of shales and can be used to calculate volume of shale in porous reservoirs
(Asquith and Kryqowski, 2004).
3.2.3. Porosity Logs. Three logs are used to calculate porosity. Neutron and
density logs are nuclear measurements, and acoustic (sonic) logs are measurements of
time interval over which acoustic wave travels through rocks. However, to get more
accurate porosity estimates, two or three of them are combined (Asquith and Kryqowski,
2004).
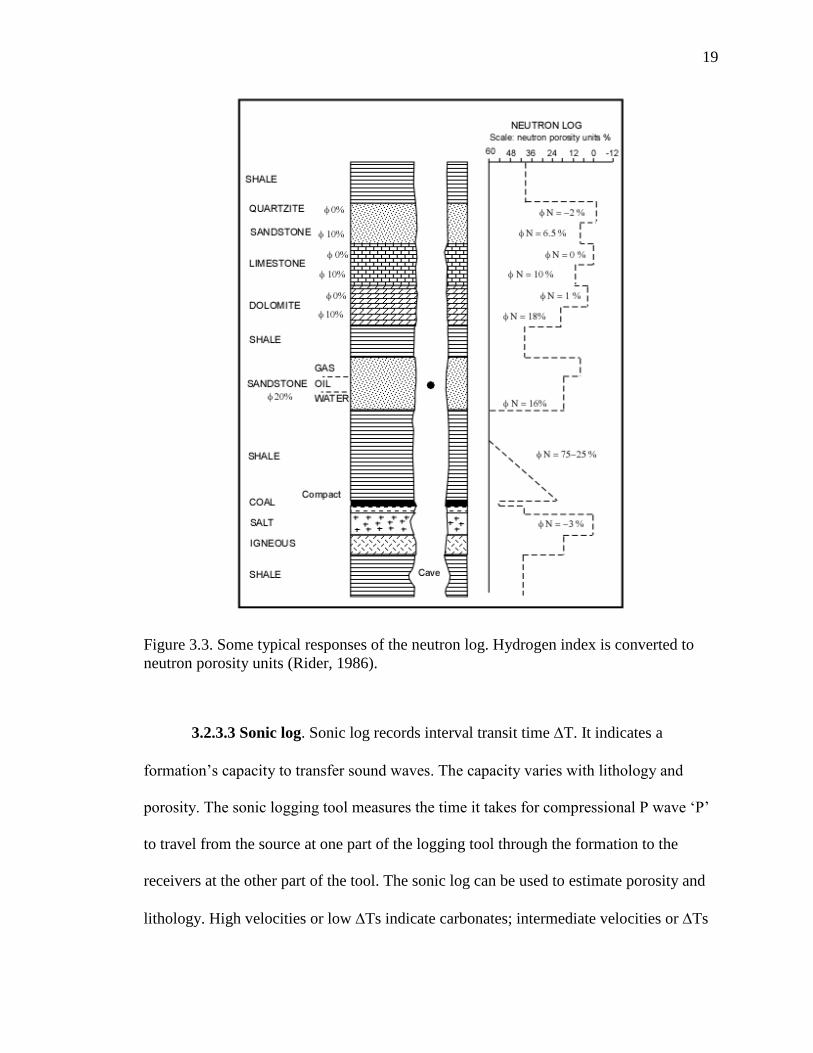
3.2.3.1 Neutron log. Neutron log (PHIN) is a porosity log which is
a measurement of the hydrogen concentration in the formation. Neutron logging tools has
a chemical source which generates neutrons. When these neutrons collide with hydrogen
atoms in the formation, a gamma ray is emitted and recorded, which indicates an energy
18
loss. This is related to the water-filled porosity of a formation (Asquith and Kryqowski,
2004). The hydrogen index is the richness in hydrogen in the formation which is
converted to neutron porosity (Rider, 1986; Fig. 3.3).
3.2.3.2 Density log. Density logs are used for the calculation of porosity. A
density logging tool is held against the side of a borehole. It has a source of caesium-137
or an acceleration-based source in some newer tools. This source emits gamma ray at
0.662 MeV. The tool also has two types of detectors short and long-spaced. Two separate
density values are recorded by density logging, one is the bulk density (b) which is the
density of the entire formation and the other is matrix density (ma), which is the density
of the solid framework of the rock. The density log can assist the geologist to evaluate
shaly-sand reservoirs and complex lithologies and indentify evaporate minerals (Asquith
& Krygowski, 2004). The density porosity can be calculated using the formula below or
be determined from a complied chart:
D =
Where:
D = density derived porosity,
ma = matrix density,
b = formation bulk density from the log reading (g /cm3), and
fl = average fluid density dependent on fluid type.
19
Figure 3.3. Some typical responses of the neutron log. Hydrogen index is converted to
neutron porosity units (Rider, 1986).
3.2.3.3 Sonic log. Sonic log records interval transit time T. It indicates a
formation’s capacity to transfer sound waves. The capacity varies with lithology and
porosity. The sonic logging tool measures the time it takes for compressional P wave ‘P’
to travel from the source at one part of the logging tool through the formation to the
receivers at the other part of the tool. The sonic log can be used to estimate porosity and
lithology. High velocities or low Ts indicate carbonates; intermediate velocities or Ts

20
sandstone and low velocities; or high Ts shale (Fig.3.4). The sonic log is used also in
seismic interpretation to estimate seismic interval velocities, and to generate a synthetic
seismogram (Rider, 1986).
Figure 3.4. Some typical responses of the sonic log. The ability of different lithologies to
transmit sound waves varies (Rider, 1986).
21
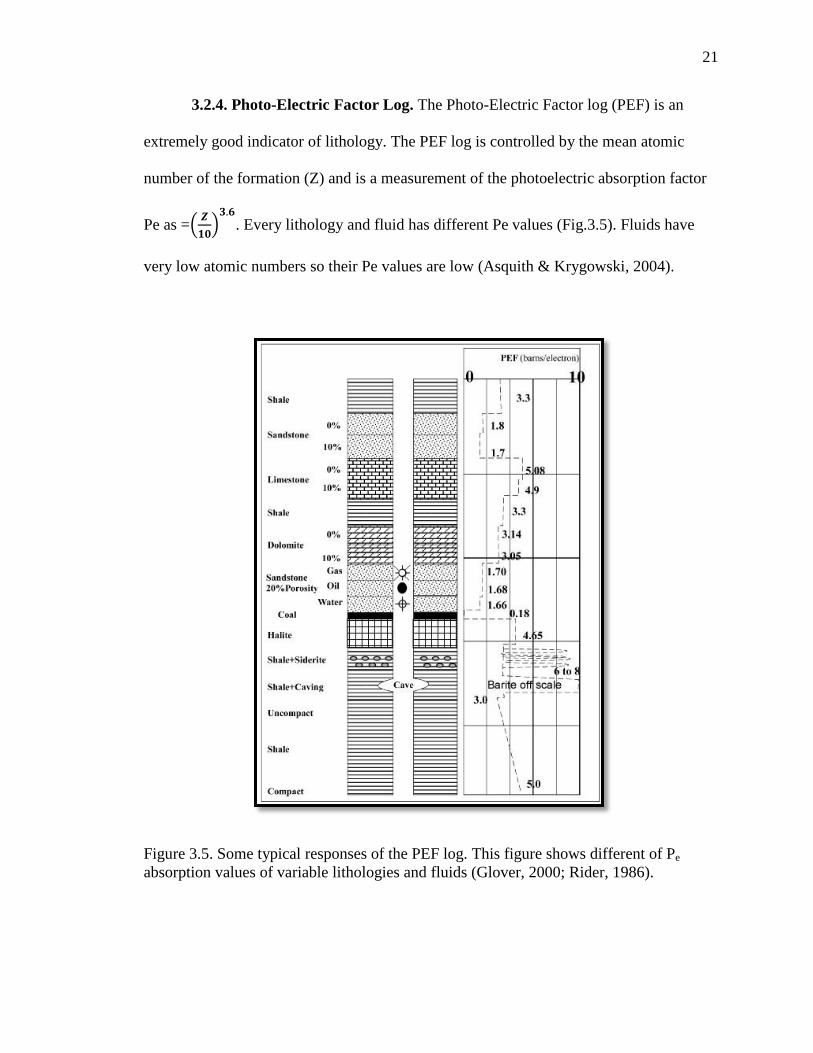
3.2.4. Photo-Electric Factor Log. The Photo-Electric Factor log (PEF) is an
extremely good indicator of lithology. The PEF log is controlled by the mean atomic
number of the formation (Z) and is a measurement of the photoelectric absorption factor
Pe as =(
)
. Every lithology and fluid has different Pe values (Fig.3.5). Fluids have
very low atomic numbers so their Pe values are low (Asquith & Krygowski, 2004).
Figure 3.5. Some typical responses of the PEF log. This figure shows different of Pe
absorption values of variable lithologies and fluids (Glover, 2000; Rider, 1986).
22
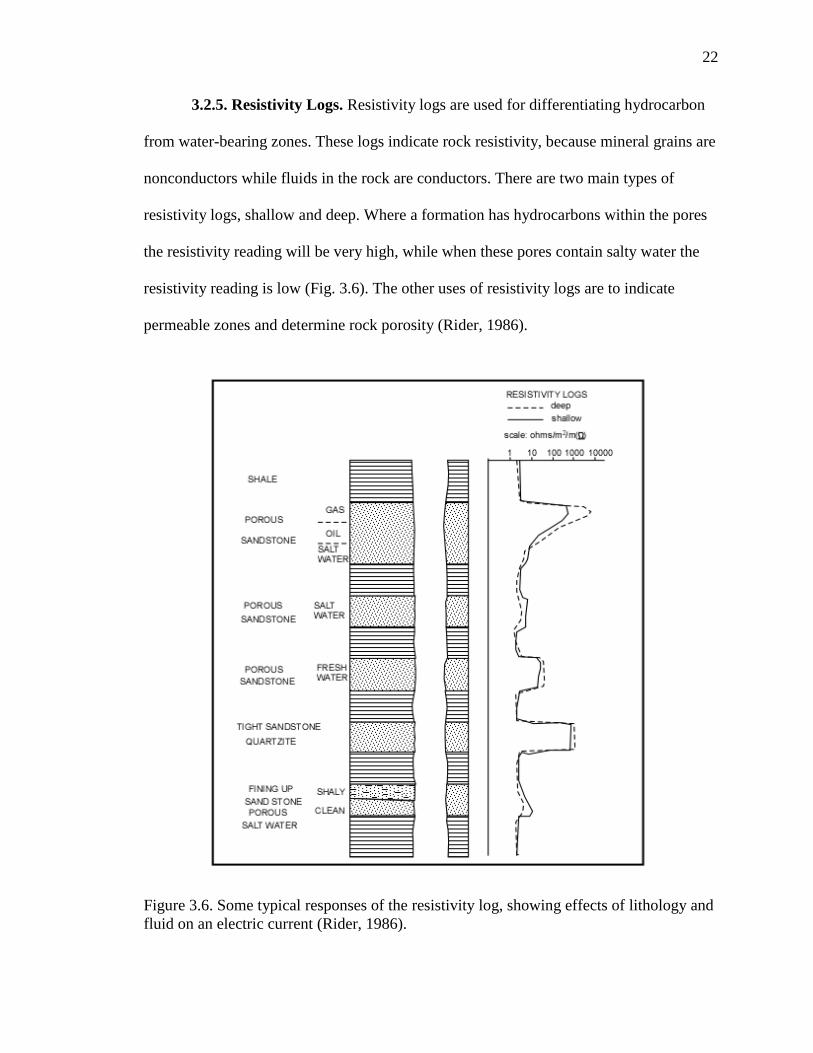
3.2.5. Resistivity Logs. Resistivity logs are used for differentiating hydrocarbon
from water-bearing zones. These logs indicate rock resistivity, because mineral grains are
nonconductors while fluids in the rock are conductors. There are two main types of
resistivity logs, shallow and deep. Where a formation has hydrocarbons within the pores
the resistivity reading will be very high, while when these pores contain salty water the
resistivity reading is low (Fig. 3.6). The other uses of resistivity logs are to indicate
permeable zones and determine rock porosity (Rider, 1986).
Figure 3.6. Some typical responses of the resistivity log, showing effects of lithology and
fluid on an electric current (Rider, 1986).

23
3.3. INTERPRETATION SOFTWARE
Kingdom Suite TM
is a commercial software for subsurface geologic
interpretations used in this study. Kingdom Suite (TKS) is a windows-based application
and has various modules for different tasks in subsurface geological analysis. It was used
for horizons picking, structural and isopach mapping, cross-sections construction, and
various two and three-dimensional graphing. Three modules were used in this study.
2D/3D-EarthPAK package was used for display and editing wells, horizon interpretation,
cross section construction, and map generation. SynPAK package was used to generate
synthetic seismogram, display synthetics on seismic section, and well-to-seismic
calibration. VuPAK package was used to display seismic sections, horizons, and
structural and isopach maps in 3-D to identify geological features.

24
4. METHODOLOGY
4.1. WELL LOG ANALYSIS
4.1.1. Lithology Calibration. A main step in this study was calibrating the
wireline log signature to lithologies identified on thin section, cores, and mud logs. This
step was very important in order to accurately interpret lithologies from wireline logs in
intervals without direct lithologic observations.
4.1.2. Crossplot Analysis. Many crossplots were constructed using wireline log
readings, such as GR, PEF, sonic, and resistivity logs. The crossplots were used as
templates to interpret and understand the lithologic variations of six wells. GR log is the
most effective log and gives good separation for each rock type when being cross plotted
against other logs (Figs. 4.1, 4.2, 4.3, and 4.4).
4.1.3. Cycle Analysis. Six large-scale cycles (termed low-order cycles, see
discussions below) were identified on the basis of trends of lithologic repetitions
interpreted from wireline logs. Three levels of cycles were interpreted, high,
intermediate, and low orders. These orders indicate the depositional environmental
change in variable scales. The low order cycles shows the changes in regional scale in
order to correlate stratigraphic patterns in the entire area of study.
4.2. SEISMIC INTERPRETATION
4.2.1. Synthetic Seismogram. A synthetic seismogram was created by using
sonic log, density log, GR log, and seismic wavelet. Time-depth (TD) charts are made
from well checkshots and used as local TD charts to generate the synthetic seismograms.
25
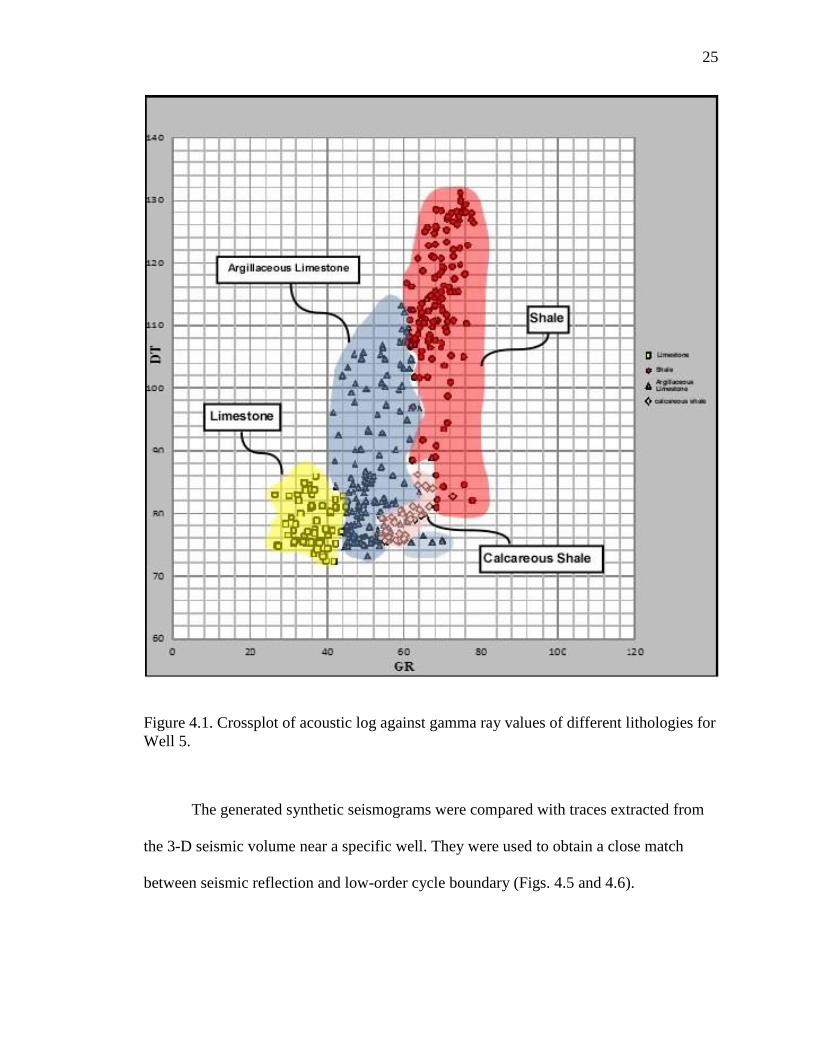
Figure 4.1. Crossplot of acoustic log against gamma ray values of different lithologies for
Well 5.
The generated synthetic seismograms were compared with traces extracted from
the 3-D seismic volume near a specific well. They were used to obtain a close match
between seismic reflection and low-order cycle boundary (Figs. 4.5 and 4.6).

26
Figure 4.2. Crossplot of photo-electric factor log against gamma ray log vales for Well 5.
There is good separation among the rock types.
4.2.2. Well-to-Seismic Calibration. Well-seismic ties were achieved by
correlating reflections on the seismic section with the synthetic seismogram through good
visual matching of individual peaks and troughs and their patterns. GR logs from all six
wells were used in the calibration and correlation (Fig. 4.7).
4.2.3. Horizon Picking. The seven cycle boundaries were picked as seven
surfaces and each one was highlighted with a specific color (Fig. 4.8). Each horizon was
confirmed by well-calibration within the seismic sections.

27
Figure 4.3. Crossplot of deep resistivity log against gamma ray log for Well 1.
The horizons were interpreted every five to ten seismic sections by manual
picking due to great discontinuity in seismic reflection and for quality control. Depth
values of picked horizons were used to generate structural and isopach maps. The
horizons subdivide the sections into cyclostratigraphic units and show the geometry of
the six low-order cycles.

28
Figure 4.4. Crossplot of neutron log against gamma ray log for Well 3.
4.3. MAP INTERPRETATION.
One of the most important procedures used to understand geology is mapping
individual cycles. Structural and isopach maps were generated in order to delineate the
structural and stratigraphic features in the study area.
4.3.1. Structural Maps. Structural maps show the locations of structural highs
and lows (i.e., anticlines and synclines) and faults. In this study, seven structural maps
were generated for each cycle boundaries (e.g., Fig. 4.9).

29
Figure 4.5. A synthetic seismogram constructed for Well 2 using Ormsby-type wavelet
calculated from the seismic traces. The seven blue dashed lines are the low-order cycle
boundaries.

30
Figure 4.6. A synthetic seismogram for Well 4, constructed using the same parameters as
in Fig 4.5.

31
Figure 4.7. A synthetic seismogram of Well 2 overlaid on a vertical seismic section
(inline 4485) in order to tie the well data to seismic sections.
4.3.2. Isopach Maps. Isopach maps show spatial variation of thickness of a
stratigraphic interval. These values display the amount of sediment deposition within the
Mabruk Oilfield. Seven isopach maps were generated for each cycle and all cycles as a
whole (e.g., Fig. 4.10).
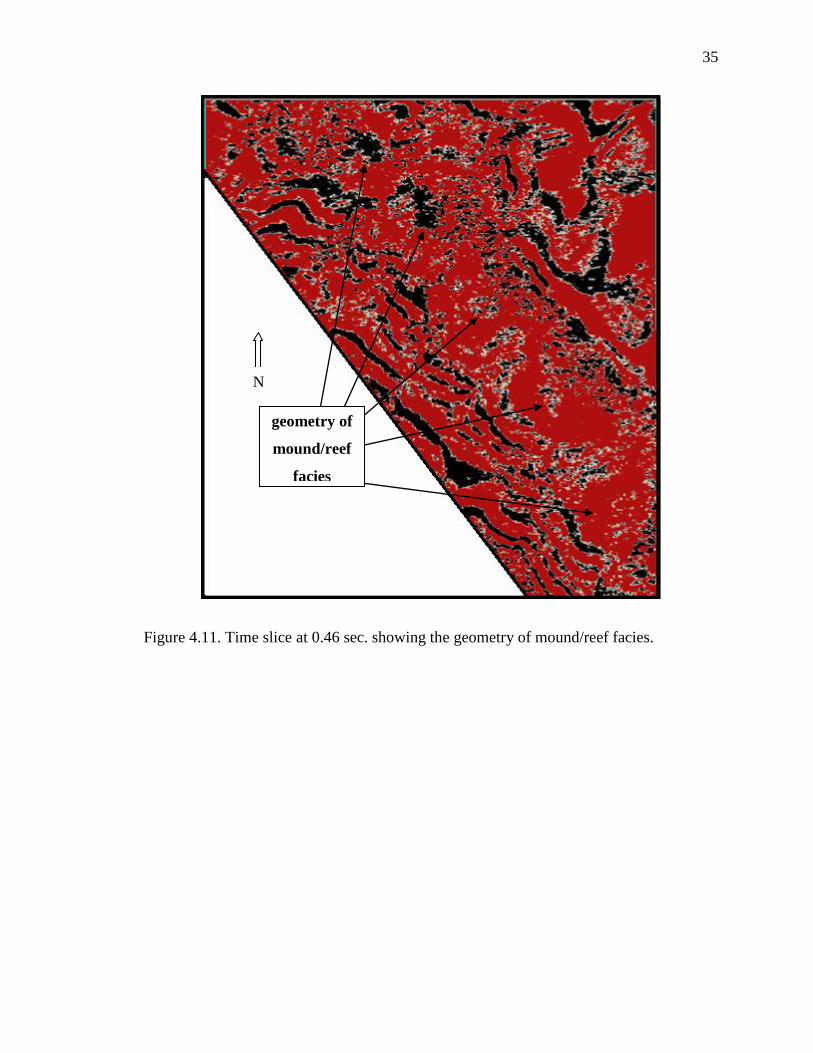
4.3.3. Time Slices. Time slices are horizontal sections in a 3-D seismic volume.
They provide an internal view on the horizontal geometric pattern of interpreted horizons
and the horizontal dimension to aid in seismic interpretation on the 2-D vertical sections.
For example, the time slice at 0.46 sec shows an asymmetrical pattern of reef facies (e.g.,
Fig. 4.11).

32
Figure 4.8. Seven cycles boundaries on seismic inline 4490. They were extracted from
synthetic seismogram of Well 2.

33
Figure 4.9. Structural contour map of the base of low-order cycle 1. The areas of a hot
color (yellow and orange) are sallower than areas of a cool color (blue and green).

34
Figure 4.10. Isopach contour map for low-order cycle 5. The areas of a hot color (yellow
and orange) are thicker area than those with a cool color (blue and green).
35
Figure 4.11. Time slice at 0.46 sec. showing the geometry of mound/reef facies.
N
geometry of
mound/reef
facies

36
5. RESULTS AND INTERPRETATIONS
5.1. STRUCTURAL CONFIGURATIONS OF THE STUDY AREA
Two types of structures in the study area were observed on structural maps,
seismic vertical sections, and horizontal slices. This study focuses on structures of the
Khalifah Formation only.
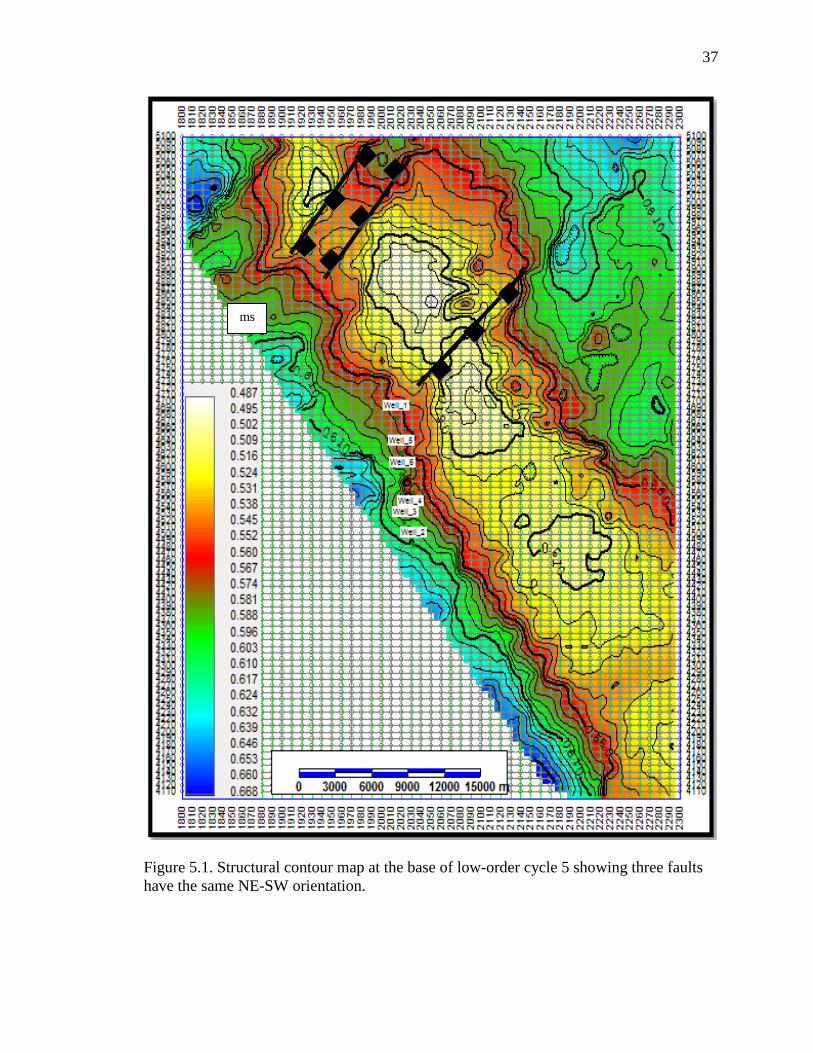
5.1.1. Faults. Three faults were interpreted (Fig. 5.1). They all are oriented NE-
SW and perpendicular to the fold axis (see section below). The faults are normal faults.
The first fault (F1 on Fig. 5.1) is located in the northwestern part of the study area and
dips to the southeast with a direction of S56.8E and an angle of 13.5º degrees. The second
fault (F2) is parallel to F1 with a dip direction of N35W and angle of 19.3º. The last fault
(F3) is located in the center of the field, dipping S45E at an angle of 8º. Figure 5.2 shows
cross section E-W crossing the first two series of faults.
The fact that all the faults are normal and parallel to each other suggests that they
were probably formed in the same extension episode. In addition, faulting is probably
associated folding because faults are perpendicular to the fold axis.
5.1.2. Folds. An anticline and two possible flanking synclines were identified in
the study area (Figs. 5.3, 5.4). The anticline is symmetrical and oriented NW-SE. Its
hingeline is undulating, suggesting that there was another episode of folding after the
anticline was formed. The second episode of folding may have been caused by a NE-SW
compressional stress perpendicular to that of the first episode. Two structural lows flank
the anticline to the NE and SW. The secondary features are four lows located within the
main structural high. These lows are perpendicular in direction with the highest structure.
37
Figure 5.1. Structural contour map at the base of low-order cycle 5 showing three faults
have the same NE-SW orientation.
ms

38
Figure 5.2. An E-W cross section (upper panel) shows a series of faults located in the
northern study area. The section location is marked on the structural map of the entire
interval of study (lower panel).
LC6
LC5
LC4
LC3 LC2 LC1
39
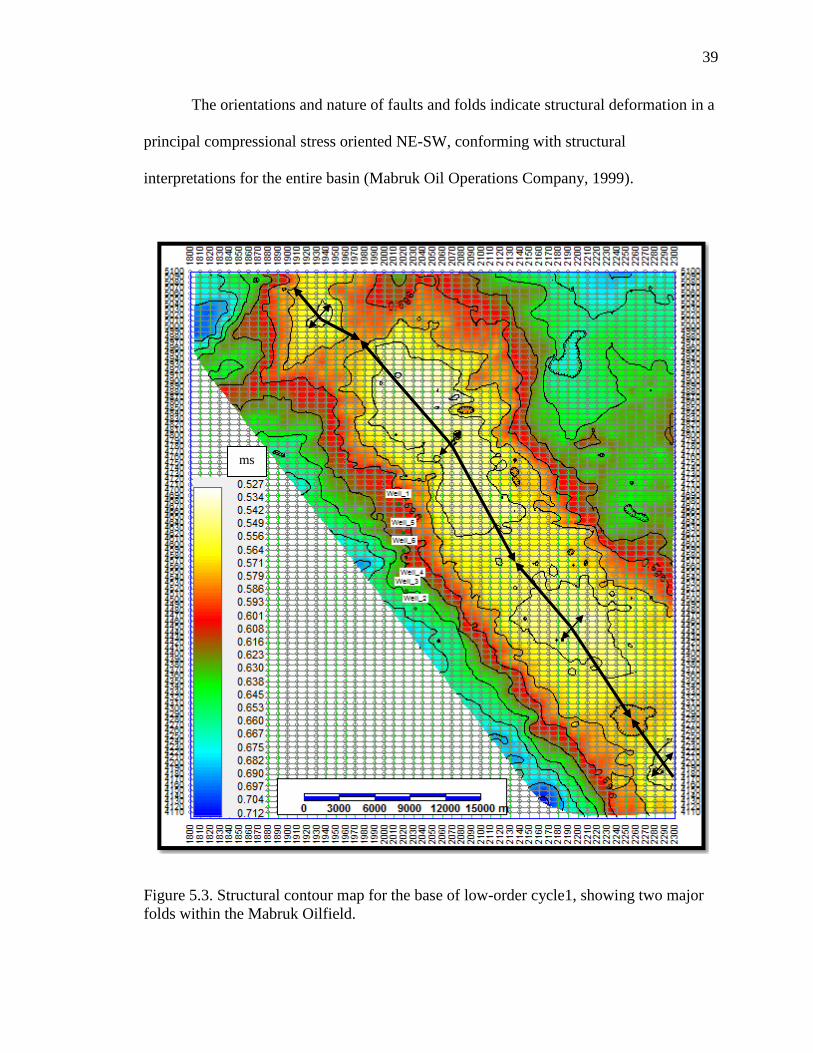
The orientations and nature of faults and folds indicate structural deformation in a
principal compressional stress oriented NE-SW, conforming with structural
interpretations for the entire basin (Mabruk Oil Operations Company, 1999).
Figure 5.3. Structural contour map for the base of low-order cycle1, showing two major
folds within the Mabruk Oilfield.
ms

40
Figure 5.4. A NW-SE Cross section showing the main structural high in the center of the
study area (upper panel). The red arrow shows the main high in the seismic cross section
and in the structure map (lower panel) at the top of low-order cycle 6.

41
5.2. STRATIGRAPHIC ARCHITECTURE AND CYCLE DEVELOPMENT
Sedimentologic and stratigraphic interpretations of the Khalifah Formation in the
study area were based on wireline log signatures, well cross section, seismic facies,
stratal geometry and termination patterns on seismic sections, and isopach maps.
5.2.1. Cyclostratigraphy of Khalifah Formation. The Khalifah Formation is
composed of shale-dominated and limestone-dominated couplets throughout. These
couplets constitute lithologic cycles, suggesting cyclic sedimentation of siliciclastic and
carbonate sediments in the study area. They also may reflect fundamental controls, such
as accommodation space, sediment supply, climate, tectonics, and depositional dynamics
on cyclic sedimentation.
The cycles were first identified on wireline logs on the basis of interpreted
lithologies. Three levels of shale-carbonate cycles were identified on well logs (Fig. 5.5).
The high-order cycles are 0.1-1s m thick; intermediate-order cycles 1-10s m thick; and
low-order cycles 10s m thick (Table 5.1). The thickness of low-order cycles is at the scale
matching the seismic resolution. Hence, low-order cycles are the focus of well log
analysis and are used to calibrate seismic interpretations via synthetic seismograms.
The low-order cycles are correlated on well structural cross sections (Fig. 5.6;
Appendix). The cycles vary in thickness laterally and vertically, from 14-53 m for
individual cycles and 181-197 m for the total thickness of all cycles. Although all
individual cycles have a lower shale-rich and upper limestone-rich interval, the thickness
ratio between the two intervals varies laterally without apparent relationship with the
cycle thickness. The correlation establishes a low-order cyclostratigraphic framework that
can be transferred to seismic sections.

42
Figure 5.5. An example of well delineation of cycles. Three different orders of cycles
were interpreted based on the wireline-logs and changes in interpreted lithology.
Table 5.1. Thickness in meters of six low-order cycles in six wells in the study area.
Well 1 Well 2 Well 3 Well 4 Well 5 Well 6
Cycle 6 35.97 21.80 29.26 32.15 31.39 31.7
Cycle 5 40.84 53.18 44.50 44.5 45.87 41.15
Cycle 4 41.49 39.02 45.42 42.22 41.91 42.82
Cycle 3 33.83 19.51 16.76 24.38 22.25 26.67
Cycle 2 15.55 21.79 21.49 14.48 25.61 14.33
Cycle 1 29 39.32 34.90 34.44 16.46 24.38
Total 196.68 194.62 192.33 192.17 183.49 181.05

43
Finally, the well-based cyclostratigraphy is transferred to seismic sections that
cross the wells. Locations of cycle boundaries on synthetic seismograms (Fig. 4.5) are
correlated to nearby seismic traces. Away from wells, the boundaries were interpreted
from termination patterns of seismic reflections, which include parallel, top lap, down
lap, on lap, truncation patterns. After iterative interpretations, a low-order
cyclostratigraphic framework is established in the entire study area (e.g., Fig. 5.7). The
following discussions are based on such a framework.
5.2.2. Characteristics of Low-Order Cycle 1. Low-order cycle 1 consists of a
lower shale-rich part and an upper limestone-rich part. The lower part is interbedded with
some thin argillaceous limestone in the basal part, and changes gradually to dominantly
argillaceous limestone in the upper part (Fig. 5.6; Appendix). Laterally, the amount of
limestone in the upper part of the shale-rich interval increases to the south, for example,
comparing wells 1 and 2 in Figure 5.8. The thickness of the lower shale-rich part is about
15 m on average on the well cross section. The upper limestone-rich part consists of
argillaceous limestone in the basal part and gradually changes to pure limestone upward.
On the well cross section, the upper limestone-rich part of low-order cycle 1 becomes
more argillaceous to the south (e.g., Fig. 5.9).
On seismic sections, low-order cycle 1 contains two seismic facies. The first
facies is composed of roughly parallel, continuous, and high to moderate-amplitude
reflections. It correlates mainly to the argillaceous carbonate deposits. The second facies
is composed of short, randomly-oriented or domal, discontinuous, variable amplitude
reflections.

44
Figure 5.6. A simplified page-size well cross section of the six low-order cycles.

45
Figure 5.7. Two seismic cross sections show examples of the six low-order cycles in both
crossline and inline.
Laterally, the limestone-rich interval changes from seismic facies 1 to 2; but
seismic facies 1 is volumetrically dominant. In addition, the upper part is about 10 m
thick on average, and thickens to the south (Fig. 5.9).
Inline 4873
crossInline 2064

46
The isopach map of the entire cycle shows an overall thickening trend from
southwest (minimum thickness of 5 m) to northeast (maximum thickness of 17 m), then
slight thinning further to the northeastern corner of the study area (minimum 11 m) (Fig.
5.10). The thickness trends are oriented grossly NW-SE. Last, the shale-rich interval in
low-order cycle 1 is thicker than the limestone-rich interval with a gradational boundary.
5.2.3. Characteristics of Low-Order Cycle 2. Low-order cycle 2 is similar to
cycle 1 and also consists of a lower shale-rich part and an upper limestone-rich part. The
lower part is shale dominated with interbedded thin calcareous shale and argillaceous
limestone in the basal part. The seismic facies of the lower shale-rich interval is
characterized by high amplitude and parlor seismic pattern (Fig. 5.11). The upper
limestone-rich interval is limestone dominated with interbedded thin argillaceous
limestone in the basal part (Fig. 5.12). Laterally, it also becomes richer in limestone to
the south (comparing wells 1 and 2 in Figure 5.6). Similar to cycle 1, the upper
limestone-rich interval also consists of two seismic facies. The first facies is composed of
parallel, continuous, and high-amplitude reflections. The first facies changes laterally to
facies two. Facies two shows short, domal amplitude. The thickness of lower-order cycle
2 is about 17 m on average on the well cross section (Table 5.1). Overall, the proportion
of limestones in the cycle increases to the south (Fig. 5.6; Appendix). The isopach map
shows a rather consistent and uniform thickness pattern with an average thickness of 15
m across the entire study area (Fig. 5.13).
However, the isopach thins and thicks show two subtle perpendicular trends, one
oriented NW-SE, the other SW-NE. The shale-rich interval in low-order cycle 2 is
thinner than the limestone-rich interval with a gradational boundary.

47
Figure 5.8. Examples of lithologic and cyclostratigraphic analyses using well data for
low-order cycle 1 in Well 1 (upper panel) and Well 2 (lower panel). Lithologic
interpretations from wireline logs were used to delineate high, intermediate, and low-
order cycles. For high-order cycles, the shale-rich interval is marked with an arrow to the
right, suggesting an approximate deepening-upward trend, whereas the upper limestone-
rich interval is marked with an arrow to the left, suggesting a shallowing-upward trend.
The intermediate-order cycles are separated by a horizontal line as the cycle boundary,
which coincides, in some cases, with the boundary of high-order cycles because
intermediate-order cycles are delineated on the basis of high-order cycle trend. Each
intermediate-order cycles are marked with a vertical arrow, suggesting an overall
shallowing-upward trend. Low-order cycles contain a lower shale-rich and an upper
limestone-rich interval and are also marked with a vertical arrow, suggesting a large-scale
shallowing-upward trend. Comparison of lithology and thickness between wells 1 and 2
displays lateral changes in cycle thickness, thickness ratio between the shale-rich and
limestone-rich intervals, and lithology at variable scales. See well locations in Fig. 3.2.
Well 1

48
Figure 5.9. Seismic crossline 2093 showing an example of seismic stratal geometry of a
mounded feature with off-lapping convex-up reflections, which suggests a coral reef
facies within Khalifah Formation. The red arrow shows the geometry of mound/reef
facies.
Figure 5.10. Isopach contour map of low-order cycle 1.

49
Last, in comparison to cycle 1, the proportion of limestone-rich interval in cycle 2
is also greater; and the thickness of cycle 2 is smaller than cycle 1.
Figure 5.11. The six low-order cycles in a seismic cross section crossline 2177. The first
three cycles in the lower part (low-order cycles 1,2, and 3) have a seismic facies pattern
indicating shale rich deposits, while the upper three cycles show a seismic facies pattern
with more limestones.

50
Figure 5.12. The lithology and component high and intermediate-order cycles of low-
order cycle 2 in Well 2.
Figure 5.13. Isopach contour map of low-order cycle 2.
Low-order cycle 2 Well 2

51
5.2.4. Characteristics of Low-Order Cycle 3. Low-order cycle 3 consists of a
lower argillaceous limestone part and an upper limestone-rich part. Argillaceous
limestones are common in the lower part and are interbedded with thin shales in the basal
part (Fig. 5.14) and increasing amount of limestone in the upper part. There are no
significant changes of the lower part on well cross section (Fig. 5.6). The seismic facies
of the lower argillaceous limestone is characterized by downlap and toplap patterns (Fig.
15). The upper limestone-rich is limestone dominated with interbedded thin argillaceous
limestone in the basal part (Fig. 5.14).
On seismic sections, as in cycle 1, low-order cycle 3 contains two seismic facies.
The first facies is composed of roughly parallel, continuous, and high-amplitude
reflections. It correlates mainly to the argillaceous carbonate deposits. The second facies
is composed of short, randomly-oriented, domal, high-amplitude reflections and
correlates mainly to the limestone. In some areas, the limestone-rich interval changes
laterally from seismic facies 1 to 2; but seismic facies 2 is volumetrically dominant (Fig.
15). Low-order cycle 3 is about 26 m thick on average on the well cross section, and
overall thickens from north to south (Fig. 5.6; Appendix).
On the isopach map, the low-order cycle 3 averages less than 13 m thick.
Thickness is almost uniform, especially in the center (Fig. 5.16). The facies pattern
indicates common carbonate deposition. In the seismic cross-section, the reflections
indicate a small circular shape which is the outline of a carbonate buildup of possible reef
facies (Figs. 5.9, 5.15).
The isopach map of low-order cycle 3 shows numerous small, irregular-elongate
patches of thins and thicks, many of which are oriented NW-SE and NE-SW. The overall

52
thickness pattern is rather uniform; and there is no regional thickening from SW to NE as
of cycles 1 and 2. Some irregular to elongate thicks, for example, in the middle of the
study area, are interesting. They correlate with mounded features on vertical seismic
sections as seismic facies 2. They resemble the geometry of depositional build-ups and
were interpreted as reef facies. Figure 5.17 shows seismic cross section through the
elongate body with a clear reef geometry.
Figure 5.14. The lithology and component high and intermediate-order cycles of low-
order cycle 3 in Well 1.
Limestone
Argillaceous
Limestone
Shale
Well 1

53
Figure 5.15. Some downlap and toplap termination patterns in seismic cross section
oriented NE-SW. The red arrows are interpretations of reflection terminations and
seismic facies unit. Notice the typical mounded shape and high-amplitude top boundary.
Figure 5.16. Isopach contour map of low-order cycle 3.

54
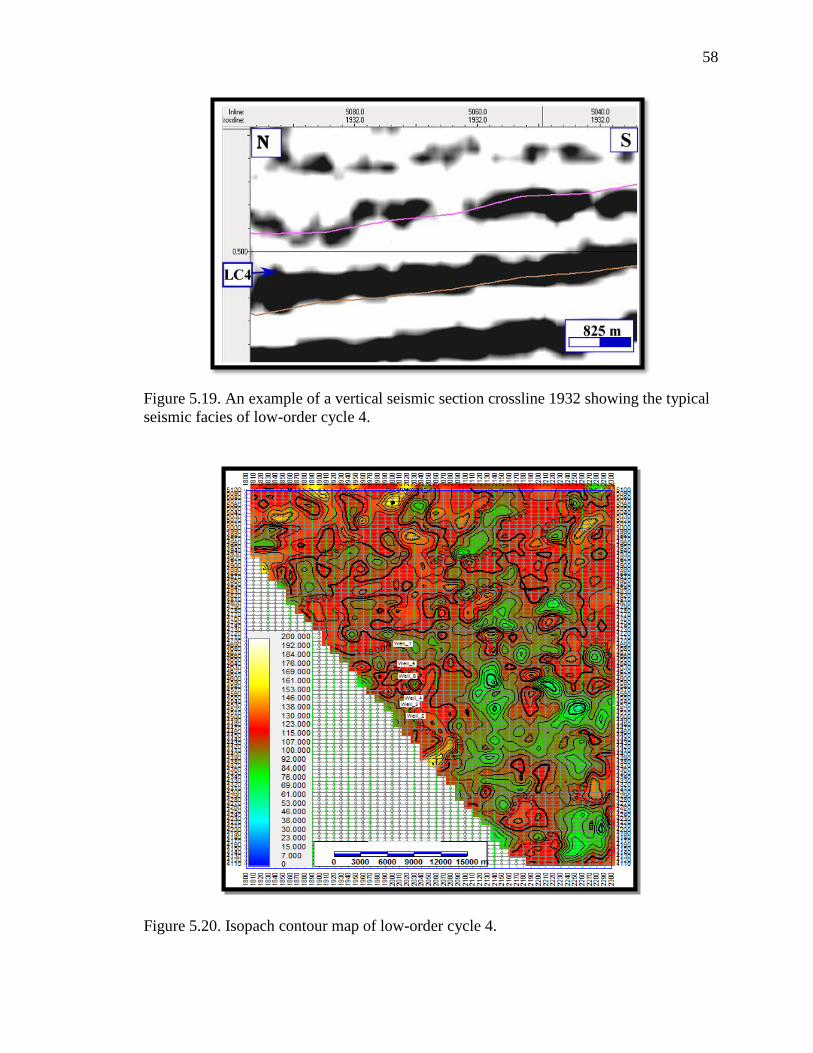
5.2.5. Characteristics of Low-Order Cycle 4. Low-order cycle 4 consists of a
lower shale-rich part and an upper limestone-rich part. Some argillaceous limestones are
present in the basal part of the shale-rich interval and decrease laterally to the south (Fig.
5.18). The thickness of the lower shale-rich part increases in thickness from Well 1 in the
north to Well 6 in the center of the field and then decreases in thickness to the south to
Well 2 (Fig. 5.6; Appendix). The thickness of the lower shale rich part is about 17.50 m
on average on the well cross section. On the seismic sections, the lower part shows
parallel and high amplitude reflections (Fig. 5.19).
The upper limestone-rich part consists of argillaceous limestone in the basal part
and gradually changes to mainly pure limestone in the upper part (Fig. 5.6; Appendix). In
addition, the amount of limestone increases from Well 1 in the north to Well 4 in the
south then decreases further south to Well 2 (Fig. 5.6). The thickness of the upper
limestone-rich part, similar to lower shale-rich part, increases to the south. It is about 25
m on average on the well cross section.
Low-order cycle 4 is about 40 m thick on average on the well cross section. On
the seismic sections, it contains two facies. The first has parallel and high-amplitude
reflections and the second is a random-oriented and high amplitude seismic facies. On the
isopach map, low-order cycle 4 averages 40 m thick. Overall, the cycle is thick
(maximum ~50 m) in the north and thin (minimum ~30 m) in the south (Fig. 5.20).
The isopach thins and thicks are patchy and irregular, although some are
somewhat elongate and show vague NW-SE and NE-SW orientations. The thickness
difference is quite dramatic, as shown on seismic sections (Fig. 5.21). Cycle 4 overall is
thicker than cycle 3 (Fig. 5.18).

55
Figure 5.17. Isopach contour map of low-order cycle 3 with northwest-southeast cross
sections (inline and crossline) through the thick area.

56
5.2.6. Characteristics of Low-Order Cycle 5. Low-order cycle 5 consists of a
lower shale-rich part and an upper argillaceous limestone part. The lithology of the lower
part is shale dominated and interbedded with thin argillaceous limestone in the basal part
(Fig. 5.22). Some argillaceous limestones are present in the basal part of the shale-rich
interval and increases laterally to the south (Fig. 5.6; Appendix). The thickness of the
lower shale rich part is about 21 m on average on the well cross section.
The seismic facies of the lower shale-rich interval is characterized by high
amplitude and parallel seismic patterns. The upper limestone-rich part consists of
argillaceous limestone in the basal part and gradually changes to pure limestone upward.
On the well cross section, the upper limestone-rich part of low-order cycle 5 becomes
richer in limestone to the south. The seismic facies shows short, domal low amplitude
(Fig. 5.23). The thickness of the upper limestone-rich part is about 23m on average on the
well cross section (Table 5.1).Overall, the proportion of limestones in the cycle increases
to the south (Fig. 5.6; Appendix). The low-order cycle 5 is the thickest cycle with about
47 m on average on the well cross section.
On the isopach map, the low-order cycle 5 is more than 70 m thick. Its isopach
map has two major features. The first is around 90 m thick and has an elongated
geometry. The second feature is perpendicular with the first one and around 70 m thick
with an elongate shape. The other area is around 50 m thick with irregular geometry (Fig.
5.24).
5.2.7. Characteristics of Low-Order Cycle 6. Low-order cycle 6 consists of a
lower argillaceous limestone part and an upper limestone-rich part. The lithology of the
lower part is argillaceous limestone dominated, except in Well 1, which consists shale

57
Figure 5.18. Lithology and component high and intermediate-order cycles in low-order
cycle 4 in Well 6.
Limestone
Argillaceous
Limestone
Shale
Low-order cycle 4 Well 6
58
Figure 5.19. An example of a vertical seismic section crossline 1932 showing the typical
seismic facies of low-order cycle 4.
Figure 5.20. Isopach contour map of low-order cycle 4.

59
Figure 5.21. A seismic section crossline 2032 showing the thickness change from north to
south of low-order cycle 4.
interbedded in the basal part and argillaceous limestone gradually changing to limestone
in the upper part (Fig. 5.25). The thickness of the lower argillaceous limestone part is
about 15 m on average on the well cross section (Fig. 5.6; Appendix). The upper
limestone-rich part consists of argillaceous limestone in the basal part and gradually
changes to pure limestone upward. It has an average thickness of about 20 m on the well
cross section. On the well cross section, the thickness of the low-order cycle 6 is about 30
m on average and decreases to the south.
On seismic sections, the seismic facies is composed of roughly parallel,
continuous, and high to moderate-amplitude reflections. It correlated mainly to the
argillaceous carbonate deposits (Fig. 5.26).

60
On the isopach map, low-order cycle 6 averages about 17 m thick. (Fig. 5.27)
Similar to low-order cycle 5, this cycle has a major thinning trend in the same direction.
The thickness changes gradually from around 5 m in the south to around 20 m in the
north.
Figure 5.22. The lithologic interpretation and component high and intermediate-order
cycles in low-order cycle 5 in Well 5.
Low-order cycle 5 Well 5

61
Figure 5.23. An example of vertical seismic section crossline 2049 showing the typical
limestone seismic facies of low-order cycle 5.
Figure 5.24. Isopach contour map of low-order cycle 5.

62
Figure 5.25. Lithology and component high and intermediate-order cycles of low-order
cycle 6 in Well 1.
Figure 5.26. An example of vertical seismic section inline 4737 showing the typical shale
seismic facies of low-order cycle 6.

63
Figure 5.27. Isopach contour map of low-order cycle 6.
5.3. CHARACTERISTICS OF KHALIFAH FORMATION
Lithology and thickness of the Khalifah Formation composed of the six low-order
cycles as discussed above show systematic changes in some aspects. Low-order cycle 1 at
the base of the formation has the thickest shale-rich interval and the largest shale-
limestone ratio. Upward, shale-rich intervals of low-order cycles contain more
argillaceous limestones; limestones in limestone-rich intervals contain more pure
limestones (Fig. 5.28).
On seismic sections, mounded seismic facies become more common upward.
Laterally, the Khalifah Formation contains mounded limestones in some areas but well-
bedded shale and limestone in other areas.

64
Figure 5.28. Isopach Map for all low-order cycles showing the distribution of
depositional facies in the area.
Low-order cycles, in general, become thicker upward, although the ratio between
shale-rich and limestone-rich intervals varies. Laterally, the formation is thick in mound-
rich areas and thin in well-bedded shale and limestone areas. Finally, the thick and
mound-rich intervals and areas coincide with structural highs (Fig. 5. 28, 4.9, 5. 29) and
the mound-rich facies are especially concentrated along the edges of structural highs with
convex geometry. The thickest area down slope of the well-laminated facies is located in
the north to northwest of the field, and it increase in thickness toward the northeast. This
area has an elongate geometry and ranges from 160 to 200 m in thickness. The thinnest

65
part is the shale dominated facies in the southwest, as low as 90 m. The other area has a
trend oriented to the northwest and is about 150 m thick. Most of the reef facies are
located in the central part of the area.
The mounded facies are interpreted as possible reefs on the basis of their stratal
geometry, cyclostratigraphic position, and modern and ancient analogs (Figs. 5.7, 5.13).
On the other hand, well-bedded shales and limestones are interpreted as sediments
deposited in low-energy environments away from reefs. They may have been deposited
in relatively deep-water shelf environment basinward of the reefs or in back-reef
environment landward of the reefs. The type of reefs, namely barrier or patch reefs,
cannot be determined from data and interpretations in this study. However, the irregular
geometries of mounded features as shown on seismic sections and isopach maps suggest
that the reefs are likely to be patch reefs (Figs. 5.30, 5.31).
The trends of normal faults and structural highs and lows conform to the regional
structural trends of troughs and platforms or grabens and horsts (Figs. 2.1, 2.2). It is
apparent that the development of mound/reef facies located on structural highs was
mainly controlled by the tectonic elements in the study area.
Finally, cyclic sedimentation of shale-rich and limestone-rich cycles at three
different orders may reflect multiple orders of relative sea-level changes. A high sea level
may flood the Mabruk platform, causing decreased carbonate deposition and increased
siliciclastic mud deposition, and vice versa. In summary, the development of
cyclostratigraphy of the Khalifah Formation was probably controlled by a combination of
tectonic and structural movement, depositional dynamics of reef growth, and sea-level
changes.

66
Figure 5.29. Structural contour map of the top of low-order cycle 6. The areas in the hot
color (yellow and orange) are sallower than areas in cool color (blue and green).
67
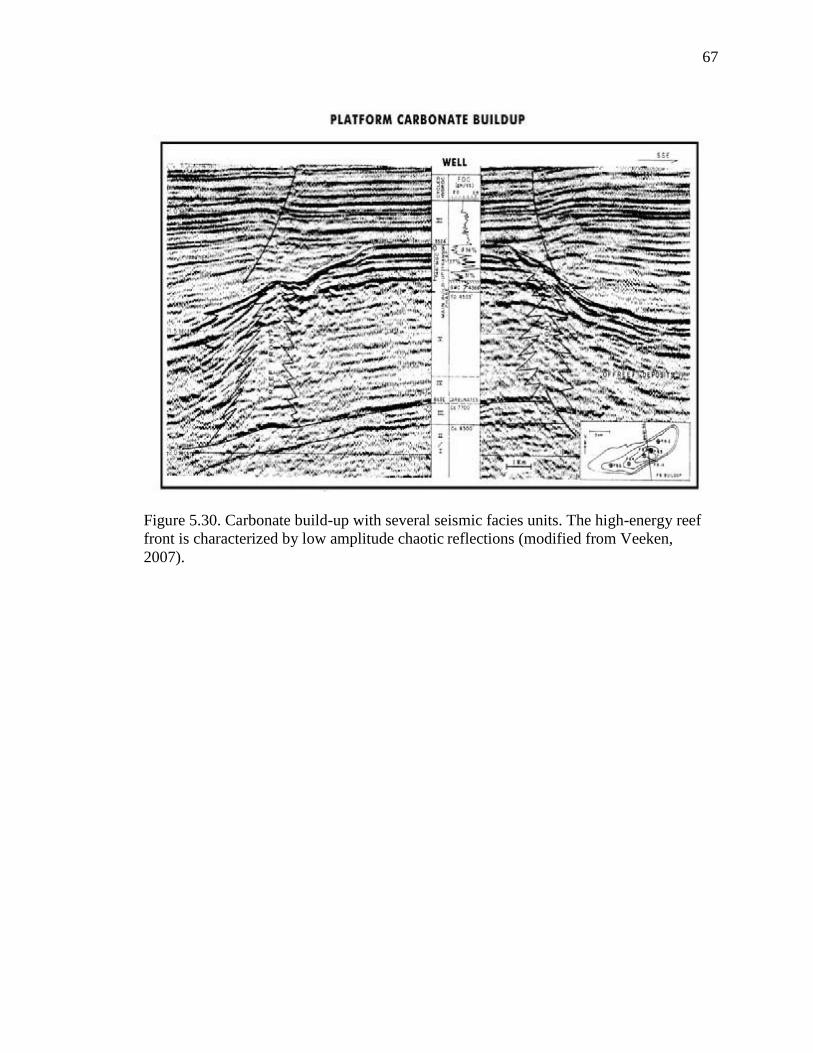
Figure 5.30. Carbonate build-up with several seismic facies units. The high-energy reef
front is characterized by low amplitude chaotic reflections (modified from Veeken,
2007).

68
Figure 5.31. Carbonate build-up with several seismic facies in Mabruk Oilfield. A).
Seismic section of inline 4886 showing the geometry of coral reef within Khalifah
Formation. B). Carbonate build-up with several seismic facies units in inline 4886. The
red arows shows onlap geometry.
4950 m4950 m
LC6
LC5
LC4
LC3
LC2
LC1
EW
4950 m
Reef
W E
LC6
LC5
LC4
LC3
LC2
LC1
B
4950 m
Reef
W E
LC6
LC5
LC4
LC3
LC2
LC1
B
A

69
6. CONCLUSIONS
The Khalifah Formation is composed of six low-order depositional cycles and
many intermediate and high-order cycles. It passes into deep and shallow-water
depositional facies. These cycles changed gradually from upward-deepening shale-
dominated in the basal part to upward-shallowing limestone-dominated in the upper part.
The thickness of the six low-order cycle is variable in the study area.
Cycle top surfaces on seismic sections and horizontal slices record a geometry of
coral reefs. The formation contains three depositional facies: down slope well-laminated
facies, reef facies, and shale dominated facies. The change of the limestone thickness and
proportion of limestones between the platform and reef facies can be explained as catch
up and keep up carbonate deposition.
There are many factors that control the changes of lithology and thickness of
these cycles. A combination of tectonic, structural movement and sea-level changes
probably had controlled the variations in cycle characteristic in the study area.
Low order cycle 3 probably has the greatest exploration potential in the study
area, especially in the structural highs, on the basis of seismic and well data and
interpretation. This cycle is the richest in the carbonate rock content, and may contain
some sweet spots in the seismic sections, suggesting hydrocarbon accumulation in this
cycle interval.

70
APPENDIX
Included with this thesis is a CD-ROM, which contains a well cross section of the
six low-order cycles and all the logs with their lithology. The cross section prepared as
images and the logs as acrobat reader files.
71
BIBLIOGRAPHY
Alhlbrandt, T. S. (2001). The Sirte Basin Province of Libya- Sirte- Zelten Total
Petroleum System . Denver: U.S. Geological Survey Bulletin 2202–F.
Anketell, J. M. (1993). Structural History of the Sirt Basin and its Relationships to the
Sabratah Basin and Cyrenaican Platform, Northern Libya. The Geology of Sirt
Basin , III, 57-87.
Asquith, G., & Krygowski, D. (2004). Basic Well Log Analysis. Tulsa: AAPG.
Barr, F. T., & Weegar, A. A. (1972). Stratigraphic Nomenclature of Sirte Basin, Libya.
Tripoli: The Petroleum Exploration Society of Libya.
Colley, B. B. (1963). Libya: Petroleum Geology and Development. 1-10.
Conant, L. C., & Goudarzi, G. H. (1967). Stratigraphic and tectonic framework of Libya.
AAPG bulletin , 51, 719-730.
Glover, P. (2000, 10 29). Petrophysics MSc Course Notes. Retrieved 9 14, 2000, from
http://www2.ggl.ulaval.ca/personnel/paglover/CD%20Contents/GGL-
66565%20Petrophysics%20English/Chapter%2014.PDF.
Gumati, Y. D., & Kanes, W. H. (1985). Early Tertiary Subsidence and Sedimentary
Fades—Northern Sirte Basin, Libya. AAPG , 69, 39-52.
Gumati, Y. D., & Schamel, S. (1988). Thermal Maturation History of the Sirte Basin,
Libya. Journal of Petroleum Geology , 205-218.
Gumati, Y. D., W. H. Kanes, and S. Schamel. (1996). An evaluation of the hydrocarbon
potential of the sedimentary Basins of Libya. Journal of Petroleum Geology , 19,
95-112.
Hallett, D. (2002). Petroleum Geology of Libya. Amsterdam: Elsevier B. V.
Lewis, C. J. (1990). Sarir Field. American Association of Petroleum GeologistsTreatise
of Petroleum Geology , 253-263.

72
Mabruk Oil Operations Company (1999). Depositional Facies and Sedimentological
Model of West Mabruk Oil Field (Sirt Basin,Libya)( internal report).
Mabruk Oil Operations Company (2002). Mabruk field structural study (internal report).
Mabruk Oil Operations Company (2008). 2008 West Mabruk Geomodal Report, Sirt
Basin,Onshore Libya (internal report).
Rider, M. H. (1986). The Geological Interpretation of Well Logs. Glasgow and London:
Blackie Halsted Press.
Roohi, M. (1993). A Geological View of Source-Reservoir Relationships in the Western
Sirt Basin. The Geology of Sirt Basin , 2, 323-336.
Rusk, D. C. (2001). Petroleum Potential of the Underexplored Basin Centers a Twenty
First Century Challenge. AAPG , 429-452.
Saheel, A. S., Bin Samsudin, A., & Bin Hamzah, U. (2010). Regional geological and
tectonic structures of the Sirt basin from. American journal of Scientific and
Industrial Research , 448-462.
Schroter, T. (1996). Tectonic and Sedimentary Development of the Central Zallah
Trough. The Geology of Sirt Basin , 3, 123-135.
Selley, R. C. (1997). African Basins. Amsterdam: Elsevier Science. B. V.
Selley, R. C. (1998). Elements of Petroleum Geology. San Diego: Academic Press.
Veeken, P. (2007). Seismic Stratigraphy, Basin Analysis and Reservoir Characterisation
(Vol. 37). Amsterdam: Elsevier.
Westaway, R. (1993). Active Tectonic Deformation in Sirt Basin and its Surroundings.
The Geology of Sirt Basin , III, 89-100.

73
VITA
Salah Abdurzak Shaniba was born in Tripoli, Libya, on April 22, 1981. He
received his Bachelor’s degree in geological engineering from University of Tripoli-
Libya (formerly El-Fateh University) in 2006. Salah was selected by ExxonMobil to
receive a scholarship to study for an advanced degree in the United States in July, 2008.
He is a member of American Association of Petroleum Geologists (AAPG), Society of
Exploration Geophysicists (SEG), and European Association of Geoscientists and
Engineers (EAGE). He enrolled in the MS program of the Geology and Geophysics
Program, Department of Geological Science and Engineering at Missouri University of
Science and Technology in August, 2010. He received his Masters degree in Geology and
Geophysics from Missouri University of Science and Technology in August 2012.