depositional environment and provenance of the late aptian to early
TRANSCRIPT

DEPOSITIONAL ENVIRONMENT AND PROVENANCE OF THE LATE APTIAN TO EARLY ALBIAN CUMMINGS FORMATION, EAST CENTRAL ALBERTA,
AND A DISCUSSION CONCERNING SECONDARY SOURCE ROCK POTENTIAL
Robert Pelkey
Submitted in Partial Fulfilment of the Requirements for the Degree of Bachelor Sciences, Honours
Department of Earth Sciences Dalhousie University, Halifax, Nova Scotia
March 2006
DalhoUSie University Department of Earth Sciences' Halifax, Nova Scotia
Canada B3H 3)5
(902)494-2358FAX (902) 494-6889
AUTHOR:
TITLE:
Degree:
Permission is herewith granted to Dalhousie University to circulate and to have copied fornon-commercial purposes, at its discretion, the above title upon the request of individuals orinstitutions.
Signature of Autho^
THE AUTHOR RESERVES OTHER PUBLICATION RIGHTS, AND NEITHER THETHESIS NOR EXTENSIVE EXTRACTS FROM IT MAY BE PRINTED OR OTHERWISEREPRODUCED WITHOUT THE AUTHOR'S WRITTEN PERMISSION.
THE AUTHOR ATTESTS THAT PERMISSION HAS BEEN OBTAINED FOR THEUSE OF ANY COPYRIGHTED MATERIAL APPEARING IN THIS THESIS (OTHER THANBRIEF EXCERPTS REQUIRING ONLY PROPER ACKNOWLEDGEMENT INSCHOLARLY WRITING) AND THAT ALL SUCH USE IS CLEARLY ACKNOWLEDGED.

i
DEPOSITIONAL ENVIRONMENT AND PROVENANCE OF THE LATE APTIAN TO EARLY ALBIAN CUMMINGS FORMATION, EAST
CENTRAL ALBERTA, AND A DISCUSSION CONCERNING SECONDARY SOURCE ROCK POTENTIAL
Robert Pelkey
Through the interpretation of one cored section located within the Provost Oil Field of east central Alberta, the late Aptian to early Albian Cummings Formation, found within the Lower Mannville Group, has been interpreted as a transgressive estuary deposit. Basal channel incision followed by valley-fill deposits exhibit progressive marine influence through the presence of characteristic tidal bundles and asymmetrical current ripples demonstrating subordinate current flow. A low diversity suite of biogenic sedimentary structures, mixed Skolithos and Cruziana ichnofacies, also adhere to a transgressive estuarine depositional model. Abundant detrital chert, volcanic and lithic fragments observed through mineralogical analyses indicate a Cordilleran provenance. Organic petrographic analyses of organic matter within the Cummings Formation suggest a terrestrial source of potential gas producing type III kerogen. Vitrinite reflectance and rock evaluation results suggest the Cummings Formation is thermally immature. Poor total organic carbon percentages designate the Cummings Formation as being inadequate as a secondary source rock for the Provost Oil Field. Further understanding of depositional environments and sequence stratigraphic relationships within the Western Canadian Sedimentary Basin (WCSB) provides insight into hydrocarbon emplacement. This study also provides further stratigraphic resolution of the complex interval between the Lower and Upper Mannville Groups. Key Words: Western Canadian Sedimentary Basin, depositional environment, Cummings Formation, Mannville Group, physical and biogenic sedimentary structures, provenance, organic petrography, source rock, hydrocarbons.
ii
TABLE OF CONTENTS ABSTRACT i TABLE OF CONTENTS ii TABLE OF FIGURES iii LIST OF PLATES iv TABLE OF TABLES iv ACKNOWLEDGEMENTS 1 CHAPTER 1 – INTRODUCTION 1 1.1 Objectives 1 1.2 Geological Setting 1 1.2.1 A Rising Cordillera and the Formation of the Western Canadian Sedimentary Basin
1
1.2.2 The Western Canadian Sedimentary Basin 4 1.2.3 Stratigraphic Framework of the Western Canadian Sedimentary Basin 5 1.2.4 Stratigraphy of the Study Area 5 1.3 Previous Work 9 CHAPTER 2 – DEPOSITIONAL ENVIRONMENT OF THE FORELAND BASIN SUCCESSION
11
2.1 Cretaceous Deposition 11 2.1.1 First Clastic Wedge 11 2.1.2 Second Clastic Wedge 15 2.1.3 Third Clastic Wedge 19 2.2 Mannville Deposition 19 CHAPTER 3 – METHODS 24 3.1 Methods 24 3.1.2 Core Descriptions 24 3.1.3 Transmitted and reflected-light microscopy 25 3.1.4 X-ray Diffraction 25 3.1.5 Vitrinite Reflectance 26 CHAPTER 4 – RESULTS 28 4.1 Core Descriptions 28 4.1.1 Lithofacies F 31 4.1.2 Lithofacies E 33 4.1.3 Lithofacies D 33 4.1.4 Lithofacies C 34 4.1.5 Lithofacies B 34 4.1.6 Lithofacies A 35 4.2 Thin Section Mineralogy 36 4.2.1 Transmitted and reflected-light microscope observations 38 4.3 X-ray Diffraction results 45 4.4 Organic Petrography and Hydrocarbon Maturity using Vitrinite Reflectance 49 CHAPTER 5 – DICUSSION 66 5.1 Depositional Environment and Sequence Stratigraphy of the Cummings Formation
66

iii
5.1.1 Lithofacies F 66 5.1.2 Lithofacies E 70 5.1.3 Lithofacies D 71 5.1.4 Lithofacies C 72 5.1.5 Lithofacies A and B 73 5.2 Provenance of the Cummings Formation 76 5.3 Source Rock Potential and Thermal Maturity of Organic Matter and Reservoir Compartmentalization
79
CHAPTER 6 – CONCLUSIONS 83 6.1 Conclusions 83 6.2 Recommendations for Further Work 84 Reference 86 APPENDICES A-Plates of Core B-Core Description Sheets C-XRD analyses Raw Data D-Rock Evaluation Data
TABLE OF FIGURES
Figure 1.1 – Map of the Study Area 2 Figure 1.2 – Cross Sectional View of the Evolution of the Rocky Mountain Thrust and Fold Belt
3
Figure 1.3 – Stratigraphic Column of the Study Area 7 Figure 2.1 – Structural Elements of the Western Canadian Sedimentary Basin 12 Figure 2.2 – a) Map view of the Sedimentary Basin showing major geographical areas and cross section line b) Cross Sectional map of foreland basin succession
14
Figure 2.3 – Paleogeographical map of Alberta during Early Aptian 17 Figure 2.4 - Paleogeographical map of Alberta from Late Aptian to Early Albian 18 Figure 2.5 – Cross sectional view of sequence stratigraphic relationships within the study area
21
Figure 2.6 – Isopach map of the transgressive systems tract of the basal unconformity of the foreland basin succession
22
Figure 2.7 – Interpretive map of the drainage networks on the basal unconformity of the foreland basin succession
23
Figure 4.1 – Core Summary of the upper cored interval of Well 3B 29 Figure 4.2 – Bulk mineralogy of thin section 3B-1 of Lithofacies F 39 Figure 4.3 – Bulk mineralogy of thin section 3B-2 of Lithofacies F 41 Figure 4.4 – Bulk mineralogy of thin section 3B-3 of Lithofacies B 43 Figure 4.5 – Spectral plots acquired from XRD analyses 45 Figure 4.6 – Maceral types located in Sample 1 50 Figure 4.7 – Maceral types located in Sample 2 53

iv
Figure 5.1 – Example of a tide-dominated estuary 66 Figure 5.2 – Basal Cummings Formation contact 67 Figure 5.3 – Summary of interpretations 75 Figure 5.4 – Hydrocarbon generation model 81
LIST OF PLATES
Plate 1 – Matrix supported silt rip-up clasts 57 Plate 2 – Imbricated silt rip-up clasts along a bedding plane 58 Plate 3 – Vertical Skolithos burrows 59 Plate 4 – Skolithos and Planolites burrows 60 Plate 5 – Reaction halos surrounding sulfide mineralization 61 Plate 6 – Tidal couplets 62 Plate 7 – Current ripples 63 Plate 8 - Lenticular bedding 64 Plate 9 – Reactivation surface 65
TABLE OF TABLES
Table 1 – Identified lithofacies, with corresponding thicknesses 30 Table 2 – Summary of mineralogy of the upper cored interval of well 3B 37 Table 3 – Vitrinite reflectance results 55
ACKNOWLEDGEMENTS
First and foremost I would like to thank my supervisor, Dr. Grant Wach, for providing me the opportunity to learn from his vast experience in sedimentology and sequence stratigraphy. I would also like to thank him for encouraging me in the field of earth sciences. I would like to thank visiting scholar Dr. Yawooz Kettaneh for his support and guidance in my mineralogical analysis. I am also grateful for the opportunity to work with Mike Avery of the Geological Society of Canada (Atlantic). His dedication to my work and success are very much appreciated. One must mention Gordon Brown and his expertise in thin section preparation. I would like to thank my fellow classmates for making this experience real and enjoyable. Finally, I would like to thank my family and friends for their everlasting support.

1
CHAPTER 1 - INTRODUCTION
1.1 Objectives
The purpose of this thesis is to determine the depositional environment, sequence
stratigraphic relationships and provenance of the Lower Cretaceous Cummings
Formation in east central Alberta (Fig. 1.1). This is done through the interpretation of the
upper cored interval and lower cored interval of the Suncor well 3B-23-36-06WO4M
(3B) from the Provost oil field. The provenance is determined through an investigation
of the mineralogy using transmitted and reflected- light microscopy supported by X-ray
diffraction (XRD). Source rock potential and thermal maturity of organic matter found
within the Cummings Formation were assessed using vitrinite reflectance values and rock
evaluation data. Maceral characterization is completed through the use of an incident and
fluorescent light microscope. This study provides greater understanding to the complexity
and ambiguity of the boundary between the Lower and Upper Mannville Group.
1.2 Geological Setting
1.2.1 A Rising Cordillera and Western Canadian Sedimentary Basin
The westward drift of the North American plate, initiated by the rifting of the
Atlantic Ocean beginning in the Mid-Jurassic, created a rising Cordillera leading to the
development of the Western Canadian Sedimentary Basin (WCSB) (Mossop and Shetsen
1994). This westward movement resulted in the collision of converging oceanic terranes
and amalgamated super terranes from the converging plate to the west (Fig. 1.2).

Chapter 1 - Introduction 2
Figure 1.1- Map of the study area including location plots of the wells using the Dominion Land Survey System
Chapter 1 - Introduction 3
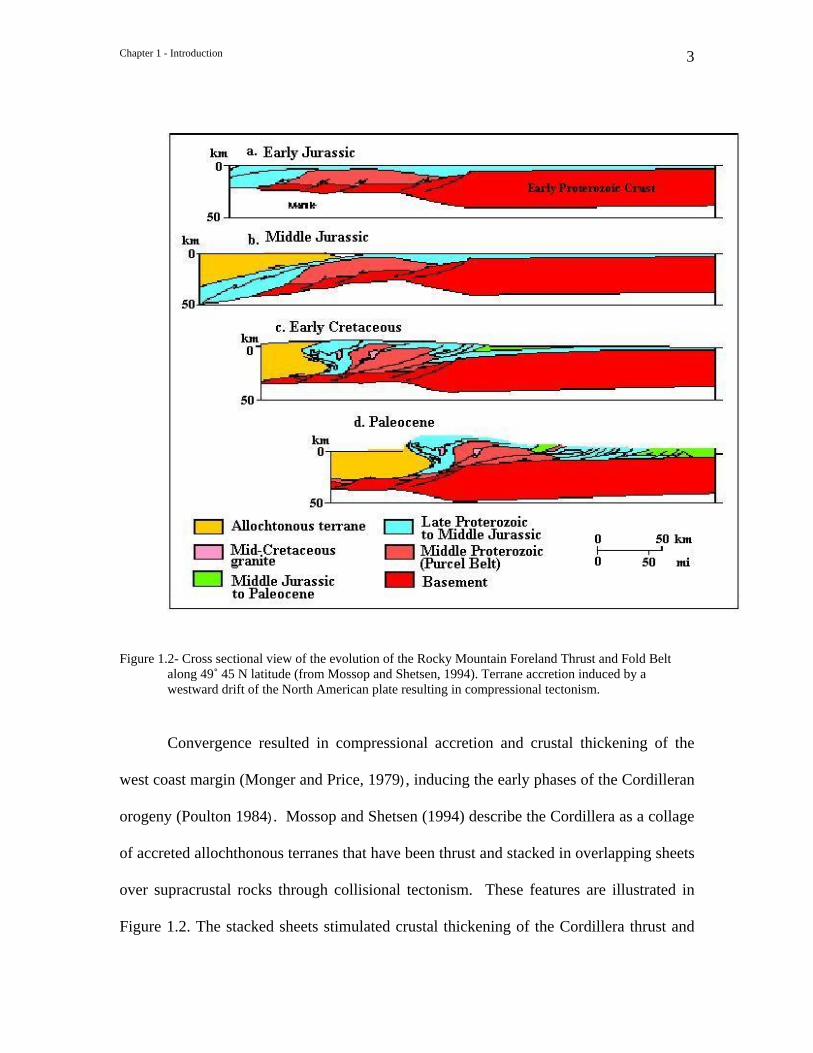
Figure 1.2- Cross sectional view of the evolution of the Rocky Mountain Foreland Thrust and Fold Belt
along 49˚ 45 N latitude (from Mossop and Shetsen, 1994). Terrane accretion induced by a westward drift of the North American plate resulting in compressional tectonism.
Convergence resulted in compressional accretion and crustal thickening of the
west coast margin (Monger and Price, 1979), inducing the early phases of the Cordilleran
orogeny (Poulton 1984). Mossop and Shetsen (1994) describe the Cordillera as a collage
of accreted allochthonous terranes that have been thrust and stacked in overlapping sheets
over supracrustal rocks through collisional tectonism. These features are illustrated in
Figure 1.2. The stacked sheets stimulated crustal thickening of the Cordillera thrust and

Chapter 1 - Introduction 4
fold belt, generating an overpowering imbalance in isostatic equilibrium resulting in
isostatic flexure of the supracrustal rocks and continental lithosphere. This flexure caused
significant subsidence initiating the formation of the foreland basin to the west (Mossop
and Shetsen 1994). The rise of the Cordillera coupled with increasing sedimentation
rates triggered migration of the depo-axis of the foreland basin (Mossop and Shetsen
1994). The shift of the foreland basin to the northeast was comparable to a moving wave
controlled by variations in subsidence driven by increased crustal thickening and
increased sediment influx from erosion of the rising Cordillera (Mossop and Shetsen
1994). Topographic lows provided accommodation space for sediment transported from
the rising Cordillera and the Precambrian Canadian Shield.
1.2.2 The Western Canadian Sedimentary Basin
The WCSB consists of a wedge of Mid-Proterozoic to Cenozoic strata thickening
from east to west, bounded by the Cordillera to the west and the edge of the Canadian
Shield to the east. The WCSB extends into the United States to the south and the
Tathlina Highlands of the North West Territories to the north (Mossop and Shetsen
1994). The strata ranges in thickness from zero on the edge of the Canadian Shield to
three to five km along the eastern margin of the foreland thrust and fold belt (Mossop and
Shetsen 1994). As mentioned, the origin and development of the Cordillera controlled
the geometry and structure of the WCSB (Price 1994). High relief and topographical
positive areas within the WCSB controlled alluvial sediments flanking the eastern margin
of the Cordillera as well as the sediment transport through a series of complex drainage
networks during low relative sea level (Cant & Abrahamson 1996). The stratigraphy of

Chapter 1 - Introduction 5
the WCSB is controlled by accommodation space with variations in sedimentation,
subsidence, and eustacy creating multiple cycles of transgression and regression (Stott
1984). These cycles of deposition will be discussed in Sections 1.2.3 and 1.2.4.
1.2.3 Stratigraphic Framework of the Western Canadian Sedimentary Basin
The WCSB can be separated into two major stratigraphic components, the
platformal and the foreland basin successions, separated by an unconformity of
approximately 20Ma signifying an extended period of uplift and erosion (Mossop and
Shetsen 1994). The platformal succession comprises Paleozoic to Jurassic sediments
deposited on the passive margin of the stable North American Craton, preceding the
evolution of the foreland basin. The platformal sediments portray transgressive/regressive
cycles of shale, carbonates, and shoreface sandstones (Mossop and Shetsen 1994). The
overlying foreland basin successions are dominated by clastic sediments deposited during
active orogenic advancement of the Cordillera from Mid-Jurassic to Oligocene. These
clastic successions exhibit transgressive/regressive cycles of the western interior seaway
(Stott 1984). The Cummings Formation is a part of the foreland basin succession located
within the Mannville Group, discussed in Section 1.2.4.
1.2.4 Stratigraphy of the Study Area
The Stratigraphic succession of the study area described from oldest to youngest
begins with Devonian to Mississippian carbonates deposited within the platformal
succession on the western passive margin overlying the basement rocks of the stable
North American craton (Fig. 1.3) (Christopher 1984). The upper contact of the platformal

Chapter 1 - Introduction 6
succession is defined by a large-scale unconformity representing a second order sequence
boundary as defined by Vail (1977) (cited in, Mossop and Shetsen 1994). The
Cretaceous Mannville Group defines the base of the foreland succession. The Mannville
Group is divided into the Lower Mannville and the Upper Mannville. As shown in the
stratigraphic column of Figure 1.3, the basal unit of the Lower Mannville is the Dina
Formation in the study area.

Chapter 1 - Introduction 7
Figure 1.3 – Stratigraphic column of the study area (modified from Riediger et al 1999 and Christopher, 1999)

Chapter 1 - Introduction 8
The Mannville Group and Dina Formation are not continuous throughout the
WCSB and do not consistently represent the basal unit of the foreland basin succession.
Other units such as the Bullhead Group in North-eastern B.C and in the Peace River area
and the Fort St. John Group in the Liard River area represent the basal unit of the
foreland basin succession (Hayes et al 1994).
According to Mossop and Shetsen (1994), the Dina Formation is accepted as
Aptian in age and is the main oil producing unit in the Provost Oil Field. Fluvial incision
into pre-existing Mississippian and Devonian strata during a lowstands systems tract
provided space for subsequent deposition of the Dina Formation into paleo-valleys during
an Aptian transgression (Cant 1996). The Ostracode Zone of the Lower Mannville was
deposited during the high stands systems tract marking the maximum flooding surface
during the Aptian transgression. According to Riediger et al. (1999) and Christopher
(1984), the Cummings Formation lies stratigraphically above the Ostracode Zone within
the Upper Mannville Group, deposited between late Aptian to early Albian. The
depositional environment of this formation has been interpreted as coastal sandstones
deposited during the transition from a highstand to a falling stand systems tract (Riediger
et al., 1999). Riediger et al. (1999) characterizes the Cummings Formation as a
shallowing-upward succession of mudstone, interlaminated mudstone with siltstone and
fine-grained sandstone capped by coals and carbonaceous mudstones followed by fluvial
incision during a regional regressive event.
The sediments of the foreland basin succession have been difficult to date due to
the lack of biostratigraphic control particularly in the southern region of the WCSB where

Chapter 1 - Introduction 9
fully marine conditions rarely infiltrated (Mossop and Shetsen 1994). This created
ambiguous nomenclature when defining stratigraphic units, for example, according to
Williams (1963) the Cummings Formation is straddling the division of the Lower and
Upper Mannville groups, whereas, according to Christopher (1984) and Riediger et al.
(1999) the Cummings Formation is located in the Upper Mannville. According to Cant
and Abrahamson (1996) the Cummings Formation is located in the Lower Mannville.
The Geological Atlas of the Western Canadian Sedimentary Basin (Mossop and Shetsen,
1994) does not subdivide the Mannville Group where the Cummings Formation is
present. This study will use the stratigraphic nomenclature of Riediger et al. (1999) and
Christopher (1984) presented in Figure 1.3 based on the proximity of their study areas as
well as similar sequences of stratigraphic units observed within the cores described in this
study.
1.3 Previous Work
The WCSB is an area with considerable oil and gas exploration. Numerous
boreholes riddle the WCSB providing superior quality of geologic control. Rudkin
provided a regional analysis of the WCSB in 1964 while Glaister, Williams, Mellon,
Stott, and Jackson provided more geographically limited studies in 1959, 1963, 1967,
1982 and 1984 respectively (cited in Mossop and Shetsen 1994). Restricted stratigraphic
intervals such as: the Moose Bar Sea deposits, Central Foothills, Deep Basin, and Lower
Mannville of the Southern Plains have been studied and published by McLean and Wall
(1981), Macdonald et al. (1988), Smith et al. (1984), and Hayes (1986) respectively (cited
in Mossop and Shetsen 1994). More recent publications by Cant (1996) discuss the

Chapter 1 - Introduction 10
stratigraphic framework of the Lower Mannville, whereas, Riediger et al. (1999) provides
an in-depth study of the distribution and oil types found within the Mannville Group
within the Provost oil field. However, the Mannville Group has been difficult to
correlate on a regional scale due to the widespread lithologic heterogeneity and the lack
of biostratigraphic control (Mossop and Shetsen 1994). The Cummings Formation has
been mapped into Saskatchewan by Christopher (1984) and possible correlative outcrops
in Manitoba, however these correlations are uncertain.

11
CHAPTER 2 - DEPOSITIONAL ENVIRONMENTS OF THE FORELAND BASIN
SUCCESSION
2.1 Cretaceous deposition
Deposition throughout the Cretaceous can be characterized by three
unconformity-bounded clastic sequences deposited in the migrating foredeep of the West
Coast Sedimentary Basin (Stott, 1984). From the Late Jurassic to the Late Cretaceous,
cyclic patterns of marine shale, alluvial to fluvial sandstone, prodeltaic sandstone and
nearshore siltstone and sandstone are a result of transgressive/regressive successions of
the Western Interior Seaway and orogenic evolution of the Cordillera (Stott, 1984). The
distribution and thickness of the sediments within the WCSB can be attributed to
structural controls illustrated in Figure 2.1. These controls include the rate of uplift and
erosion of the Cordillera, the rate of subsidence and paleogeography of the Alberta and
Williston basins, topographical highs such as the Sweetgrass and Peace River arches,
dissolution of underlying limestone resulting in karst topography, and topographical lows
created by dissolution of underlying Devonian salts (Mossop and Shetsen 1994).
2.1.1 First Clastic Wedge
The oldest clastic wedge of the Foreland Basin succession consists of Jurassic to
Early Cretaceous sediments of the Fernie and Nikanassin formations and the Minnes and
Kootenay groups (Fig. 2.2 B). Maximum development of this succession occurs in the
Fernie Basin, located in the western foothills between the Smoky and Peace rivers and in
southeastern British Columbia (Fig. 2.2 A) (Stott, 1984).

Chapter 2 – D
epositional Environm
ents of the Foreland B
asin Succession
12
Figure 2.1 - Map of WCSB depicting structural controls creating depositional divisions during Late Jurassic to Late Cretaceous, (after Mossop and Shetsen 1994).
Chapter 2 – Depositional Environments of the Foreland Basin Succession 13
The thickness of this succession is approximately 2.7km in the north decreasing to zero
within the eastern plains of Alberta. The total succession generally lies unconformably
over Triassic rocks and is overlain unconformably by the diachronous Cadomin
conglomerate within the Blairmore, Mannville and Bullhead groups (Fig. 2.2) (Stott
1984). The Fernie Formation was deposited during a regional transgression during
Oxfordian time and comprises a condensed marine sequence of black shale, thin
sandstone and limestone, evidently derived from the craton to the east (Stott 1984).
Following deposition of the Fernie Formation, increased rates of sedimentation mark a
change in source from the stable eastern craton to the western margin of the rising
Cordillera (Stott 1984). Continuous sedimentation from the Cordillera resulted in
deposition of the Kootenay and Minnes groups of the lowermost Cretaceous. These
groups comprise of coarsening upward massive sandstone, interbedded sandstone,
mudstone, and coal that are commercial seams. According to Stott (1984) these
lithofacies illustrate an alluvial to fluvial plain, grading into a deltaic shoreface
environment.
The sediment accumulated and filled the foredeep and the marine embayment
retreated northward, exposing the southern limits of the deep basin east of the Cordillera.
This exposure led to an extended hiatus in deposition from the mid to Late Valanginian
through to the Late Barremian/Early Aptian, representing approximately 20 Ma of non-
deposition and erosion interrupted by episodic intervals of regional deposition (Fig. 1.4)
(Stott 1984).
Chapter 2 – Depositional Environments of the Foreland Basin Succession 14
a)
b)
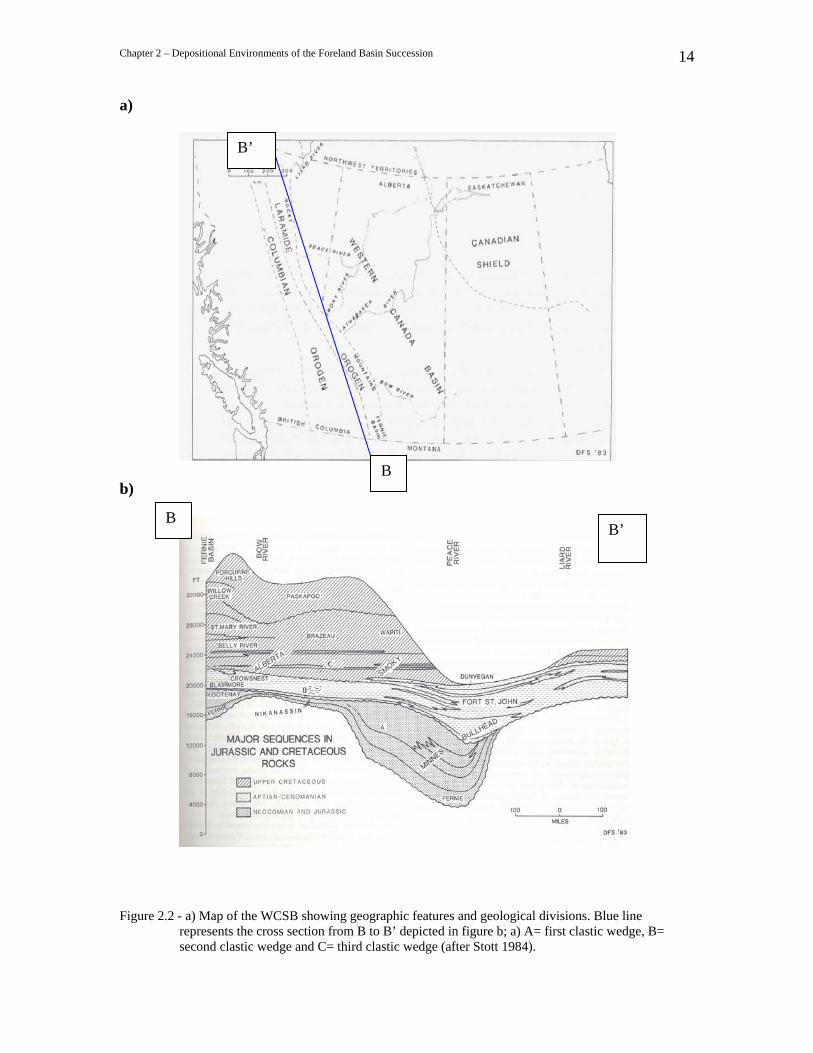
Figure 2.2 - a) Map of the WCSB showing geographic features and geological divisions. Blue line
represents the cross section from B to B’ depicted in figure b; a) A= first clastic wedge, B= second clastic wedge and C= third clastic wedge (after Stott 1984).
B’
B
B B’

Chapter 2 – Depositional Environments of the Foreland Basin Succession 15
2.1.2 Second Clastic Wedge
Uplift continued along the Columbian Orogeny with renewed subsidence of the
foredeep allowing for infiltration of a marine embayment and deposition of marine
sediments (Stott 1984). This transgressive systems tract marked the end of a large-scale
unconformity with the deposition of the second clastic wedge within the WCSB (Fig. 2.3)
(Cant and Abrahamson 1996). This depositional succession comprises of the Blairmore
Group of the southern and central foothills of Alberta, the Bullhead and Fort St. John
Group of the Peace River area and the Mannville Group spanning from southern Alberta
to east central Alberta (Fig. 2.2 b). The Bullhead and Lower Blairmore groups consist of
chert-conglomerates and coal-bearing beds approximately 1km thick in the western
foothills of the Cordillera decreasing to a few metres thick southward (Stott 1984). The
chert-conglomerate beds grade laterally into fine-grained sandstones, then into mudstones
marking an early Aptian transgression (Stott 1984). This transgression did not extend
much further south than the Peace River area and is marked by a large-scale delta at the
mouth of an ancestral Peace River with more deltas believed to be present along the
paleoshoreline of the marine embayment (Stott 1984). The seaway was bordered in the
south by poorly drained alluvial plains and extensive shallow lacustrine and estuarine
environments (Stott 1984).
Following the early Aptian transgression, the Albian Fort St. John Group and the
Cenomanian Dunvegan Formation (Fig. 2.2 b) represent four transgressive/regressive
cycles within the second clastic wedge (Stott 1984). The first cycle deposited about 400
Chapter 2 – Depositional Environments of the Foreland Basin Succession 16
m of marine shale and extended westward beyond the present day foothills of north
eastern B.C. and southwest into the WCSB. Studies by Hopkins et al. (1982) suggest that
the embayment may have extended into the northwestern U.S. (Stott 1984). Delta front
sandstones, overlying marine shale, on the western margin of the WCSB mark the
transition from transgression to regression terminating the first cycle within the Fort St.
John and Upper Blairmore groups (Stott 1984).
The second cycle is marked by a 400m thick marine shale overlain by delta front
and prodeltaic sandstones deposited at Liard River (Fig. 2.2) (Stott 1984). The extent of
the marine shale suggest that the southward advancing marine embayment only extended
as far south as Smoky River in the foothills of the Cordillera (Stott 1984).
The third transgression within the Albian Fort St. John Group and the
Cenomanian Dunvegan Formation proved to be the most extensive and is believed to
have connected the Boreal Sea to the north with the Gulf of Mexico to the south (Stott
1984). This transgression deposited a 1.1km thick succession of marine shale overlying
pre-existing shore face and terrestrial sediment, while two autonomous regressive
lithofacies suggest two distinct phases of regression within this cycle (Stott 1984).
The fourth transgression/regression cycle exhibits shifts in the paleoshoreline
position (Stott 1984). The changes in shoreline position, basin configuration and
complex depositional history can be attributed to tectonic movement resulting in
fluctuations in sediment supply and subsidence of the migrating foredeep (Mossop and
Shetsen 1994).
Chapter 2 – Depositional Environments of the Foreland Basin Succession 17
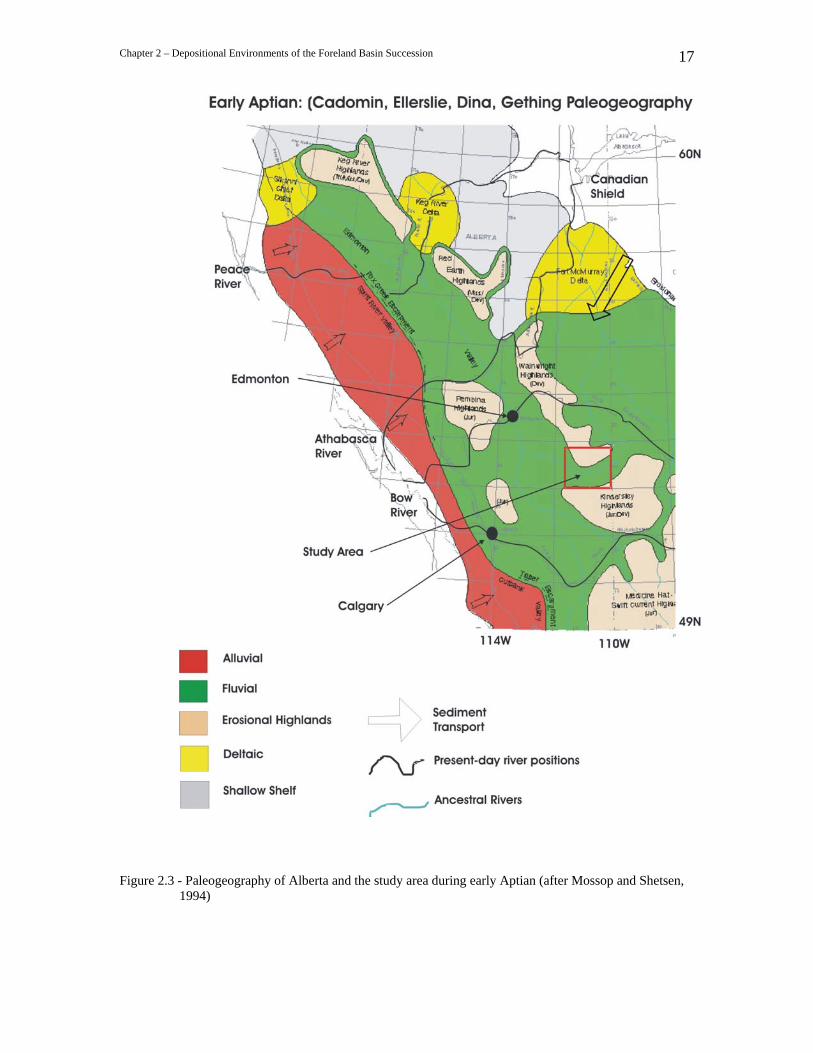
Figure 2.3 - Paleogeography of Alberta and the study area during early Aptian (after Mossop and Shetsen, 1994)

Chapter 2 – Depositional Environments of the Foreland Basin Succession 18
Figure 2.4 - Paleogeography of Alberta and the study area during late Aptian to early Albian (after Mossop
and Shetsen, 1994) with modifications from the result of this study.

Chapter 2 – Depositional Environments of the Foreland Basin Succession 19
2.1.3 Third Clastic Wedge
The third clastic wedge consists of Upper Cretaceous strata with thicknesses up to
4km in the western foothills of the Cordillera thinning to 1.2km in the Alberta Plains
(Fig. 2.2 B). The Alberta and Smoky groups lay unconformably on the Blairmore Group
in the south and the Dunvegan Formation in the north (Stott 1984). These strata consist
of thick basal marine shales overlain by terrestrial sediments deposited following the
mid-Campanian. Upper Cretaceous sediments overlain by Paleocene sediments are
assigned to the Upper Willow Creek, Porcupine Hills and Paskapoo formations (Stott
1984). The third clastic wedge is located stratigraphically above the focus interval of this
study, and will not be discussed in detail.
2.2 Mannville Deposition
Interpretation of the stratigraphic columns from Christopher (1984), Cant and
Abrahamson (1996) and Riediger et al (1999), suggest the transgressive/regressive cycle
of the Mannville Group, (Figs. 2.3 and 2.4) can be correlated to Stott’s early Aptian
transgressive/regressive cycle within the second clastic wedge. The Lower Mannville
consists of non-marine fluvial sediments, incised valley fill and coal seams accompanied
by coastal to shoreface sandstones (Cant and Abrahamson 1996). Deposition is a function
of relative sea level and structural controls, which define paleodrainage networks
responsible for eroding transporting and depositing sediment. Figures 2.6 and 2.7

Chapter 2 – Depositional Environments of the Foreland Basin Succession 20
illustrate interpretive maps created by Williams (1963) and Cant and Abrahamson (1996)
exhibiting paleotopography of the basal unconformity surface. These maps display
paleotopography resulting in drainage divides, which control provenance, transportation
and deposition throughout the basin.

Chapter 2 – D
epositional Environm
ents of the Foreland B
asin Succession
21
Figure 2.5 - Cross sectional view of sequence stratigraphy relationships including transgression and highstand systems tract (TST and HST) of the Cretaceous Mannville Group (from Cant and Abrahamson, 1996).

Chapter 2 – Depositional Environments of the Foreland Basin Succession 22
Figure 2.6 – Isopach map of the transgressive systems tract of the basal unconformaity showing structural controls. Contour intervals are in meters. 1) Eastern basin extending from Saskatchewan into Alberta overlying Devonian salts; 2) area of erosional paleotopography, central zone with incised valley fill and non-depositional uplands; 3) area of flexural subsidence due to compressional tectonism and the rising Rocky Mountains (after Cant and Abrahamson, 1996).
1
2
3

Chapter 2 – Depositional Environments of the Foreland Basin Succession 23
Figure 2.7 – Interpretive map of drainage networks on the basal unconformity of the foreland basin
succession, derived from isopach map in figure 2.6 (after Cant and Abrahamson, 1996).

24
CHAPTER 3 - METHODS
3.1 Methods
3.1.2 Core descriptions
The Canadian Society of Petroleum Geologists in Alberta and Petrol Robertsin
donated three cored intervals from two separate wells. Well 3B-23-36-06WO4M (3B) is
comprised of two cored intervals termed “upper” (905.00-918.15m) and “lower” (918.25-
933.25m) revealing a separation of 10cm. These cored intervals consist of the Cummings
Formation, the Ostracode zone and underlying Dina Formation. Only the upper cored
interval (Cummings Formation) of well 3B and the top 1m of the lower cored interval
representing the Cummings Formation is described in detail within this thesis. The lower
core of 3B and 4A was previously discussed in a detailed analysis of the Dina Formation
by Joe Kidston in 2003. The lower contact of the Cummings Formation is important and
will be discussed later in Chapter 5. Similarly, well 4A-23-36-6W4 (4A) consists of one
cored interval only including approximately 1m of the Cummings Formation.
Description of the upper core from Well 3B is presented in Chapter 4. The upper
core of well 3B is 13.15m long contained in 6 boxes, whereas, the lower-cored interval is
approximately 15m long contained in 7 boxes. The core within well 3B totals 28.15m.
Both cores are split into 8cm surfaces and mostly remain in good condition. Some
intervals are broken and missing while others appear to have been previously sampled.
This study adds to Kidston’s (2003) study of the underlying Dina Formation while
presenting an exceptional opportunity to study 30m of continuous core.

Chapter 3 - Methods 25
Core description sheets with legend are attached in Appendix B. Each core
description sheet provides 2cm resolution resulting in 2m of core per sheet. Description
sheets document grain size, lithology, surface descriptions, laminae geometry,
sedimentary structures, bioturbation and interpretation of lithofacies, and depositional
environments. Detailed photographs of defining sedimentary structures are provided in
Chapter 4. Plates of the cored intervals are in Appendix A.
3.1.3 Transmitted and reflected-light microscopy
Three polished thin sections were prepared for analyses from the upper core from
well 3B. Thin sections are labelled 3B-1, 3B-2, and 3B-3 and were sampled at depths of
917.23 m, 911.08 m and 906.15m respectively. Thin sections provided from previous
studies are labelled 7, 8, and 9 and sampled at depths 911.40, 910.60 and 905.00 m
respectively. Thin sections were cut and prepared at Dalhousie University by Gordon
Brown. Observations and results of mineralogy through a transmitted and reflected-light
microscope are presented in Chapter 4.
3.1.4 X-ray diffraction
Three samples from the upper core of well 3B were analyzed using X-ray
diffraction. The purpose of this method is to determine the composition of clay particles,
composition of cement, and to confirm mineralogical observations obtained under the
transmitted and reflected microscope. The samples were prepared from remaining core
following the cutting of thin sections. The first XRD sample corresponds to thin section
3B-1 at a depth of 917.23m. The second XRD sample corresponds to thin section 3B-2 at
Chapter 3 - Methods 26
a depth of 911.08m. The third XRD sample corresponds to thin section 3B-3 at a depth
of 906.15m. The samples were ground up with a mortar and pestle into the appropriate
grain size, then formed into dry mounts, and placed into the XRD machine for analysis.
The results from these measurements are in Table 2 and Appendix C accompanied by
spectral plots presented in Chapter 4.
3.1.5 Vitrinite Reflectance
Two whole rock samples from the upper core of well 3B were prepared at the
Bedford Institute of Oceanography (BIO) to analyze the organic material through maceral
characterization and thermal maturity based on vitrinite reflectance values. One oil
stained sample from the underlying Dina Formation (Well 4A) was also sampled.
However, due to heavy oil staining no representative reflectance values could be obtained
therefore will not be discussed in this thesis. Samples were prepared under the
supervision of Mike Avery of the Geologic Survey of Canada (Atlantic Division).
Sample 1 consisted of organic-rich rubbly shale ranging in depth from 907.48 to 907.89
m. Sample 2 consisted of sandstone with laminations of detrital organic material from
depths ranging from 910.13 to 910.23 m.
Preparation commenced by crushing the organic matter samples to
approximately 500 micrometers (10-20 mesh) grain size, split to form a representative
sample, then prepared as 2.5 cm (1") diameter plastic stubs to fit the polisher. Two stages
of fix material (epoxy resin) were then added in preparation for polishing. The samples
were then polished with diamond-based suspension to obtain a low relief, scratch-free
surface for examining under an oil lens with incident and fluorescent light at

Chapter 3 - Methods 27
approximately 1000x magnification in order to interpret the maceral composition source
rock potential. Sixteen Vitrinite Reflectance measurements were taken from both
samples and presented in Table 3 of Chapter 4. Representative digital photos are also
presented in Chapter 4.
Both organic samples 1 and 2 were also used for Rock Evaluation (Rock Eval).
The rock evaluation was conducted by Dr. Hans Wielens of the Geological Society of
Canada (Atlantic). This data provides total organic carbon (TOC), max temperature
(Tmax) values concerning the thermal maturity of the Cummings Formation discussed in
Chapter 5. Rock evaluation data is presented in Appendix D.

28
CHAPTER 4 - RESULTS
4.1 Core Descriptions
The upper core of well 3B consists entirely of the Cummings Formation. The
lower contact is located at 918.33 m, within the lower core of well 3B, and was
previously described by Kidston (2003). Kidston (2003) described the basal contact of the
Cummings Formation in well 3B as a fining-upward, poorly sorted pebble conglomerate
defining the basal lag of a fluvial channel. However, well 4A also described by Kidston,
only separated by 500m to the west, reveals the basal contact of the Cummings Formation
as a sandy siltstone with wavy contorted bedding characteristic of a shallow marine
embayment. This will be discussed further in chapter 5.
The upper core of well 3B is described in this chapter in terms of lithofacies.
Table 1 identifies each lithofacies and their cumulative thicknesses throughout the cored
interval. Figure 4.1 depicts the summary of the upper core of well 3B. Detailed core
description sheets are presented in Appendix B. Detailed photos of defining sedimentary
and biogenic structures are presented at the end of this chapter through plates 1 to 9 and
also in Appendix A.

Chapter 4 - Results 29
Figure 4.1 – Core summary of the upper cored interval of well 3B. Detailed core descriptions available in Appendix B. Colours give a rough sense of grain size (pale = fine-grained, dark = coarse-grained material).

Chapter 4 - Results 30
Box number Depth (m) Lithofacies (A – F)
Thickness (m)
Cumulative Thickness (m)
1 905.00 –
905.65
A. Fine (upper) to medium (lower) grained
sandstone with rare matrix supported clasts
0.65 0.65
1 905.65 – 906.30 (core break)
B. Fining upward, poorly sorted imbricated granule sized clasts supported by medium (upper) grained
sandstone
0.65 1.30
1 906.30 – 906.90 (core break)
C. Poorly sorted conglomerate with
granule to cobble size clasts.
0.60 1.90
1 906.90 –
907.30
D. Micro-faulted, coarsening upward very
fine (upper) to fine (lower) grained sandstone with parallel laminations of fine (upper) siltstone.
0.40 2.30
2 907.30 –
908.58
E. Rubbly organic-rich siltstone with rare very
fine (lower) grained wavy sand drapes and siderite
concretions.
1.28 3.58
2 - 6 908.58 – 918.15 (core break)
F. Cleaning upward cycles of parallel
laminated, bioturbated, fine (lower) to medium
(upper) grained sandstone with abundant sulphides
and wavy contorted laminations of organic
matter.
9.57 13.15
Table 1 – Identified lithofacies, with corresponding box location and thicknesses within core 3B.
Cumulative thickness depicts total length of core (13.15 m). Letters A – F pertain to lithofacies descriptions in the following sections. Note missing core locations assumed from core breaks and lithofacies’ boundaries.

Chapter 4 - Results 31
4.1.1 Lithofacies F: 908.58 – 918.15 m
This lithofacies is characterized by cleaning upward cycles of light grey sandstone
with abundant laminations of organic matter. Grain size ranges from fine (lower) to
medium (upper) typically remaining consistent throughout the lithofacies.
Organic matter is rare to common at the base becoming more abundant towards
the top. The organic matter demonstrates fine-scale cyclic patterns. Each cycle is defined
by an abundance of organic laminae at the base grading upwards into cleaner sandstone.
Interlaminated organic material and sandstone observed over approximately 60% of the
lithofacies exhibit parallel planar to wavy laminae geometry with dips ranging from 0° to
35°. Laminations range in thickness from mm scale to approximately 2 cm. Minor
sections comprising of mud drapes with lenticular bedding and a finer grained (very fine
upper) bed of silicified sandstone are also observed within this lithofacies (see core
description sheets in Appendix B).
The extent of cementation fluctuates through the lithofacies due to cement
composition and diagenetic processes. No reaction with HCl was observed suggesting the
presence of siliceous or non-reactive carbonate cement, possibly ankerite. Cement
composition and porosity will be discussed later within the mineralogy and XRD sections
of this chapter.
As cycles grade to cleaner sandstone, more sedimentary structures become
visible. These relatively clean sandstones reveal sharp scoured surfaces demonstrating
reactivation, minor elongated silt rip-up clasts with sand drapes, similar to lithofacies E,
and current ripples lined with organic matter and dark silty material (Plate7). Tidal

Chapter 4 - Results 32
influence is evident through the presence of tidal bundles with a possible location at
911.69 m and very well conserved set of couplets at 916.82 m with approximately 28
observable couplets (Plate 6).
Concretions of marcasite with sizes ranging from mm scale to 10cm in diameter
are observed, as well as coarse (granule sized) concretions of pyrite with circular reaction
rims or halos (Plate 5). Sulphides occur more readily in association with the laminations
of organic matter and are abundant throughout the lithofacies suggesting reducing
conditions.
Biogenic structures are common within this lithofacies. These structures include
trace fossils from the Skolithos and Cruziana (Planolites) ichnofacies (Plate 4). Skolithos
burrows are common toward the top of the lithofacies in sections of high sand content
and range in scale from 1cm to 5cm in length. The Skolithos burrows are infilled with
finer grained sandy material. Planolites are common throughout and appear to have a
strong association with the laminations of organic material. Bioturbation index (see core
sheet legend) varies from 0 to 3, which in certain areas deforms the organic laminations.
The upper contact of this lithofacies is sharp and planar with abundant preserved
biogenic sedimentary structures lined and infilled with silty material (Plate 3). The lower
contact is located within the lower core of well 3B. Discussion of this contact will be
discussed later in chapter 5.

Chapter 4 - Results 33
4.1.2 Lithofacies E: 907.30 – 908.58 m
Due to the rubbly nature of this section of the core it is difficult to observe
continuous structures throughout the lithofacies, thereby presenting difficulties in making
a complete description.
Lithofacies E is characterized by rubbly, organic-rich dark grey to black siltstone
with rare very fine (lower) grained grey wavy sand drapes ranging in thickness from mm
scale to 2cm. Some drapes include minor granule size clasts of light grey sandstone. The
cement does not react with HCl suggesting siliceous or non-reactive carbonate cement
(ankerite). This lithofacies exhibits no evidence of preserved biogenic sedimentary
structures. A continuous siderite concretion (5cm thick) marks the lower contact of this
lithofacies and minor concretions are found throughout. The upper contact is not present
due to missing core at the core break.
4.1.3 Lithofacies D: 906.90 – 907.30 m
Lithofacies D is characterized by micro-faulted, coarsening upward very fine
(upper) to fine (lower) grained grey sandstone with parallel laminations of fine (upper)
dark grey siltstone.
Laminations of sandstone and siltstone typically 0.5cm thick, display a horizontal
planar parallel laminae geometry, which is highly disturbed by listric-style microfaulting
throughout the lithofacies.

Chapter 4 - Results 34
No observable reaction occurred with HCl suggesting the presence of siliceous
or non-reactive carbonate cement (ankerite).
Minor amounts of organic particles are found within the upper (coarser) margin of
this lithofacies. No evidence of preserved biogenic sedimentary structures are observed.
The core representing this lithofacies is also in poor condition. A large portion is believed
to be lost due to fracturing perhaps due to drilling and handling or intermediate faulting
resulting in the missing core.
4.1.4 Lithofacies C: 906.30 – 906.90 m
Lithofacies C is characterized by a reddish brown poorly sorted conglomerate
with subrounded to subangular granule size clasts supported by a poorly sorted coarse
(upper) to medium (lower) grained grey-brown sandstone.
This lithofacies is in poor condition and a majority is assumed to be lost due to
reasons stated above. The small amount of remaining core is structureless and shows no
imbrication of clasts and no evidence of preserved biogenic sedimentary structures.
The upper contact is lost at the core break and there is probably missing core.
The basal contact is scoured and represents an erosional surface with flame structures and
load casts immediately above the contact.
4.1.5 Lithofacies B: 905.65 – 906.30 m
Lithofacies B is characterized by fining upward sequences of poorly sorted
imbricated angular granule sized silt rip-up clasts supported by a medium (upper) grained
Chapter 4 - Results 35
light grey sandstone matrix interbedded with clean medium (upper) grained grey
sandstone.
The base of granule beds display erosional scoured surfaces marking reactivation.
Bed thicknesses vary from 10 cm to mm scale lamination sets interbedded with clean
grey sandstone. Laminae geometry is planar parallel with some evidence of rippled or
wavy surfaces dipping from 0º to 10º (Plate 2).
No observable reaction to HCl suggesting siliceous or non-reactive carbonate
cement. No evidence of preserved biogenic sedimentary structures are present, however,
rare particles of organic matter lining lamination surfaces are observed.
The lower contact is lost at the core break. The upper contact of this lithofacies is
gradational over approximately 10 cm into lithofacies A as granule sized silt rip-up clasts
become less abundant with increasing amounts of medium (upper) to (lower) grained
sandstone.
4.1.6 Lithofacies A: 905.00 – 906.65 m
Lithofacies A is characterized by coarsening upward light grey sandstone with
grain size varying from fine (upper) to medium (lower).
The laminae geometry is defined by planar parallel laminations at the base
changing to wavy and back to planar parallel at the top, typically dipping at <5 ◌۫º.
Laminations are typically less than 1 cm in thickness and defined by rare traces of
elongated particles of organic matter with rare angular to subangular granules (0.5 – 3.0
cm in diameter) with matrix-supported silt rip-up clasts (Plate 1).

Chapter 4 - Results 36
No reaction was observed when HCl was applied to the face of the core
suggesting siliceous or non-reactive carbonate.
No sulphide mineralization is visible; however, the presence of a reddish- brown
siderite concretion lining the lamination plane 2.5cm thick located at approximately
905.20 m is observed.
Biogenic sedimentary structures are rare to non-existent within this lithofacies and
can be attributed to the trace fossil ichnofacies Skolithos. Possible vertical Skolithos
burrows are located within the planar parallel laminations of this lithofacies.
4.2 Thin Section Mineralogy
This section describes the observations made with transmitted- and reflected- light
microscopes. Three thin sections were prepared and described from well 3B at locations;
3B-1 at a depth of 917.23m (lithofacies F), 3B-2 at a depth of 911.08m (lithofacies F
including organic laminae), and 3B-3 at a depth of 906.15m (lithofacies B including
granule sized silt rip-up clasts). Each thin section was prepared using blue epoxy to
visually enhance the pore spaces for analyses. Table 2 summarizes the data obtained
from these samples and also includes XRD data from the three locations mentioned
above. These observations provide the basis for a discussion concerning the provenance
of the Cummings Formation in Chapter 5. The descriptions of the thin sections will
begin at the lowest sample interval then move upward.

Chapter 4 - R
esults 37
Table 2 – Summary of mineralogy observed within the upper cored interval of well 3B using various analytical techniques
Chapter 4 - Results 38
4.2.1 Transmitted and reflected-light microscope observations
Thin section 3B-1 (917.23 m) – Lithofacies F - This sample comprises
approximately 30 to 40% grains, supported by ~60 to 50% cement with porosity
accounting for 10% of the entire thin section. Subrounded to subangular grains of quartz
and feldspar (mostly orthoclase) are dominantly supported by silica cement with minor
amounts of ankerite. This thin section exhibits coarser grains than samples 3B-2 and 3B-3
(Fig. 4.2). Approximately 65% of the cement is comprised of silica while sporadic
rhombic ankerite composes the remaining 35%. Typical detrital fragments of chert are
observed as well as quartzite rock fragments. Visible overgrowth textures appear on
several quartz grains demonstrating optical continuity during mineral growth. Accessory
tourmaline grains were also observed. The remaining minerals consist of ~5% clays and
<5% opaques with minor plagioclase of the 30 to 40% grains.
The opaque minerals within this thin section are characterized by marcasite and
pyrite grains. Marcasite was defined by its elongate to rhombic shape whereas pyrite is
identified by its cubic outlines. Both opaque minerals have varying grain size (<0.5 to
<1mm). Accessory ilmenite was identifiable from lamellar twininng, a relict texture still
apparent within the ilmenite grains.

Chapter 4 - Results 39
Figure 4.2 – Detailed photos of bulk mineralogy of thin section 3B-1 (907.23m) of lithofacies F.
A) Chert fragment with associated ankerite cement. Note the grain size with respect to samples shown below.
B) Quartzite fragment supported by silica cement. Note the fused boundaries between quartz
grains within the rock fragment.

Chapter 4 - Results 40

Chapter 4 - Results 41
Thin section 3B-2 (911.08 m) – Lithofacies F – This sample is comprised of
approximately 30 to 40 % grains is supported by ~60 to 50% cement with porosity
accounting for <5% of the entire thin section. Moderate to poorly sorted subangular to
angular fragments of detrital chert, angular to subrounded quartz and subangular to
subrounded perthitic orthoclase and plagioclase cemented by carbonate (ankerite) cement
(Fig. 4.4) are present of the ~60 to 70% cement, approximately 70% is ankerite and 30%
silica. Therefore, detrital fragments of granite characterized by intergrown plagioclase
and quartz crystals as well as detrital quartzite fragments characterized by fused quartz
crystals with fused boundaries (Fig. 4.4). The remaining portion consists of ~5% clays
and <5% opaques of the 30 to 40% grains. The opaque minerals within this thin section
are characterized by marcasite and pyrite grains. This sample is consistent with the
findings in thin section 3B-1.
Figure 4.3 - Detailed photos of bulk mineralogy for thin section 3B-2 (911.08m) of lithofacies F. Pictures
exhibiting grain size, composition and porosity observable from the use of blue epoxy.
A) Granitic rock fragment surrounded by quartz and feldspar grains. Also note the abundance of
ankerite cement vs. silica cement.
B) Quartzite rock fragment with visible chert fragments, quartz and feldspars.
C) Bulk mineralogy of thin section 3B-2 (plane polarized light).
D) Same image as C but in cross nicols. Note the perthitic nature of the feldspar.

Chapter 4 - Results 42

Chapter 4 - Results 43
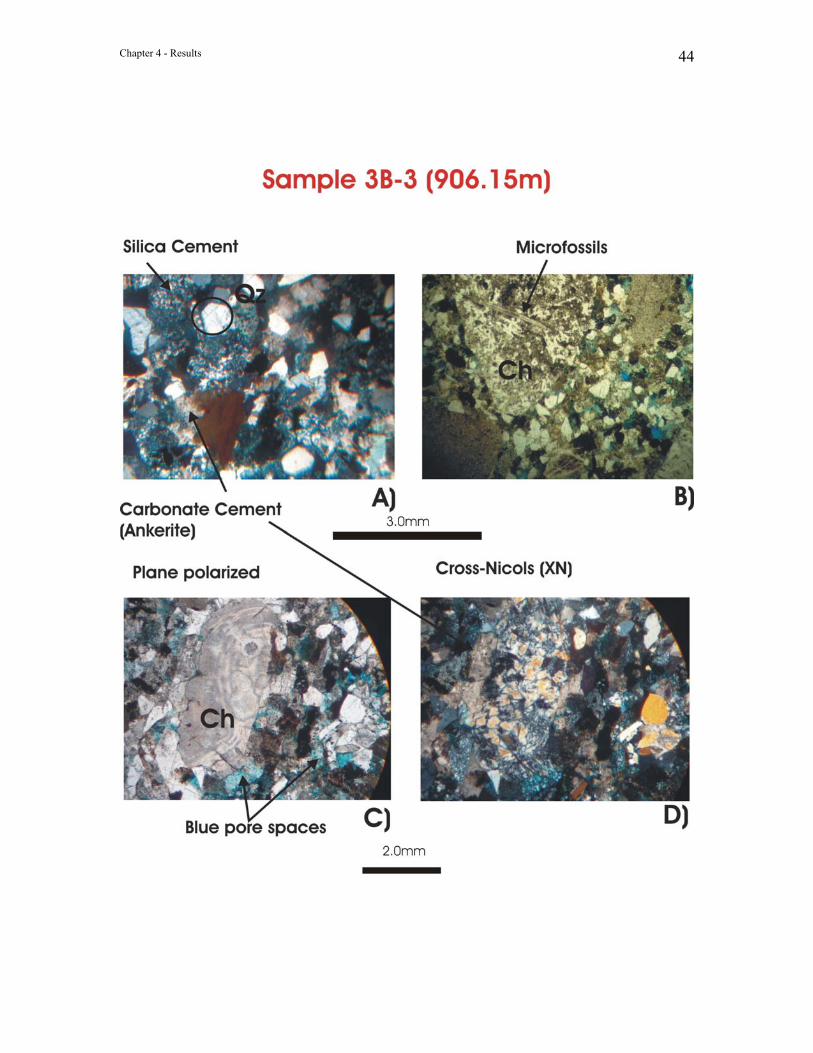
Thin section 3B-3 (906.15 m) – Lithofacies B. This sample comprises approximately
35% grains supported by ~65% cement with porosity accounting for ~5% of the entire
thin section. Poorly sorted angular to subrounded detrital fragments of radiolarian chert,
supported by angular to subrounded grains of quartz, orthoclase and plagioclase are
dominantly (~50%) cemented by chert and ankerite (Fig. 4.5). Approximately 10% of the
cement was determined to be ankerite, identified by its rhombic shape and supported by
XRD results (Figs. 4.5, raw data available in Appendix C). Minor amounts of aragonite
make up ~5% of the total 15% carbonate cement within this thin section. Opaques and
clays form <10%.
The opaque minerals within this thin section are pyrite, marcasite and titanium-
bearing minerals. Leucoxene was also observed within this sample. Nesse (2000) defines
leucoxene as an alteration product that is associated with Ti and Fe bearing oxides,
hydroxides, and other minerals. It was identified by its characteristic fine-grained
brownish color. The grain size is consistent with samples 3B-1 and 3B-2.
Figure 4.4 – Detailed photos of bulk mineralogy for thin section 3B-3 (906.15m) of lithofacies B. Pictures exhibiting grain size, composition and porosity observable from the use of blue dye. (Ch = chert)
A) Angular quartz grains with associated silica and ankerite cement.
B) Detrital radiolarian chert fragment with microfossils. Typical detrital chert grain in polarized
light with blue pore spaces
C) Typical detrital chert grain in polarized light with blue pore spaces
D) Same image as C, but in cross nicols.
Chapter 4 - Results 44

Chapter 4 - Results 45
4.3 X-ray diffraction results
Three XRD samples were analysed and the results are presented within this
section. Results support descriptions of the thin sections. The results of the analyses are
presented in Table 2 and Appendix C along with the mineralogy observed under the
reflected and transmitted microscope. Figure 4.5 depicts three spectral plots attained from
the XRD machine. Each mineral on the plots shows its respective peak locations. A
strong correlation is found between quartz, orthoclase, microcline and ankerite as
illustrated on the spectral plots. Raw data from the XRD analyses is presented in
Appendix C. Clays are amongst the minerals identifiable by XRD.
The XRD results presented in Table 2 and the spectral plots (Fig. 4.5) comply
with the microscope observations. The clay minerals (illite, kaolinite) found by the XRD
were the only minerals which were unable to be viewed under the microscope due to
grain size.
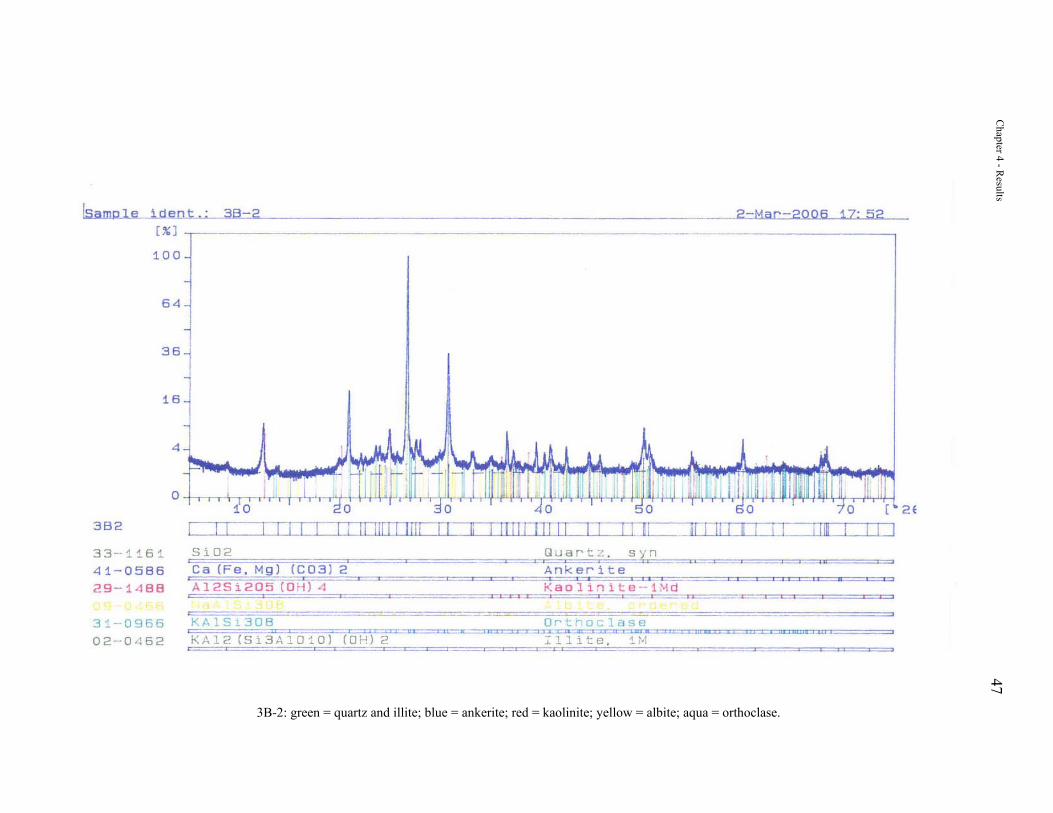
Figure 4.5 – Spectral plots acquired from XRD analyses. Samples obtained from upper cored interval of
well 3B. Plots display mineral correlations through peaks located from 0 to 75° (diffraction angle).

Chapter 4 - R
esults 46
3B-1: green = quartz; blue = kaolinite; red = orthoclase; yellow = microcline; aqua = illite
Chapter 4 - R
esults 47
3B-2: green = quartz and illite; blue = ankerite; red = kaolinite; yellow = albite; aqua = orthoclase.

Chapter 4 - R
esults 48
3B-3: green = quartz and albite; blue = ankerite and microcline; red = kaolinite and illite; yellow = aragonite; aqua = orthoclase.
Chapter 4 - Results 49
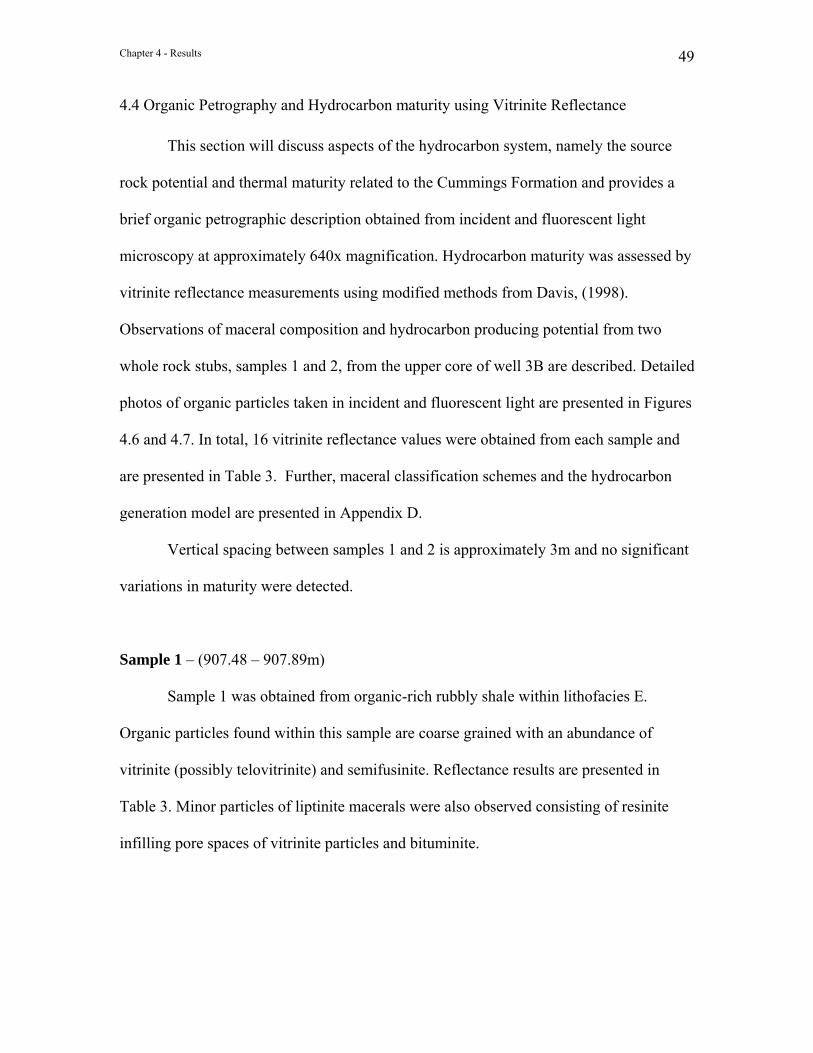
4.4 Organic Petrography and Hydrocarbon maturity using Vitrinite Reflectance
This section will discuss aspects of the hydrocarbon system, namely the source
rock potential and thermal maturity related to the Cummings Formation and provides a
brief organic petrographic description obtained from incident and fluorescent light
microscopy at approximately 640x magnification. Hydrocarbon maturity was assessed by
vitrinite reflectance measurements using modified methods from Davis, (1998).
Observations of maceral composition and hydrocarbon producing potential from two
whole rock stubs, samples 1 and 2, from the upper core of well 3B are described. Detailed
photos of organic particles taken in incident and fluorescent light are presented in Figures
4.6 and 4.7. In total, 16 vitrinite reflectance values were obtained from each sample and
are presented in Table 3. Further, maceral classification schemes and the hydrocarbon
generation model are presented in Appendix D.
Vertical spacing between samples 1 and 2 is approximately 3m and no significant
variations in maturity were detected.
Sample 1 – (907.48 – 907.89m)
Sample 1 was obtained from organic-rich rubbly shale within lithofacies E.
Organic particles found within this sample are coarse grained with an abundance of
vitrinite (possibly telovitrinite) and semifusinite. Reflectance results are presented in
Table 3. Minor particles of liptinite macerals were also observed consisting of resinite
infilling pore spaces of vitrinite particles and bituminite.

Chapter 4 - Results 50
Figure 4.6 – Detailed photos of maceral type found in sample 1 (907.48 – 907.84m). Figure continued on
following page. Fluorescent images were also used for classification of liptinite macerals found within sample 1.
1 and 2) Possibly telovitrinite (Te) displaying remnants of cellular structure.
3 and 4) Semi fusinite (SF) displaying collapsed cellular structure.
5 and 6a) Resinite (R) infilling pore spaces of vitrinite.
6 b) Fluorescence image of same area as 6A.
7) a) Bituminite. b) Same area under fluorescence.

Chapter 4 - Results 51

Chapter 4 - Results 52

Chapter 4 - Results 53
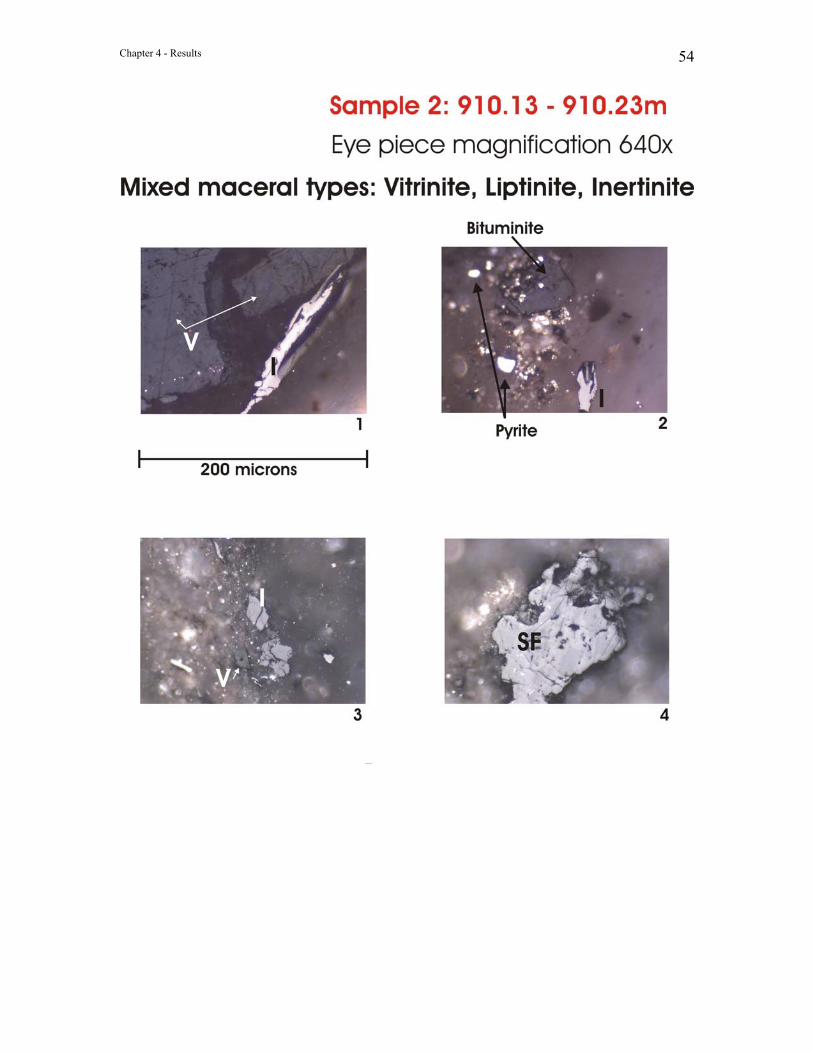
Sample 2 – (910.13 – 910.23m) Sample 2 was obtained from consolidated light grey sandstone laminated with
organic detrital material located within lithofacies F. Organic particles observed were rare
and very fine-grained. The maceral types observed consisted of vitrinite, liptinite (rare)
and inertinite (Fig. 4.7). Common particles observed consisted of semi fusinite and
vitrinite. Organic particles were minor compared to the amount of mineral matter found
within the samples. Reflectance values are presented in Table 3 and detailed photos are
presented in Figure 4.7.
Figure 4.7 – Detailed photos of maceral types observed in sample 2 of well 3B.
1) Vitrinite associated with semi fusinite of the inertinite group (I). 2) Vitrinite with associated semi fusinite surrounded by mineral matter. Note the
abundance of pyrite.
3) Vitrinite with associated semifusinite.
4) Semifusinite (SF).
Chapter 4 - Results 54

Chapter 4 - Results 55
Table 3 – Data listings and basic statistics associated with vitrinite reflectance results obtained from the
upper core of well 3B.

Chapter 4 - Results 56
Plate 1 – 9: Detailed photos of defining sedimentary structures observed within well 3B. Photos are
assorted from the top of the core downward and presented from plates 1 through 9. Plate 1 – Matrix supported silt rip-up clasts, box 1, lithofacies A Plate 2 – Imbricated silt rip-up clasts along bedding plane, box1, lithofacies B Plate 3 – Vertical Skolithos burrows, box 2, lithofacies F Plate 4 – Skolithos and Planolites burrows, box 2, lithofacies F Plate 5 – Reaction halos surrounding sulfide mineralization, box 2, lithofacies F Plate 6 – Tidal couplets, box 4, lithofacies F Plate 7 – Current ripples, box 4, lithofacies F Plate 8 – Lenticular bedding, box 5, lithofacies F Plate 9 – Reactivation surface, box 6, lithofacies F

Chapter 4 - Results 57

Chapter 4 - Results 58

Chapter 4 - Results 59

Chapter 4 - Results 60

Chapter 4 - Results 61

Chapter 4 - Results 62

Chapter 4 - Results 63

Chapter 4 - Results 64
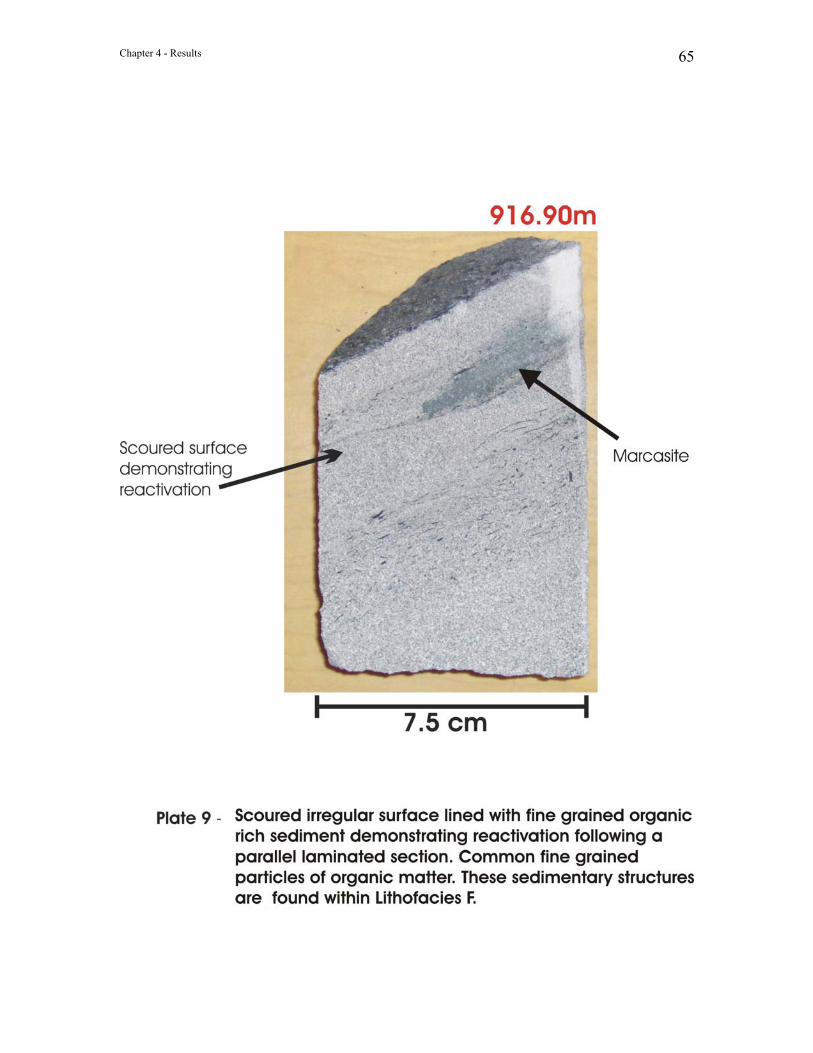
Chapter 4 - Results 65
66
CHAPTER 5 - DISCUSSION
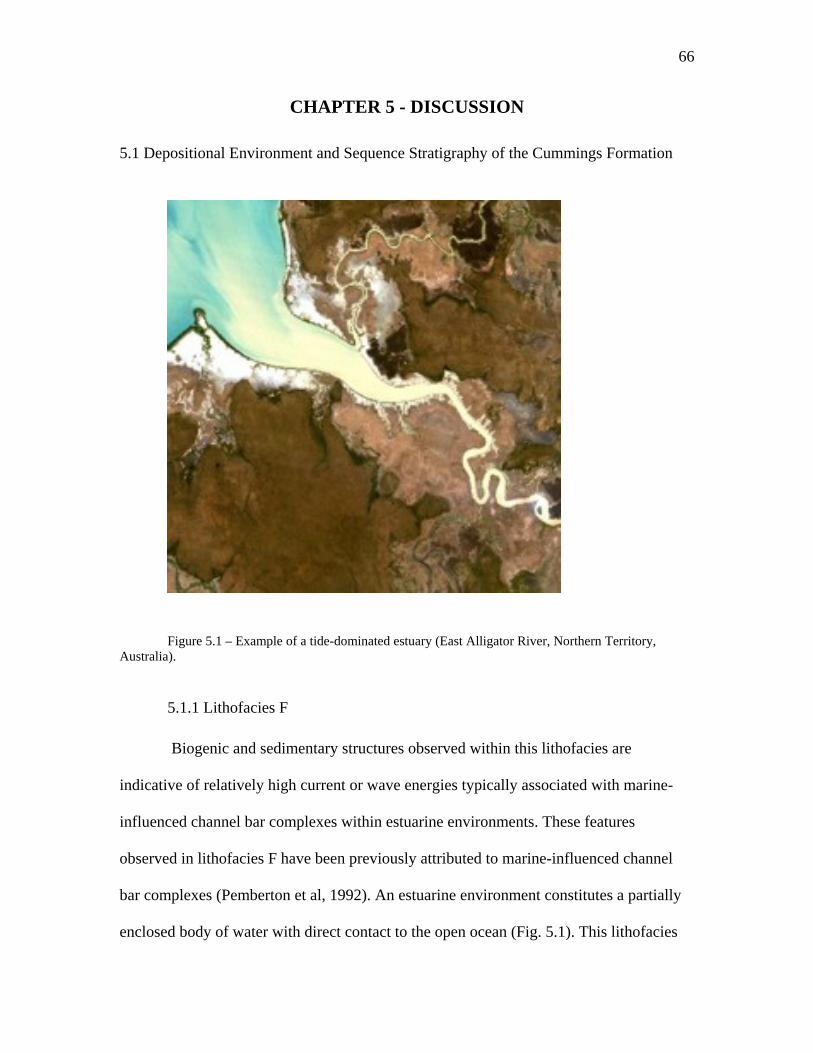
5.1 Depositional Environment and Sequence Stratigraphy of the Cummings Formation
Figure 5.1 – Example of a tide-dominated estuary (East Alligator River, Northern Territory, Australia).
5.1.1 Lithofacies F
Biogenic and sedimentary structures observed within this lithofacies are
indicative of relatively high current or wave energies typically associated with marine-
influenced channel bar complexes within estuarine environments. These features
observed in lithofacies F have been previously attributed to marine-influenced channel
bar complexes (Pemberton et al, 1992). An estuarine environment constitutes a partially
enclosed body of water with direct contact to the open ocean (Fig. 5.1). This lithofacies

Chapter 5 - Discussion 67
has been interpreted as an estuarine shallow channel bar complex grading into an
estuarine bay-fill. Similar lithofacies have been described by Leckie and Singh, (1991)
within the WCSB, such as the Albian Paddy Member of the Peace River Formation.
The basal contact of the Cummings Formation is located within the lower cored
interval of well 3B (Fig. 5.2). Less than 7cm of the Cummings Formation is exposed
within this cored interval. The basal contact is lost at the core break. The remaining core
consists of granule sized silt rip-up clasts supported within medium grained grey
sandstone. Visible mud drapes (mm-2cm) are also observed. The basal contact of the
Cummings Formation is interpreted as a basal lag of an incising channel deposit,
congruent with the interpretation of Kidston (2003). This unit would have initially been
deposited in a lowstand systems tract marking a sequence boundary, transition to a
transgressive system tract and deposition of a transgressive estuarine (valley fill) deposit.
Figure 5.2 – Picture of basal Cummings Formation contact in lower cored interval of well 3B.

Chapter 5 - Discussion 68
Freshwater input from river runoff coupled with saline water from tidal activity
and turbidity creates a transitional phase from fresh to brackish to saline water resulting
in low diversity ecosystems due to biological stress (Wightman, Pemberton and Singh
1987). This is observed in lithofacies F through the presence of a low diversity suite of
the Skolithos and rare Planolites trace fossils, both characteristic of channel bar estuarine
deposits (Pemberton et al, 1991). Leckie and Singh, (1991) also observed low diversity
suites of Skolithos burrows within the Paddy Member. Skolithos burrows observed at the
base of lithofacies F are infilled and lined with fine-grained sandstone. The Skolithos
burrows located near the upper contact of lithofacies F are lined and infilled by silt, there
presence suggests increasing marine influence as you move up section (Wightman,
Pemberton and Singh, 1987). Skolithos are generally found within clean sandstone,
whereas, the Planolites feeding and grazing traces (Pemberton et al., 1992) are commonly
associated with detrital organic laminations suggesting lower energy conditions.
Marine influence is not only evident from the lined Skolithos trace fossils, but also
the presence of physical sedimentary structures such as; tidal bundles and cross-bedded
current ripples. Current ripples observed in lithofacies F portray foresets lined by dark
silty mud drapes indicating slack water deposition and rounded lee surfaces indicating a
subordinate current stage (tidal influence) resulting in reactivation (Plate 7and 9). These
structures are diagnostic of tidal flow responses found in ancient estuary deposits
(Dalrymple, 1992). Silt rip-up clasts and wavy bedding surfaces at the base of the
lithofacies also provide evidence of channel deposits, which, grade upwards into more
horizontal planar or parallel bedding structures suggesting a decrease in current velocities

Chapter 5 - Discussion 69
(Reineck and Singh, 1980). This is typically observed in the transition from incision to
transgressive estuarine deposition (Reinson, 1992).
A 9cm section (possibly thicker, but difficult to discern due to a core break) of
lenticular bedding is also observed within this lithofacies. According to Dalrymple (1992)
and Reineck and Singh (1980), lenticular bedding is commonly associated with mud flats
of tidally influenced systems. This may also be demonstrating a local meander of the
tidally-influenced channel resulting in channel abandonment and formation of mud plugs
(Leckie and Singh 1991). Minor sand drapes found within the lenticular bedding are most
likely emplaced by washover induced by high energy storm surges.
Reineck and Singh, 1980, suggest that abundant organic matter is typically found
within the basinal or lagoonal area of an estuary, however they also suggest the
associated lithotype would be shale, which, does not comply with the fine-grained
sandstone observed in this lithofacies. Abundant parallel laminations of organic detrital
material are observed throughout this lithofacies suggesting rapid sedimentation rates,
compatible with channel deposition within an estuarine environment. The organic matter
is mostly concentrated within the middle of this lithofacies and demonstrates cyclic
patterns of abundant organic laminae grading into clean sandstone.
Sulphide precipitation with surrounding reaction halos closely associated with the
organic material is also observed. The abundance of sulphides furthermore indicates
deposition within a chemically reducing environment also known to be a subaqueous
environment associated with estuarine deposits (Berner et al, 1985).

Chapter 5 - Discussion 70
5.1.2 Lithofacies E
The rubbly nature of the core limits interpretation of lithofacies E. The basal
contact of lithofacies E is sharp and characterized by a diagenetic siderite concretion
approximately 7cm thick; observed in similar studies of the foreland basin succession
lithofacies by Leckie and Singh (1993). The paleotopography of the underlying Devonian
carbonates demonstrates a highly irregular surface formed over millions of years of
exposure and erosion. Exposure of the Kindersley and Wainwright topographical highs
(see Figs. 2.3 and 2.4) during the Early Cretaceous may have provided a source of
carbonate for percolating meteoric water. This carbonate-rich meteoric water could
contribute to the formation of diagenetic carbonate-rich concretions such as the siderite
concretions described above. The underlying sandstone shows a fining upward sequence
approximately 10cm thick to basal contact of lithofacies E. An approximately 1.2m
section (possibly thicker, but difficult to tell due to core break) of organic-rich shale is
observed within this lithofacies.
This lithofacies is interpreted as a tidal flat or possibly a mud plug deposit
associated with a tidally-influenced channel bar complex within an estuarine environment
similar to those described by Leckie and Singh (1991). This interpretation is based on
stratigraphical association with the underlying lithofacies and the presence of sand drapes
throughout the lithofacies suggesting a section of lenticular bedding, similar to the thin
unit of lenticular bedding described above. As stated, lenticular bedding is can be
associated with mud flats found in the upper regions (landward) of the intertidal zone of
tidally influenced systems. This may also related to a local meander of the tidally-
Chapter 5 - Discussion 71
influenced channel resulting in channel abandonment and formation of mud plugs
(Leckie and Singh, 1991). Other studies with similar observations of lithofacies
association such as Buatois et al, (1999) and Pattison (1992) suggest that parallel
laminated organic-rich shale has been deposited within the central basin of an estuarine
system. Absence of rootlets suggests a subaqueous environment (also evident in mud
plugs) and rare sand lenses can be attributed to periodic floods from storm surges
increasing the basinward spread of fluvial sedimentation.
This lithofacies was sampled for organic petrological analyses and results show
that the organic particles are very abundant and coarse grained, suggesting proximity
between death and burial. This suggests the interpretation of a tidal flat or mud plug
within a channel bar complex disagreeing with Buatois’ (1999) and Pattison’s (1992)
depositional interpretations in regards to lithofacies E.
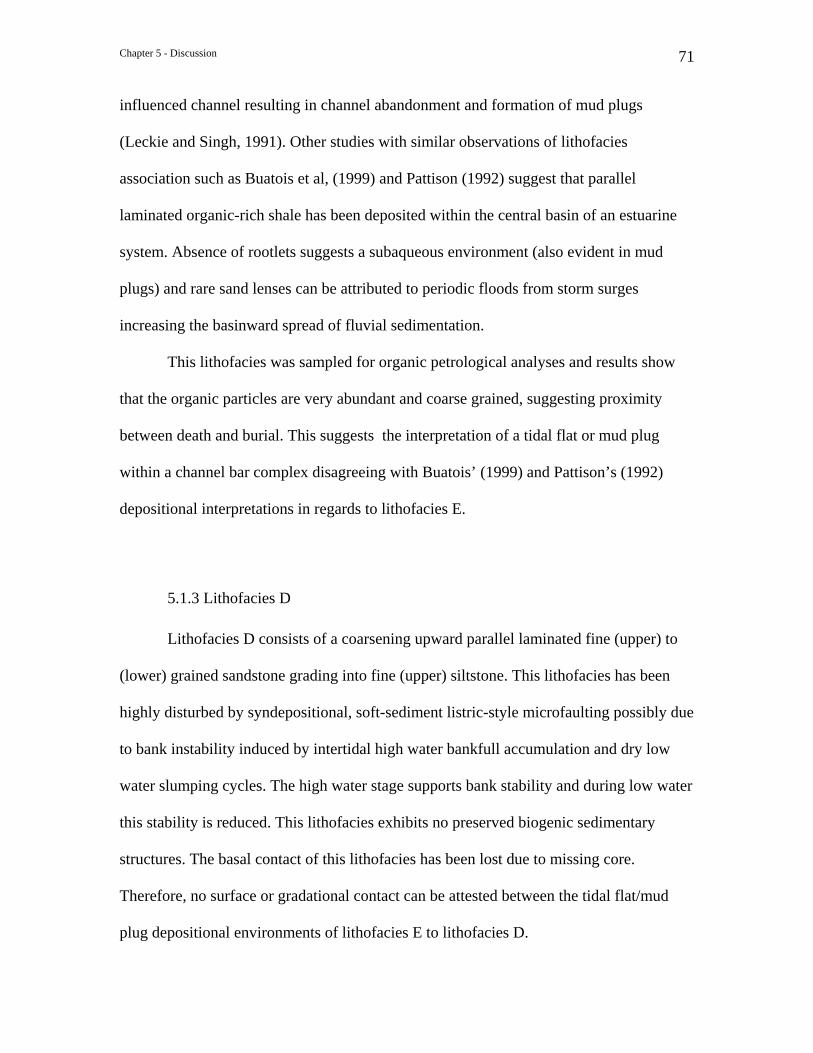
5.1.3 Lithofacies D
Lithofacies D consists of a coarsening upward parallel laminated fine (upper) to
(lower) grained sandstone grading into fine (upper) siltstone. This lithofacies has been
highly disturbed by syndepositional, soft-sediment listric-style microfaulting possibly due
to bank instability induced by intertidal high water bankfull accumulation and dry low
water slumping cycles. The high water stage supports bank stability and during low water
this stability is reduced. This lithofacies exhibits no preserved biogenic sedimentary
structures. The basal contact of this lithofacies has been lost due to missing core.
Therefore, no surface or gradational contact can be attested between the tidal flat/mud
plug depositional environments of lithofacies E to lithofacies D.

Chapter 5 - Discussion 72
According to Reineck and Singh (1980), evenly laminated sand and horizontal
bedding is abundantly distributed on beaches and coastal environments exposed to wave
action. This suggests that this lithofacies was deposited in a low energy shoreface
environment near the mouth of the estuary, susceptible to wave action (Leckie and Singh,
1991). Swash and backwash wave movements can rework the sediments obliterating any
evidence of biogenic structures (Reinick and Singh, 1980). This is an energy stress
suppressing organic activity (Wach, pers. Comm.). This interpretation corresponds to the
transgressive depositional model of sandy estuarine bay-fill constructed from a cored
interval of the Lower Albian Viking Formation in south-central Alberta produced by
Pemberton et al. (1992). It also agrees with the depositional model proposed by Leckie
and Singh (1991) concerning the transgressive estuarine environment of the Lower
Albian Paddy Member of the Peace River Formation.
The coarsening upward sequence observed within this lithofacies suggests a
transition from basinward stepping aggradation to landward stepping aggradation
marking a maximum flooding surface deposited within a highstands systems tract
followed by regional regression (Vail et al, 1977)
5.1.4 Lithofacies C
Lithofacies C consists of unconsolidated poorly sorted granule to cobble
conglomerate resulting in substantial core loss. The basal contact exhibits flame
structures, diagnostic features of an erosional surface. The sequence stratigraphic
relationship between lithofacies D and lithofacies C is indicative of regional regression
followed by channel incision demonstrating a lowstands incised valley surface, also
termed a transgressive sequence boundary (Leckie and Singh, 1991). This surface

Chapter 5 - Discussion 73
represents a recommencing period of estuarine bay-fill deposits within the paleovalley.
According to Reinson, (1992), estuary valley fill deposits usually consist of several
successions due to the fact that they occupy the same valley through multiple sea level
fluctuations.
This surface could also be interpreted as a transgressive lag resulting in a
ravinement surface. Reinson (1992) defines a ravinement surface is defined as a bounding
unconformity that must be identified in order to apply concepts of sequence stratigraphy
to estuarine environments. Ravinement surfaces are indicative of continuous
transgression resulting in overlying offshore open marine deposits. However, this is not
the case in the overlying lithofacies within this succession.
5.1.5 Lithofacies A and B
Due to the similar nature and stratigraphic relationships shared between
lithofacies A and B, they have been combined in the following section. Lithofacies A and
B consist of a fining upward sequence with multiple beds including imbricated granule-
sized silt rip-up clasts. This unit is interpreted as inner estuary channel fill deposited in a
high energy flow regime. The base of this unit has been lost to missing core, therefore,
the nature of the contacts from the conglomerate of lithofacies C described above can
only be assumed.
Abundant imbricated rip-up clasts interpreted as lag deposits of active channels
(Leckie and Singh, 1991) and scoured irregular surfaces towards the base of the unit
indicate very high energy flow velocities eliminating the preservation of biogenic
structures. The high current energy remains consistent moving up through the unit with

Chapter 5 - Discussion 74
parallel bedding structures with elongated silt rip-up clasts (3cm in diameter). Reinick
and Singh (1980) describe channel deposits as having basal conglomerates and Prothero
and Shwabb (1996) indicate that following the lag deposits (basal conglomerates),
continuous high energy flow regimes may demonstrate parallel laminations, which are
both observed within this unit. Discontinuous siderite concretions (2-3 cm diameter) are
also observed along bedding planes, which are consistent with estuarine channel fill
deposits (Reinson et al., 1988).
This unit resembles the basal contact of the Cummings Formation observed in the
lower cored interval of well 3B and appears to be the foundation of a typical transgressive
estuarine depositional model (Leckie and Singh, 1991) and (Reinson et al., 1988).
Figure 5.3 is a summary of the lithologic, depositional environment and sequence
stratigraphic relationships of the Cummings Formation within well 3B. The base of the
Cummings Formation is defined by a fining upward pebble conglomerate (918.5m)
marking channel incision during a lowstand systems tract. The erosional basal contact of
the Cumming Formation can also be interpreted as a sequence boundary. Channel
incision is followed by deposition of approximately ten metres of medium-grained
sandstone (lithofacies F). This lithofacies is interpreted as a channel bar complex infilling
the inner estuarine valley, deposited during a transgressive systems tract. Lithofacies E, is
interpreted to have been deposited during channel abandonment such as tidal flat or mud
plug environments. Dark, organic-rich siltstone with interlaminated sand drapes found
within this lithofacies is indicative of the tidal flat or mud plug depositional models (see
section 5.1.2). The parallel laminated very fine-grained sandstone of

Chapter 5 - Discussion 75
Figure 5.3 – Summary of interpretations as related to depositional environment and sequence stratigraphic
relationships of the Cummings Formation (after Leckie and Singh, 1991).

Chapter 5 - Discussion 76
lithofacies D suggests deposition during a highstand systems tract (see section 5.1.3) and
is interpreted as a near estuary mouth sand deposit. This lithofacies also marks the
transition from a transgressive systems tract to highstand systems tract (maximum
flooding surface) and the end of the transgressive estuarine cycle. A poorly sorted pebble
to cobble conglomerate, deposited in a lowstand systems tract within lithofacies C,
represents an erosional sequence boundary similar to the base of the Cummings
Formation previously described. This channel incision demonstrates renewal of the
transgressive estuarine cycle. The overlying lithofacies A and B are interpreted to have
been deposited under similar conditions as lithofacies F, a transgressive inner estuarine
valley fill.
5.2 Provenance of the Cummings Formation
In order to determine the provenance of the Cummings Formation, textural and
compositional mineralogical interpretations of the thin section mineralogy and XRD
(sections 4.2 and 4.3) have been made. The source rock(s) of the Cummings Formation
can not be broken down to specific formations with certainty due to the complexity
produced by diverse ancient outcrop exposure, paleodrainage divides, the possibility of
recycled grains, and diagenetic processes resulting in mineral alteration. Therefore, the
analytical methods used for mineralogy will be used to provide evidence of either a
western provenance, namely the Cordillera and the Rocky Mountain Fold Belt, or an
eastern provenance derived from the Canadian Shield.
Previous work done by Williams (1963) concludes that sandstones located at the
base of the Mannville Group, the Ellerslie Member (central Alberta), which is analogous
Chapter 5 - Discussion 77
to the Dina Formation, exhibit clastic sediments and metasediments derived from the
Precambrian Shield. This holds true with the conclusive statements provided by Kidston
(2003) come to the same conclusion regarding the provenance of the Dina Formation.
Williams (1963) also demonstrated that during the deposition of the Clearwater Fm.
(Athabasca area), which is stratigraphically equivalent to the Cummings Formation, an
abundance of detrital rock fragments and feldspars began to appear, suggesting an
increase in westerly Cordilleran derived sediments. These conclusions were drawn from
textural and compositional data compiled from core sample analyses. Williams (1963)
found that quartz grains derived from the Cordillera are not as texturally mature as the
sediments derived from the Shield. This means that mature quartz grains from the Shield
have been recycled through multiple generations of lithologies and lithofacies and display
rounded grain boundaries. Compositionally mature simply implies a high proportion
(>90%) of quartz due to its resistant nature. The conclusions presented by Williams
(1963) have also been supported by Hopkins (1981) in this study of the Lower Mannville
of Central Alberta.
More recent work concerning provenance within the WCSB has been presented
by Hyde and Leckie (1994). Their study corresponds to the Upper Albian Paddy Member
of the Peace River Formation. This study is located proximal to the western border of
Alberta (Peace River Area) and therefore a Cordilleran provenance can be interpreted
rather easily from texturally immature sandstones. The purpose was to deduce specific
formations as a source for the Paddy Member. It is important to note that Hyde and
Leckie (1994) observed detrital chert fragments containing circular dark spots interpreted
as microfossils. Some grains include radiating spine-like appendages suggesting the

Chapter 5 - Discussion 78
preservation of radiolarians. Important conclusions from Hyde and Leckie (1994)
relevant to the provenance of the Cummings Formation include: 1. the presence of
metamorphic and plutonic rock fragments; 2. drainage networks providing sediment
influx to the foreland basin were able to weather metamorphic rocks from the Omineca
Belt west of the Front and Main ranges in northern British Columbia. Their Findings
support suggestions by Stott (1968) that Cretaceous rocks of the foreland basin
succession were derived from a westerly source (Rocky Mountains) and crystalline rocks
from central British Columbia (Hyde and Leckie, 1994).
Abundant detrital chert fragments (many including radiolarian structures
described above), volcanic and metamorphic lithic fragments and angular to subangular
quartz grains make up the majority of sandstones within the Cummings Formation (Figs.
4.3, 4.4, and 4.5). Each of which are diagnostic of a westerly Cordilleran source
(Williams, 1963; Hopkins, 1981; Hyde and Leckie, 1994). Observed sandstones are
compositionally mature (see spectral plots, Fig. 4.6), however the angularity of the quartz
grains suggest that the sandstones within the Cummings Formation are texturally
immature, also supporting a Cordilleran provenance. According to Williams (1963) and
Cant and Abrahamson (1996) the paleotopography of the basal unconformity produced
drainage networks that were the primary control on valley fill sediments throughout the
early Cretaceous (Figs. 2.6 and 2.7). Based on the mineralogy studied within the
Cummings Formation, it can be concluded that the main source of sediment supply to the
study area from these drainage networks would have been derived from the Cordillera
and rising Rocky Mountain Thrust and Fold belt. It is unclear, however, if the
surrounding topographical highs such as Wainwright and Kindersley, surrounding the

Chapter 5 - Discussion 79
study area (Figs. 2.4 and 2.3) would have generated significant sediment input. These
topographical highs comprise Devonian to Jurassic quartz-rich clastics and carbonates
(Smith, 1984), therefore it is likely that some sediment was derived from these areas.
Based on the results obtained by Kidston (2003) concerning the source of the
Dina Formation, coupled with the results presented in this study concerning the overlying
Cummings Formation, it is apparent that provenance follows findings made by Williams
(1963) and Hopkins (1981). The provenance of the Lower Mannville Group is initially
easterly derived, progressively shifting to the west from the Aptian to Early Albian in part
influenced by the marine transgression from the northwest and by the rising Cordillera.
5.3 Source rock potential and thermal maturity of organic matter and reservoir compartmentalization
The Cummings Formation., Ostracode zone and underlying Dina Formation
within the study area of this thesis are located within the Provost Oil Field, of which the
Dina Formation is the main hydrocarbon producing unit (Hayes et al, 1994). According to
Riediger et al (1999), the source rocks generating hydrocarbons trapped within the Dina’s
channel sands (Kidston, 2003) consist of the Devonian/Mississippian Exshaw Formation
and the Early Cretaceous Ostracode zone to the southwest. The Cummings Formation
exhibits no oil staining within core 3B; therefore, reservoir compartmentalization
between the Dina and Cummings Formations can be inferred. This most likely occurs due
to the lithologically-dependant distribution of hydrocarbons within the Dina Formation

Chapter 5 - Discussion 80
(Kidston, 2003) and possibly due to the pervasive silicification resulting in low porosity
within the Cummings Formation.
This section provides a brief discussion concerning the secondary source rock
potential of the Cummings Formation within the Mannville Group and the Provost Oil
Field. Source rock potential and thermal maturity of the Cummings Formation was
determined by analyses of the organic matter through vitrinite reflectance (V %Ro) and
rock evaluation. The rock evaluation results are presented in Appendix D and a
hydrocarbon generation model (from Snowdon and Powell, 1984) based upon proportions
of maceral compositions, source (marine vs. terrestrial) and V %Ro is presented in Figure
5.4.
The source of organic matter of the Cummings Formation has been determined to
be terrestrial with an abundance of vitrinite and inertinite (semifusinite) with lesser (~2 to
10%) amounts of liptinites (resinite). According to Snowdon and Powell’s (1984)
hydrocarbon generation model, the organic matter found within the Cummings Formation
would constitute a potential gas producing type III kerogen. Mean V %Ro values (see
Table 3) obtained from two samples within the upper core of well 3B exhibit immature
results. The total organic carbon (TOC) obtained from rock evaluation analyses shows
poor to fair results with pyrolysis chemical parameters T(max) and P.I. (production
index) values also found in the immature range (only slightly – hydrocarbon generation
begins at T(max) 435°C and obtained T(max) range is 415 - 428°C).

Chapter 5 - D
iscussion 81
Figure 5.4 – Hydrocarbon generation model (from Snowdon and Powell)

Chapter 5 - Discussion 82
Results presented above demonstrate that the Cummings Formation does not
posses the thermal conditions required for hydrocarbon production and is therefore,
immature. The TOC within this formation is only marginal and should not be considered
as a secondary source rock for overlying formations. Lateral variations and channel
margins, stratigraphically equivalent to the Cummings Formation estuary deposits
observed in the upper core of well 3B, may generate a higher rank in source rock
potential due to the increased concentrations of biological productivity and burial in flood
plain or tidal flat (swamp) environments. The presence of ankerite cement, only
chemically stable up to approximately 1 km in depth (Dr. Yawooz Kettaneh pers. comm),
and consistent V% Ro populations suggest that the Cummings Formation has not been
considerably uplifted and therefore would not have previously cooked in situ organic
matter and generated hydrocarbons.

83
CHAPTER 6 – CONCLUSIONS
6.1 Conclusions 1) The Cummings Formation was deposited within at least two cycles of a transgressive
estuarine environment. Lithofacies exhibit a transition from channel incision and
channel bar complexes to channel abandonment and shoreface deposits followed by
regression marked by a second incised channel deposit. The second incised channel
deposit indicates a recommencing of the transgressive estuarine deposit.
2) Through mineralogical analyses, it has been determined that the Cummings
Formation has a westerly provenance. This can be attributed to a rising Cordillera and
Rocky Mountain Thrust and Fold Belt, paleodrainage networks resulting from
paleotopography of the Western Canadian Sedimentary Basin and marine incursions
from the north.
3) The organic matter within the Cummings Formation was derived from a terrestrial
source. Vitrinite reflectance and rock evaluation data indicate that the Cummings
Formation is thermally immature and does not posses sufficient total organic matter
to be considered a secondary source rock for overlying formations.
Previous work by Cant (1996) suggests that the Cummings Formation was deposited
as coastal sandstones during the transition from a highstand to a falling stand systems
tract. However, evidence from core 3B suggests an estuarine depositional model
deposited during a transgressive systems tract. Increased marine influence is observed
indicating a landward stepping depositional sequence, demonstrating the opposite affect
seen in either highstand or falling stand systems tracts. Lateral variation beyond channel
Chapter 6 - Conclusions 84
margins of the Cummings Formation in this study area may account for the differences
observed by Cant (1996).
Abundant detrital chert fragments, volcanic and metamorphic lithic fragments and
angular to subangular quartz grains within the Cummings are diagnostic of a westerly
Cordilleran source (Williams, 1963; Hopkins, 1981; Hyde, 1994). According to Williams
(1963) and Cant (1996) the paleotopography of the basal unconformity produced
drainage networks controlling valley fill sediments throughout the Early Cretaceous.
From the analyses completed in this thesis, it can be concluded that the main source of
sediment supply to the study area from these drainage networks would have been derived
from the Cordillera and rising Rocky Mountain Thrust and Fold belt. It is unclear,
however, if topographical highs such as Wainwright and Kindersley, surrounding the
study area would have generated significant sediment input. Results obtained by Kidston
(2003) concerning the source of the Dina Formation coupled with the results presented in
this study concerning the overlying Cummings Formation, provide provenance
relationships that follows findings by Williams (1963) and Hopkins (1981). The
provenance of the Lower Mannville Group is initially easterly derived progressively
shifting to the west from the Aptian to Early Albian in part influenced by the marine
transgression from the northwest and furthermore by the rising Cordillera.
6.2 Recommendations for further work.
Further work should be done in areas consisting of the Cummings Formation in
order to provide knowledge concerning the extent of the interpreted estuary deposits. This
thesis only interprets one cored interval, therefore providing only a limited data set. The

Chapter 6 - Conclusions 85
determination of paleo-channel margins and tidal flat deposits bordering the estuary
would be beneficial for locating possible source rock and reservoir rocks within east
central Alberta and western Saskatchewan. It would also be beneficial to correlate sea
fluctuations to confirm a depositional model of the entire sedimentary basin. This would
increase the understanding of the sequence stratigraphy of the basin and ultimately
further the hydrocarbon development within western Canada.
Mineralogical comparisons between the Cummings Formation and the
paleotopographical highlands (Kindersley and Wainwright) should be attempted in order
to determine the importance of these areas vs. the Cordillera and Rocky Mountain Fold
and Thrust Belts in regards to provenance.
The Western Canadian Sedimentary Basin is a highly studied area with numerous
drill holes accompanied by downhole geophysics. In order to provide a greater
understanding of the depositional environment and sequence stratigraphic relationships,
well log data from other areas including the Cummings Formation should be correlated to
the observations presented within this thesis.
86
References
Allen, J. L. R., 1980. Sand Waves; a model of origin and internal structure: Sedimentary Geology, vol. 26, p. 281-328.
Berner, R. A., De Leeuw, J. W., Spiro, B., Murchison, D. G., Eglinton, G. 1985. Sulphate Reduction, Organic Matter Decomposition and Pyrite Formation. Philosophical Transactions of the Royal Society of London. Series A, Mathematical and Physical Sciences, A 315, p. 25-38.
Bustin, R.M., A.R. Cameron, D.A. Grieve, and W.D. Kalkreuth, 1985, Coal petrology, its principles, methods, and applications: Geological Association of Canada, Short Course Notes, v. 3, Second revised edition, 230 p.
Buatois, L. A., Mangano, G., Carr, T. R., 1999. Sedimentology and Ichnology of Paleozoic Estuarine Reservoirs, Morrow Sandstone, Lower Pennsylvanian of Southwest Kansas, USA. Kansas Geological Survey, Current Research in Earth Sciences, Bulletin 243, part 1
Cant, D.J. and Abrahamson, B. 1996. Regional distribution and internal stratigraphy of the Lower Mannville. Bulletin of Canadian Petroleum Geology, vol. 44, no.3, p. 508-529 Christopher, V.J. 1984. Sedimentology and Hydrocarbon distribution of the Lower Cretaceous Cadomin Formation, Canadian Society of Petroleum Geologists, vol 10, p 175-187.
Dalrymple, R. W., 1992. Tidal Depositional Systems: In: Facies Models: Response to Sea Level Change, R.G. Walker & N. P. James (eds). Department of Geological Sciences, Queen’s University, Kingston, Ontario, p. 195-218
Dalrymple, R. W., Zaitlin, B. A., Boyd, R., 1992. Estuarine facies models; conceptual basis and stratigraphic implications. Journal of Sedimentary Research, vol. 62, no. 6, p. 1130-1146
Hayes, B. J. R., Christopher, J. E., Rosenthal, L., Los, G., McKercher, B., Minken, D., Tremblay, Y. M., Fennell, J. and Smith, D. G., 1994. Cretaceous Mannville Group of the Western Canada Sedimentary Basin. In: Geological Atlas of the Western Canada Sedimentary Basin, G. D. Mossop and I. Shetsen (comps.) Canadian Society of Petroleum Geologists and Alberta Research Council, p. 317-334.
Hopkins, J.C. 1981. Sedimentology of quartzose sandstones of the Lower Mannville and associated units, Medicine River area, central Alberta. Bulletin of Canadian Petroleum Geology, vol 29, no. 1, p. 12-41.

87
Hyde, R. S. and Leckie, D. A. 1994. Provenance of the Lower Cretaceous Paddy Member (Peace River Formation), northwestern Alberta, Bulletin of Canadian Petroleum Geology, vol 42, no. 4, p. 482-498.
Kidston, J., 2003, Depositional environment and provenance of the Dina Formation, Provost oil field, east central Alberta, and a discussion of hydrocarbon distribution within. Honours Thesis submitted to the department of Dalhousie Earth Science.
Jackson, P.C. 1984. Paleogeography of the Lower Cretaceous Mannville Group of Western Canada. In: Elmworth: Case Study of a Deep Basin Gas Field. A. J. Masters (ed.). American Association of Petroleum Geologists, p. 49-77.
Leckie, D. A. and Reinson, G.E. 1993. Effects of Middle to Late Albian sea-level fluctuations in the /cretaceous Interior Seaway, western Canada. In: Evolution of the Western Interior Basin, W. G. E. Caldwelland E. G. Kauffman (eds.). Geological Association of Canada, Special Paper 39, p. 151-175.
Leckie, D.A., Singh, C., 1991. Estuarine Deposits of the Albian Paddy Member (Peace River Formation) and the Lowermost Shaftesbury Formation, Alberta, Canada. Journal of Sedimentary Petrology, vol 61, no. 5, p. 825-849.
Monger, J. W. H., Price, R. A., 1979. Geodynamic Evolution of the Canadian Cordillera; progress and problems. Canadian Journal of Earth Sciences, vol 16, no. 3, p. 771-791.
Mossop, G. and Shetsen, I., 1994. Introduction to the Geological Atlas of the Western Canada Sedimentary Basin. In: Geological Atlas of the Western Canada Sedimentary Basin, G. D. Mossop and I. Shetsen (comps.). Canadian Society of Petroleum Geologists and Alberta Research Council, p. 1-11.
Nesse, W.D., 1991. Introduction to Optical Mineralogy, Second Edition. Oxford University Press, Inc.
Pattison, S. A. J., 1992, Recognition and interpretation of estuarine mudstones (central basin mudstones) in the tripartite valley fill deposits of the Viking Formation, central Alberta; in, Applications of Ichnology to Petroleum Exploration--A Core Workshop, S. G. Pemberton, ed.: Society of Economic Paleontologists and Mineralogists, Core Workshop 17, p. 223-249.

88
Pemberton, S. G., MacEarchern, J. A., and Frey, R. W., 1992 Trace Fossils Facies Models: Environmental and Allostratigraphic Significance: In: Facies Models: Response to Sea Level Change, R.G. Walker & N. P. James (eds). Geological Association of Canada, p. 47-73. Pemberton, S. G., and Wightman, D. M., 1992, Ichnological characteristics of brackish water deposits; In, Applications of Ichnology to Petroleum Exploration--A Core Workshop, S. G. Pemberton, (ed).: Society of Economic Paleontologists and Mineralogists, Core Workshop 17, p. 141-167.
Pemberton, S. G., Van Wagooner, J. C., Wach, G. D., 1992. Ichnofacies of a Wave-Dominated Shoreline. In: Applications of Ichnology to Petroleum Exploration. SEPM Core work shop, no. 17, p. 339-379.
Plink-Bjorklund, P., 2005. Stacked fluvial and tide-dominated estuarine deposits in high-frequency (fourth-order) sequences of the Eocene Central Basin, Spitsbergen. Sedimentology, vol 52, p.391
Potter, J., L.D. Stasiuk, and A.R. Cameron, 1998, A petrographic atlas of Canadian coal macerals and dispersed organic matter: Canadian Society for Coal Science and Organic Petrology, 105 p.
Poulton, T. P., 1984. The Jurassic of the Canadian Western Interior, from 49 degrees N latitude to the Beaufort Sea. Canadian Society of Petroleum Geologists. Stott, D. F., Glass, D. J. (eds). vol 9, p. 15-41.
Price, R. A., 1994. Cordilleran tectonics and the evolution of the Western Sedimentary Basin. In: Geological Atlas of the Western Canada Sedimentary Basin, G. D. Mossop & I. Shetsen (comps.). Canadian Society of Petroleum Geologists and the Alberta Research Council, p. 13-25.
Prothero, D. R. & Shwabb, F., 1996. Sedimentary Geology: An Introduction to Sedimentary Rocks and Stratigraphy. W. H. Freeman and Company.
Reineck, H. E. and Singh, I. B., 1980. Depositional Sedimentary Environments: Second Edition, Springer-Verlag.
Reinson, G. E., 1992. Transgressive Barrier Island and Estuarine Systems: In: Facies Models: Response to Sea Level Change, R.G. Walker and N. P. James (eds). Geological Survey of Canada, p. 179-194.
Reinson, G. E., Clark, J. E., Foscolos, A. E., 1988. Reservoir geology of the Crystal Viking Field, Lower Cretaceous estuarine tidal channel-bay complex, south-central Alberta: American Association of Petroleum Geologists Bulletin, vol. 72, no. 10, p. 1270-1294.
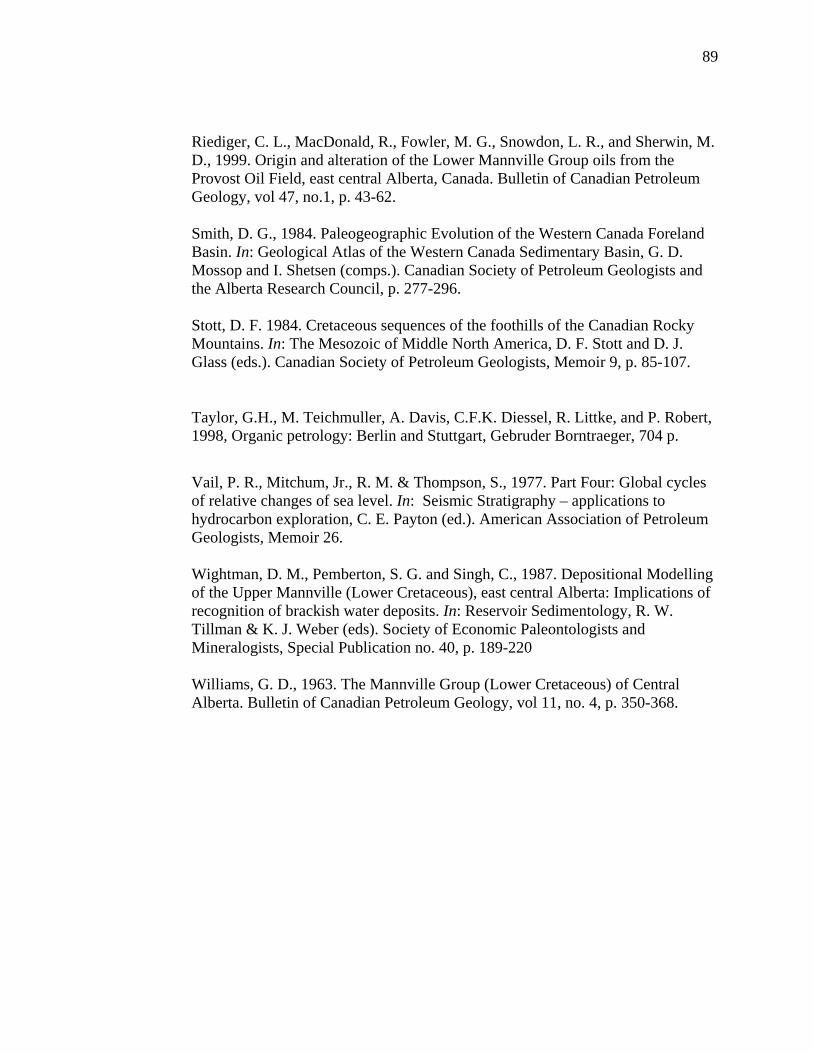
89
Riediger, C. L., MacDonald, R., Fowler, M. G., Snowdon, L. R., and Sherwin, M. D., 1999. Origin and alteration of the Lower Mannville Group oils from the Provost Oil Field, east central Alberta, Canada. Bulletin of Canadian Petroleum Geology, vol 47, no.1, p. 43-62.
Smith, D. G., 1984. Paleogeographic Evolution of the Western Canada Foreland Basin. In: Geological Atlas of the Western Canada Sedimentary Basin, G. D. Mossop and I. Shetsen (comps.). Canadian Society of Petroleum Geologists and the Alberta Research Council, p. 277-296.
Stott, D. F. 1984. Cretaceous sequences of the foothills of the Canadian Rocky Mountains. In: The Mesozoic of Middle North America, D. F. Stott and D. J. Glass (eds.). Canadian Society of Petroleum Geologists, Memoir 9, p. 85-107.
Taylor, G.H., M. Teichmuller, A. Davis, C.F.K. Diessel, R. Littke, and P. Robert, 1998, Organic petrology: Berlin and Stuttgart, Gebruder Borntraeger, 704 p.
Vail, P. R., Mitchum, Jr., R. M. & Thompson, S., 1977. Part Four: Global cycles of relative changes of sea level. In: Seismic Stratigraphy – applications to hydrocarbon exploration, C. E. Payton (ed.). American Association of Petroleum Geologists, Memoir 26.
Wightman, D. M., Pemberton, S. G. and Singh, C., 1987. Depositional Modelling of the Upper Mannville (Lower Cretaceous), east central Alberta: Implications of recognition of brackish water deposits. In: Reservoir Sedimentology, R. W. Tillman & K. J. Weber (eds). Society of Economic Paleontologists and Mineralogists, Special Publication no. 40, p. 189-220
Williams, G. D., 1963. The Mannville Group (Lower Cretaceous) of Central Alberta. Bulletin of Canadian Petroleum Geology, vol 11, no. 4, p. 350-368.
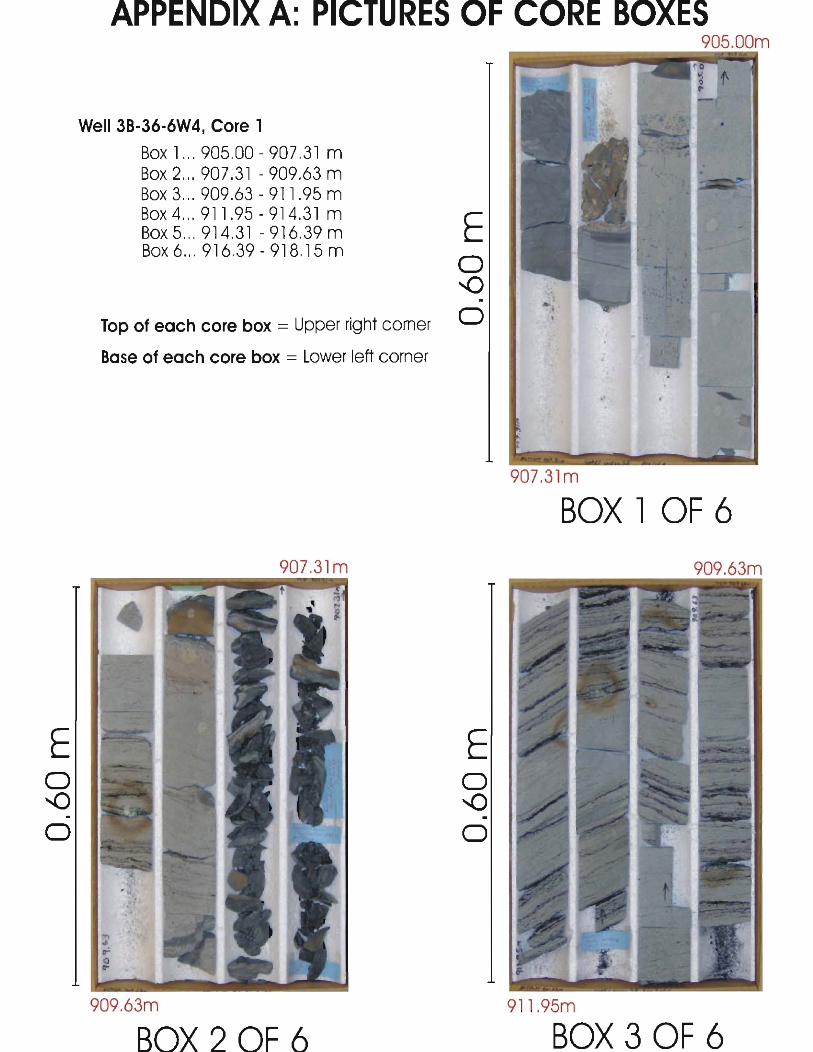
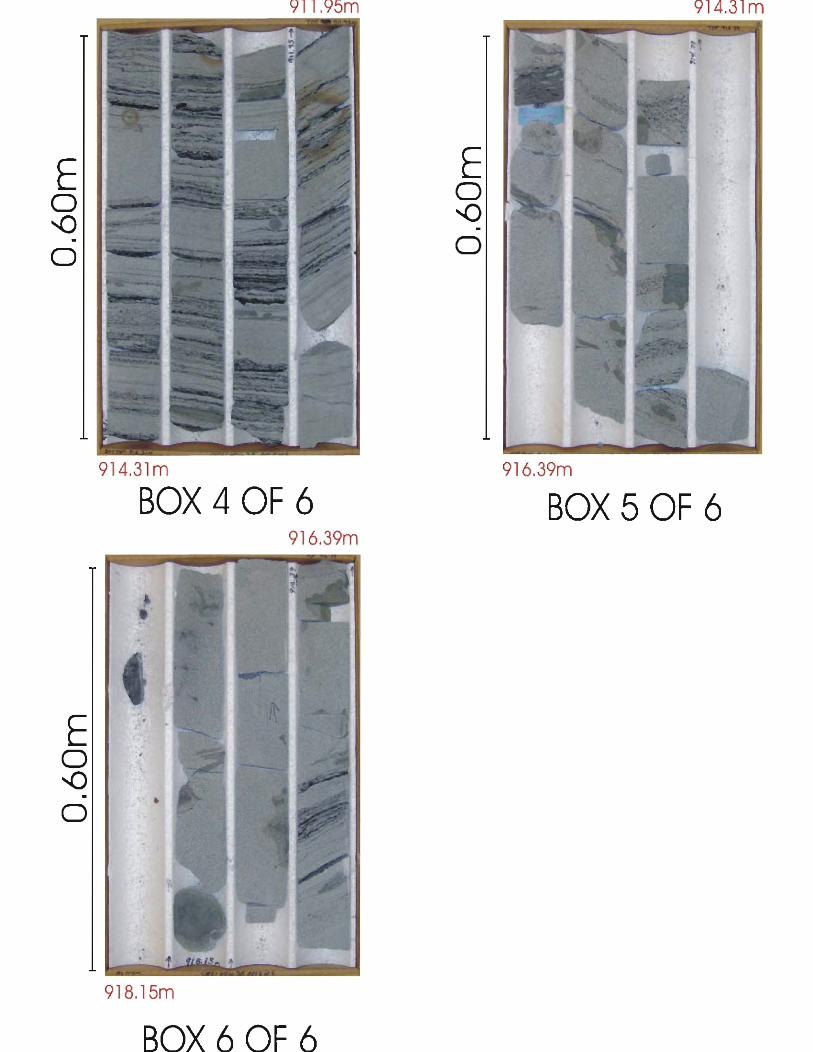


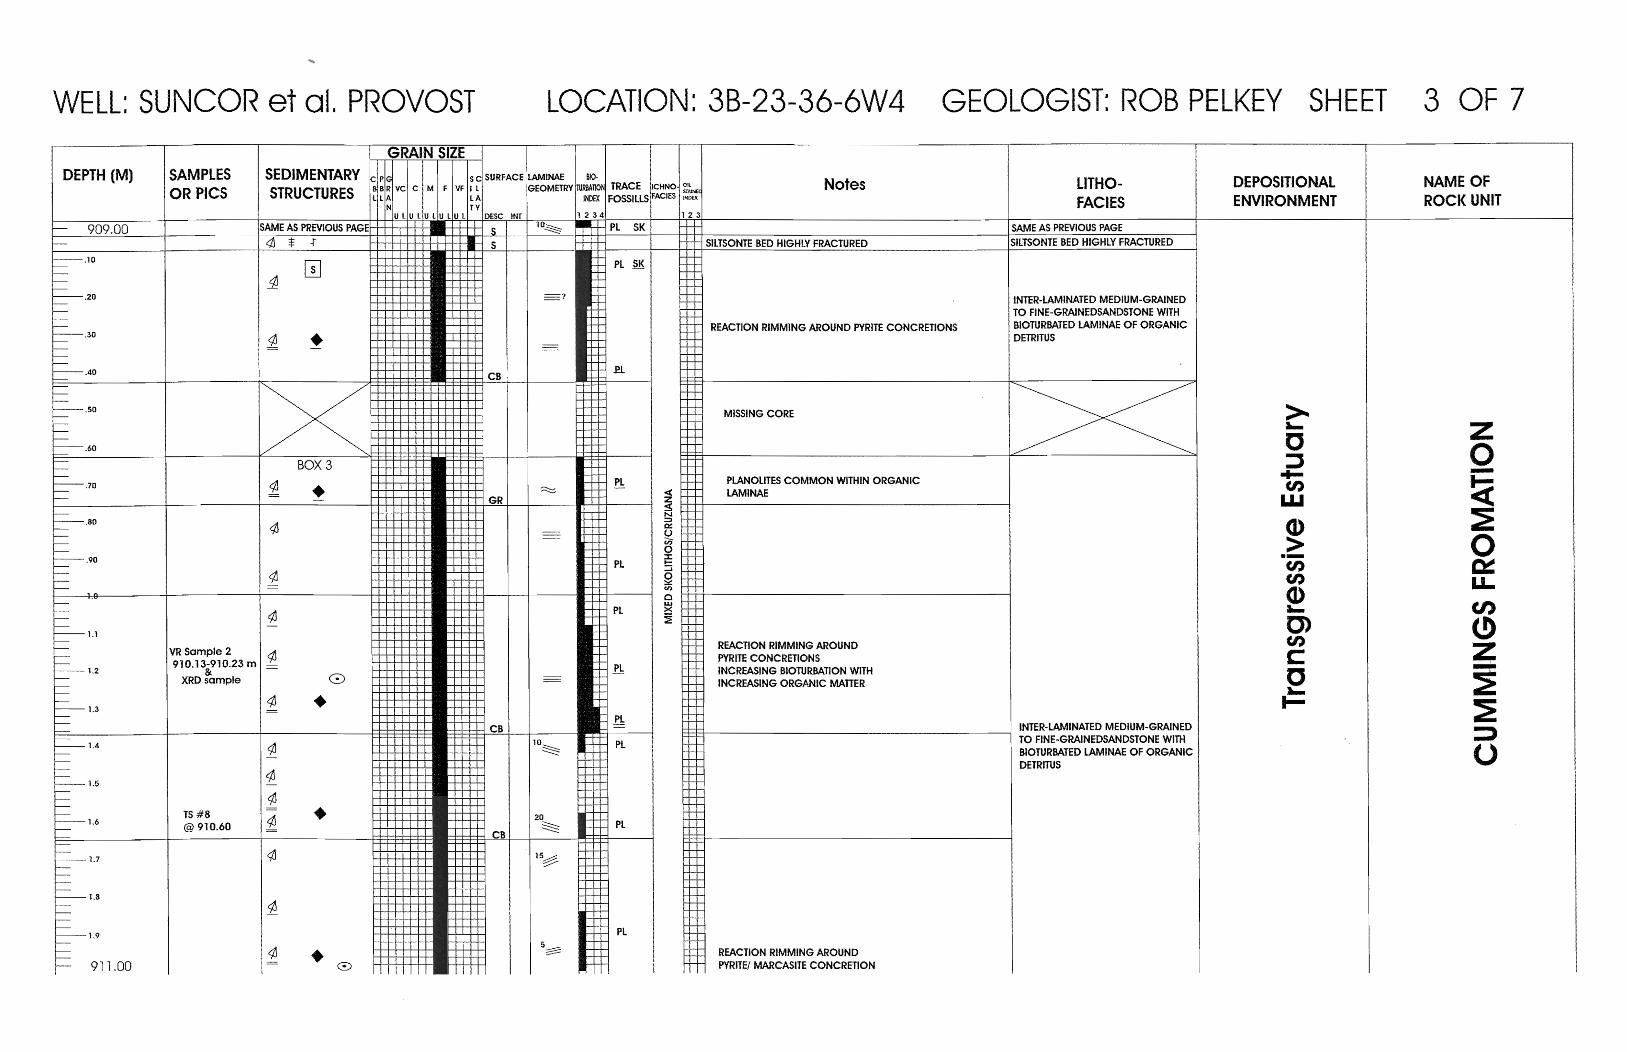
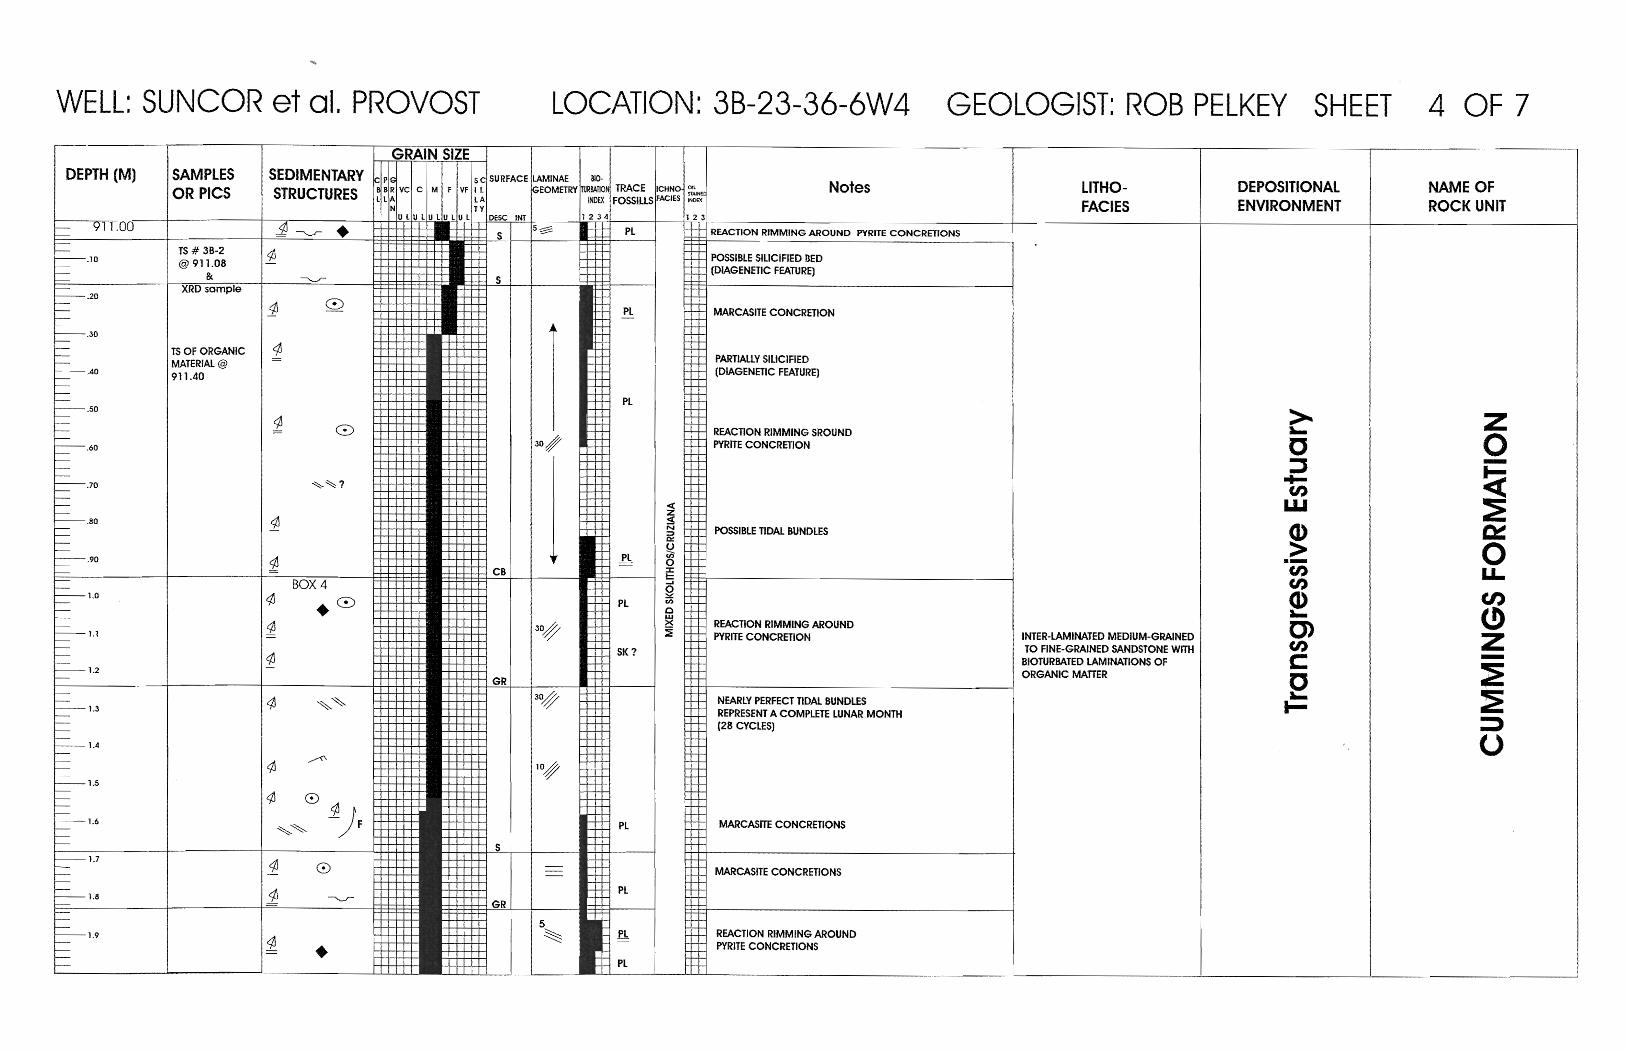

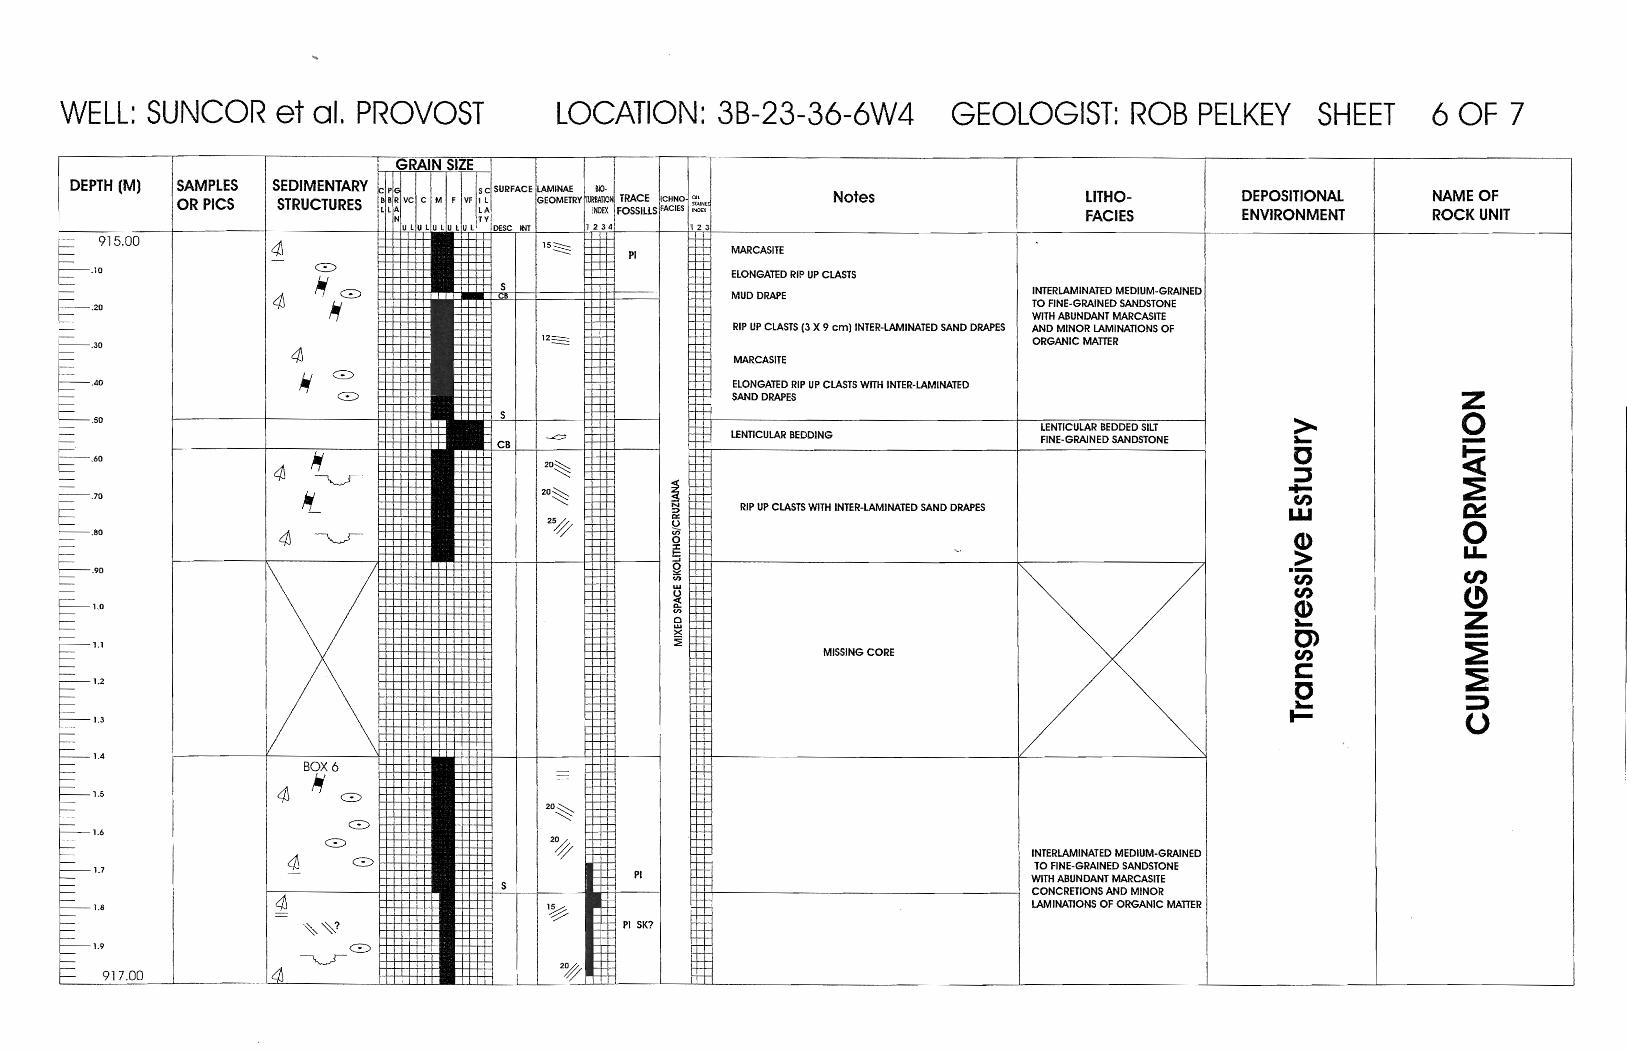
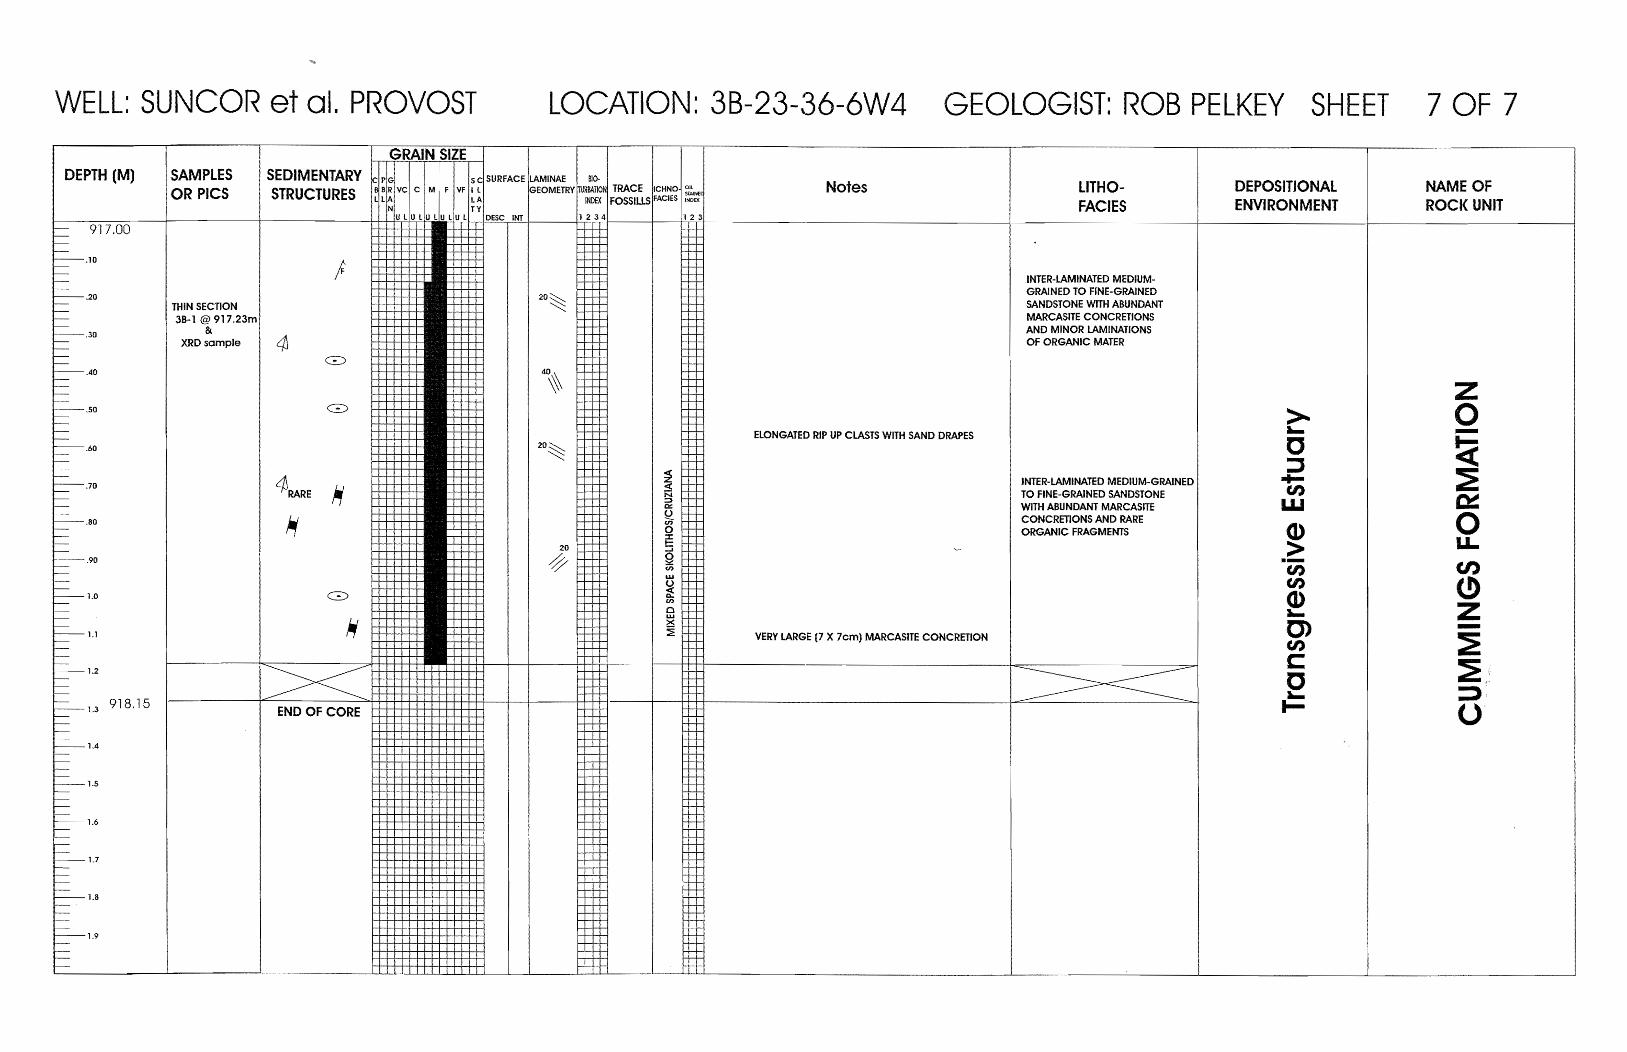
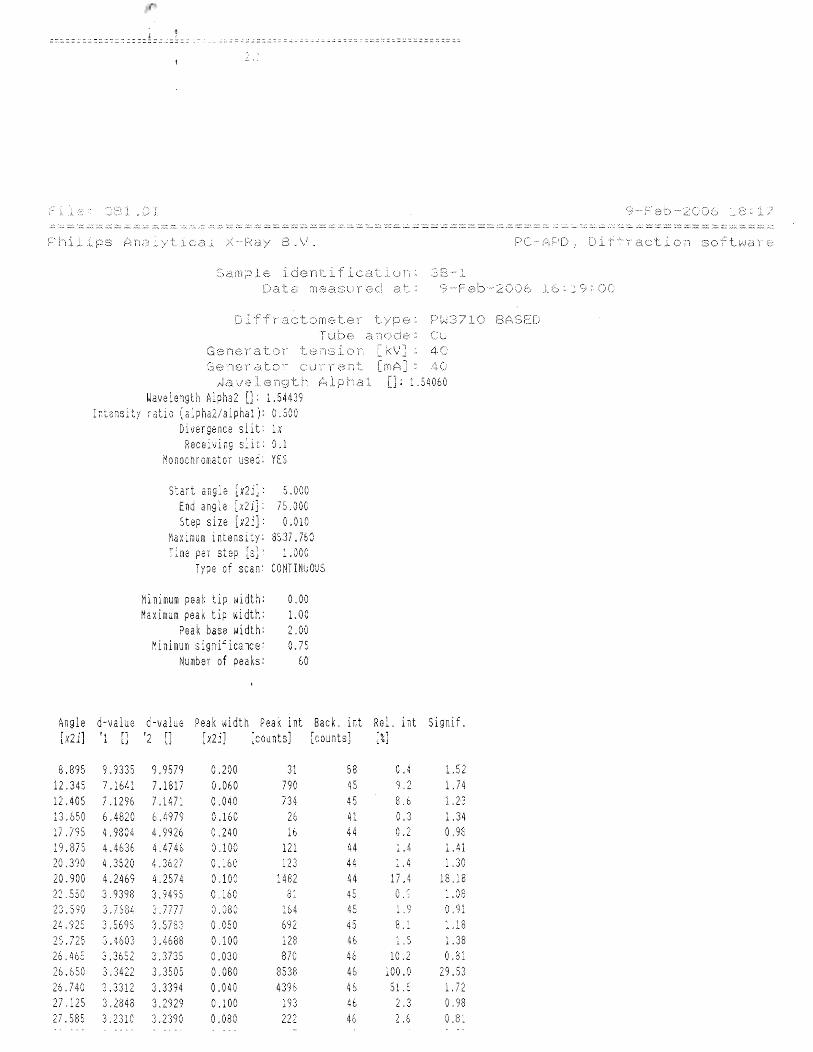

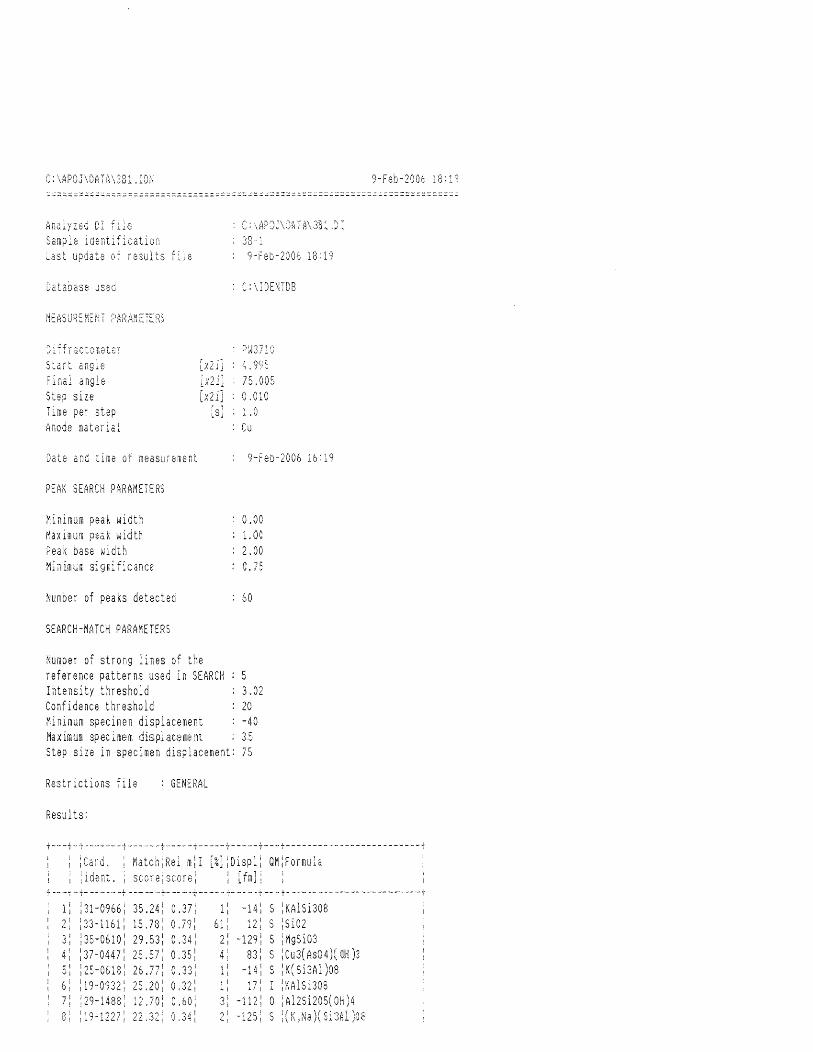

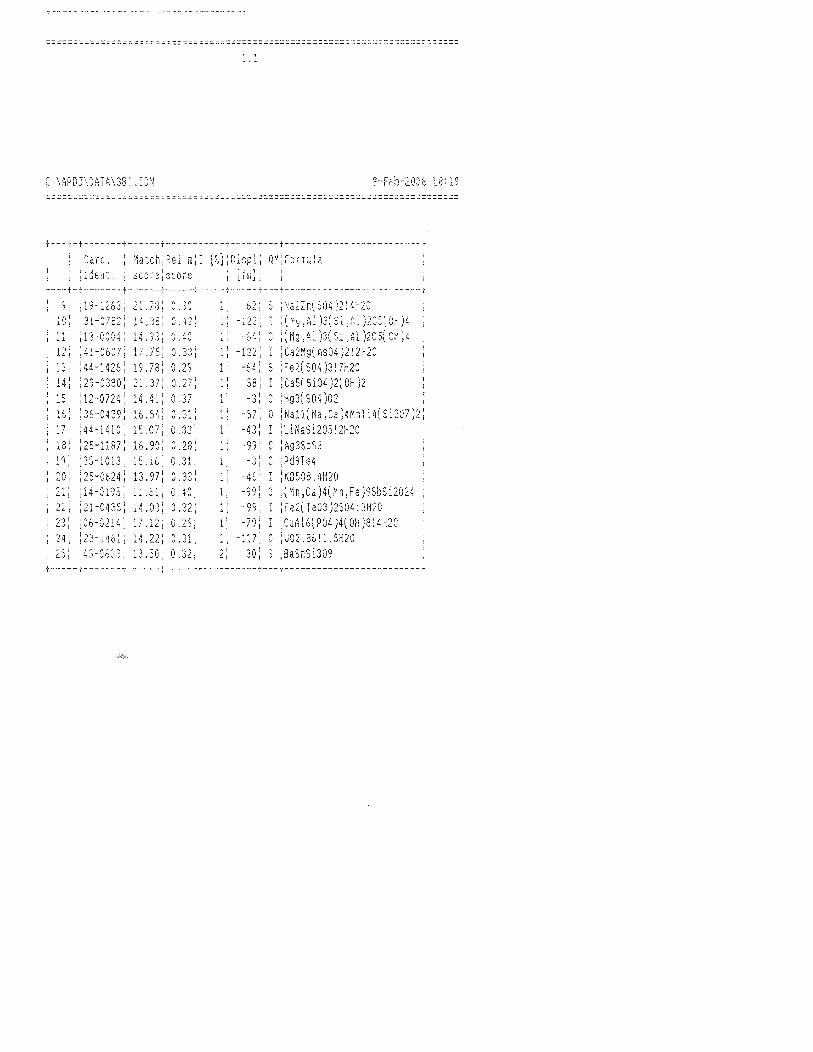


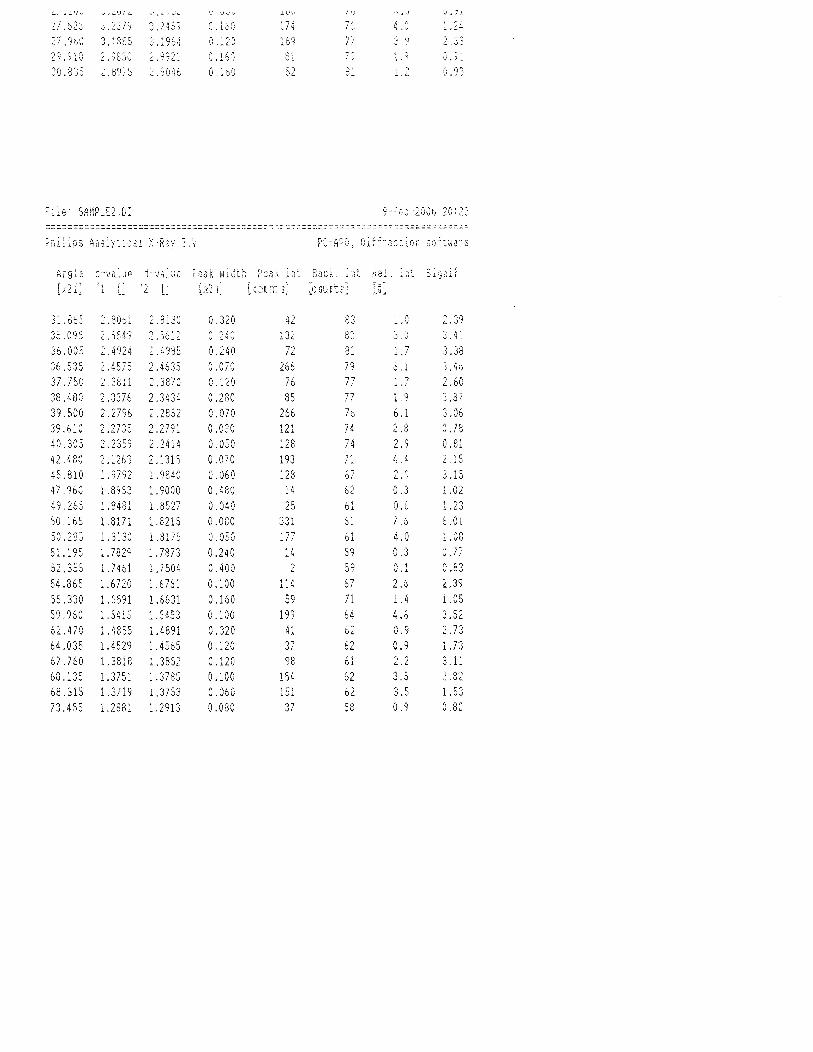


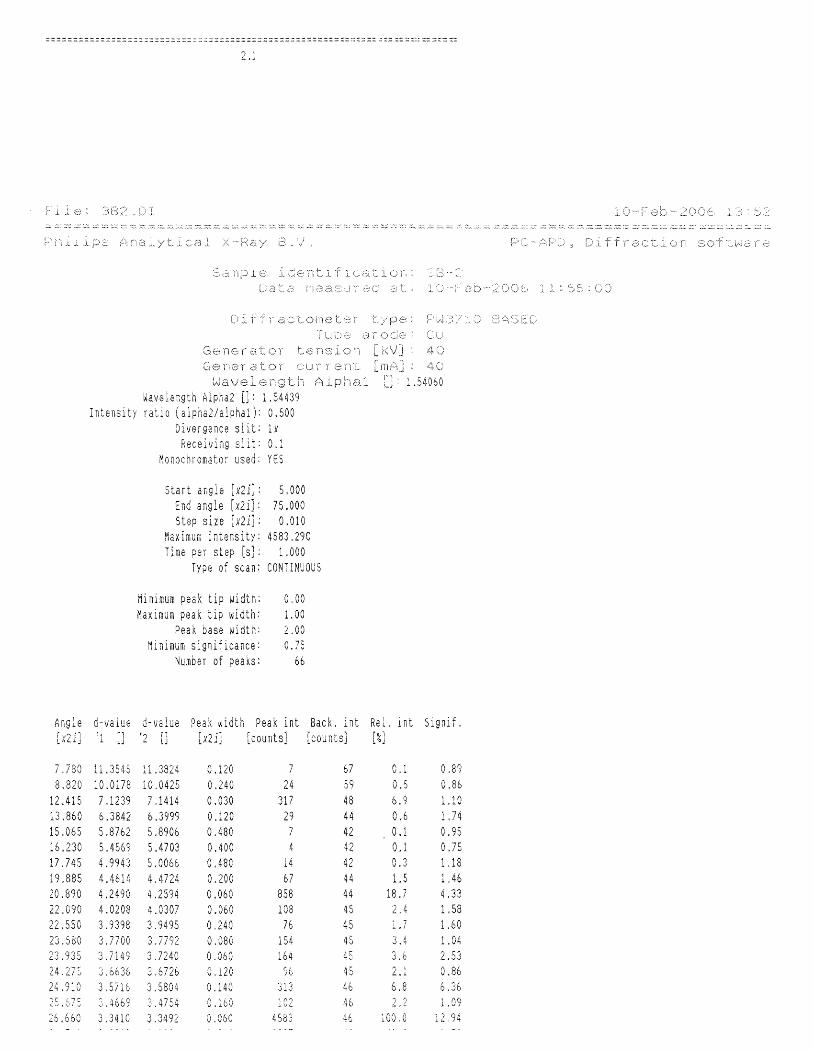


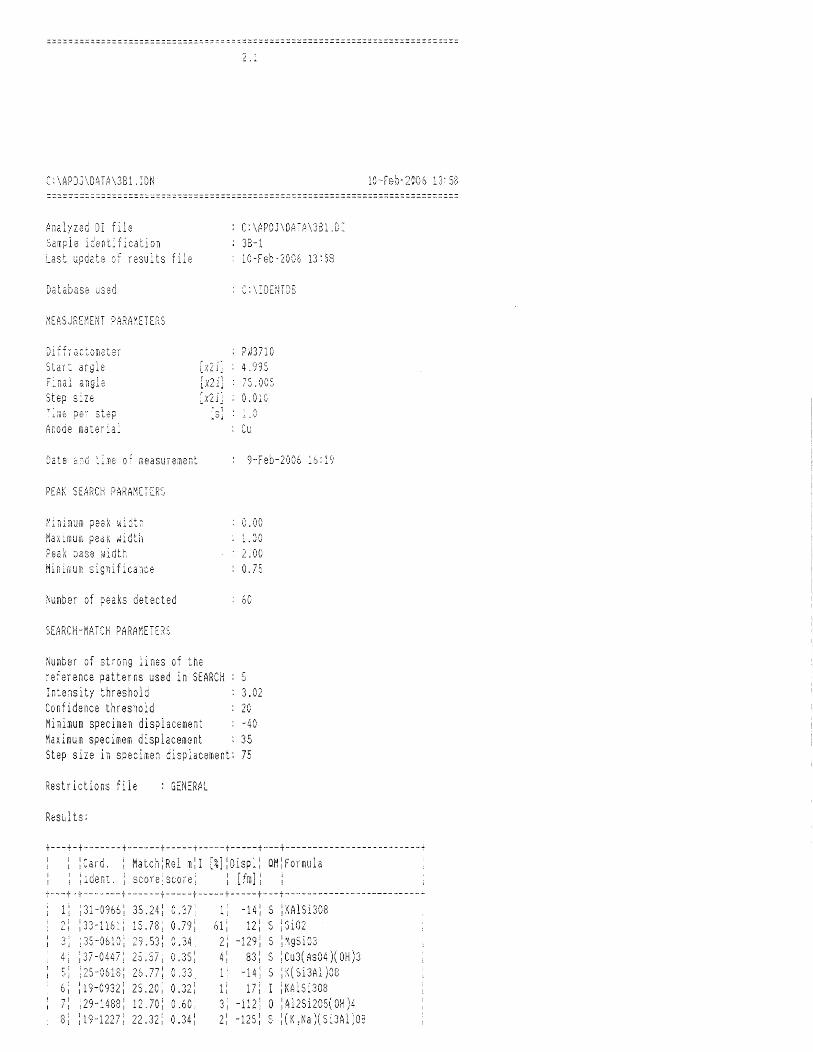


Appendix D – Rock Evaluation Data of the upper cored interval of well 3B
Sample Qty S1 S2 PI S3 Tmax Tpeak S3CO PC(%) TOC RC% HI OICO OI 9107 70.9 0.67 11.19 0.06 0.47 443 483 0.04 1.02 5.11 4.09 219 1 99107 70.3 0.71 11.69 0.06 0.59 443 483 0.12 1.06 5.11 4.05 229 2 12
Well 3B Provost
Field 907.58 70.5 0.69 12.18 0.05 3.99 428 468 2.28 1.34 8.46 7.12 144 27 47910.23 25.1 2.08 27.70 0.07 19.97 415 455 15.00 3.99 38.17 34.18 73 39 52
MINC% S4CO S4CO2 RCCO(%) S4CO2 S5aCO2 S5bCO2 KFID RCCO2(%)
4.3 20.5 117.6 0.880 0.0 0.0 0.0 1112 3.21 4.4 21.0 115.4 0.900 0.0 0.0 0.0 1112 3.15
0.4 46.2 188.4 1.980 0.0 0.0 0.0 1112 5.14 3.1 212.4 919.5 9.100 0.0 0.0 0.0 1112 25.08